trees, urban design &stormwater management
DESCRIPTION
Trees, Urban Design & Stormwater ManagementTRANSCRIPT

1
Trees, Urban Design & Stormwater Management
Presented by Ronald B. Sawhill
Asst. Professor, UGA School of Environmental Designfor the
Georgia Urban Forest Council
gallery.hd.org Northgeorgiawater.com
www.eo.ucar.edu
Pain Relief
www.missouricivilwarmuseum.org
Of what is stormwater a symptom?
www.utdallas.edu

Page 1 1. Title Slide
2. Stormwater is not the problem! 3. It is only a symptom of the real problem 4. If you focus treatment on symptoms, you may feel better… 5. But if you don’t deal with the root problem, in the end the disease will most certainly kill you. 6. The good news is… it is not a disease. The bad news is…
Page 2
7. It is a symptom of an addiction. 8. Some might propose that the root addiction is to the automobile, and
the argument certainly has some validity, but in fact, autos can be operated on a variety of surfaces.
9. With increasing human density, our society generates increasing
imperviousness. We also know that as imperviousness exceeds the 20% impervious threshold, significant environmental impacts multiply.
10. Based on the distribution of impervious surfaces shown here, our
addiction to imperviousness consistently includes 1/3 rooftops and 2/3 pavements.
11. Why do we like imperviousness so much??? At some level, it is
aesthetics… but not the primary level! It is reliable… reliability developed over our past century of road building. We’re comfortable with it; It is “business as usual” – we know what we’re going to get and most contractors do it reliably. It is relatively inexpensive for out-of-pocket costs… making paving large areas affordable -
12. They are hidden in the natural environment

2
it is a symptom ofan addiction
www.bbc.co.uk
We’re addicted to imperviousness
RB Sawhill
Total Impervious by Land Use
2-A
c. R
es.
1-A
c. R
es.
1/2-
Ac.
Res
.
1/3-
Ac.
Res
.
1/4-
Ac.
Res
.
1/8-
Ac.
Res
.
Indu
stria
l
Com
mer
cial
& B
usin
ess
Shop
ping
Cen
ters
0
10
20
30
40
50
60
70
80
90
100
% Im
perv
ious
(acr
e/ac
re)
Source: B.K. Ferguson
Distribution of Imperviousness by Land Use
Residential Multi-family Commercial
Roofs Streets Sidewalks Parking Roofs Streets Sidewalks Parking Roofs Streets Sidewalks Parking
10
20
30
40
50
60
Per
cent
of I
mpe
rvio
us A
rea
Source: B.K. Ferguson
Why do we like imperviousness so much?
$$$$$$It is reliable
We’re comfortable with it
pplant.sdstate.edu
It’s true costs are hidden
Brockert. “Parking lot #35” www.copleysociety.org
3
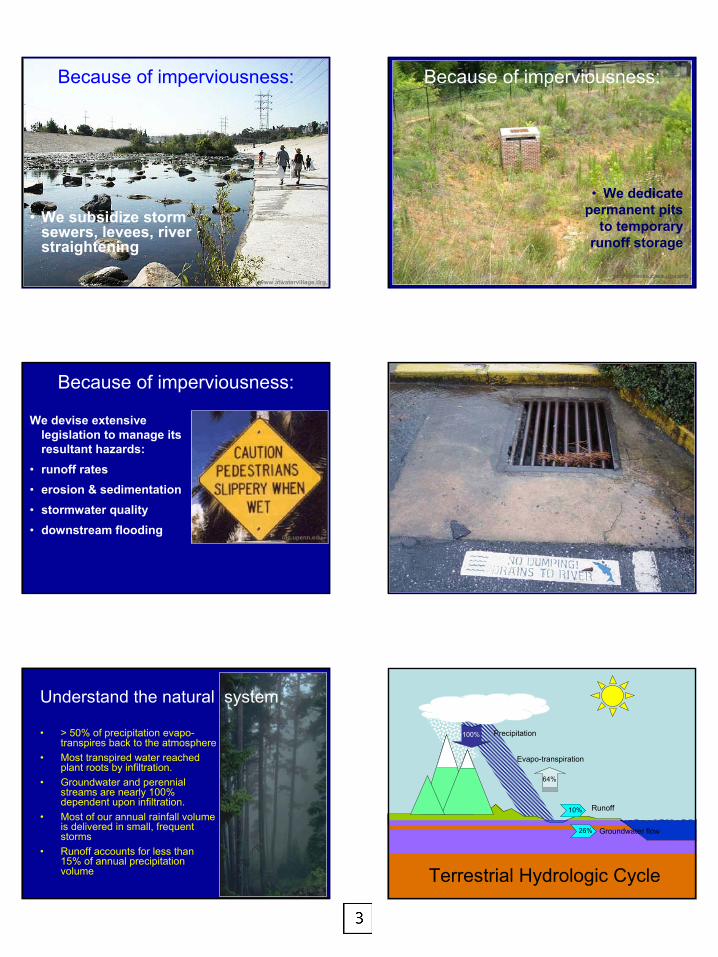
Because of imperviousness:
• We subsidize storm sewers, levees, river straightening
www.atwatervillage.org
• We dedicate permanent pits
to temporary runoff storage
Because of imperviousness:
georgiafaces.caes.uga.edu
Because of imperviousness:
We devise extensive legislation to manage its resultant hazards:
• runoff rates • erosion & sedimentation • stormwater quality• downstream flooding
ldc.upenn.edu
RB Sawhill
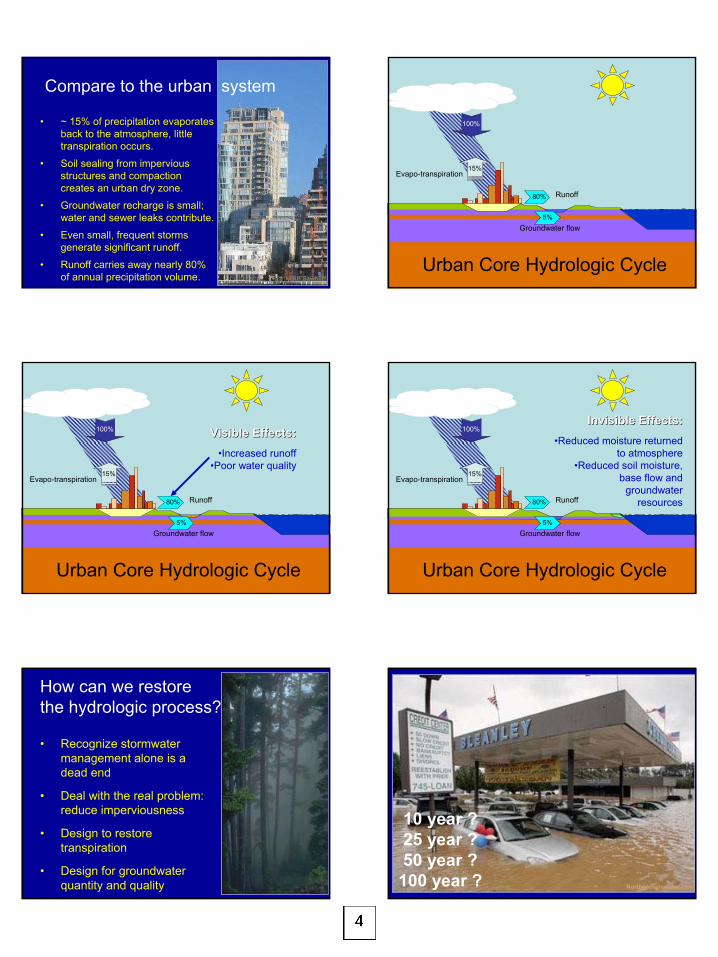
Understand the natural system
• > 50% of precipitation evapo-transpires back to the atmosphere
• Most transpired water reached plant roots by infiltration.
• Groundwater and perennial streams are nearly 100% dependent upon infiltration.
• Most of our annual rainfall volume is delivered in small, frequent storms
• Runoff accounts for less than 15% of annual precipitation volume Terrestrial Hydrologic Cycle
64%
100%
10%
26%
Evapo-transpiration
Runoff
Groundwater flow
Precipitation

Page 3
13. Some of these costs are hidden in subsidies and other construction costs. Storm sewer systems are expensive to construct and to maintain; they hide the true costs of imperviousness and shift it downstream. We have diked our riverside cities because river flows continue to increase due to upstream runoff.
14. True costs are hidden in land expenses. The value of land areas set
aside to deal with peak runoff rates and poor stormwater quality is staggering. Aesthetically they detract from our landscapes; they are visually wasted and abused spaces in landscapes increasingly lacking open space. Socially, these are dangerous spaces, and as such, they are fenced off “stormwater prisons” “detention centers” These typically serve only one purpose, and address only one part of the runoff problem
15. Like this sign, legislating to control stormwater never seems to come
off as well as it is intentioned. The permitting costs, inspection costs, and construction costs continue to rise – but they never address the real problem.
16. Still, many more costs are entirely hidden from eyesight. These are the
environmental costs not addressed by legislation. 17. We need to understand the natural system first in order to evaluate the
true costs of imperviousness. 18. The natural hydrologic cycle places the preponderance of water
movement into evapotranspiration. Runoff is the smallest portion of the cycle, and in fact, in many precipitation events there is no runoff at all.
4
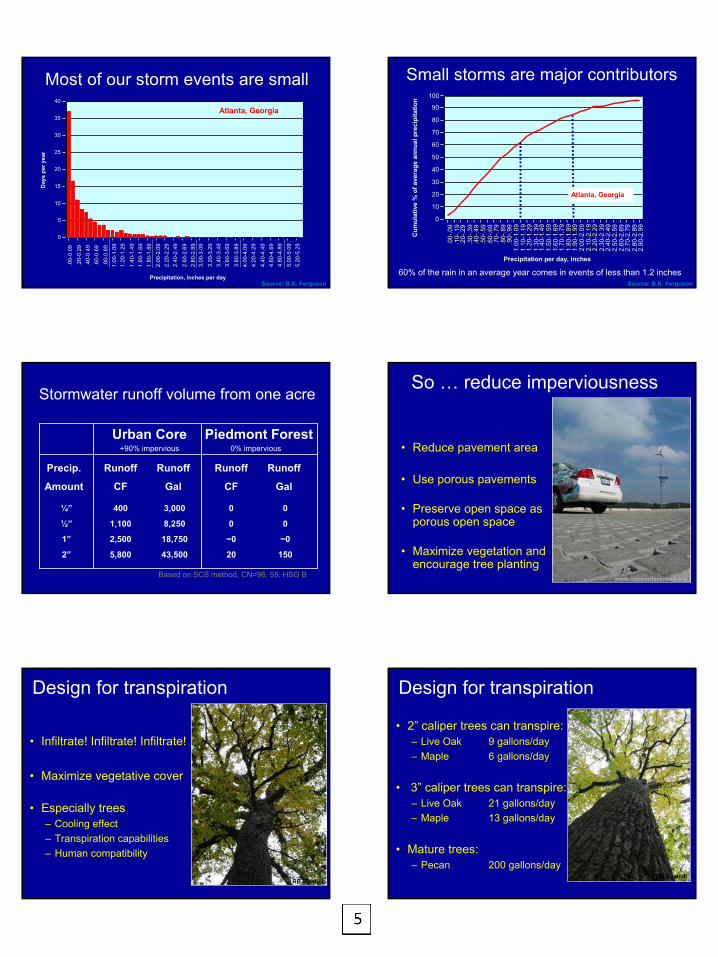
Compare to the urban system
• ~ 15% of precipitation evaporates back to the atmosphere, little transpiration occurs.
• Soil sealing from impervious structures and compaction creates an urban dry zone.
• Groundwater recharge is small; water and sewer leaks contribute.
• Even small, frequent storms generate significant runoff.
• Runoff carries away nearly 80% of annual precipitation volume. RB Sawhill
Urban Core Hydrologic Cycle
15%
100%
80%
5%
Evapo-transpiration
Runoff
Groundwater flow
Urban Core Hydrologic Cycle
15%
100%
80%
5%
Evapo-transpiration
Runoff
Groundwater flow
Visible Effects:Visible Effects:•Increased runoff
•Poor water quality
Urban Core Hydrologic Cycle
15%
100%
80%
5%
Evapo-transpiration
Runoff
Groundwater flow
Invisible Effects:Invisible Effects:•Reduced moisture returned
to atmosphere•Reduced soil moisture,
base flow and groundwater
resources
How can we restore the hydrologic process?
• Recognize stormwater management alone is a dead end
• Deal with the real problem: reduce imperviousness
• Design to restore transpiration
• Design for groundwater quantity and quality Northgeorgiawater.com
10 year ?25 year ?50 year ?
100 year ?

Page 4
19. --- 20. The amounts are approximate, but represent the significant shift from
the natural system. Researchers are attempting to accurately model the urban water balance, but the models are not yet reliable.
21. Most precipitation becomes runoff, collecting pollutants and eroding
natural systems. The visible effects are in surface waters: increased runoff, turbidity, sedimentation, erosion of channels, degradation of water bodies, loss of species diversity. These visible effects are the tip of the iceberg; what is hidden beneath these murky waters is worse.
22. The real impacts are literally invisible. The entire natural hydrologic
cycle has been disrupted. Evapotranspiration has been strangled – in fact, it becomes mostly evaporation, because of the heat island generated from pavements and structures. Reduced inputs to the atmosphere means reduced precipitation and more frequent and extreme droughts. Groundwater is sealed off and receives little or no inputs, meaning reduced base flows in streams, streams going dry, wells going dry, lakes going dry. Compound this with agricultural irrigation and groundwater resources rapidly diminish.
23. Stormwater management alone is a dead end, because it addresses
only a symptom of the problem. Once we reduce imperviousness, we will reduce stormwater runoff. At the same time we will increase infiltration, resulting in improved transpiration and groundwater inputs.
24. Stormwater management has traditionally dealt with flooding as the
primary issue. Focus has been upon storm events characterized as 10, 25, 50 and 100 year events. These are relatively rare events. These events, by definition, account for very little of annual precipitation inputs to the environment. We now know that the small storms and their “first flush” repeatedly impact our environment with pollutants.
5
0
5
10
15
20
25
30
35
40
Day
s pe
r yea
r
.00-
0.09
.20-
0.29
.40-
0.49
.60-
0.69
.80-
0.89
1.00
-1.0
91.
20-1
.29
1.40
-1.4
91.
60-1
.69
1.80
-1.8
92.
00-2
.09
2.20
-2.2
92.
40-2
.49
2.60
-2.6
92.
80-2
.89
3.00
-3.0
93.
20-3
.29
3.40
-3.4
93.
60-3
.69
3.80
-3.8
94.
00-4
.09
4.20
-4.2
94.
40-4
.49
4.60
-4.6
94.
80-4
.89
5.00
-5.0
95.
20-5
.29
Precipitation, inches per day
Atlanta, Georgia
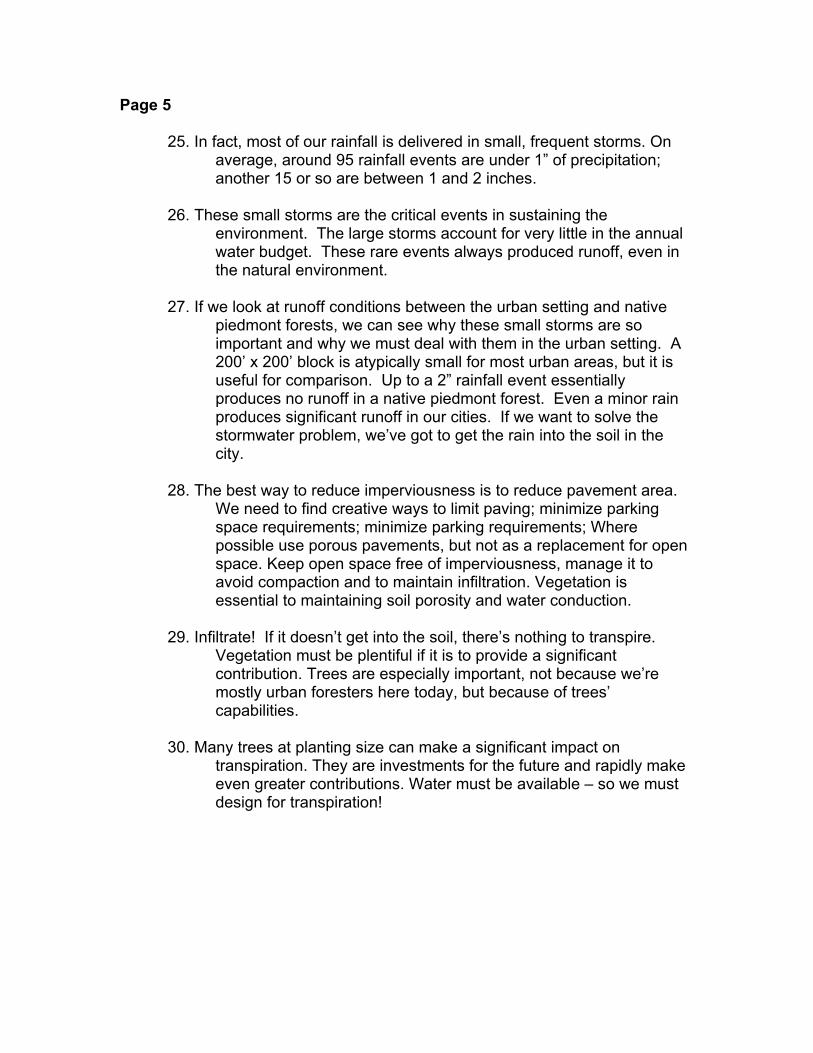
Most of our storm events are small
Source: B.K. Ferguson
0
10
20
30
40
50
60
70
80
90
100
Cum
ulat
ive
% o
f ave
rage
ann
ual p
reci
pita
tion
.00-
.09
.10-
.19
.20-
.29
.30-
.39
.40-
.49
.50-
.59
.60-
.69
.70-
.79
.80-
.89
.90-
.99
1.00
-1.0
91.
10-1
.19
1.20
-1.2
91.
30-1
.39
1.40
-1.4
91.
50-1
.59
1.60
-1.6
91.
70-1
.79
1.80
-1.8
91.
90-1
.99
2.00
-2.0
92.
10-2
.19
2.20
-2.2
92.
30-2
.39
2.40
-2.4
9
Precipitation per day, inches
2.50
-2.5
92.
60-2
.69
2.70
-2.7
92.
80-2
.89
2.90
-2.9
9
.00-
.09
.10-
.19
.30-
.39
.40-
.49
.50-
.59
.60-
.69
.70-
.79
.80-
.89
.90-
.99
1.00
-1.0
91.
10-1
.19
1.20
-1.2
91.
30-1
.39
1.40
-1.4
91.
50-1
.59
1.60
-1.6
91.
70-1
.79
1.80
-1.8
91.
90-1
.99
2.00
-2.0
92.
10-2
.19
2.20
-2.2
92.
30-2
.39
2.40
-2.4
9
Small storms are major contributors
60% of the rain in an average year comes in events of less than 1.2 inches
Atlanta, Georgia
Source: B.K. Ferguson
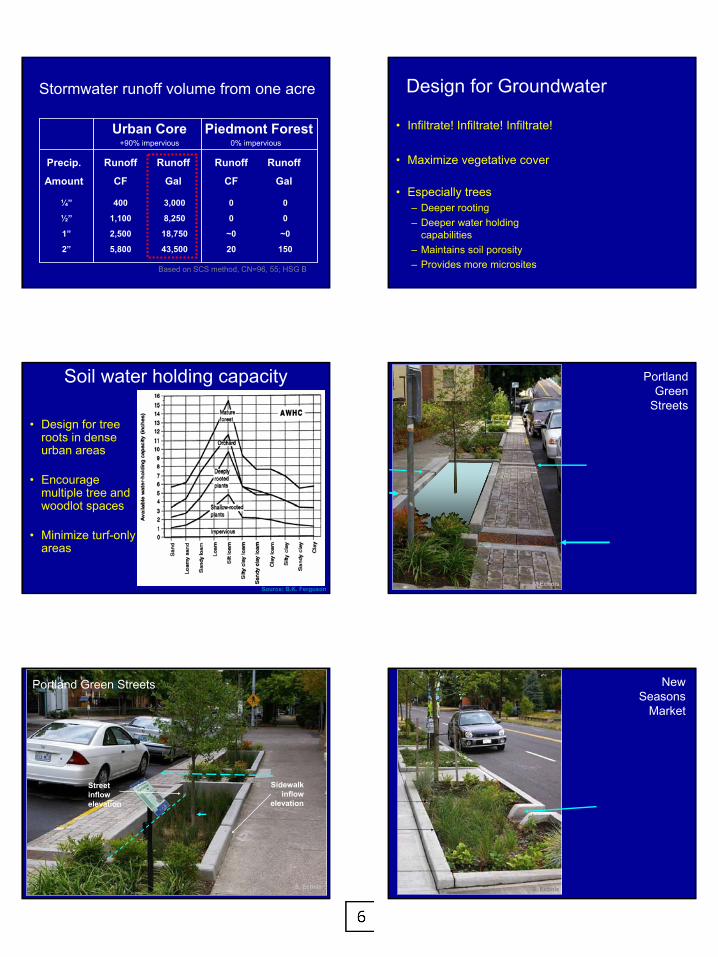
Stormwater runoff volume from one acre
Precip.
Amount
Runoff
CF
Runoff
Gal
¼”
½”
1”
2”
400
1,100
2,500
5,800
3,000
8,250
18,750
43,500
Runoff
CF
Runoff
Gal
0
0
~0
20
0
0
~0
150
Urban Core+90% impervious
Piedmont Forest0% impervious
Based on SCS method, CN=96, 55; HSG B
So … reduce imperviousness
• Reduce pavement area
• Use porous pavements
• Preserve open space as porous open space
• Maximize vegetation and encourage tree planting
www.icpiconferences.org
Design for transpiration
• Infiltrate! Infiltrate! Infiltrate!
• Maximize vegetative cover
• Especially trees– Cooling effect– Transpiration capabilities– Human compatibility
RB Sawhill
Design for transpiration
• 2” caliper trees can transpire:– Live Oak 9 gallons/day– Maple 6 gallons/day
• 3” caliper trees can transpire:– Live Oak 21 gallons/day– Maple 13 gallons/day
• Mature trees:– Pecan 200 gallons/day
RB Sawhill
Page 5
25. In fact, most of our rainfall is delivered in small, frequent storms. On average, around 95 rainfall events are under 1” of precipitation; another 15 or so are between 1 and 2 inches.
26. These small storms are the critical events in sustaining the
environment. The large storms account for very little in the annual water budget. These rare events always produced runoff, even in the natural environment.
27. If we look at runoff conditions between the urban setting and native
piedmont forests, we can see why these small storms are so important and why we must deal with them in the urban setting. A 200’ x 200’ block is atypically small for most urban areas, but it is useful for comparison. Up to a 2” rainfall event essentially produces no runoff in a native piedmont forest. Even a minor rain produces significant runoff in our cities. If we want to solve the stormwater problem, we’ve got to get the rain into the soil in the city.
28. The best way to reduce imperviousness is to reduce pavement area.
We need to find creative ways to limit paving; minimize parking space requirements; minimize parking requirements; Where possible use porous pavements, but not as a replacement for open space. Keep open space free of imperviousness, manage it to avoid compaction and to maintain infiltration. Vegetation is essential to maintaining soil porosity and water conduction.
29. Infiltrate! If it doesn’t get into the soil, there’s nothing to transpire.
Vegetation must be plentiful if it is to provide a significant contribution. Trees are especially important, not because we’re mostly urban foresters here today, but because of trees’ capabilities.
30. Many trees at planting size can make a significant impact on
transpiration. They are investments for the future and rapidly make even greater contributions. Water must be available – so we must design for transpiration!
6
Stormwater runoff volume from one acre
Precip.
Amount
Runoff
CF
Runoff
Gal
¼”
½”
1”
2”
400
1,100
2,500
5,800
3,000
8,250
18,750
43,500
Runoff
CF
Runoff
Gal
0
0
~0
20
0
0
~0
150
Urban Core+90% impervious
Piedmont Forest0% impervious
Based on SCS method, CN=96, 55; HSG B
Design for Groundwater
• Infiltrate! Infiltrate! Infiltrate!
• Maximize vegetative cover
• Especially trees– Deeper rooting– Deeper water holding
capabilities– Maintains soil porosity– Provides more microsites
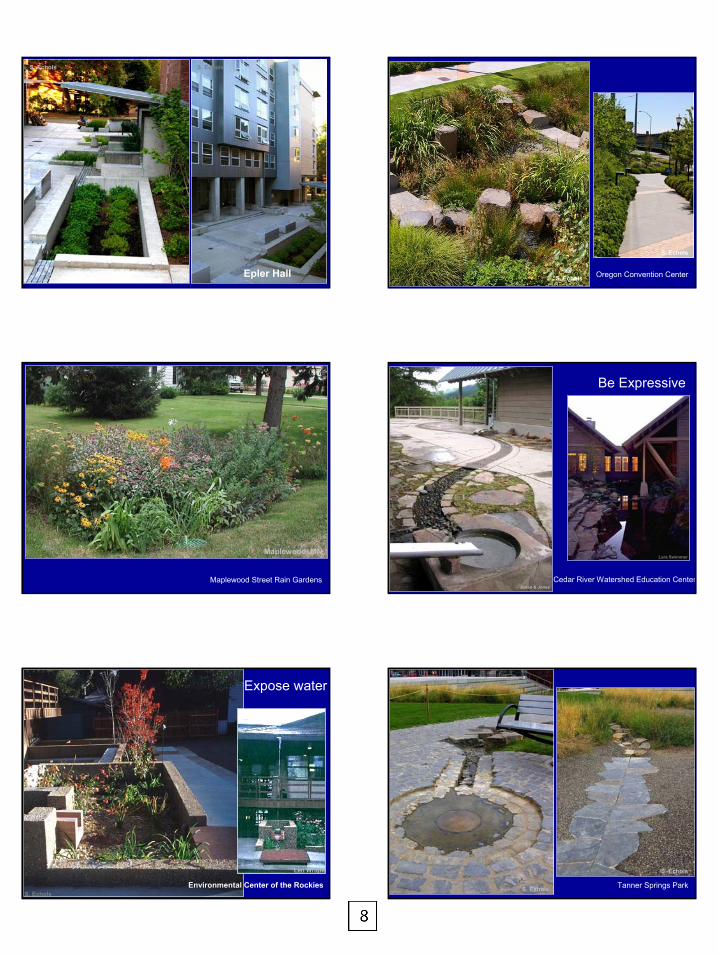
Soil water holding capacity
• Design for tree roots in dense urban areas
• Encourage multiple tree and woodlot spaces
• Minimize turf-only areas
Source: B.K. Ferguson
Portland Green
Streets
S. Echols
Portland Green Streets
S. Echols
Street inflow elevation
Sidewalk inflow
elevation
New Seasons
Market
S. Echols

Page 6
31. Look at water availability – urban design must deliver it to the planting areas. We need to design our urban areas to conduct roof water and street water to where plant roots can use it. There is plenty of it in even the smallest storms.
32. The design criteria for groundwater is the same as for transpiration. If
the water doesn’t get into the soil it can’t migrate to groundwater. If vegetation doesn’t maintain the soil, the soil will function poorly.
33. Soil can hold more water where trees develop dense and integrated
rooting systems. More water holding capacity means greater drought tolerance and reduced irrigation requirements.
34. Portland, Oregon 35. Portland, Oregon 36. Portland, Oregon
Page 7
37. Portland, Oregon 38. Portland, Oregon 39. Portland, Oregon 40. Portland, Oregon 41. Portland, Oregon 42. Portland, Oregon; by Ankrom Moisan Associated Architects and Koch
Landscape Architecture

7
New Seasons
Market
S. Echols Buckman Heights Courtyard
S. Echols
Buckman Heights Courtyard S. Echols Buckman Terrace Planters
S. Echols
Liberty Parking Planters
S. Echols
10th@Hoyt
S. Echols
8
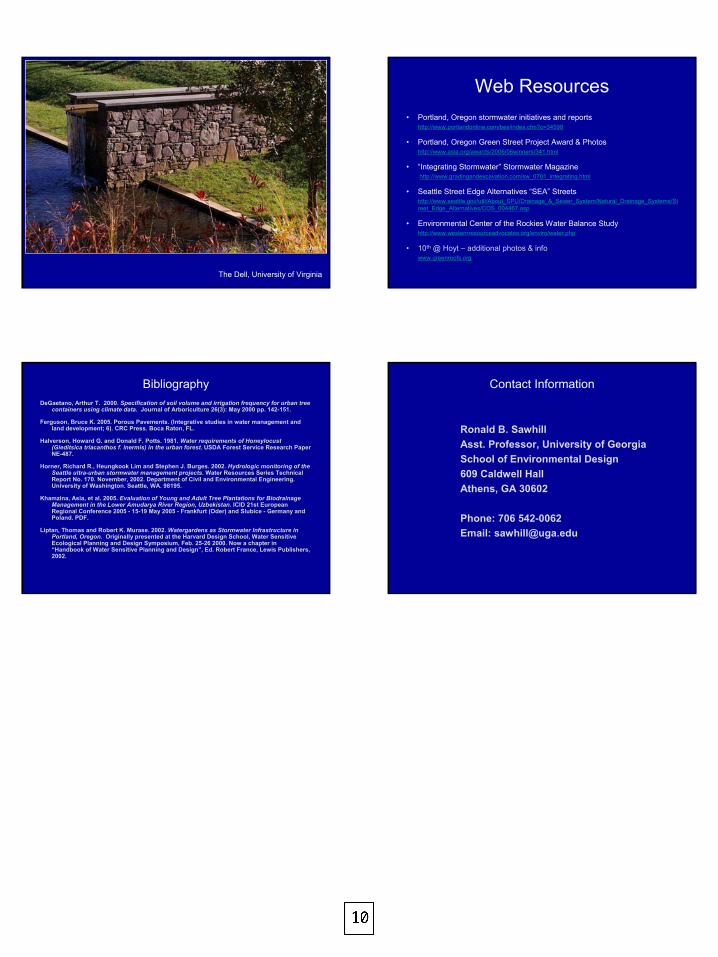
Epler Hall
S. Echols S. Echols
Oregon Convention CenterS. Echols
S. Echols
Maplewood Street Rain Gardens
Maplewood, MN
Cedar River Watershed Education Center
Be Expressive
Lara Swimmer
Jones & Jones
Environmental Center of the Rockies
Expose water
Len Wright
S. EcholsTanner Springs Park
S. Echols
S. Echols

Page 8
43. Portland University, Portland Oregon 44. Portland, Oregon 45. Open to human activity. Aesthetically pleasing. Small, on-site
treatment. Minneapolis, MN. 46. Seattle, WA 47. Boulder, CO 48. Portland, OR.
Page 9
49. See bibliography for additional information on Portland’s Alternative Green Streets Project.
50. SEA Street project in Seattle developed in conjunction with residents
combines pavement reduction, traffic calming and stormwater management practices.
51. See bibliography for additional resources on the SEA street projects. 52. Affordable housing development incorporating porous pavements and
vegetated swales. Seattle, WA. 53. Buster Simpson is the artist who has developed these creations. Vine
Street, Seattle, WA. 54. Seattle, WA
Page 10
55. The photograph above shows the spillway to the forebay at the Dell pond, a part of the Meadow Creek daylighting project. The pond and related facilities enhance the creek water quality while providing an attractive park like area for users..

9
Portland’s Alternative Green Streets Project
S. Echols
SEA Street Project, SeattleS. Echols
SEA Street Project, SeattleS. Echols High Point HousingS. Echols
S. Echols
81 Vine StreetS. Echols S. Echols
Pierce County Environmental Services
S. Echols
10
The Dell, University of Virginia
S. Echols
Web Resources• Portland, Oregon stormwater initiatives and reports
http://www.portlandonline.com/bes/index.cfm?c=34598
• Portland, Oregon Green Street Project Award & Photoshttp://www.asla.org/awards/2006/06winners/341.html
• “Integrating Stormwater” Stormwater Magazinehttp://www.gradingandexcavation.com/sw_0701_integrating.html
• Seattle Street Edge Alternatives “SEA” Streetshttp://www.seattle.gov/util/About_SPU/Drainage_&_Sewer_System/Natural_Drainage_Systems/Street_Edge_Alternatives/COS_004467.asp
• Environmental Center of the Rockies Water Balance Studyhttp://www.westernresourceadvocates.org/enviro/water.php
• 10th @ Hoyt – additional photos & infowww.greenroofs.org
BibliographyDeGaetano, Arthur T. 2000. Specification of soil volume and irrigation frequency for urban tree
containers using climate data. Journal of Arboriculture 26(3): May 2000 pp. 142-151.
Ferguson, Bruce K. 2005. Porous Pavements. (Integrative studies in water management and land development; 6). CRC Press. Boca Raton, FL.
Halverson, Howard G. and Donald F. Potts. 1981. Water requirements of Honeylocust(Gleditsica triacanthos f. inermis) in the urban forest. USDA Forest Service Research Paper NE-487.
Horner, Richard R., Heungkook Lim and Stephen J. Burges. 2002. Hydrologic monitoring of the Seattle ultra-urban stormwater management projects. Water Resources Series Technical Report No. 170. November, 2002. Department of Civil and Environmental Engineering. University of Washington. Seattle, WA. 98195.
Khamzina, Asia, et al. 2005. Evaluation of Young and Adult Tree Plantations for BiodrainageManagement in the Lower Amudarya River Region, Uzbekistan. ICID 21st European Regional Conference 2005 - 15-19 May 2005 - Frankfurt (Oder) and Slubice - Germany and Poland. PDF.
Liptan, Thomas and Robert K. Murase. 2002. Watergardens as Stormwater Infrastructure in Portland, Oregon. Originally presented at the Harvard Design School, Water Sensitive Ecological Planning and Design Symposium, Feb. 25-26 2000. Now a chapter in “Handbook of Water Sensitive Planning and Design”, Ed. Robert France, Lewis Publishers, 2002.
Contact Information
Ronald B. SawhillAsst. Professor, University of GeorgiaSchool of Environmental Design609 Caldwell HallAthens, GA 30602
Phone: 706 542-0062Email: [email protected]