trend analysis for process improvement - asq1500.org · 4 trend definitions •trend: a sequence or...
TRANSCRIPT

Trend Analysis
for Process Improvement
Lcdo. Manuel E. Peña-Rodríguez, JD, PE
August 18, 2011
Four Points Sheraton & Casino, Caguas PR

Agenda
Trending Overview
Run Charts
SPC & Control Charts
Special Charts
Trending in the FDA-Regulated
Industry
2

Trending Overview
3
4
Trend Definitions
• Trend: A sequence or pattern of data (Short term and Long term)
• Trend: A statistical term referring to the direction or rate of change of a variable. ICH Q9
• Adverse Trend: A general drift or tendency in a set of data over an established period of time, which exceeds established limits. Adverse trending can be upward or downward depending upon the type of performance metric.
• Tendencia: secuencia o patrón mostrado por un grupo de datos que se desvían de un valor esperado (ej.: valor histórico).

5
Trending Examples
Median: 0.00
-6.60
-4.60
-2.60
-0.60
1.40
3.40
1 2 3 4 5 6 7 8 9 10 11 12 13 14 15 16 17 18 19 20 21 22 23 24 25 26 27 28 29 30
Ru
n C
hart
- T
ren
ds
Mean: 98.35
92
94
96
98
100
102
104
106
3/1/
2007
3/2/
2007
3/4/
2007
3/6/
2007
3/7/
2007
3/8/
2007
3/10
/2007
3/12
/2007
1/13
/2007
3/14
/2007
3/16
/2007
3/17
/2007
3/19
/2007
3/22
/2007
3/23
/2007
3/24
/2007
3/26
/2007
3/27
/2007
3/28
/2007
3/29
/2007
3/30
/2007
4/1/
2007
4/2/
2007
4/3/
2007
4/4/
2007
4/5/
2007
4/8/
2007
4/9/
2007
4/10
/2007
4/11
/2007
4/12
/2007
4/13
/2007
4/14
/2007
4/16
/2007
4/18
/2007
4/20
/2007
4/26
/2007
4/27
/2007
4/28
/2007
4/29
/2007
Ru
n C
hart
: F
inal
Resu
lt
6
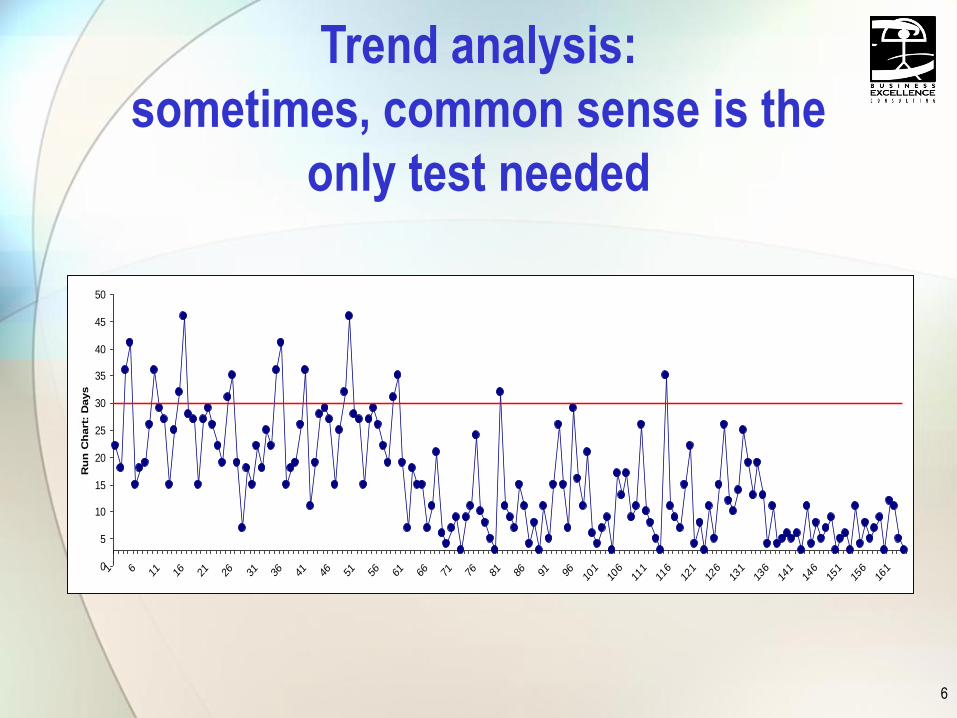
Trend analysis:
sometimes, common sense is the
only test needed
0
5
10
15
20
25
30
35
40
45
50
1 6 11 16 21 26 31 36 41 46 51 56 61 66 71 76 81 86 91 96 101
106
111
116
121
126
131
136
141
146
151
156
161
Ru
n C
hart
: D
ays

7
Run Charts & Control Charts
66
5
Mean CL: 3.80
1.596
6.006
1.500
2.000
2.500
3.000
3.500
4.000
4.500
5.000
5.500
6.000
6.500
1 3 5 7 9 11 13 15 17 19 21 23 25 27 29 31 33 35 37 39 41 43 45 47 49 51 53 55 57 59 61 63 65 67 69 71 73 75 77 79 81 83 85 87 89 91 93 95 97 99
Ind
ivid
uals
: O
vera
ll S
ati
sfa
cti
on
Median: -1.00
-7.00
-6.00
-5.00
-4.00
-3.00
-2.00
-1.00
0.00
1.00
2.00
3.00
4.00
5.00
6.00
7.00
1 2 3 4 5 6 7 8 9 10 11 12 13 14 15 16 17 18 19 20 21 22 23 24 25 26 27 28 29 30
Ru
n C
hart
- C
luste
rin
g

8
Run Charts & Control Charts
• Both have the same purpose: to distinguish common from special cause variation in the data produced by a process.
• Run charts originated from control charts, which were initially designed by Walter Shewhart.
• Run charts evolved from the development of these control charts, but run charts focus more on time patterns while a control chart focuses more on acceptable limits of the process.
• Run chart is simple to construct and to analyze
• Can be used with any process and any type of data
• A Control chart is simply a Run Chart with statistically based limits

Run Charts
9

10
A run chart is a line graph of data points plotted in chronological
order that helps detect special causes of variation.
Run charts allow us to:• Understand process variation
• Analyze data for patterns
• Monitor process performance
• Communicate process performance
Run Charts
Mean: 98.64
95.9
96.4
96.9
97.4
97.9
98.4
98.9
99.4
99.9
1-Mar
2-Mar
4-Mar
6-Mar
7-Mar
8-Mar
10-Mar
12-Mar
13-Jan
14-Mar
16-Mar
17-Mar
19-Mar
22-Mar
23-Mar
24-Mar
26-Mar
27-Mar
28-Mar
29-Mar
30-Mar
1-Apr
2-Apr
3-Apr
4-Apr
5-Apr
8-Apr
9-Apr
10-Apr
11-Apr
12-Apr
13-Apr
14-Apr
16-Apr
18-Apr
20-Apr
26-Apr
27-Apr
28-Apr
29-Apr
Run
Char
t: %
Ass
ay

11
Run Charts
• Test for randomness or independence• Ho= data is random (or independent)
• Ha= data is not random
• Four other tests:
• Clustering
• Mixtures
• Trends
• Oscillations
Nonparametric Runs Test: % Assay
Number of Runs about Median: 16
Expected Number of Runs about Median: 20.550
Number of Points above Median: 17
Number of Points equal to or below Median: 23
P-Value for Clustering: 0.0678
P-Value for Mixtures: 0.9322
P-Value for Lack of Randomness (2-Sided): 0.1357
Number of Runs Up or Down: 24
Expected Number of Runs Up or Down: 26.333
P-Value for Trends: 0.1853
P-Value for Oscillation: 0.8147

12
Clustering
Median: -1.00
-7.00
-6.00
-5.00
-4.00
-3.00
-2.00
-1.00
0.00
1.00
2.00
3.00
4.00
5.00
6.00
7.00
1 2 3 4 5 6 7 8 9 10 11 12 13 14 15 16 17 18 19 20 21 22 23 24 25 26 27 28 29 30
Ru
n C
hart
- C
luste
rin
g
Nonparametric Runs Test: Clustering
Number of Runs about Median: 9
Expected Number of Runs about Median: 15.93333
Number of Points above Median: 14
Number of Points equal to or below Median: 16
P-Value for Clustering: 0.0048
P-Value for Mixtures: 0.9952
P-Value for Lack of Randomness (2-Sided): 0.0096
Number of Runs Up or Down: 17
Expected Number of Runs Up or Down: 19.66667
P-Value for Trends: 0.1168
P-Value for Oscillation: 0.8832
Clustering appears as a
group of points in one area of
the chart. It may indicate
special cause variation such
as sampling or measurement
problems.

13
Mixtures
Median: 0.00
-6.00
-5.00
-4.00
-3.00
-2.00
-1.00
0.00
1.00
2.00
3.00
4.00
5.00
6.00
1 2 3 4 5 6 7 8 9 10 11 12 13 14 15 16 17 18 19 20 21 22 23 24 25 26 27 28 29 30
Ru
n C
hart
- M
ixtu
res
Nonparametric Runs Test: Mixtures
Number of Runs about Median: 23
Expected Number of Runs about Median: 16
Number of Points above Median: 15
Number of Points equal to or below Median: 15
P-Value for Clustering: 0.9954
P-Value for Mixtures: 0.0046
P-Value for Lack of Randomness (2-Sided): 0.0093
Number of Runs Up or Down: 22
Expected Number of Runs Up or Down: 19.66667
P-Value for Trends: 0.8514
P-Value for Oscillation: 0.1486
Mixtures appear as an
absence of data point near
the center line. May indicate
a bimodal distribution due to
changes of shift, machinery,
raw materials, etc

14
Trends
Median: 0.00
-6.60
-4.60
-2.60
-0.60
1.40
3.40
1 2 3 4 5 6 7 8 9 10 11 12 13 14 15 16 17 18 19 20 21 22 23 24 25 26 27 28 29 30
Ru
n C
hart
- T
ren
ds
Nonparametric Runs Test: Trends
Number of Runs about Median: 13
Expected Number of Runs about Median: 15.73333
Number of Points above Median: 13
Number of Points equal to or below Median: 17
P-Value for Clustering: 0.1504
P-Value for Mixtures: 0.8496
P-Value for Lack of Randomness (2-Sided): 0.3008
Number of Runs Up or Down: 13
Expected Number of Runs Up or Down: 19.66667
P-Value for Trends: 0.0015
P-Value for Oscillation: 0.9985
Trends appear as an
upward or downward
drift in the data and may
be due to special causes
such as tool wear.

15
Oscillation
Median: 2.00
-6.60
-4.60
-2.60
-0.60
1.40
3.40
5.40
1 2 3 4 5 6 7 8 9 10 11 12 13 14 15 16 17 18 19 20 21 22 23 24 25 26 27 28 29 30
Ru
n C
hart
- O
scil
lati
on
Nonparametric Runs Test: Oscillation
Number of Runs about Median: 16
Expected Number of Runs about Median: 15.93333
Number of Points above Median: 14
Number of Points equal to or below Median: 16
P-Value for Clustering: 0.5099
P-Value for Mixtures: 0.4901
P-Value for Lack of Randomness (2-Sided): 0.9801
Number of Runs Up or Down: 25
Expected Number of Runs Up or Down: 19.66667
P-Value for Trends: 0.9914
P-Value for Oscillation: 0.0086
Oscillations appear as
rapid up/down fluctuations
indicating process
instability.

SPC &
Control Charts
16

17
Statistical Process Control
• SPC is a technique for applying statistical analysis to measure, monitor and control processes.
• To improve process performance over time by studying variation and its source.
• The basic assumption is that all processes are subject to variation.
Two types of Variation:
• Random or Chance cause Variation
• Assignable cause Variation
There is variation in all things”
“No two things are exactly alike”Dr. W. E. Deming

18
• Common-cause (Random, Chance) Variation
• They are part of the process
• They contribute to output variation because they themselves vary
• Each common cause contributes a small part of the total variation
• By looking at process over time, we know how much variation to expect from common causes
• The process is stable, or predictable, when all the variation is due to common causes.
Statistical Process Control
19
• Special-cause (Assignable) Variation
• They are not usually present
• They may come and go sporadically, may be
temporary or long-term
• A special cause is something special or specific
that has a pronounced effect on the process
• We cannot predict when a special cause will
occur or how it will affect the process
• The process is unstable, or unpredictable, when
special causes contribute to variation
Statistical Process Control
20
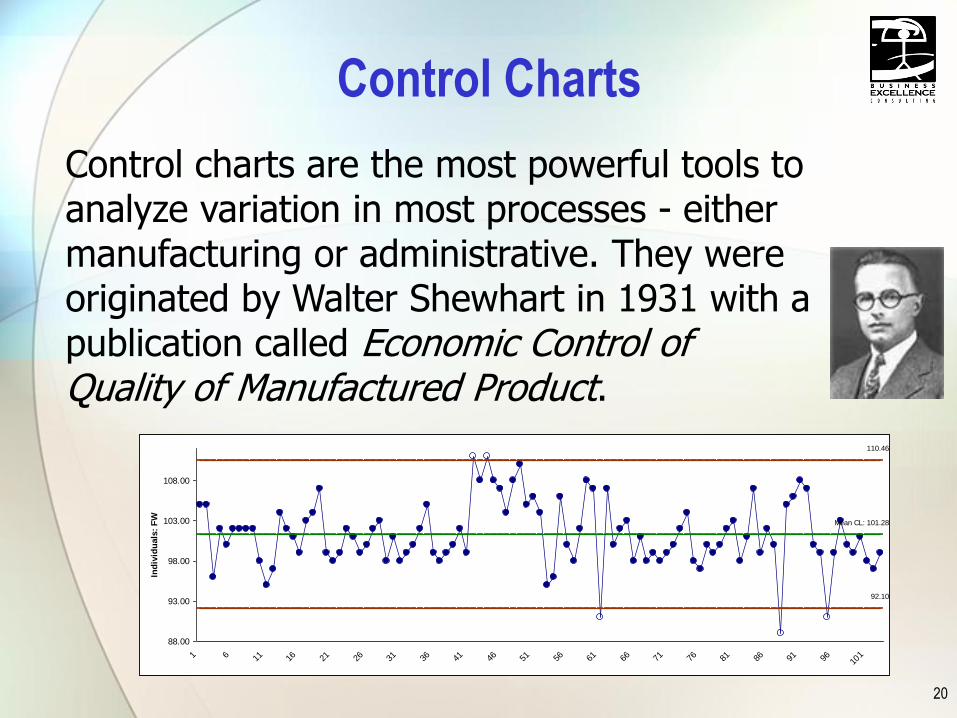
Control charts are the most powerful tools to analyze variation in most processes - either manufacturing or administrative. They were originated by Walter Shewhart in 1931 with a publication called Economic Control ofQuality of Manufactured Product.
Control Charts
Mean CL: 101.28
92.10
110.46
88.00
93.00
98.00
103.00
108.00
1 6 11 16 21 26 31 36 41 46 51 56 61 66 71 76 81 86 91 96 101
Ind
ivid
uals
: F
W

21
Control Chart has two
principal uses:
•For judging whether a state of
control exists by analyzing a
set of data
•For attaining and maintaining
control of quality
2
6
6 6
65
2
1
2
1
100.45
91.98
108.93
90.00
92.00
94.00
96.00
98.00
100.00
102.00
104.00
106.00
108.00
110.00
1 3 5 7 9 11 13 15 17 19 21 23 25 27 29 31 33 35 37 39 41 43 45 47 49 51 53 55 57 59 61 63 65 67 69 71 73 75
X-Bar:
Data
2
6
6 6
65
2
1
2
1
100.45
91.98
108.93
90.00
92.00
94.00
96.00
98.00
100.00
102.00
104.00
106.00
108.00
110.00
1 3 5 7 9 11 13 15 17 19 21 23 25 27 29 31 33 35 37 39 41 43 45 47 49 51 53 55 57 59 61 63 65 67 69 71 73 75
X-Bar:
Data
This point
indicates
assignable
cause NOW
# ACT NOW #
Real
time
Control Charts

22
• Determine managerial action when there are special causes of variation
• Understand and predict process capability
• Identify root causes of variation by differentiating between special causes and common causes of variation
• See whether intentional changes in a process had the desired result
• Monitor key processes and identify shifts or changes quickly to help hold the gains made from and improvement project
Other Uses of Control Charts

23
•Variables control charts, plot statistics from
measurement data, such as length or pressure.
•Two charts: averages & variation
•Attributes control charts, plot count data, such
as the number of defects or defective units.
•One chart: average
Types of Control Charts

Trend Analysis – © BEC 2011 24
Control Charts for Variables
• Plots specific measurements of a process
characteristic (temperature, size, weight, sales
volume, shipments, etc.).
• Types:
- X-R Charts
- I-MR Charts (limited data)
- X-S Charts (when sigma is readily available)
- Median Charts

25
Control Charts for Attributes

26
Control Chart Selection

27
•A process statistic, such as a subgroup mean, individual
observation, or weighted statistic, is plotted versus sample
number or time.
•A “center line” is drawn at the average of the statistic being
plotted for the time being charted.
•Two other line (the upper and lower control limits) are
drawn, by default, 3 Std Dev (Sigma) above and below the
center line.
•Control limits are calculated lines which indicate the range of
expected variation.
Components of Control Charts

28
• When to calculate new control limits:
• When you know there was a change in the process based on statistical evidence.
• When you are confident the process will change: for example after a major cause is eliminated
• Calculate the new limits when you have enough data points to see a change.
• What to look for when using control charts:
• A good control chart is one that is being used concurrently with the process
• Comments should be written on the control charts
Components of Control Charts
29
•Chart interpretation•Most basic:
•Points outside control limits
•More sophisticated: Employ Special Test Rules•Detect abnormal data patterns
•Each is sensitive to a different pattern
•Selectively employed as necessary to detect unwanted changes
Control Charts
Special Cause Tests Basics

30
Special Causes
(Non-Random Patterns)

31
Control Chart:
To good to be true
100.00
75.00
125.00
70.00
80.00
90.00
100.00
110.00
120.00
130.00
1 3 5 7 9 11 13 15 17 19 21 23 25 27 29 31 33 35 37 39 41 43 45 47 49 51 53 55 57 59 61 63 65 67 69 71 73 75
X-B
ar:
Data
• Incorrect limits calculation
• False data
• Process improved but nobody updated limits

32
Measuring Process Improvements
with a Control Chart
100.12
95.92
104.32
92.00
94.00
96.00
98.00
100.00
102.00
104.00
106.00
108.00
110.00
112.00
1 2 3 4 5 6 7 8 9 10 11 12 13 14 15 16 17 18 19 20 21 22 23 24 25 26 27 28 29 30 31 32 33 34 35 36 37 38 39 40 41 42 43 44 45 46 47 48 49 50 51 52 53 54 55 56 57 58 59
X-B
ar:
Fil
l W
eig
ht
by B
efo
re-A
fter

33
• Wrong formula used to calculate control limits
• Wrong type of chart used based on data type
• Missing, poor or erroneous measurements
• Data on charts not current
• Process adjustments have not been noted
• Control limits and average not updated
• Special-cause signals ignored
• Non-random patterns not studied
• Specification limits placed on chart instead of control limits
Common mistakes when using
Control Charts:

Special ChartsEWMA
34

35
When to Use an EWMA Chart
• EWMA (or Exponentially Weighted Moving Average) Charts are
generally used for detecting small shifts in the process mean. They
will detect shifts of .5 sigma to 2 sigma much faster than Shewhart
charts with the same sample size. They are, however, slower in
detecting large shifts in the process mean. In addition, typical run
tests cannot be used because of the inherent dependence of data
points.
• When choosing the value of lambda used for weighting, it is
recommended to use small values (such as 0.2) to detect small
shifts, and larger values (between 0.2 and 0.4) for larger shifts. An
EWMA Chart with lambda = 1.0 is an X-bar Chart.

36
When to Use an EWMA Chart• EWMA charts are also used to smooth the affect of
known, uncontrollable noise in the data. Many accounting
processes and chemical processes fit into this
categorization. For example, while day to day fluctuations
in accounting processes may be large, they are not purely
indicative of process instability. The choice of lambda can
be determined to make the chart more or less sensitive to
these daily fluctuations.

37
Shewhart vs EMWA Charts
Sample
EW
MA
24222018161412108642
130
120
110
100
90
80
__X=105.32
UCL=126.34
LCL=84.30
EWMA Chart of time
Observation
Ind
ivid
ua
l V
alu
e
24222018161412108642
175
150
125
100
75
50
_X=105.3
UCL=168.4
LCL=42.3
I Chart of time

38
Shewhart vs EMWA Charts
Sample
EW
MA
24222018161412108642
175
150
125
100
75
50
__X=105.3
UCL=168.4
LCL=42.3
EWMA Chart of time
Sample
EW
MA
24222018161412108642
150
140
130
120
110
100
90
80
70
60
__X=105.32
UCL=146.60
LCL=64.04
EWMA Chart of time
Sample
EW
MA
24222018161412108642
130
120
110
100
90
80
__X=105.32
UCL=126.34
LCL=84.30
EWMA Chart of time
Observation
Ind
ivid
ua
l V
alu
e
24222018161412108642
175
150
125
100
75
50
_X=105.3
UCL=168.4
LCL=42.3
I Chart of time

Trending in the
FDA-Regulated Industry
39

40
FDA’s Expectations of Trending
• Trending is an important tool in reporting the state of environmental
control
• Daily, Weekly, Monthly,
• Long term: up to three years
• Parametric Release
• Main requirements of a Quality Management System (QMS)
• Each firm must define what is an adverse trend
• When an adverse trend is identified, an investigation should be
initiated to identify the root cause(s)
• Implement effective corrective and preventive actions (CAPA)
• FDA suggests that three (3) years of historical data be kept for the
purpose of long-term trending.

41
FDA Regulations
• Medical Device QSR. Sec. 820.100 Corrective and preventive action.• (a) Each manufacturer shall establish and maintain procedures
for implementing corrective and preventive action. The procedures shall include requirements for: (1) Analyzing processes, work operations, concessions, quality audit reports, quality records, service records, complaints, returned product, and other sources of quality data to identify existing and potential causes of nonconforming product, or other quality problems. Appropriate statistical methodology shall be employed where necessary to detect recurring quality problems;
• 2004 FDA Sterile Product Guidance• The QCU should provide routine oversight of near-term and long-
term trends in environmental and personnel monitoring data
• 2006 FDA Guidance for Industry: Quality Systems Approach to Pharmaceutical Current Good Manufacturing Practice Regulations

42
FDA Guidance for Industry (2006):
Quality Systems Approach to Pharmaceutical
Current Good Manufacturing Practice Regulations.
Analyze Data for Trends • Quality systems call for continually monitoring trends and improving systems. This
can be achieved by monitoring data and information, identifying and resolving problems, and anticipating and preventing problems.
• Quality systems procedures involve collecting data from monitoring, measurement, complaint handling, or other activities, and tracking this data over time, as appropriate. Analysis of data can provide indications that controls are losing effectiveness. The information generated will be essential to achieving problem resolution or problem prevention.
• Although the CGMP regulations (§ 211.180(e))require product review on at least an annual basis, a quality systems approach calls for trending on a more frequent basis as determined by risk. Trending enables the detection of potential problems as early as possible to plan corrective and preventive actions. Another important concept of modern quality systems is the use of trending to examine processes as a whole; this is consistent with the annual review approach. Trending analyses can help focus internal audits.
43
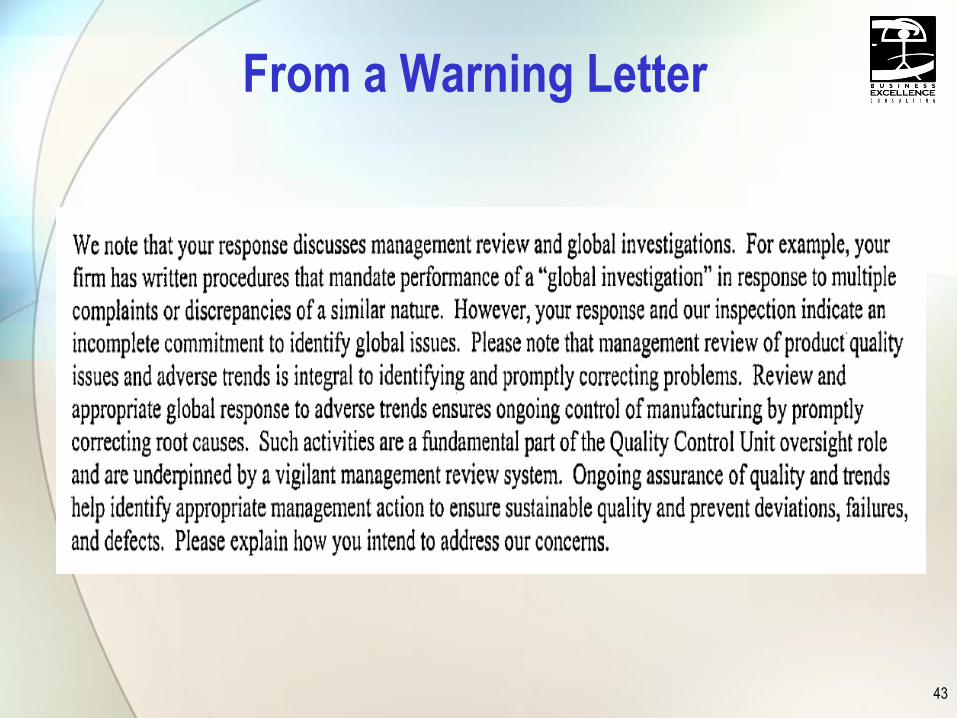
From a Warning Letter

Thanks
44