trend analysis training key concepts and methods
TRANSCRIPT

Trend Analysis Training
KEY CONCEPTS AND METHODS
Conducted by Lori Strumpf
Strumpf Associates: Center for Strategic
Change
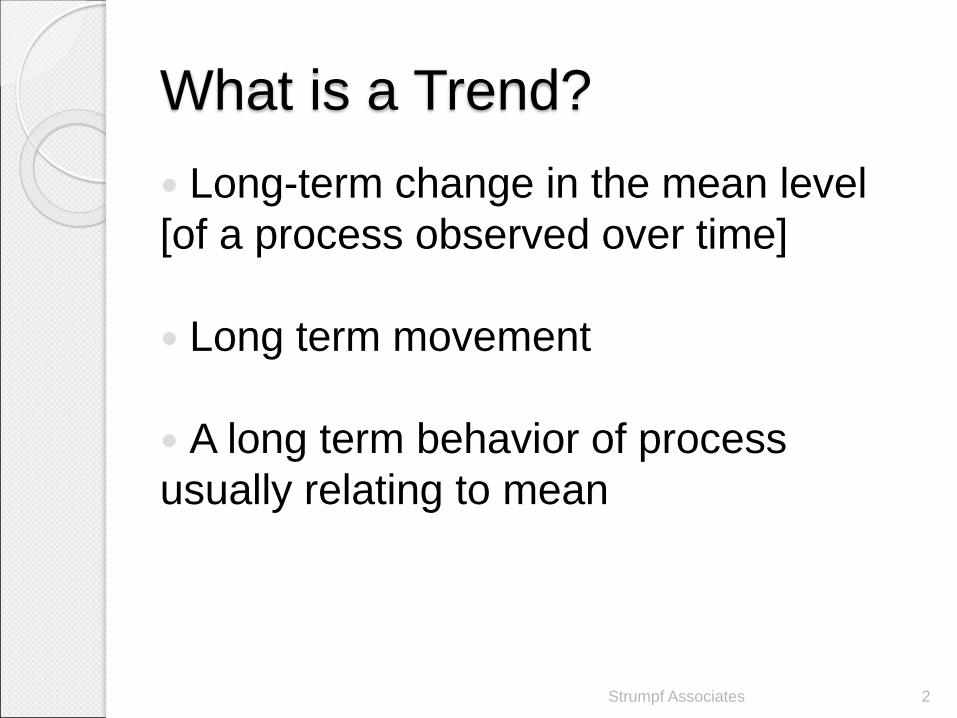
What is a Trend?
Long-term change in the mean level
[of a process observed over time]
Long term movement
A long term behavior of process
usually relating to mean
Strumpf Associates 2
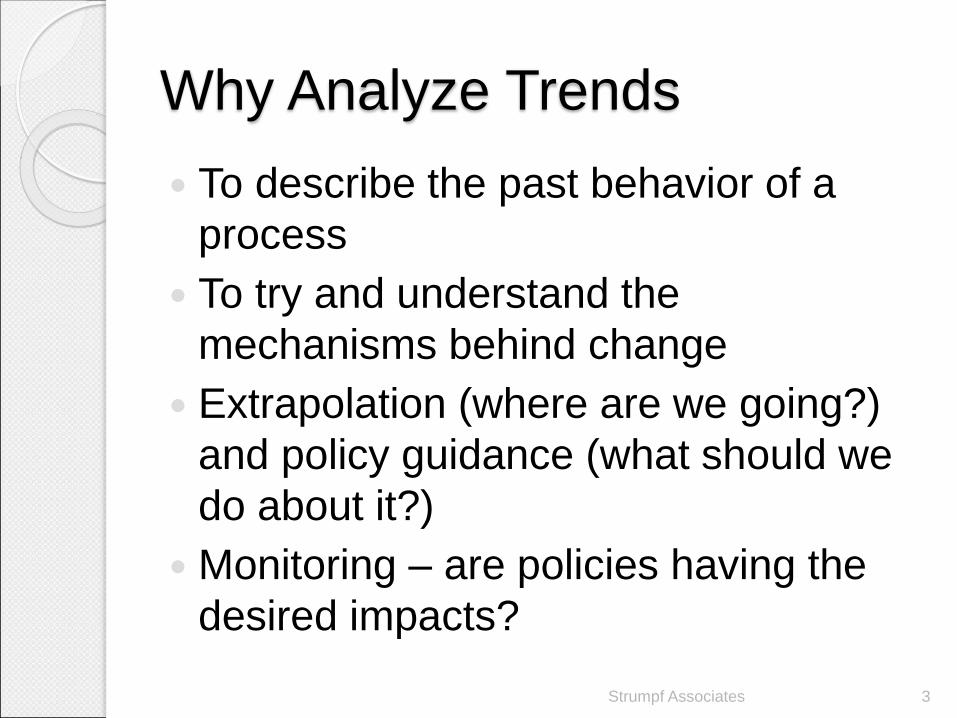
Why Analyze Trends
To describe the past behavior of a
process
To try and understand the
mechanisms behind change
Extrapolation (where are we going?)
and policy guidance (what should we
do about it?)
Monitoring – are policies having the
desired impacts?
Strumpf Associates 3
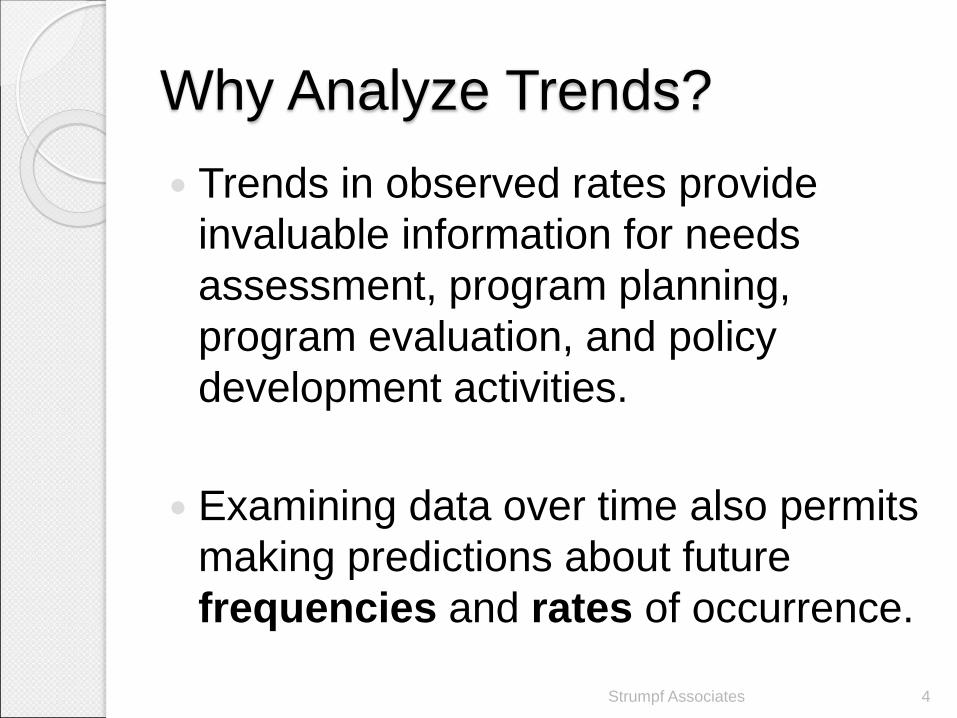
Why Analyze Trends?
Trends in observed rates provide
invaluable information for needs
assessment, program planning,
program evaluation, and policy
development activities.
Examining data over time also permits
making predictions about future
frequencies and rates of occurrence.
Strumpf Associates 4
Use of Statistical Analysis
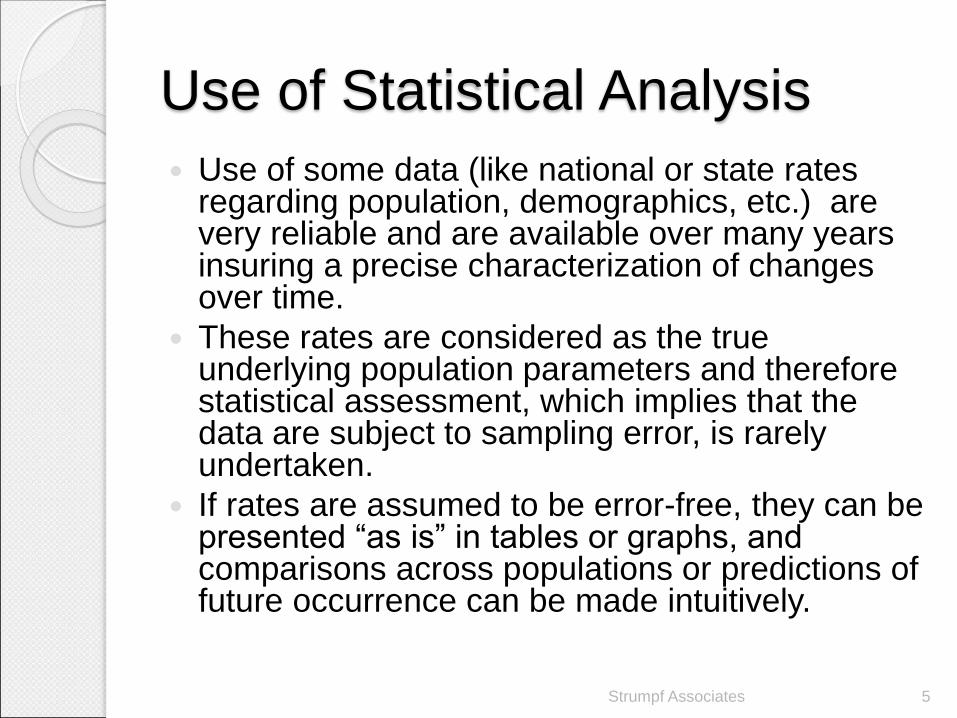
Use of some data (like national or state rates regarding population, demographics, etc.) are very reliable and are available over many years insuring a precise characterization of changes over time.
These rates are considered as the true underlying population parameters and therefore statistical assessment, which implies that the data are subject to sampling error, is rarely undertaken.
If rates are assumed to be error-free, they can be presented “as is” in tables or graphs, and comparisons across populations or predictions of future occurrence can be made intuitively.
Strumpf Associates 5
Use of Statistical Analysis
Because research data are usually sample data, statistical procedures, including sophisticated approaches such as time series analysis and formal forecasting techniques, are commonly used.
Time series analysis is also used when the analytic goal is not monitoring the trend in an outcome indicator per se, but rather describing the relationship between a risk factor and the outcome.
For example, in a study of the association between air pollution levels and the hospitalization rates of children with asthma, time series analysis might be used to simultaneously control for the overall trends in both measures; here, the impact of the trends on the hypothesized association is the primary focus, rather than the trends themselves.
Strumpf Associates 6

Use of Statistical Analysis
Once the focus of trend analysis is on data from small areas, small populations, or for a narrow range of time, it is necessary to draw from both the classic descriptive methods and the statistical approaches used in research studies.
As numbers get smaller, for example, confidence in their accuracy is reduced and although no formal sampling has been carried out, it becomes more obvious that there is potential for error.
Reporting confidence intervals, or using other statistical methods to assess and compare trends becomes critical.
Strumpf Associates 7
A study of time trends may focus on one
or more of the following:
The overall pattern of change in an indicator over time. The most general goal of trend analysis is to discern whether the level of a certain status (health, abuse), service, or systems indicator has increased or decreased over time, and if it has, how quickly or slowly the increase or decrease has occurred.
Comparing one time period to another time period. This form of trend analysis is carried out in order to assess the level of an indicator before and after an event. Evaluating the impact of programs, policy shifts, or medical and other technical advances may call for what is sometimes called interrupted time series analysis.
Strumpf Associates 8
A study of time trends may focus on one or
more of the following: Comparing one geographic area to another. When comparing the level
of an indicator across geographic areas, only looking at one point in time
can be misleading. For instance, one area may have a higher value on an
indicator in one year, but a lower value in the next--analyzing the trend over
several years can give a more precise comparison of the two areas.
Comparing one population to another. When comparing the level of an
indicator across populations, both absolute and relative differences are
important. For instance, one population may have consistently higher rates
over time compared to another population and the rates in both populations
may be decreasing over time, but the disparity between the rates in the two
populations at each point in time may be increasing or decreasing. Analyzing
the trend over time can provide information about the changing rates and the
changing disparity in the rates.
Making future projections. Projecting rates into the future is a means of
monitoring progress toward a national or local objective or simply providing
an estimate of the rate of future occurrence. Projecting the potential number
of future cases can aid in the planning of needed services and in defining
corresponding resource requirements.
Strumpf Associates 9

Preparing to Analyze Trend
Data A series of conceptual issues must be
addressed before analyzing and interpreting trend data regardless of the purpose of the analysis. These issues include:◦ Sample size—the number of time periods
being examined
◦ Presence of extreme observations or outliers
◦ Availability of numerator and denominator data
◦ Confounding--changes over time in factors related to the indicator of interest
Strumpf Associates 10

Sample size
First, it is critical to understand the
nature of the data set being analyzed.
Are the observations, or units of
analysis, time periods (years, months,
days) or individuals.
Strumpf Associates 11
Presence of extreme
observations. Another consideration when analyzing
and interpreting trends over time is
whether there are extreme
observations, or outliers, in the data. If
there are, it is important to determine
whether these are due to random
variability or whether they reflect a real
departure from the general trend.
Strumpf Associates 12

Availability of numerator and
denominator data.
The accuracy of numerator and denominator information over
time is also very important in insuring meaningful
interpretation of trend data. If both numerator and
denominator data for an indicator are available for each time
period being studied, then these can be easily analyzed. For
instance, it is relatively straightforward to examine trends in
indicators based on vital records data, such as low birth
weight or infant mortality, because the numerator and
denominator information is collected continuously. The
number of low birth weight births or the number of infant
deaths as well as the total number of live births can be
accurately counted on an annual or even monthly basis.
Strumpf Associates 13

Availability of numerator and
denominator data. In contrast, other indicators may require
denominators which are not collected continuously, such as population demographics.
Census data are collected once every 10 years, with intercensal estimates being calculated routinely only for certain geographic areas and certain populations. If a trend analysis in a small area, or comparing different age groups or socio-demographic groups is planned, it is typically quite difficult to obtain estimates for the required denominators. For example, annual estimates of the population of children less than 18 years old in a small city are probably unavailable.
Strumpf Associates 14
Confounding Particularly when trend analysis is to be undertaken for a small area or
small population, changes over time in other factors related to the
indicator of interest must also be considered. For example, change in
the sociodemographic characteristics of the population such as change
in the age structure, the ethnic composition, or income level over time
may be associated with the change over time in the indicator that is of
primary interest.
As example, the question is whether comparing the health status of a
community from 1970 to 1995 is meaningful. Is it really the "same"
community at the two endpoints of the trend analysis, or is any
observed trend confounded by changes in factors other than the
indicator being studied? Changes in reporting definitions for an
indicator, or reporting accuracy over time might also confound the trend
information and lead to misinterpretation. For instance, changes in
medical technology which have an impact on the indicator, such as the
impact on infant mortality of the widespread implementation of neonatal
intensive care units in the late 1970's and early 1980's, must also be
considered.
Strumpf Associates 15
Confounding continued
Other changes over time that are of concern when conducting trend analysis include changes in laws or public policy such as a change in eligibility criteria for programs such as Medicaid, or rules concerning access to services for minors, as well as changes in cultural practices such as reduction (or increase) in substance abuse.
In general, accounting for change over time in other factors related to the indicator of interest increases in importance the longer the time period and/or the smaller the area or population size being studied. Demographic changes such as a shift in ethnic composition, for instance, may be more pronounced at the county or community level than in a state or the nation as a whole.
Strumpf Associates 16
First Steps
Regardless of whether statistical techniques will be used for analyzing data over time, the most straightforward and intuitive first step in assessing a trend is to plot the actual observed numbers or rates of interest by year (or some other time period deemed appropriate).
In addition, the numbers or rates should be examined in tabular form.
Strumpf Associates 17
Visual inspection also permits a preliminary assessment of the overall direction and shape of the trend. Commonly used statistical approaches are designed for assessing linear trends; that is, a series of numbers or rates which change over time in a consistent, or uniform, fashion.
If the trend appears to be different during distinct time periods, either in shape or direction, then ananalytic method must be selected that will preserve and not obscure this important information.
In addition, when the number of events is very small, individual case review may be called for rather than the application of statistical methods. Each event might appropriately be considered as a sentinel or unexpected occurrence, arising from different processes than when events occur on a widespread basis.
Strumpf Associates 18

These initial steps are indispensable for understanding the general shape of the trend, for identifying any outliers in the data, and for becoming familiar with both the absolute and relative levels of the numbers and rates being studied. Inspection of the data provides the basis for making subsequent analysis choices and should never be bypassed.
Visual inspection of the data may indicate that use of statistical procedures is inappropriate. For example, an outlier at a particular point in time may be of intrinsic interest, representing circumstances in the community important to understand.
Statistical procedures, such as regression analysis, would mute the effect of this outlier by assuming that its extreme value is attributable to statistical instability.
Strumpf Associates 19
An Example
In order to look more concretely at the
process of analyzing trends – What
data do you have
As recommended, can the actual data
be looked at in both in tabular and
graphic form:
Strumpf Associates 20

Presentation of Trend Data
Deciding which results to present and the form in which to present them is an important aspect of turning the data into information.
Examining the data in multiple and varied forms allows for exploration of different presentation strategies, and is necessary for selecting an effective and useful approach. If analytic shortcuts are taken, this process cannot occur and the final product may suffer.
For instance, initial analysis may explore approaches to combining years or geographic areas.
One averaging method may obscure an important trend, another may highlight it; unless the preliminary work is carried out, inappropriate choices for presentation may be made. In addition, having multiple analyses provides a pool from which to draw depending on the audience and circumstances of the presentation.
Strumpf Associates 21