trends and prospects: lifelong learning in digital era
DESCRIPTION
Trends and Prospects: Lifelong Learning in Digital Era. The 2 nd International Conference on Lifelong Learning for All, Sept 11-12 2014. Chulalongkorn University Bangkok, Thailand. Ichiro Miyazawa, Program Specialist UNESCO Bangkok. Key Point Why Lifelong Learning? - PowerPoint PPT PresentationTRANSCRIPT
Trends and Prospects:Lifelong Learning in Digital Era
The 2nd International Conference on Lifelong Learning for All, Sept 11-12 2014
Chulalongkorn UniversityBangkok, Thailand
Ichiro Miyazawa, Program Specialist
UNESCO Bangkok

1. Key Point 2. Why Lifelong Learning? 3. What are shifts in work and
life? 4. How could Lifelong learning
support?
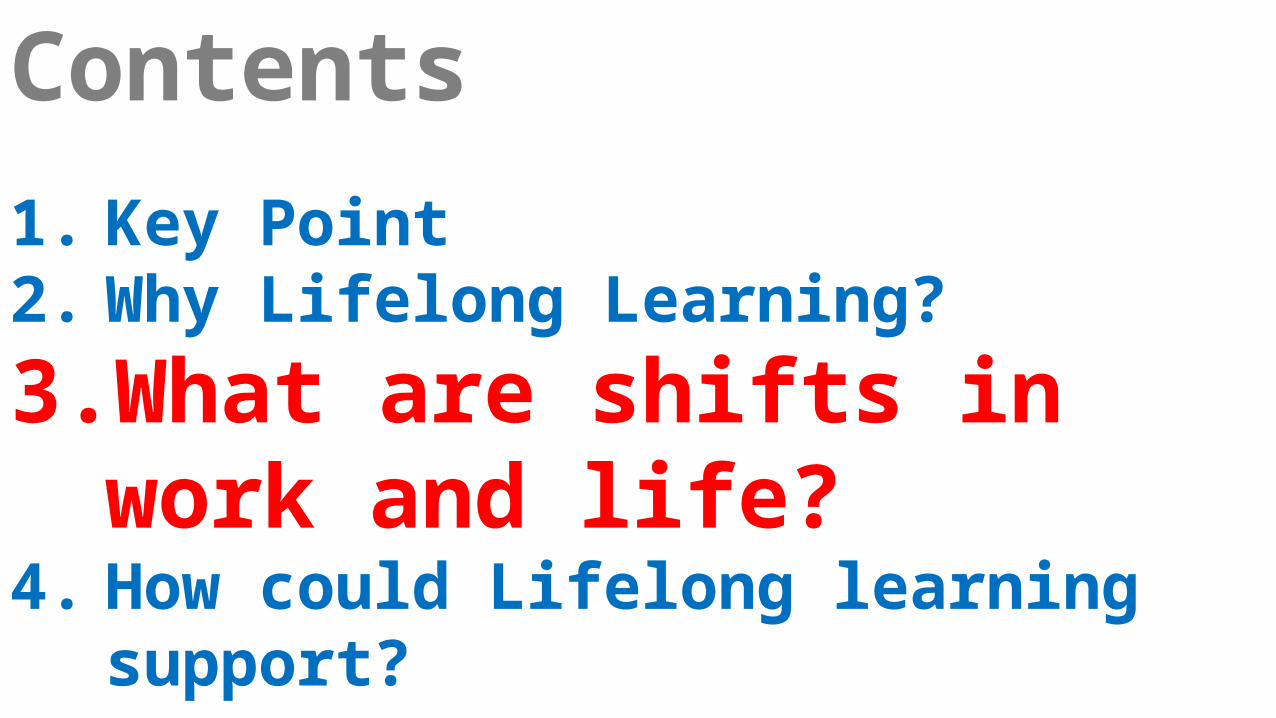
Contents

1.Key Point 2. Why Lifelong Learning? 3. What are shifts in work and
life? 4. How could Lifelong learning
support?
Contents

Lifelong Learning 4
LIFE
WORK

1. Key Point
2.Why Lifelong Learning? (Background and Reality)
3. What are shifts in work and life?
4. How could Lifelong learning support?
Contents

2.1 Economic/social progress and implications
2.2 Demographic dynamics and challenges
2.3 Conflicts and Natural disasters
2.4 Technological Shifts
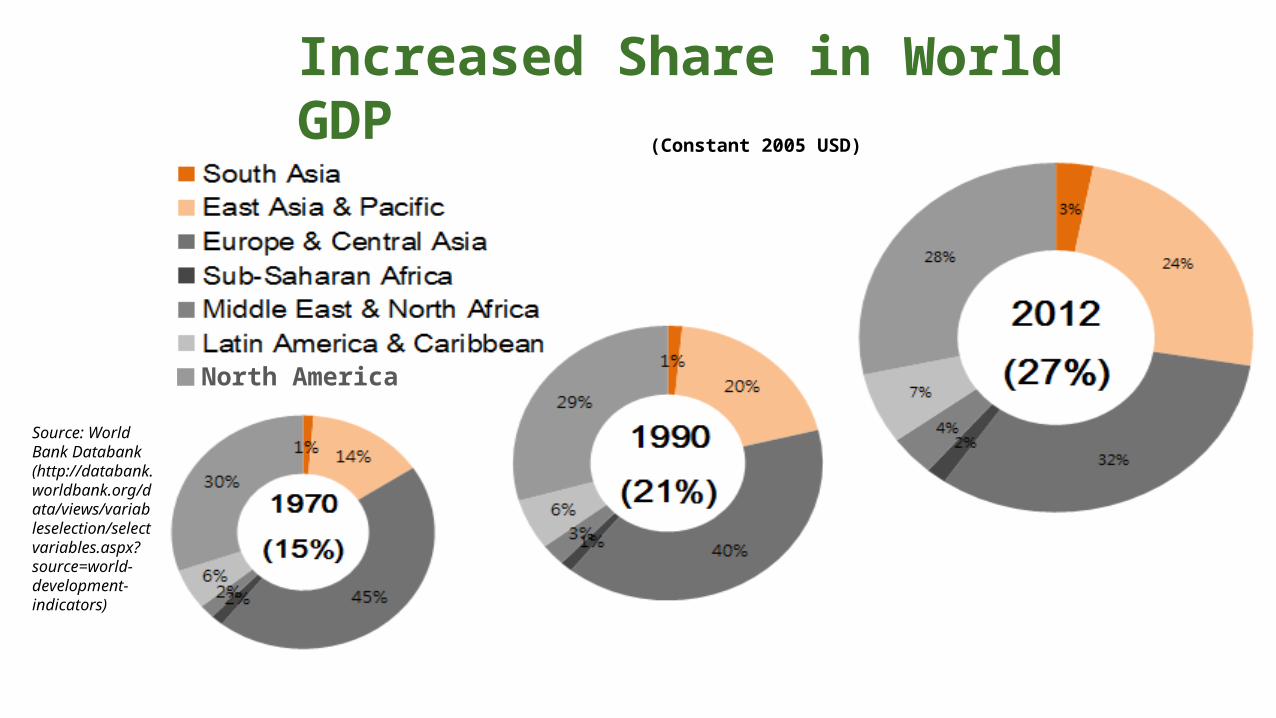
(Constant 2005 USD)
North America
Increased Share in World GDP
Source: World Bank Databank (http://databank.worldbank.org/data/views/variableselection/selectvariables.aspx?source=world-development-indicators)
6

Asian Resilience in Recent Economic Crises
Source: International Monetary Fund (2014), IMF Working Paper WP/14/38: Why Was Asia Resilient? Lessons from the Past and for the Future. (http://www.imf.org/external/pubs/ft/wp/2014/wp1438.pdf)
Real GDP, 2012H1 (Percentage points, relative to pre-crisis peak)
8

The middle class in the Asia-Pacific is projected to continue to grow
Source: Brookings Institution (2012)
Rising Middle Class Population11
10
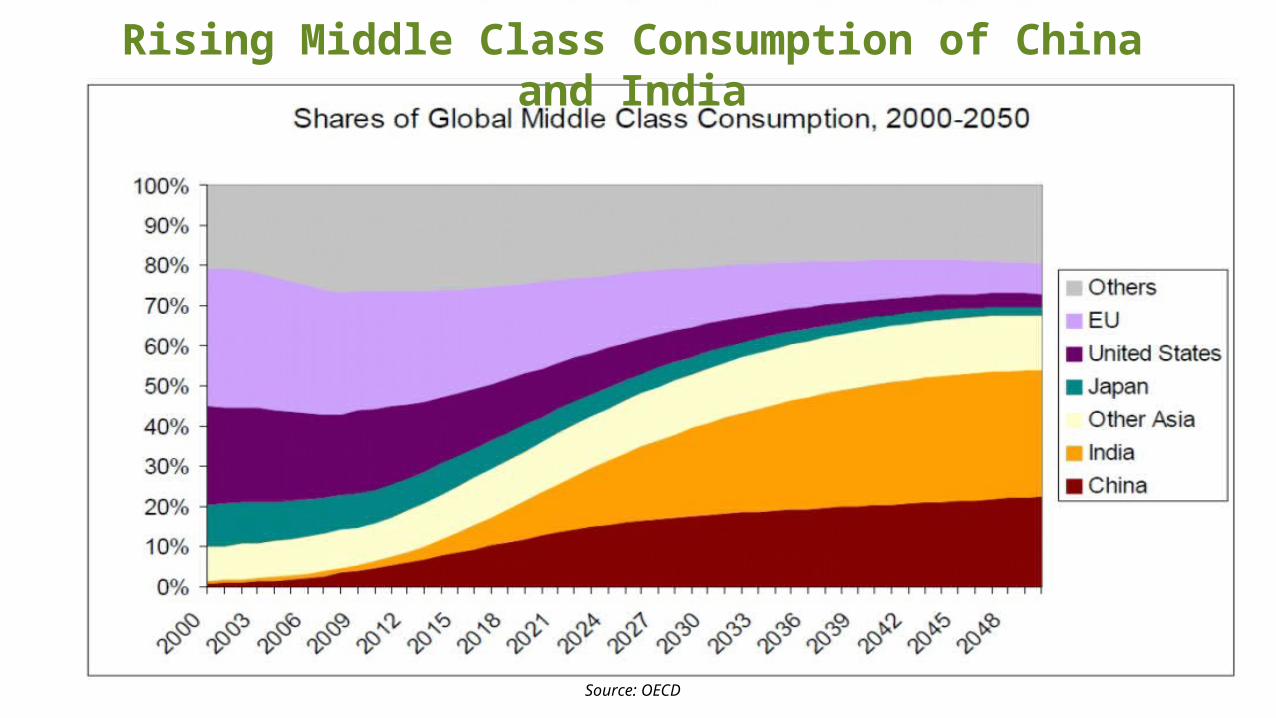
Source: OECD
Rising Middle Class Consumption of China and India

Source: Brookings Institution (2012)
Countries in Asia Pacific have seen widening income disparities.
Income inequality is a problem that many developed countries face as well.
Large shifts in the GINI coefficient14

12
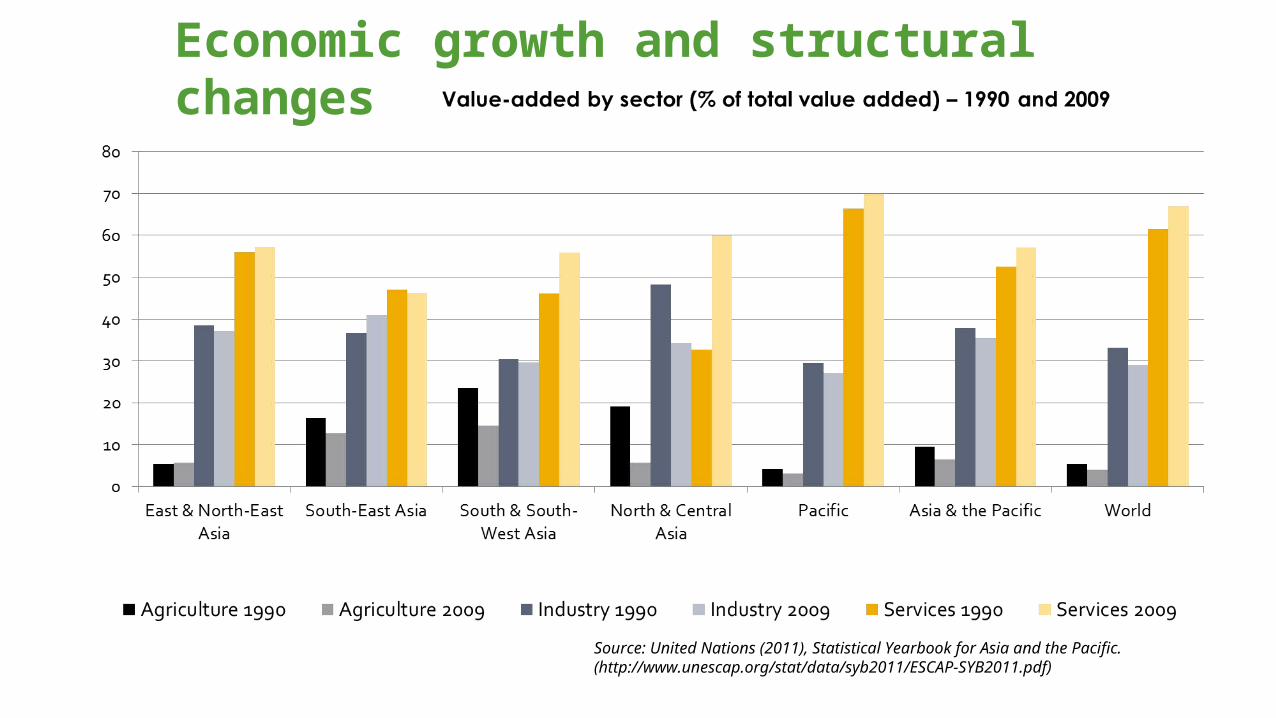
Economic growth and structural changes
Source: United Nations (2011), Statistical Yearbook for Asia and the Pacific. (http://www.unescap.org/stat/data/syb2011/ESCAP-SYB2011.pdf)
9

Source: ILO (2011), Global Employment Trends. (http://www.ilo.org/wcmsp5/groups/public/@dgreports/@dcomm/@publ/documents/publication/wcms_150440.pdf)
Agriculture Industry Services Level Change Level Change Level ChangeWORLD 35.0 -5.2 21.8 1.2 43.2 4.0
Developed Economies & EU 3.7 -1.9 23.4 -4.1 72.8 6.0Central and South-Eastern Europe (non-EU) and Commonwealth of Independent
States 20.1 -6.9 24.6 0.2 55.2 6.7
East Asia 36.9 -11.0 27.8 4.0 35.3 7.0
Southeast Asia & the Pacific 44.3 -5.1 17.7 1.8 38.0 3.3
South Asia 53.5 -6.0 18.9 3.4 27.6 2.6
Latin America & Caribbean 16.3 -5.2 22.2 0.7 61.6 4.5
Middle East 19.1 -3.0 26.1 0.2 54.8 2.8
North Africa 27.8 -1.5 22.5 2.0 49.7 -0.5Sub-Saharan Africa 59.0 -3.4 10.6 1.8 30.4 1.6
Share of Employment by Sector (% (2009), % change past decade (1999-2009))
Structural shifts in the economy across Asia10

Jobless Recovery

2-2. Demographic dynamics, challenges and migration
16
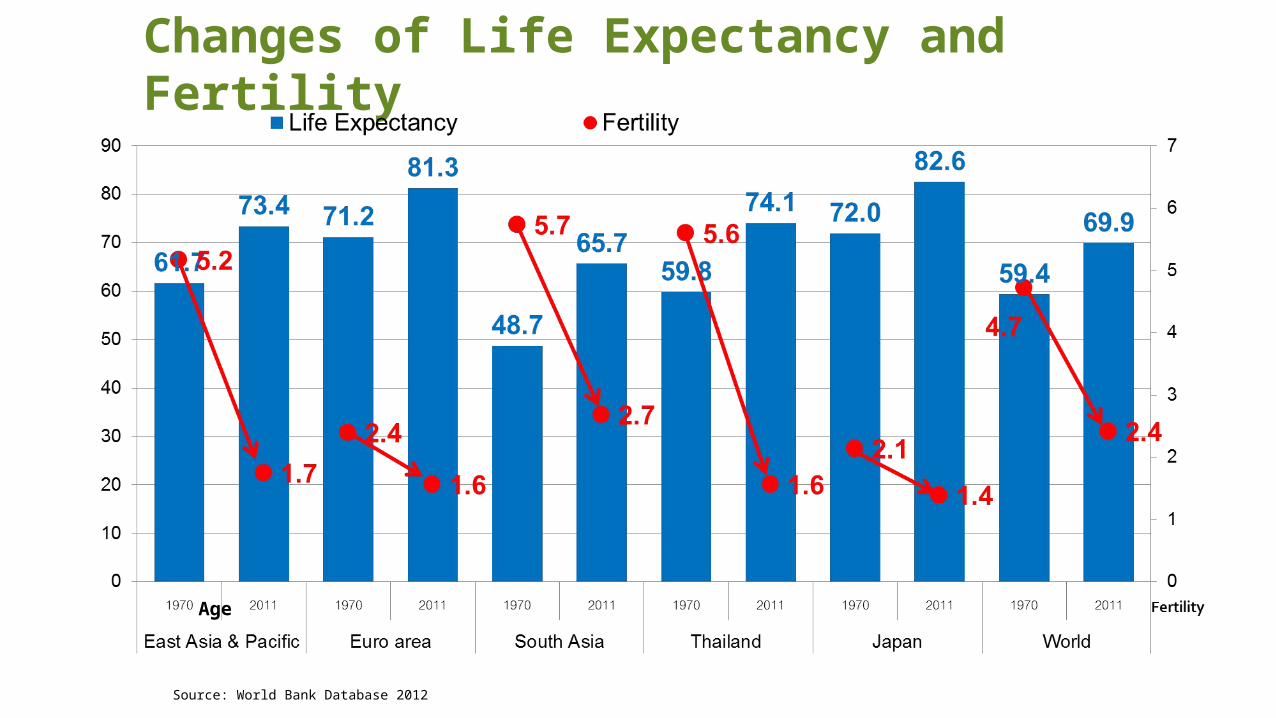
Changes of Life Expectancy and Fertility
Source: World Bank Database 2012
Age

Source : UNESCAP (2013), Statistical Yearbook for Asia and the Pacific 2013. (http://www.unescap.org/stat/data/syb2013/ESCAP-syb2013.pdf)
Population Pyramid Across Time: Aging Asia-Pacific24

Dependency Ratio (%)
Source: World Development Indicators.
(%under 15) +
( %over 65 )
% between 15
and 65
X
100=

Migration: Facts
214 million
Estimated number of international migrants worldwide The total number of international migrants has increased over the last 10 years from an estimated 150 million in 2000 to 214 million persons today.
3.1%Percentage of the world's population who are migrants In other words, one of out of every 33 persons in the world today is a migrant (whereas in 2000 one out of every 35 persons was a migrant).
5thMigrants would constitute the fifth most populous country in the world
Source: United Nations Department of Economic and Social Affairs (UN DESA), IOM World Migration Report 2010

Mobility and migration of international migrants
Source: IOM (2012), Global estimates and trends: Facts and figures. (http://www.iom.int/jahia/Jahia/about-migration/facts-and-figures/lang/en) UNDP (2009), Human Development Report 2009 – Overcoming barriers: Human Mobility and development.
Origin and destination of international migrants
25

2.3 Conflicts and Natural Disasters

Armed conflicts
Armed Conflicts in the Asia and Pacific Region (2014)
Source: conflicstmap.org

Source: Peace and Conflict 2012


Source: UNESCAP (2013), Statistical Yearbook for Asia and the Pacific 2013. (http://www.unescap.org/stat/data/syb2013/ESCAP-syb2013.pdf)
Number of the occurrence of natural disasters over time
Natural disasters around the globe: how is Asia-Pacific doing?33

2.4 Technological Shifts

Source: Measuring the Information Society, ITU, 2012
2.3 Billion Internet
users
6 Billion mobile phone
subscribers
Connecting the world through ICT

By 2020, the primary device for Internet is the Mobile Device
Source: Future of the Internet report, 2008
By 2025, 5 Billion people will be connected
Source: Monitor Group's Global Business Network and Cisco, 2012

Digital Divide: Households with Internet Usage
Source : ITU (2013), The world in 2013: ICT facts and figures.
*CIS refers to Commonwealth of Independent States (e.g. Russia and Armenia)
29

Source: Singularity is Near http://www.singularity.com/charts/page70.html


33


35


YES, Android took/will take our Jobs
http://youtu.be/cXQrbxD9_Ng
Andrew McAfee: What will future jobs look like?
1. Key Point 2. Why Lifelong Learning?
3.What are shifts in work and life?
4. How could Lifelong learning support?
Contents


41
42
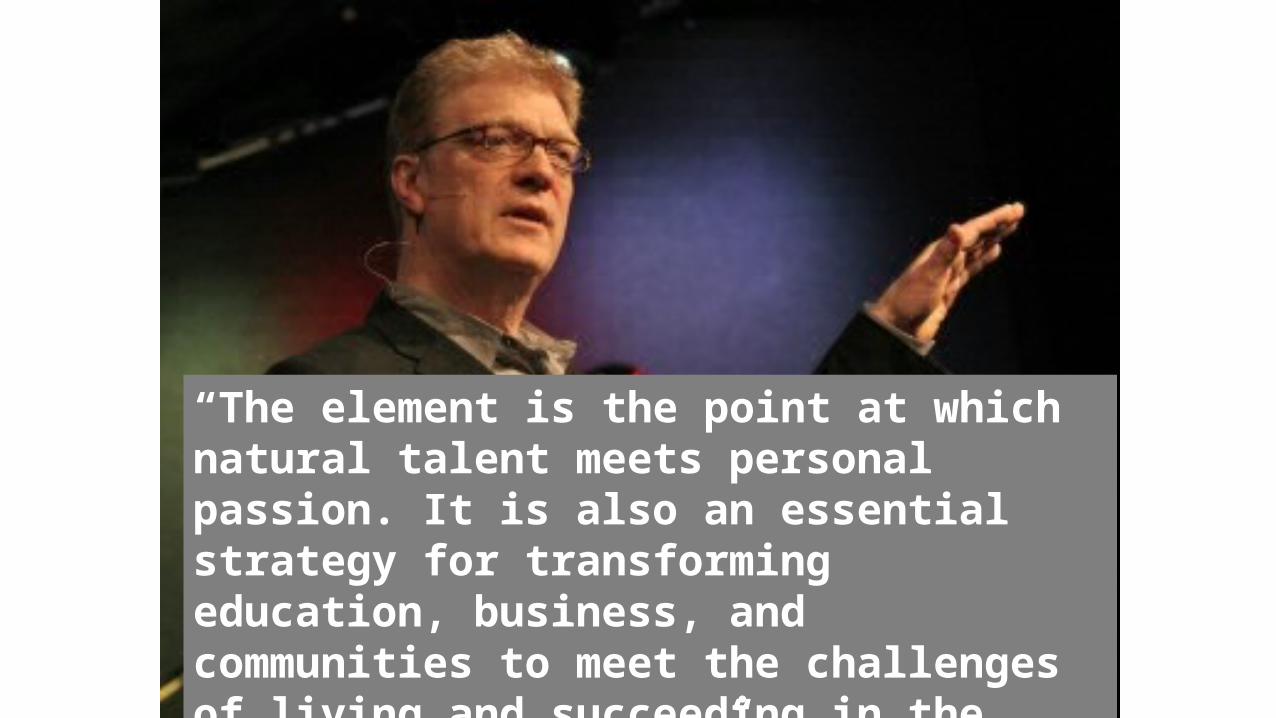
“The element is the point at which natural talent meets personal passion. It is also an essential strategy for transforming education, business, and communities to meet the challenges of living and succeeding in the twenty-first century”
Ken Robinson

Maslow’s Hierarchy of Needs

44

45Consumption Society New Society
Motivation Physiological/Esteem Self actualization and Contribution to people/society
Value Consumption/ Competition
Creation/Collaboration
Main Player Big Company/Organization
Individual/Small team/Small Organization
Individual Consumers and Investors Creator/Maker/Citizen
Job opportunity Less Many
Production Model
Mass Production Flexible and Adaptable Production
Start up Money Community/Social Capital
Work and Life Community and Global Glocal Source: Hiroyuki Naganuma, Work Design 2013

1. Key Point 2. Why Lifelong Learning? 3. What are shifts in work and
life?
4.How could Lifelong learning support?
Contents

4.1 Trends in Lifelong Learning in Formal Education System

Higher Education
Source: UNESCO (2014), EFA Global Monitoring Report 2013/4. (http://unesdoc.unesco.org/images/0022/002256/225660e.pdf) UIS (http://data.uis.unesco.org/index.aspx?queryid=142&lang=en)
South and West Asia
Central AsiaEast Asia and the
PacificWorld
Indicator 1999 2010 1999 2010 1999 2010 1999 2010Gross enrolment ratio (%)
- 17 19 24 13 29 18 29
Gender parity index - 0.76 0.92 1.09 0.76 1.05 0.99 1.08G.J. Kim Asian Education in a Changing World: Emerging Trends and Policy Responses 12 June 2014
46

Gross enrolment ratios for Bachelor’s programmes by country or territory, 1980-2011
Source: UNESCO UIS (2014), Higher Education in Aisa
• Most middle and low income countries in the region have made much progress in widening access to Bachelor’s degree programmes
• In China, Lao PDR, Malaysia, Nepal and Sri Lanka, the gross enrollment ratios for Bachelor’s programmes have increased over 10 times over the past four decades
Access to higher education has expanded
Lao P
DR
Bh
uta
n
Pakis
tan
Ban
gla
desh
Bru
nei
Daru
ssala
m
Ch
ina
Myan
mar
Cam
bod
ia
Sri
Lan
ka
Ind
ia
Nep
al
Tim
or-
Leste
Ind
on
esia
Mala
ysia
Ph
ilip
pin
es
Ch
ina,
Hon
g
Kon
g
Iran
, Is
lam
ic
Rep
.
Th
ail
an
d
Ch
ina,
Macao
Jap
an
Kore
a,
Rep
.
49

Higher Education Graduates by Field
Source: UIS (2012), Global Education Digest 2012 – Opportunities lost: The impact of grade repetition and early school leaving.
Graduates by field as a percentage of total graduates (2010)
Australia Brunei CambodiaMacau, China
JapanLao PDR
Malaysia
New Zealan
d
Republic of
Korea
Viet Nam
Agriculture 1 - 2 - 3 6 1 1 1 8Engineering, manufacturing & construction
8 10 3 2 17 14 24 6 24 17
Humanities and arts 10 9 14 7 15 12 4 14 18 4Social science, business and law
44 12 66 64 27 51 31 32 21 33
Health and welfare 15 11 3 6 13 4 8 13 14 4Science 10 12 9 3 3 7 14 13 8 -Services 3 - - 13 9 5 3 4 6 3Education 9 42 2 5 7 1 17 12 8 28Not known or unspecified
- 4 - - 7 - 1 5 - 4
G.J. Kim Asian Education in a Changing World: Emerging Trends and Policy Responses 12 June 2014
48

• Across the region, many governments allowed and encouraged the expansion of private higher education in an effort to shift students away from the heavily-subsidized public sector.
• Some countries, such as Indonesia, Japan, the Philippines and the Republic of Korea, have a strong tradition of private higher education where the majority of students attend private institutions.
Source: UNESCO UIS (2014), Higher Education in Asia
Enrolment in private higher education institutions as a percentage of total higher education enrolment by country or territory, 2011 or most recent year available
Expansion of Private Higher Education
Korea, Rep.
Japan
Singapore
China, Macao
Philippines
Nepal
Indonesia
Cambodia
Bangladesh
Iran, Islamic Rep.
Timor-Leste
Malaysia
Pakistan
Lao PDR
Thailand
China, Hong Kong
Viet Nam
Brunei Darussalam
Afghanistan
51

School Expectancy Per Country
Source: UIS (2012), UNESCO Institute for Statistics database.
50

Basic Education
Higher Secondar
y
TVET/ Polytec
h
Bachelor
Master/
Doctor
Lifelong learning course
Working Experien
ces
Working experience and Non/In formal
Education
National Qualifications Frameworks and Lifelong Learning

MOOC?

Advantages
• Free • Anytime and
anywhere • Access to the top
quality lesson • Learn at own pace • Collaboration among
peers in/over the country/ies
Disadvantages
• No real world socialization • Risk of academic
dishonesty • Not all courses
accredited• Some course in poor
quality • No guidance for
students • Drop out
http://www.onlineuniversities.com/blog/2012/10/all-you-can-eat-education-30-month/http://www.onlinecolleges.net/2012/07/11/the-world-of-massive-open-online-courses/

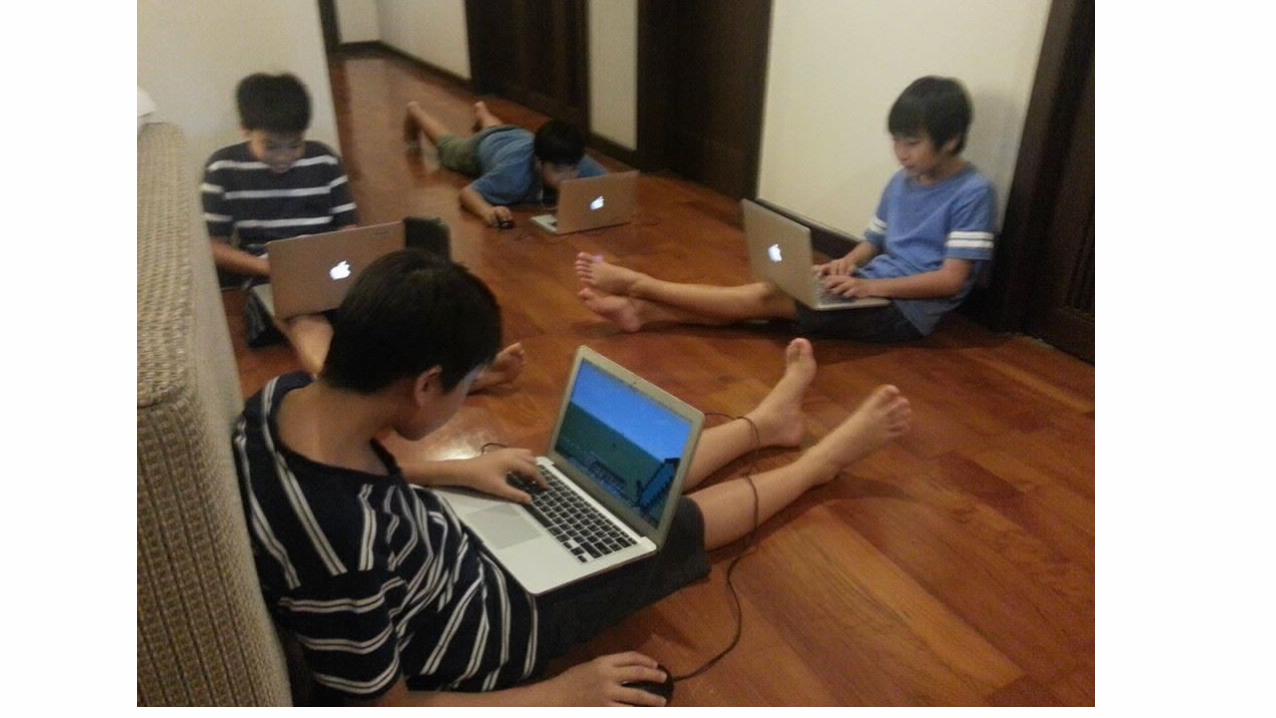
4.2 Connected Lifelong Learning
1) Collaborative Connected Learning
2) Issue-based Learning/Doing 3) AI and Big Data
57

Social Learning/Connected Learning

59

60

61

France No teacher
Issue based learning

63
School without a teacher

How could we make information more accessible to all who wish to learn and get connected?

How can we use AI and Big Data to find our passion, curiosity, life-purpose, and competency?
