trends in admissions and releases, 1991–2012 · 2014-09-15 · u.s. department of justice...
TRANSCRIPT
U.S. Department of JusticeOffice of Justice ProgramsBureau of Justice Statistics
BJS
Bu
lletin
December 2013, NCJ 243920
Prisoners in 2012Trends in Admissions and Releases, 1991–2012
E. Ann Carson and Daniela Golinelli, BJS Statisticians
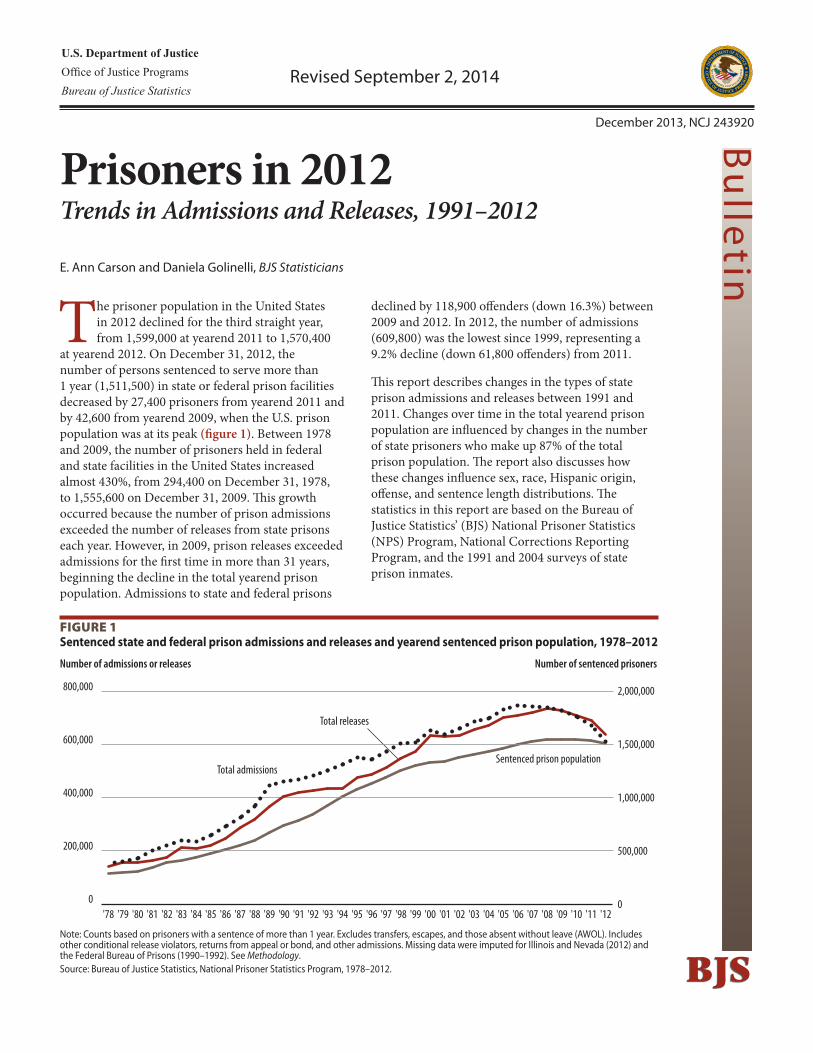
The prisoner population in the United States in 2012 declined for the third straight year, from 1,599,000 at yearend 2011 to 1,570,400
at yearend 2012. On December 31, 2012, the number of persons sentenced to serve more than 1 year (1,511,500) in state or federal prison facilities decreased by 27,400 prisoners from yearend 2011 and by 42,600 from yearend 2009, when the U.S. prison population was at its peak (figure 1). Between 1978 and 2009, the number of prisoners held in federal and state facilities in the United States increased almost 430%, from 294,400 on December 31, 1978, to 1,555,600 on December 31, 2009. This growth occurred because the number of prison admissions exceeded the number of releases from state prisons each year. However, in 2009, prison releases exceeded admissions for the first time in more than 31 years, beginning the decline in the total yearend prison population. Admissions to state and federal prisons
declined by 118,900 offenders (down 16.3%) between 2009 and 2012. In 2012, the number of admissions (609,800) was the lowest since 1999, representing a 9.2% decline (down 61,800 offenders) from 2011.
This report describes changes in the types of state prison admissions and releases between 1991 and 2011. Changes over time in the total yearend prison population are influenced by changes in the number of state prisoners who make up 87% of the total prison population. The report also discusses how these changes influence sex, race, Hispanic origin, offense, and sentence length distributions. The statistics in this report are based on the Bureau of Justice Statistics’ (BJS) National Prisoner Statistics (NPS) Program, National Corrections Reporting Program, and the 1991 and 2004 surveys of state prison inmates.
0
500,000
1,000,000
1,500,000
2,000,000
Sentenced prison population
Number of sentenced prisonersNumber of admissions or releases
0
200,000
400,000
600,000
800,000
Total releases
Total admissions
'12'11'10'09'08'07'06'05'04'03'02'01'00'99'98'97'96'95'94'93'92'91'90'89'88'87'86'85'84'83'82'81'80'79'78
Figure 1Sentenced state and federal prison admissions and releases and yearend sentenced prison population, 1978–2012
Note: Counts based on prisoners with a sentence of more than 1 year. Excludes transfers, escapes, and those absent without leave (AWOL). Includes other conditional release violators, returns from appeal or bond, and other admissions. Missing data were imputed for Illinois and Nevada (2012) and the Federal Bureau of Prisons (1990–1992). See Methodology.Source: Bureau of Justice Statistics, National Prisoner Statistics Program, 1978–2012.
Revised September 2, 2014
PRISONERS IN 2012: TRENDS IN ADMISSIONS AND RELEASES, 1991–2012 | DECEMBER 2013 2
The drop in state prison admissions drove the overall decline in U.S. prison admissions in 2012
Admissions to U.S. prisons in 2012 declined by 61,800 offenders (9.2%) from 2011, the sixth year in which the number of admissions has decreased. Admissions declined from a high of 747,000 in 2006 to 609,800 in 2012 (table 1). Both state departments of corrections and the Federal Bureau of Prisons admitted fewer inmates in 2012 than in 2011, although the decline in admissions to state prisons (down 57,100) accounted for 92% of the total decrease. The number of admissions to state prisons in 2012 (553,800) is the lowest since 1997. The highest number of admissions to federal prisons occurred in 2011 (60,600 admissions). In 2012, federal prison admissions decreased by 4,700 admissions or 7.7%.
Admissions or entries to prison for violating conditional release from prison, typically referred to as parole violation admissions (which also include new crimes committed while serving a term of parole), represented 16% of all state prison admissions and 10% of federal prison admissions in 1978. This type of admission increased over the following years.
Admissions for new crimes (82% of all state admissions in 1978) reached a low of 57% in 2000 before rebounding to 65% in 2011. New court commitments accounted for 71% of all state and 92% of federal prison entries in 2012. While the overall number of new court commitments to state prisons declined by 1.3% between 2011 and 2012, the proportion of this type of admissions increased due to a 26% decrease in the number of parole violation admissions.
About 8% (4,700 prisoners) of federal prison admissions in 2012 were prisoners returned for violating their conditional release. There were 52,400 fewer admissions due to parole violation to state prisons in 2012 than in 2011 (down 26%). Parole violation admissions accounted for 27% of the total state prison entries in 2012 down from 33% in 2011. This decrease can be attributed to the large decline in parole violation admissions in California, from 60,300 in 2011 to 8,000 in 2012. Overall, admissions to California prisons declined by 65% between 2011 and 2012, while entries on parole violations decreased by 87% (appendix table 1).
HIGHLIGHTS � In 2012, the number of admissions to state and federal
prison in the United States was 609,800 offenders, the lowest number since 1999.
� The number of releases from U.S. prisons in 2012 (637,400) exceeded that of admissions for the fourth consecutive year, contributing to the decline in the total U.S. prison population.
� The majority of state prisoners in 2011 (53%) were serving time for violent offenses.
� New court commitments made up 82% of state admissions in 1978, 57% in 2000, and 71% in 2012.
� New court commitments to state prisons for drug offenders decreased 22% between 2006 and 2011, while parole violation admissions decreased 31%.
� Between 1991 and 2011, new court commitments of females to state prison for violent offenses increased 83%, from 4,800 in 1991 to 8,700 in 2011.
� Drug offenses accounted for 24% of new court commitments of black inmates in 2011, a decrease from a range of 35% to 38% from 1991 to 2006.
� Since 1991, the proportion of newly admitted violent offenders receiving prison sentences of less than 5 years has increased.
� California’s Public Safety Realignment policy drove the decrease in the total number of admissions to California state prisons, as well as a decline in the proportion of admissions to California state prisons for parole violation (from 65% in 2010 to 23% in 2012).
� Prisoners age 44 and younger accounted for 80% of prison admissions, 77% of releases, and 72% of the yearend population in 2012.
� The number of prisoners sentenced to more than 1 year under state or federal correctional authorities in 2012 was 1,511,500, down from 1,538,800 at yearend 2011.
Revised September 2, 2014

PRISONERS IN 2012: TRENDS IN ADMISSIONS AND RELEASES, 1991–2012 | DECEMBER 2013 3
Table 1 Sentenced state and federal prison admissions, by type of admission, 1978–2012
All admissionsa New court commitments Parole violationsb
Year Total Federal State Total Federal State Total Federal State1978 152,039 14,724 137,315 126,121 13,247 112,874 23,844 1,429 22,4151979 161,280 14,120 147,160 131,057 12,619 118,438 25,668 1,454 24,2141980 171,884 12,598 159,286 142,122 10,907 131,215 28,817 1,640 27,1771981 199,943 12,830 187,113 160,272 11,086 149,186 35,674 1,709 33,9651982 218,087 14,818 203,269 177,109 12,461 164,648 39,003 2,317 36,6861983 237,925 16,745 221,180 187,408 14,119 173,289 45,568 2,583 42,9851984 234,293 16,013 218,280 180,418 13,491 166,927 52,007 2,475 49,5321985 258,514 17,916 240,598 198,499 15,368 183,131 58,694 2,502 56,1921986 291,903 18,501 273,402 219,382 16,067 203,315 71,184 2,401 68,7831987 326,228 18,709 307,519 241,887 16,260 225,627 82,959 2,435 80,5241988 365,724 18,696 347,028 261,242 15,932 245,310 101,354 2,744 98,6101989 447,388 23,491 423,897 316,215 18,388 297,827 122,156 1,611 120,5451990c 462,500 / 460,739 328,300 / 323,069 133,600 / 133,8701991c 468,000 / 466,285 322,500 / 317,237 141,800 / 142,1001992c 482,400 / 480,676 339,600 / 334,301 141,700 / 141,9611993 500,335 25,235 475,100 341,722 23,653 318,069 147,712 1,346 146,3661994 523,577 27,271 496,306 345,035 23,956 321,079 170,974 3,146 167,8281995 549,313 27,337 521,976 361,464 23,972 337,492 178,641 2,915 175,7261996 542,863 30,239 512,624 353,893 27,346 326,547 175,311 2,672 172,6391997 572,281 33,906 538,375 365,085 30,560 334,525 189,765 3,106 186,6591998 603,510 38,219 565,291 381,646 34,376 347,270 209,782 3,630 206,1521999 606,728 41,972 564,756 375,796 37,455 338,341 202,163 4,292 197,8712000 654,534 43,732 610,802 389,734 39,303 350,431 207,755 4,186 203,5692001 638,978 45,140 593,838 405,422 40,193 365,229 220,064 4,720 215,3442002 660,576 48,144 612,432 433,959 42,303 391,656 213,455 5,600 207,8552003 686,471 52,288 634,183 445,556 45,713 399,843 205,062 6,357 198,7052004 697,066 52,982 644,084 457,096 45,796 411,300 226,211 7,178 219,0332005 730,141 56,057 674,084 470,149 48,723 421,426 239,560 7,331 232,2292006 747,031 57,495 689,536 492,315 50,204 442,111 246,571 7,286 239,2852007 742,875 53,618 689,257 479,710 48,691 431,019 252,775 4,924 247,8512008 738,631 53,662 684,969 477,100 49,270 427,830 253,035 4,390 248,6452009 728,686 56,153 672,533 474,997 51,524 423,473 242,347 4,628 237,7192010 703,798 54,121 649,677 458,360 49,515 408,845 231,917 4,606 227,3112011d 671,551 60,634 610,917 454,526 55,817 398,709 205,297 4,816 200,4812012d,e 609,781 55,938 553,843 444,591 51,241 393,350 152,780 4,696 148,084/Not reported.aCounts based on prisoners with a sentence of more than 1 year. Excludes transfers, escapes, and those absent without leave (AWOL). Totals for all admissions include other conditional release violations, returns from appeal or bond, and other admissions. See Methodology.bIncludes all conditional release violators returned to prison for either violations of conditions of release or for new crimes.cThe Federal Bureau of Prisons did not report admission data. National totals include an imputed count for BOP admissions.dAlaska did not report type of admission. State and national totals for all admissions include Alaska counts, but totals for admission types do not.eMissing 2012 data were imputed for Illinois and Nevada.Source: Bureau of Justice Statistics, National Prisoner Statistics Program, 1978–2012.

PRISONERS IN 2012: TRENDS IN ADMISSIONS AND RELEASES, 1991–2012 | DECEMBER 2013 4
Releases from state prison in 2012 exceeded admissions for the fourth consecutive year, contributing to the decline in the total prison population
Although the number of releases or exits from U.S. prisons declined 7.7% between 2011 and 2012, releases exceeded the number of prison admissions (table 2). Total U.S. and state prison releases have outpaced admissions since 2009. The decline in releases from state prison offset the increase in exits from federal prison. State prisons released 54,500 fewer inmates in 2012 than in 2011. However, 27 states had an
increase in the number of releases from 2011 to 2012, led by Colorado (up 17%), Hawaii and Massachusetts (up 16% each), Idaho (up 13%), and Nebraska (up 12% ) (appendix table 1).
The number of releases from California state prisons declined by 62,000 offenders (down 57%), from 109,500 in 2011 to 47,500 in 2012. Twenty-three other states released fewer inmates from prison in 2012 compared to 2011, including New Hampshire (down 17%), Arkansas (down 13%), Oklahoma (down 10%), Nevada (down 9%), and Georgia and Michigan (down 8% each).
Table 2Sentenced state and federal prison releases, by type of release, 1978–2012
All releasesa Conditional releasesb Unconditional releasesc
Year Total Federal State Total Federal State Total Federal State1978 142,033 17,361 124,672 107,691 9,651 98,040 25,902 4,146 21,7561979 154,277 18,518 135,759 117,135 10,442 106,693 26,754 4,493 22,2611980 157,604 14,748 142,856 122,952 8,252 114,700 25,915 3,647 22,2681981 162,294 11,715 150,579 124,415 6,431 117,984 27,901 3,396 24,5051982 174,808 13,373 161,435 140,179 7,086 133,093 28,913 4,862 24,0511983 212,302 14,415 197,887 166,345 8,151 158,194 38,307 5,264 33,0431984 208,608 15,024 193,584 166,417 8,933 157,484 39,192 5,177 34,0151985 219,310 13,410 205,900 174,916 8,748 166,168 41,915 4,188 37,7271986 247,619 15,115 232,504 202,530 10,118 192,412 42,832 4,572 38,2601987 288,781 16,012 272,769 232,871 11,358 221,513 53,253 4,260 48,9931988 318,889 15,302 303,587 253,651 9,511 244,140 62,675 5,437 57,2381989 367,388 18,104 349,284 302,327 13,136 289,191 62,107 4,864 57,2431990d 404,000 / 403,777 337,000 / 339,439 57,900 / 55,2431991d 420,000 / 419,831 351,300 / 353,774 58,200 / 55,5791992d 428,300 / 428,110 355,300 / 357,731 61,100 / 58,4251993 434,082 18,676 415,406 355,773 5,742 350,031 69,636 12,801 56,8351994 434,766 21,062 413,704 353,020 4,790 348,230 72,836 15,986 56,8501995 474,296 22,292 452,004 374,483 3,747 370,736 88,081 18,054 70,0271996 488,748 24,647 464,101 369,808 3,176 366,632 103,435 19,699 83,7361997 514,322 27,280 487,042 386,076 2,445 383,631 109,896 22,294 87,6021998 546,616 29,239 517,377 406,050 2,148 403,902 126,086 23,939 102,1471999 574,624 31,816 542,808 420,306 1,919 418,387 128,923 26,089 102,8342000 635,094 35,259 599,835 426,617 1,991 424,626 148,336 29,180 119,1562001 628,626 38,370 590,256 438,449 2,234 436,215 162,007 31,715 130,2922002 633,947 42,339 591,608 443,996 3,154 440,842 161,293 33,904 127,3892003 656,574 44,135 612,439 444,771 2,603 442,168 163,607 36,221 127,3862004 672,202 46,624 625,578 483,215 2,488 480,727 166,862 43,715 123,1472005 701,632 48,323 653,309 497,475 2,105 495,370 179,651 45,708 133,9432006 709,874 47,920 661,954 499,950 1,746 498,204 193,720 45,749 147,9712007 721,161 48,764 672,397 505,726 1,545 504,181 199,393 46,804 152,5892008 734,144 52,348 681,796 505,350 1,225 504,125 216,036 50,708 165,3282009 729,749 50,720 679,029 505,504 1,479 504,025 211,324 49,208 162,1162,010 708,677 52,487 656,190 494,249 962 493,287 202,499 51,110 151,3892011e 691,072 55,239 635,833 474,681 649 474,032 202,602 54,163 148,4392012e,f 637,411 56,037 581,374 408,186 591 407,595 213,204 55,079 158,125/Not reported.aCounts based on prisoners with a sentence of more than 1 year. Excludes transfers, escapes, and those absent without leave (AWOL). Totals for all releases include deaths, releases to appeal or bond, and other releases. See Methodology.bIncludes releases to probation, supervised mandatory releases, and other unspecified conditional releases.cIncludes expirations of sentence, commutations, and other unconditional releases.dThe Federal Bureau of Prisons did not report release data. National totals include an imputed count for BOP releases.eAlaska did not report type of release. State and national totals for all releases include Alaska counts, but totals for release types do not.fMissing 2012 data were imputed for Illinois and Nevada.Source: Bureau of Justice Statistics, National Prisoner Statistics Program, 1978–2012.
PRISONERS IN 2012: TRENDS IN ADMISSIONS AND RELEASES, 1991–2012 | DECEMBER 2013 5
Releases from federal prisons increased by more than 1% in 2012, continuing a trend that started in 2009. The BOP released 56,000 inmates in 2012, which exceeded admissions by 100 inmates. This was the first year in more than a decade in which the federal system released more inmates than it admitted.
Conditional releases, including supervised mandatory releases, discretionary parole, and shock probation, continued a decline that started in 2009, decreasing 14% between 2011 and 2012. Federal prisons released 9% fewer inmates on conditional status in 2012 than in 2011 due to the decline in federal prison inmates sentenced before the Sentencing Reform Act of 1984, which abolished parole for federal prisoners. Conditional releases accounted for 1% of exits from federal prisons in 2012, compared to 70% of state prison releases. Since 1978, conditional releases accounted for 70% to 84% of state prison releases.
In comparison, the number of unconditional releases increased in both state and federal prison systems. State prisons had 6.5% (or 9,700) more unconditional releases in 2012 than in 2011, while these exits increased by 1.7% (or 900 inmates) in the federal system. In 2011, California released 13,700 inmates without conditions, which increased to about 29,500 offenders in 2012. Nationally, unconditional prison releases accounted for 33% of all exits, up from 29% in 2011.
Violent offenders accounted for a larger proportion of the state prison population between 1991 and 2011
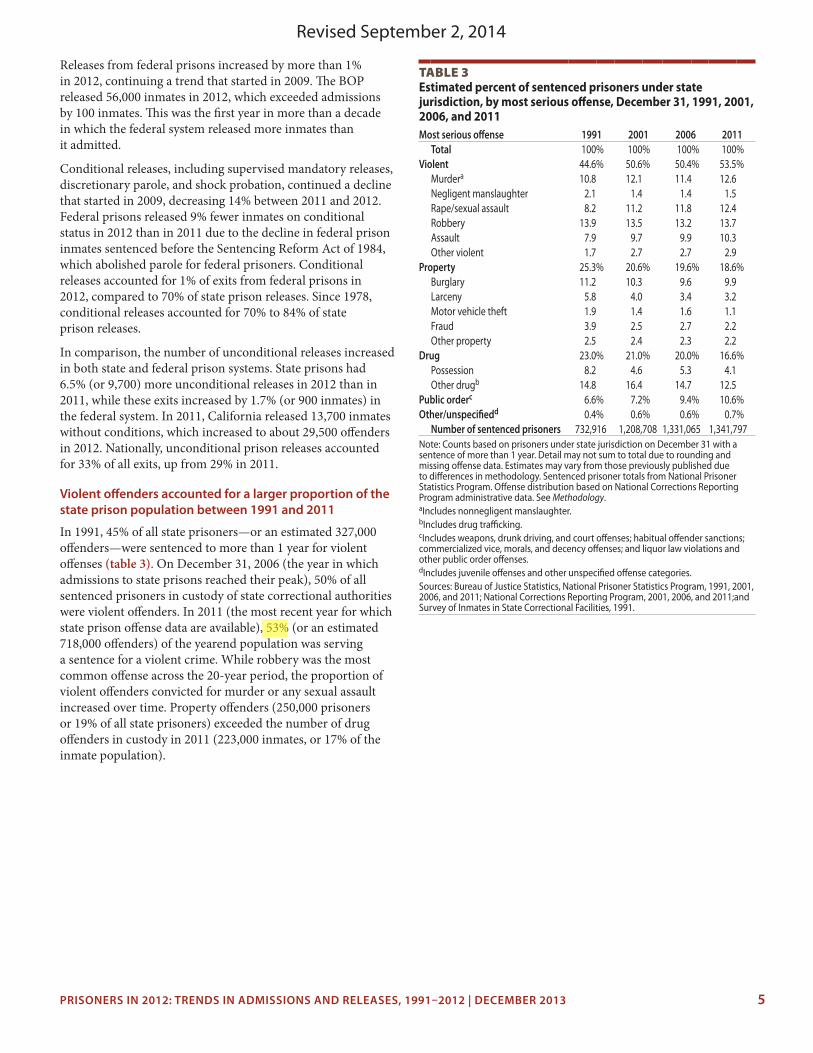
In 1991, 45% of all state prisoners—or an estimated 327,000 offenders—were sentenced to more than 1 year for violent offenses (table 3). On December 31, 2006 (the year in which admissions to state prisons reached their peak), 50% of all sentenced prisoners in custody of state correctional authorities were violent offenders. In 2011 (the most recent year for which state prison offense data are available), 53% (or an estimated 718,000 offenders) of the yearend population was serving a sentence for a violent crime. While robbery was the most common offense across the 20-year period, the proportion of violent offenders convicted for murder or any sexual assault increased over time. Property offenders (250,000 prisoners or 19% of all state prisoners) exceeded the number of drug offenders in custody in 2011 (223,000 inmates, or 17% of the inmate population).
Table 3Estimated percent of sentenced prisoners under state jurisdiction, by most serious offense, December 31, 1991, 2001, 2006, and 2011Most serious offense 1991 2001 2006 2011
Total 100% 100% 100% 100%Violent 44.6% 50.6% 50.4% 53.5%
Murdera 10.8 12.1 11.4 12.6Negligent manslaughter 2.1 1.4 1.4 1.5Rape/sexual assault 8.2 11.2 11.8 12.4Robbery 13.9 13.5 13.2 13.7Assault 7.9 9.7 9.9 10.3Other violent 1.7 2.7 2.7 2.9
Property 25.3% 20.6% 19.6% 18.6%Burglary 11.2 10.3 9.6 9.9Larceny 5.8 4.0 3.4 3.2Motor vehicle theft 1.9 1.4 1.6 1.1Fraud 3.9 2.5 2.7 2.2Other property 2.5 2.4 2.3 2.2
Drug 23.0% 21.0% 20.0% 16.6%Possession 8.2 4.6 5.3 4.1Other drugb 14.8 16.4 14.7 12.5
Public orderc 6.6% 7.2% 9.4% 10.6%Other/unspecifiedd 0.4% 0.6% 0.6% 0.7%
Number of sentenced prisoners 732,916 1,208,708 1,331,065 1,341,797Note: Counts based on prisoners under state jurisdiction on December 31 with a sentence of more than 1 year. Detail may not sum to total due to rounding and missing offense data. Estimates may vary from those previously published due to differences in methodology. Sentenced prisoner totals from National Prisoner Statistics Program. Offense distribution based on National Corrections Reporting Program administrative data. See Methodology.aIncludes nonnegligent manslaughter.bIncludes drug trafficking.cIncludes weapons, drunk driving, and court offenses; habitual offender sanctions; commercialized vice, morals, and decency offenses; and liquor law violations and other public order offenses.dIncludes juvenile offenses and other unspecified offense categories.Sources: Bureau of Justice Statistics, National Prisoner Statistics Program, 1991, 2001, 2006, and 2011; National Corrections Reporting Program, 2001, 2006, and 2011;and Survey of Inmates in State Correctional Facilities, 1991.
Revised September 2, 2014

PRISONERS IN 2012: TRENDS IN ADMISSIONS AND RELEASES, 1991–2012 | DECEMBER 2013 6
An increase in the number of admissions to state prisons for violent offenses contributed to the growth of these sentenced inmates in the yearend prison population. Fewer violent offenders than property and drug offenders were admitted in 1991, 2001, and 2006 (table 4), but by 2011, the estimated proportion of admissions for violent and property offenses was roughly equal. There were 78,600 fewer total admissions in 2011 than in 2006, and 65% of this decline (or an estimated 51,000 persons) was due to fewer admissions for drug crimes. A drop in the number of persons sentenced for drug crimes other than possession accounted for the majority (66%, or an estimated 33,600 persons) of the decrease in admissions for drug crimes between 2006 and 2011.
Table 4 Estimated state prison admissions, by most serious offense, 1991, 2001, 2006, and 2011Most serious offense 1991 2001 2006 2011
Total 100% 100% 100% 100%Violent 26.9% 27.3% 26.1% 29.1%
Murdera 2.6 2.1 1.7 2.0Negligent manslaughter 1.0 0.8 0.7 0.7Rape/sexual assault 4.9 5.2 5.1 5.4Robbery 10.5 8.5 7.0 8.0Assault 6.7 8.7 9.3 10.6Other violent 1.1 2.1 2.3 2.4
Property 35.4% 29.4% 29.1% 29.0%Burglary 16.1 11.4 10.7 12.4Larceny 9.4 7.5 6.6 6.1Motor vehicle theft 3.0 2.7 3.4 2.6Fraud 3.9 4.2 4.7 3.9Other property 2.9 3.6 3.7 4.0
Drug 28.3% 32.1% 29.9% 25.4%Possession 7.0 8.9 9.7 8.0Other drugb 21.3 23.3 20.2 17.3
Public orderc 7.8% 10.6% 14.4% 15.8%Other/unspecifiedd 1.6% 0.5% 0.6% 0.8%
Number of admissions 466,285 593,838 689,536 610,917Note: Counts based on prisoners with a sentence of more than 1 year admitted to state prison. Excludes transfers, escapes, and those absent without leave (AWOL). Detail may not sum to total due to rounding and missing offense data. Admission totals from National Prisoner Statistics Program. Offense distribution based on National Corrections Reporting Program administrative data. See Methodology. Estimates may vary from those previously published due to differences in methodology.aIncludes nonnegligent manslaughter.bIncludes drug trafficking.cIncludes weapons, drunk driving, and court offenses; habitual offender sanctions; commercialized vice, morals, and decency offenses; and liquor law violations and other public order offenses.dIncludes juvenile offenses and other unspecified offense categories.Sources: Bureau of Justice Statistics, National Prisoner Statistics Program and National Corrections Reporting Program, 1991, 2001, 2006, and 2011.

PRISONERS IN 2012: TRENDS IN ADMISSIONS AND RELEASES, 1991–2012 | DECEMBER 2013 7
Between 1991 and 2011, changes in state prison admission types were associated with changes in the offense distributions
As the distribution of types of admissions to state prison changed over time, so did the demographic and offense compositions of admitted prisoners. In 1991, new court commitments were almost equally distributed between violent, property, and drug offenses, while parole violation admissions of property offenders were almost twice the number of admissions for violent crimes or drug offenses (table 5). By 2001, the distribution between the three offense categories for parole violation admissions was more balanced, and drug offenders represented the largest proportion of both new court commitments and parole violation admissions.
The number of new admissions and readmissions for violent offenses increased between 1991 and 2006, but only due to the overall growth in state prison admissions. The proportion of violent offenders among new court commitment and parole violation admissions was stable until each increased by about 3% in 2011.
New court commitments of individuals committing drug offenses other than possession, a category that includes drug trafficking, decreased by 19% (or 16,300 inmates) between 2006 and 2011. The number of persons newly admitted to prison on drug possession sentences experienced a 27% decline during the same period, with an estimated 11,300 fewer new admissions. Parole violation admissions for drug offenders decreased 31% or 23,300 fewer readmissions.
Table 5 Estimated state prison admissions, by type of admission and most serious offense, 1991, 2001, 2006, and 2011
1991 2001 2006 2011
Most serious offenseaNew court commitment
Parole violationa
New court commitment
Parole violationa
New court commitment
Parole violationa
New court commitment
Parole violationa
Total 100% 100% 100% 100% 100% 100% 100% 100%Violent 28.7% 23.7% 29.4% 23.9% 27.3% 24.1% 30.0% 27.4%
Murderb 3.0 1.7 2.5 1.3 2.0 1.1 2.4 1.2Negligent manslaughter 1.3 0.5 1.0 0.4 0.8 0.4 0.8 0.3Rape/sexual assault 5.6 3.6 6.3 3.4 5.7 3.9 5.7 4.8Robbery 9.9 11.6 8.1 9.2 6.8 7.4 7.9 8.4Assault 7.5 5.5 9.2 7.9 9.5 9.1 10.7 10.5Other violent 1.4 0.7 2.3 1.8 2.4 2.1 2.5 2.2
Property 31.4% 42.4% 27.4% 32.5% 26.9% 33.3% 27.5% 32.4%Burglary 13.5 20.8 10.4 12.9 9.9 12.4 12.1 13.1Larceny 8.1 11.7 6.6 8.8 6.1 7.4 5.9 6.6Motor vehicle theft 2.4 4.1 2.0 3.9 2.4 5.4 1.7 4.9Fraud 3.8 4.1 4.7 3.3 4.9 4.1 4.1 3.4Other property 3.6 1.8 3.7 3.5 3.5 4.0 3.8 4.4
Drug 29.9% 25.5% 30.5% 35.1% 28.8% 31.7% 24.9% 26.2%Possession 6.9 7.0 8.7 9.1 9.6 9.7 7.8 8.7Other drugc 23.0 18.5 21.8 26.0 19.2 22.0 17.2 17.5
Public orderd 8.9% 6.1% 12.1% 8.0% 16.4% 10.3% 16.8% 13.2%Other/unspecifiede 1.1% 2.3% 0.6% 0.5% 0.6% 0.6% 0.8% 0.8%
Number of admissions 317,237 142,100 365,229 215,344 442,111 239,285 398,709 200,481Note: Based on prisoners with a sentence of more than 1 year admitted to state prison on a new court commitment or on a conditional release violation, either for a release condition violation or for a new crime. Detail may not sum to total due to rounding and missing offense data. Admission totals from National Prisoner Statistics Program. Offense distribution based on National Corrections Reporting Program administrative data. See Methodology. Estimates may vary from those previously published due to differences in methodology.aFor parole violation admissions, most serious offense refers to the original offense for which an inmate was sentenced, not the incident causing the parole revocation.bIncludes nonnegligent manslaughter.cIncludes drug trafficking.dIncludes weapons, drunk driving, and court offenses; habitual offender sanctions; commercialized vice, morals, and decency offenses; and liquor law violations and other public order offenses.eIncludes juvenile offenses and other unspecified offense categories.Sources: Bureau of Justice Statistics, National Prisoner Statistics Program and National Corrections Reporting Program, 1991, 2001, 2006, and 2011.
PRISONERS IN 2012: TRENDS IN ADMISSIONS AND RELEASES, 1991–2012 | DECEMBER 2013 8
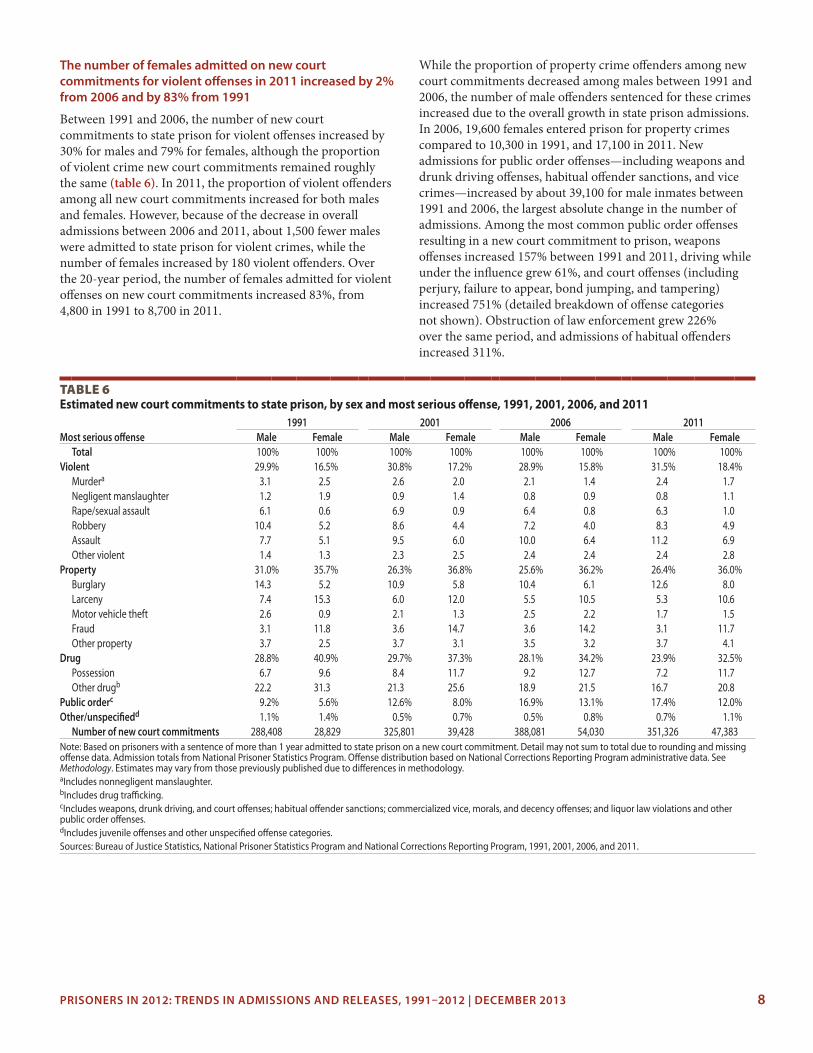
The number of females admitted on new court commitments for violent offenses in 2011 increased by 2% from 2006 and by 83% from 1991
Between 1991 and 2006, the number of new court commitments to state prison for violent offenses increased by 30% for males and 79% for females, although the proportion of violent crime new court commitments remained roughly the same (table 6). In 2011, the proportion of violent offenders among all new court commitments increased for both males and females. However, because of the decrease in overall admissions between 2006 and 2011, about 1,500 fewer males were admitted to state prison for violent crimes, while the number of females increased by 180 violent offenders. Over the 20-year period, the number of females admitted for violent offenses on new court commitments increased 83%, from 4,800 in 1991 to 8,700 in 2011.
While the proportion of property crime offenders among new court commitments decreased among males between 1991 and 2006, the number of male offenders sentenced for these crimes increased due to the overall growth in state prison admissions. In 2006, 19,600 females entered prison for property crimes compared to 10,300 in 1991, and 17,100 in 2011. New admissions for public order offenses—including weapons and drunk driving offenses, habitual offender sanctions, and vice crimes—increased by about 39,100 for male inmates between 1991 and 2006, the largest absolute change in the number of admissions. Among the most common public order offenses resulting in a new court commitment to prison, weapons offenses increased 157% between 1991 and 2011, driving while under the influence grew 61%, and court offenses (including perjury, failure to appear, bond jumping, and tampering) increased 751% (detailed breakdown of offense categories not shown). Obstruction of law enforcement grew 226% over the same period, and admissions of habitual offenders increased 311%.
Table 6 Estimated new court commitments to state prison, by sex and most serious offense, 1991, 2001, 2006, and 2011
1991 2001 2006 2011Most serious offense Male Female Male Female Male Female Male Female
Total 100% 100% 100% 100% 100% 100% 100% 100%Violent 29.9% 16.5% 30.8% 17.2% 28.9% 15.8% 31.5% 18.4%
Murdera 3.1 2.5 2.6 2.0 2.1 1.4 2.4 1.7Negligent manslaughter 1.2 1.9 0.9 1.4 0.8 0.9 0.8 1.1Rape/sexual assault 6.1 0.6 6.9 0.9 6.4 0.8 6.3 1.0Robbery 10.4 5.2 8.6 4.4 7.2 4.0 8.3 4.9Assault 7.7 5.1 9.5 6.0 10.0 6.4 11.2 6.9Other violent 1.4 1.3 2.3 2.5 2.4 2.4 2.4 2.8
Property 31.0% 35.7% 26.3% 36.8% 25.6% 36.2% 26.4% 36.0%Burglary 14.3 5.2 10.9 5.8 10.4 6.1 12.6 8.0Larceny 7.4 15.3 6.0 12.0 5.5 10.5 5.3 10.6Motor vehicle theft 2.6 0.9 2.1 1.3 2.5 2.2 1.7 1.5Fraud 3.1 11.8 3.6 14.7 3.6 14.2 3.1 11.7Other property 3.7 2.5 3.7 3.1 3.5 3.2 3.7 4.1
Drug 28.8% 40.9% 29.7% 37.3% 28.1% 34.2% 23.9% 32.5%Possession 6.7 9.6 8.4 11.7 9.2 12.7 7.2 11.7Other drugb 22.2 31.3 21.3 25.6 18.9 21.5 16.7 20.8
Public orderc 9.2% 5.6% 12.6% 8.0% 16.9% 13.1% 17.4% 12.0%Other/unspecifiedd 1.1% 1.4% 0.5% 0.7% 0.5% 0.8% 0.7% 1.1%
Number of new court commitments 288,408 28,829 325,801 39,428 388,081 54,030 351,326 47,383Note: Based on prisoners with a sentence of more than 1 year admitted to state prison on a new court commitment. Detail may not sum to total due to rounding and missing offense data. Admission totals from National Prisoner Statistics Program. Offense distribution based on National Corrections Reporting Program administrative data. See Methodology. Estimates may vary from those previously published due to differences in methodology.aIncludes nonnegligent manslaughter.bIncludes drug trafficking.cIncludes weapons, drunk driving, and court offenses; habitual offender sanctions; commercialized vice, morals, and decency offenses; and liquor law violations and other public order offenses.dIncludes juvenile offenses and other unspecified offense categories.Sources: Bureau of Justice Statistics, National Prisoner Statistics Program and National Corrections Reporting Program, 1991, 2001, 2006, and 2011.

PRISONERS IN 2012: TRENDS IN ADMISSIONS AND RELEASES, 1991–2012 | DECEMBER 2013 9
In 2001, 34% of male readmissions to state prison and 47% of female readmissions were sentenced drug offenders returning on parole violations (table 7). These proportions declined to 26% of males and 33% of females in 2011. For both males
and females, the proportion of readmissions to state prison for drug possession offenders increased in 2006 and then decreased in 2011 to levels comparable to those in 2001.
Table 7 Estimated parole violation admissions to state prison, by sex and most serious offense, 1991, 2001, 2006, and 2011
1991 2001 2006 2011Most serious offensea Male Female Male Female Male Female Male Female
Total 100% 100% 100% 100% 100% 100% 100% 100%Violent 24.5% 14.0% 25.0% 11.6% 25.2% 12.3% 28.4% 14.6%
Murderb 1.8 1.1 1.3 0.7 1.2 0.5 1.2 0.4Negligent manslaughter 0.5 0.5 0.4 0.3 0.4 0.5 0.3 0.3Rape/sexual assault 3.9 0.3 3.7 0.3 4.2 0.6 5.1 0.8Robbery 11.9 7.5 9.6 4.9 7.7 4.0 8.7 5.0Assault 5.6 4.0 8.3 3.9 9.5 4.6 10.8 6.4Other violent 0.7 0.6 1.8 1.5 2.1 2.2 2.2 1.7
Property 42.2% 45.2% 32.2% 36.0% 32.6% 40.8% 31.6% 42.5%Burglary 21.7 9.2 13.4 7.6 12.7 8.4 13.4 9.9Larceny 10.9 20.9 8.3 14.5 7.0 11.5 6.2 10.8Motor vehicle theft 4.3 1.5 4.1 2.2 5.5 4.8 4.9 4.5Fraud 3.4 12.5 2.7 9.2 3.4 12.1 2.8 11.6Other property 1.9 1.1 3.6 2.6 4.0 4.0 4.3 5.7
Drug 24.7% 35.8% 34.1% 46.6% 31.0% 39.5% 25.7% 33.2%Possession 6.6 11.3 8.9 11.6 9.4 13.1 8.5 11.6Other drugc 18.1 24.5 25.2 35.0 21.6 26.4 17.2 21.6
Public orderd 6.3% 3.3% 8.2% 5.2% 10.7% 6.7% 13.5% 8.7%Other/unspecifiede 2.3% 1.7% 0.5% 0.5% 0.6% 0.8% 0.8% 1.0%
Number of parole violation admissions 132,288 9,812 197,537 17,807 218,488 20,797 184,513 15,968Note: Based on prisoners with a sentence of more than 1 year returned to state prison on all conditional release violations for either violations of conditions of release, or for new crimes. Detail may not sum to total due to rounding and missing offense data. Admission totals from National Prisoner Statistics Program. Offense distribution based on National Corrections Reporting Program administrative data. See Methodology. Estimates may vary from those previously published due to differences in methodology.aFor parole violation admissions, most serious offense refers to the original offense for which an inmate was sentenced, not the incident causing the parole revocation.bIncludes nonnegligent manslaughter.cIncludes drug trafficking.dIncludes weapons, drunk driving, and court offenses; habitual offender sanctions; commercialized vice, morals, and decency offenses; and liquor law violations and other public order offenses.eIncludes juvenile offenses and other unspecified offense categories.Sources: Bureau of Justice Statistics, National Prisoner Statistics Program and National Corrections Reporting Program, 1991, 2001, 2006, and 2011.
PRISONERS IN 2012: TRENDS IN ADMISSIONS AND RELEASES, 1991–2012 | DECEMBER 2013 10
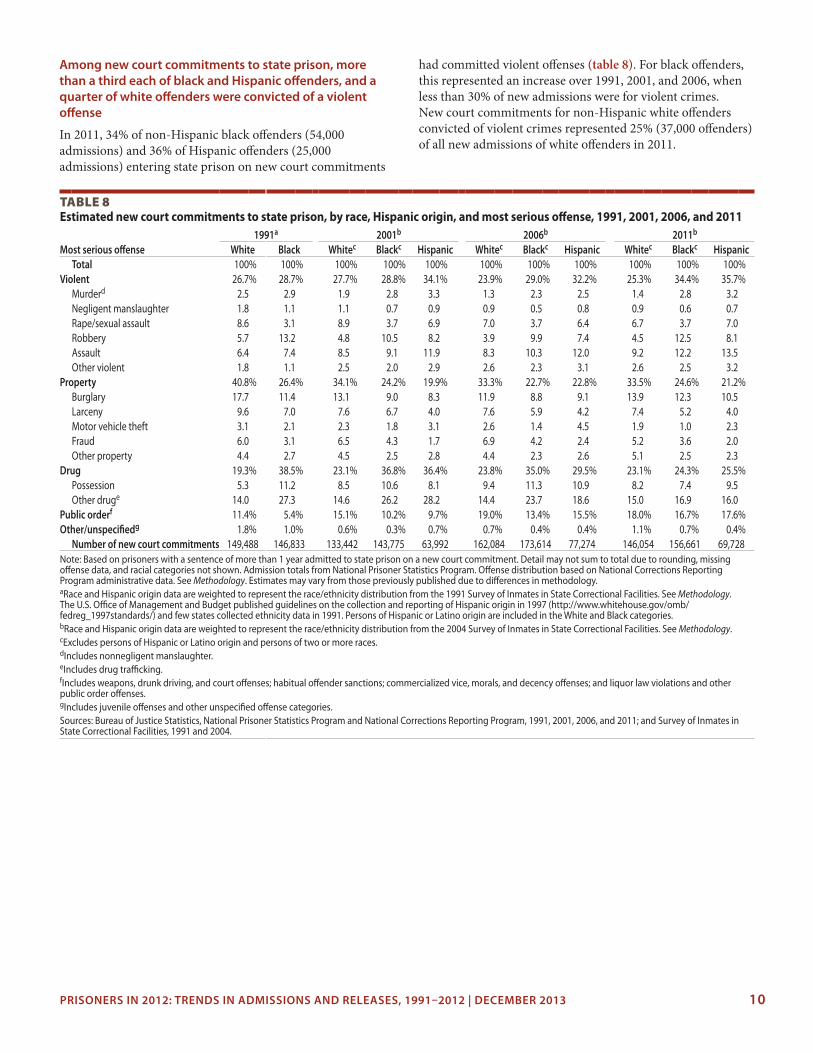
Among new court commitments to state prison, more than a third each of black and Hispanic offenders, and a quarter of white offenders were convicted of a violent offense
In 2011, 34% of non-Hispanic black offenders (54,000 admissions) and 36% of Hispanic offenders (25,000 admissions) entering state prison on new court commitments
had committed violent offenses (table 8). For black offenders, this represented an increase over 1991, 2001, and 2006, when less than 30% of new admissions were for violent crimes. New court commitments for non-Hispanic white offenders convicted of violent crimes represented 25% (37,000 offenders) of all new admissions of white offenders in 2011.
Table 8 Estimated new court commitments to state prison, by race, Hispanic origin, and most serious offense, 1991, 2001, 2006, and 2011
1991a 2001b 2006b 2011b
Most serious offense White Black Whitec Blackc Hispanic Whitec Blackc Hispanic Whitec Blackc HispanicTotal 100% 100% 100% 100% 100% 100% 100% 100% 100% 100% 100%
Violent 26.7% 28.7% 27.7% 28.8% 34.1% 23.9% 29.0% 32.2% 25.3% 34.4% 35.7%Murderd 2.5 2.9 1.9 2.8 3.3 1.3 2.3 2.5 1.4 2.8 3.2Negligent manslaughter 1.8 1.1 1.1 0.7 0.9 0.9 0.5 0.8 0.9 0.6 0.7Rape/sexual assault 8.6 3.1 8.9 3.7 6.9 7.0 3.7 6.4 6.7 3.7 7.0Robbery 5.7 13.2 4.8 10.5 8.2 3.9 9.9 7.4 4.5 12.5 8.1Assault 6.4 7.4 8.5 9.1 11.9 8.3 10.3 12.0 9.2 12.2 13.5Other violent 1.8 1.1 2.5 2.0 2.9 2.6 2.3 3.1 2.6 2.5 3.2
Property 40.8% 26.4% 34.1% 24.2% 19.9% 33.3% 22.7% 22.8% 33.5% 24.6% 21.2%Burglary 17.7 11.4 13.1 9.0 8.3 11.9 8.8 9.1 13.9 12.3 10.5Larceny 9.6 7.0 7.6 6.7 4.0 7.6 5.9 4.2 7.4 5.2 4.0Motor vehicle theft 3.1 2.1 2.3 1.8 3.1 2.6 1.4 4.5 1.9 1.0 2.3Fraud 6.0 3.1 6.5 4.3 1.7 6.9 4.2 2.4 5.2 3.6 2.0Other property 4.4 2.7 4.5 2.5 2.8 4.4 2.3 2.6 5.1 2.5 2.3
Drug 19.3% 38.5% 23.1% 36.8% 36.4% 23.8% 35.0% 29.5% 23.1% 24.3% 25.5%Possession 5.3 11.2 8.5 10.6 8.1 9.4 11.3 10.9 8.2 7.4 9.5Other druge 14.0 27.3 14.6 26.2 28.2 14.4 23.7 18.6 15.0 16.9 16.0
Public orderf 11.4% 5.4% 15.1% 10.2% 9.7% 19.0% 13.4% 15.5% 18.0% 16.7% 17.6%Other/unspecifiedg 1.8% 1.0% 0.6% 0.3% 0.7% 0.7% 0.4% 0.4% 1.1% 0.7% 0.4%
Number of new court commitments 149,488 146,833 133,442 143,775 63,992 162,084 173,614 77,274 146,054 156,661 69,728Note: Based on prisoners with a sentence of more than 1 year admitted to state prison on a new court commitment. Detail may not sum to total due to rounding, missing offense data, and racial categories not shown. Admission totals from National Prisoner Statistics Program. Offense distribution based on National Corrections Reporting Program administrative data. See Methodology. Estimates may vary from those previously published due to differences in methodology.aRace and Hispanic origin data are weighted to represent the race/ethnicity distribution from the 1991 Survey of Inmates in State Correctional Facilities. See Methodology. The U.S. Office of Management and Budget published guidelines on the collection and reporting of Hispanic origin in 1997 (http://www.whitehouse.gov/omb/fedreg_1997standards/) and few states collected ethnicity data in 1991. Persons of Hispanic or Latino origin are included in the White and Black categories.bRace and Hispanic origin data are weighted to represent the race/ethnicity distribution from the 2004 Survey of Inmates in State Correctional Facilities. See Methodology.cExcludes persons of Hispanic or Latino origin and persons of two or more races.dIncludes nonnegligent manslaughter.eIncludes drug trafficking.fIncludes weapons, drunk driving, and court offenses; habitual offender sanctions; commercialized vice, morals, and decency offenses; and liquor law violations and other public order offenses.gIncludes juvenile offenses and other unspecified offense categories.Sources: Bureau of Justice Statistics, National Prisoner Statistics Program and National Corrections Reporting Program, 1991, 2001, 2006, and 2011; and Survey of Inmates in State Correctional Facilities, 1991 and 2004.

PRISONERS IN 2012: TRENDS IN ADMISSIONS AND RELEASES, 1991–2012 | DECEMBER 2013 11
A third of whites imprisoned for new offenses in 2011 were convicted for property offenses (49,000), compared to 25% of blacks (38,600) and 21% of Hispanics (15,000). In 1991, 38% of all blacks admitted to state prison were serving time for new drug offenses. In 2011, only 24% of all blacks were admitted for drug crimes.
Blacks accounted for 47% of new court commitments for violent offenses in 2011, compared to 44% in 2006 and 41% in 2001. Less than a third of inmates newly committed to state prison for violent offenses in 2011 were white (32%), down from 37% in 2001. The racial and Hispanic origin of new admissions for murder and nonnegligent manslaughter between 2001 and 2011 showed a decrease among whites (from 29% in 2001 to 24% in 2011), and increases among blacks (from 46% in 2001 to 51% in 2011) and Hispanics (from
24% in 2001 to 26% in 2011). Among newly sentenced drug offenders, blacks showed a large decline, from 49% of all new court commitment admissions for drug crimes in 2001 to 42% in 2011. In comparison, whites increased from 29% of newly admitted drug offenders in 2001 to 38% in 2011.
The number and proportion of parole violation admissions for drug offenders of all racial groups or Hispanic origin decreased between 2001 and 2011 (table 9), with an estimated 11,400 fewer readmissions of blacks (down 30%), 5,400 fewer whites (down 25%), and 5,200 fewer Hispanics (down 36%) in 2011. The number of parole violations by drug offenders other than possession among blacks decreased 92% (down 10,500).
Table 9 Estimated parole violation admissions to state prison, by race, Hispanic origin, and most serious offense, 1991, 2001, 2006, and 2011
1991a 2001b 2006b 2011b
Most serious offensec White Black Whited Blackd Hispanic Whited Blackd Hispanic Whited Blackd HispanicTotal 100% 100% 100% 100% 100% 100% 100% 100% 100% 100% 100%
Violent 20.6% 25.0% 20.9% 24.2% 25.6% 21.1% 25.2% 25.9% 22.8% 30.0% 30.2%Murdere 1.4 1.7 0.8 1.5 1.3 0.6 1.4 1.0 0.7 1.4 1.2Negligent manslaughter 0.6 0.4 0.3 0.2 0.3 0.5 0.3 0.3 0.4 0.2 0.3Rape/sexual assault 5.0 2.7 4.5 2.8 2.8 4.6 3.4 3.4 5.5 4.4 3.9Robbery 7.4 14.3 5.1 11.2 8.7 4.2 10.1 6.4 4.8 11.9 8.1Assault 5.2 5.3 8.2 7.0 10.3 8.8 8.0 12.3 9.3 9.9 14.1Other violent 0.9 0.5 2.0 1.5 2.2 2.3 1.9 2.5 2.1 2.2 2.7
Property 49.1% 36.6% 40.2% 27.4% 28.8% 39.9% 27.2% 31.3% 39.3% 25.9% 29.7%Burglary 22.5 17.6 15.0 11.0 11.2 14.3 10.8 10.5 14.9 11.8 11.1Larceny 13.1 11.0 10.2 9.0 7.8 8.3 7.7 6.1 7.8 6.3 5.7Motor vehicle theft 5.3 3.5 5.4 2.7 5.3 6.4 3.0 8.5 5.8 2.6 7.3Fraud 6.3 3.2 4.9 2.4 1.5 5.6 3.2 2.4 4.9 2.2 1.9Other property 1.9 1.3 4.8 2.4 3.0 5.3 2.6 3.7 5.9 3.0 3.8
Drug 17.5% 33.2% 29.0% 42.0% 36.0% 26.9% 39.3% 30.2% 23.4% 31.4% 24.6%Possession 7.0 8.4 12.9 8.0 8.7 12.3 7.9 10.9 10.2 7.5 10.0Other drugf 10.6 24.7 16.1 34.0 27.3 14.6 31.4 19.3 13.2 23.9 14.6
Public orderg 9.2% 3.5% 9.3% 6.0% 9.0% 11.5% 7.8% 12.3% 13.6% 11.9% 15.1%Other/unspecifiedh 3.6% 1.8% 0.6% 0.4% 0.5% 0.6% 0.5% 0.4% 1.0% 0.9% 0.4%
Number of parole violation admissions 59,155 70,003 73,971 89,464 39,788 82,329 99,323 44,152 68,784 83,342 37,078Note: Based on prisoners with a sentence of more than 1 year admitted to state prison on a conditional release violation, either for a release condition violation or for a new crime. Detail may not sum to total due to rounding, missing offense data, and racial categories not shown. Admission totals from National Prisoner Statistics Program. Offense distribution based on National Corrections Reporting Program administrative data. See Methodology. Estimates may vary from those previously published due to differences in methodology.aRace data are weighted to represent the race/ethnicity distribution from the 1991 Survey of Inmates in State Correctional Facilities. See Methodology. The U.S. Office of Management and Budget published guidelines on the collection and reporting of Hispanic origin in 1997 (http://www.whitehouse.gov/omb/fedreg_1997standards/) and few states collected ethnicity data in 1991. Persons of Hispanic or Latino origin are included in the White and Black categories.bRace and Hispanic origin data are weighted to represent the race/ethnicity distribution from the 2004 Survey of Inmates in State Correctional Facilities. See Methodology.cMost serious offense refers to the original offense for which an inmate was sentenced, not the incident causing the parole revocation.dExcludes persons of Hispanic or Latino origin and persons of two or more races.eIncludes nonnegligent manslaughter.fIncludes drug trafficking.gIncludes weapons, drunk driving, and court offenses; habitual offender sanctions; commercialized vice, morals, and decency offenses; and liquor law violations and other public order offenses.hIncludes juvenile offenses and other unspecified offense categories.Sources: Bureau of Justice Statistics, National Prisoner Statistics Program and National Corrections Reporting Program, 1991, 2001, 2006, and 2011; and Survey of Inmates in State Correctional Facilities, 1991 and 2004.

PRISONERS IN 2012: TRENDS IN ADMISSIONS AND RELEASES, 1991–2012 | DECEMBER 2013 12
Since 1991, the proportion of newly admitted violent offenders receiving prison sentences of less than 5 years has increased
The proportion of all new court commitments with sentences of less than 20 years was relatively stable across the 20-year period from 1991 to 2011—93% in 1991 and 2001, 92% in 2006, and 94% in 2011 (table 10). In 1991, 10% of all persons admitted on new convictions were sentenced to more than 1 year but less than 2 years in state prison. This increased to 14% in 2001, 2006, and 2011. The percentage of persons newly convicted for violent crimes and sentenced for less than 5 years increased from 37% in 1991 to 42% in 2001 and 44% in 2011. In 1991, 64% of offenders sentenced for drug offenses received less than 5 years, compared to 60% in 2001. In 2011, 69% of newly convicted violent offenders, 85% of drug offenders, and 88% of property offenders were sentenced to less than 10 years in prison.
In general, sentences for violent offenses were longer than for other types of crime. From 1991 to 2011, between 14% and 16% of prisoners admitted to state prison on new court commitments for violent offenses were sentenced to 20 years or more (including life or death sentences). A smaller proportion of violent offenders received sentences of life or death in 2011 (4.5%) than in 1991 (5.7%) or 2001 (4.9%), but the increased number of new court commitments for violent crimes in 2011 resulted in a greater number of convicted violent offenders with life or death sentences. Both the number (down 1,030) and percentage (down 84%) of inmates sentenced to life or death for drug offenses decreased between 1991 and 2011.
Table 10Distribution of maximum sentence length for new court commitments to state prison, by most serious offense,1991, 2001, 2006, and 2011 Most serious offense and maximum sentence lengtha 1991 2001 2006 2011All new admissions 100% 100% 100% 100%
Less than 2 yearsb 9.9% 13.5% 13.7% 13.7%2–4 years 48.1 45.2 43.8 43.55–9 years 23.8 24.3 22.2 24.410–19 years 11.4 9.9 12.1 12.320–49 years 4.5 3.7 3.6 4.150–99 years 0.2 0.4 0.4 0.4100 years or more 0.0 1.4 2.8 0.1Life/deathc 2.1 1.6 1.4 1.5
Number of new court commitment admissions 317,237 365,229 442,111 398,709Violent 100% 100% 100% 100%
Less than 2 yearsb 3.8% 6.8% 7.2% 7.4%2–4 years 33.3 35.3 35.7 36.15–9 years 26.8 24.9 24.5 25.010–19 years 20.2 17.3 17.2 17.220–49 years 9.6 8.3 7.8 8.450–99 years 0.6 1.0 1.1 1.1100 years or more -- 1.5 1.9 0.2Life/deathc 5.7 4.9 4.7 4.5
Number of new court commitment admissions 91,004 107,493 120,579 119,500Property 100% 100% 100% 100%
Less than 2 yearsb 11.2% 15.6% 18.3% 18.8%2–4 years 54.6 50.2 46.6 45.85–9 years 22.8 22.3 19.8 23.110–19 years 9.4 8.4 10.2 10.220–49 years 1.8 1.9 1.7 1.950–99 years -- 0.1 0.1 0.1100 years or more -- 1.4 3.1 --Life/deathc 0.2 0.1 0.2 0.2
Number of new court commitment admissions 99,690 100,090 118,993 109,836Continued on the next page

PRISONERS IN 2012: TRENDS IN ADMISSIONS AND RELEASES, 1991–2012 | DECEMBER 2013 13
Drug 100% 100% 100% 100%Less than 2 yearsb 10.8% 12.7% 14.4% 15.1%2–4 years 53.0 47.5 45.5 44.55–9 years 24.2 26.6 22.9 25.510–19 years 7.2 8.5 11.2 11.820–49 years 3.4 2.9 2.5 2.750–99 years -- 0.1 0.1 0.1100 years or more -- 1.0 3.2 --Life/deathc 1.3 0.7 0.1 0.2
Number of new court commitment admissions 94,837 111,241 127,505 99,401Public orderd 100% 100% 100% 100%
Less than 2 yearsb 20.6% 18.0% 16.0% 15.1%2–4 years 57.8 51.0 50.4 51.95–9 years 16.5 22.8 20.9 23.610–19 years 3.9 5.5 7.8 7.320–49 years 0.9 1.1 1.3 1.850–99 years 0.1 0.1 0.2 0.1100 years or more -- 1.3 3.3 --Life/deathc 0.3 0.1 0.2 0.2
Number of new court commitment admissions 28,079 44,348 72,589 66,944Other/unspecifiede 100% 100% 100% 100%
Less than 2 yearsb 23.7% 10.0% 7.2% 7.1%2–4 years 51.4 36.6 43.1 42.75–9 years 16.1 27.9 28.5 32.010–19 years 7.1 17.9 17.2 14.920–49 years 1.4 6.6 3.1 2.950–99 years -- 0.5 0.3 0.3100 years or more -- 0.4 0.1 0.1Life/deathc 0.2 0.2 0.6 0.1
Number of new court commitment admissions 3,627 2,057 2,445 3,029Note: Counts are based on state prisoners admitted on a new court commitment with a sentence of more than 1 year under the jurisdiction of state correctional officials. Detail may not sum to total due to rounding, missing offense and missing sentence length data. Admission totals from National Prisoner Statistics Program. Offense and sentence length distributions based on National Corrections Reporting Program administrative data. Analysis based on new court commitment admissions with known sentence lengths reported to NCRP. Estimates may vary from those previously published due to differences in methodology. --Less than 0.05%.aMaximum sentence length refers to the greatest amount of time an inmate is eligible to serve. It does not measure actual time served in prison.bIncludes prisoners sentenced to more than 1 year but less than 2 years.cIncludes prisoners sentenced to life, life without parole, life plus additional years, and death.dIncludes weapons, drunk driving, and court offenses; habitual offender sanctions; commercialized vice, morals, and decency offenses; and liquor law violations and other public order offenses.eIncludes juvenile offenses and other unspecified offense categories.Sources: Bureau of Justice Statistics, National Prisoner Statistics Program and National Corrections Reporting Program, 1991, 2001, 2006, and 2011.
Table 10 (continued)Distribution of maximum sentence length for new court commitments to state prison, by most serious offense,1991, 2001, 2006, and 2011Most serious offense and maximum sentence lengtha 1991 2001 2006 2011

PRISONERS IN 2012: TRENDS IN ADMISSIONS AND RELEASES, 1991–2012 | DECEMBER 2013 14
Table 11 Estimated sentenced state prisoners on December 31, by most serious offense and type of admission, 1991, 2001, 2006, and 2011
1991 2001 2006 2011
Most serious offenseaNew court commitment
Parole violationa
New court commitment
Parole violationa
New court commitment
Parole violationa
New court commitment
Parole violationa
Total 100% 100% 100% 100% 100% 100% 100% 100%Violent 47.5% 26.8% 54.4% 35.4% 54.4% 36.0% 55.6% 39.6%
Murderb 12.2 2.8 13.6 4.7 13.1 4.8 13.5 6.0Negligent manslaughter 2.3 0.8 1.6 0.5 1.6 0.5 1.6 0.5Rape/sexual assault 9.0 3.1 12.7 5.2 13.3 6.2 13.3 6.0Robbery 14.3 11.1 13.3 15.1 13.1 14.0 13.5 15.6Assault 7.9 7.6 10.3 7.8 10.4 8.3 10.8 9.3Other violent 1.8 1.5 2.9 2.0 2.9 2.0 2.9 2.2
Property 23.8% 34.6% 18.4% 29.9% 17.2% 29.0% 17.3% 27.3%Burglary 10.8 14.1 9.4 14.4 8.5 14.3 9.2 14.5Larceny 5.3 8.5 3.4 6.4 3.0 5.0 3.0 4.4Motor vehicle theft 1.7 2.9 1.1 2.8 1.2 3.2 0.9 2.5Fraud 3.6 6.0 2.3 3.2 2.4 3.5 2.1 2.8Other property 2.3 3.2 2.3 3.1 2.2 2.9 2.1 3.0
Drug 22.0% 29.3% 19.8% 26.8% 18.4% 25.3% 15.8% 21.4%Possession 7.4 13.2 4.3 6.1 4.7 7.2 3.7 6.0Other drugc 14.5 16.1 15.5 20.7 13.7 18.1 12.0 15.4
Public orderd 6.3% 8.9% 6.9% 7.4% 9.5% 9.1% 10.8% 10.8%Other/unspecifiede 0.5% 0.4% 0.5% 0.6% 0.5% 0.6% 0.5% 0.9%
Number of sentenced prisoners 626,694 106,222 980,728 218,573 1,065,662 254,988 1,131,210 200,966Note: Based on prisoners with a sentence of more than 1 year admitted to state prison on a new court commitment or on a conditional release violation, either for a release condition violation or for a new crime. Detail may not sum to total due to rounding and missing offense data. Counts of sentenced prisoners admitted on new court commitments are based on the sentenced prisoner totals from the National Prisoner Statistics Program, and the ratio of new court commitments to parole violation admissions in the National Corrections Reporting Program yearend population. Offense distribution based on National Corrections Reporting Program administrative data. See Methodology. Estimates may vary from those previously published due to differences in methodology.aFor parole violation admissions, most serious offense refers to the original offense for which an inmate was sentenced, not the incident causing the parole revocation.bIncludes nonnegligent manslaughter.cIncludes drug trafficking.dIncludes weapons, drunk driving, and court offenses; habitual offender sanctions; commercialized vice, morals, and decency offenses; and liquor law violations and other public order offenses.eIncludes juvenile offenses and other unspecified offense categories.Sources: Bureau of Justice Statistics, National Prisoner Statistics Program and National Corrections Reporting Program, 1991, 2001, 2006, and 2011.
Violent offenders’ longer sentences contribute to their increased proportion in the yearend prison population
The proportion of new court commitment and parole violation admissions for violent offenses is consistently smaller than the proportion of violent offenders in the prison population on
December 31 of each year (table 11). This indicates that violent offenders are sentenced to, and are likely serving, relatively longer time in prison than inmates convicted of other types of crime.

PRISONERS IN 2012: TRENDS IN ADMISSIONS AND RELEASES, 1991–2012 | DECEMBER 2013 15
Figure 2 Violent offenders admitted to state prison and in the yearend prison population, by type of admission, 1991, 2001, 2006, and 2011
0
10
20
30
40
50
60
Total prison admissions
Yearend prison population
2011200620011991
Percent
Note: Based on prisoners with a sentence of more than 1 year admitted to state prison on a new court commitment or conditional release violation. Sources: Bureau of Justice Statistics, National Prisoner Statistics Program and National Corrections Reporting Program, 1991, 2001, 2006, and 2011.
New court commitment admissionsTotal admissions
0
10
20
30
40
50
60
New court commitment admissions
Yearend new court commitment population
2011200620011991
PercentParole violation admissions
0
10
20
30
40
50
60
Parole violation admissions
Yearend parole violation population
2011200620011991
Percent
From 1991 to 2011, violent offenses accounted for 27% to 30% of new court commitments with sentences of more than 1 year (figures 2 to 5). However, within the yearend populations for these years, inmates who were newly admitted for violent offenses represented 47% to 56% of the total state prison population. In contrast, property offenses made up 31% of new court commitments with sentences of more than 1 year
in 1991, 27% in 2001 and 2006, and 28% in 2011, compared to between 17% and 24% of inmates originally admitted for property crimes in the prison population on December 31 of each year. Although these property offenders were sentenced to more than 1 year in prison, not all of them were serving a full year.
New court commitment admissionsTotal admissions Parole violation admissions
Figure 3Property offenders admitted to state prison and in the yearend prison population, by type of admission, 1991, 2001, 2006, and 2011
0
10
20
30
40
50
60
Total prison admissions
Yearend prison population
2011200620011991
Percent
Note: Based on prisoners with a sentence of more than 1 year admitted to state prison on a new court commitment or conditional release violation.Sources: Bureau of Justice Statistics, National Prisoner Statistics Program and National Corrections Reporting Program, 1991, 2001, 2006, and 2011.
0
10
20
30
40
50
60
New court commitment admissions
Yearend new court commitment population
2011200620011991
Percent
0
10
20
30
40
50
60
Parole violation admissions
Yearend parole violation population
2011200620011991
Percent

PRISONERS IN 2012: TRENDS IN ADMISSIONS AND RELEASES, 1991–2012 | DECEMBER 2013 16
Time served on parole violation admissions tends to be less than time served on new court commitments. This is reflected in the comparison of these admissions to the proportion of parole violators serving time on December 31 of the 4 years examined. The differences in the proportions of admissions and the yearend prison population were smaller than those observed for new court commitments across all offense categories, suggesting that inmates move through their confinement more quickly than offenders serving time on new court commitments for similar crimes. The only exception to
this pattern occurred between 1991 and 2001 for admissions of public order and drug offense admissions of parole violators. In both cases, the proportion of parole violation admissions was less than that of parole violators in the yearend state prison population.
New admissions for violent offenses showed slight growth between 1991 and 2011, while the total share of violent offenders in the yearend prison population and among inmates readmitted on parole violations increased between 2001 and 2011.
Figure 4Drug offenders admitted to state prison and in the yearend prison population, by type of admission, 1991, 2001, 2006, and 2011
Note: Based on prisoners with a sentence of more than 1 year admitted to state prison on a new court commitment or conditional release violation.Sources: Bureau of Justice Statistics, National Prisoner Statistics Program and National Corrections Reporting Program, 1991, 2001, 2006, and 2011.
0
10
20
30
40
50
60
New court commitment admissions
Yearend new court commitment population
2011200620011991
Percent
0
10
20
30
40
50
60
Parole violation admissions
Yearend parole violation population
2011200620011991
PercentNew court commitment admissions
0
10
20
30
40
50
60
Total prison admissions
Yearend prison population
2011200620011991
PercentTotal admissions Parole violation admissions
Figure 5Public order offenders admitted to state prison and in the yearend prison population, by type of admission,1991, 2001, 2006, and 2011
Note: Based on prisoners with a sentence of more than 1 year admitted to state prison on a new court commitment or conditional release violation.Sources: Bureau of Justice Statistics, National Prisoner Statistics Program and National Corrections Reporting Program, 1991, 2001, 2006, and 2011.
0
10
20
30
40
50
60
Total prison admissions
Yearend prison population
2011200620011991
Percent
0
10
20
30
40
50
60
Parole violation admissions
Yearend parole violation population2011200620011991
PercentNew court commitment admissionsTotal admissions
0
10
20
30
40
50
60
New court commitment admissions
Yearend new court commitment population
2011200620011991
PercentParole violation admissions

PRISONERS IN 2012: TRENDS IN ADMISSIONS AND RELEASES, 1991–2012 | DECEMBER 2013 17
Table 12 Estimated releases from state prison, by most serious offense, 1991, 2001, 2006, and 2011Most serious offense 1991 2001 2006 2011
Total 100% 100% 100% 100%Violent 24.1% 25.7% 25.0% 27.9%
Murdera 1.8 1.5 1.3 1.4Negligent manslaughter 0.9 0.7 0.6 0.7Rape/sexual assault 4.1 4.5 4.4 5.3Robbery 10.4 8.7 7.2 7.8Assault 6.0 8.3 9.3 10.3Other violent 1.0 1.9 2.2 2.4
Property 37.5% 30.1% 30.0% 29.4%Burglary 17.2 12.1 11.1 12.0Larceny 10.3 7.7 6.9 6.1Motor vehicle theft 2.7 2.8 3.5 3.1Fraud 4.3 4.1 4.8 3.9Other property 3.0 3.6 3.7 4.2
Drug 27.9% 33.7% 30.9% 26.7%Possession 7.0 8.8 10.0 8.5Other drugb 21.0 24.9 20.9 18.3
Public orderc 8.6% 10.0% 13.5% 15.0%Other/unspecifiedd 1.9% 0.5% 0.6% 1.0%
Number of releases 419,831 590,256 661,954 635,833Note: Counts based on prisoners with a sentence of more than 1 year released from state prison. Excludes transfers, escapes, and those absent without leave (AWOL). Detail may not sum to total due to rounding and missing offense data. Release totals from National Prisoner Statistics Program. Offense distribution based on National Corrections Reporting Program administrative data. See Methodology. Estimates may vary from those previously published due to differences in methodology.aIncludes nonnegligent manslaughter.bIncludes drug trafficking.cIncludes weapons, drunk driving, and court offenses; habitual offender sanctions; commercialized vice, morals, and decency offenses; and liquor law violations and other public order offenses.dIncludes juvenile offenses and other unspecified offense categories.Sources: Bureau of Justice Statistics, National Prisoner Statistics Program and National Corrections Reporting Program, 1991, 2001, 2006, and 2011.
State prisons released almost 24,900 more inmates than they admitted in 2011
State prisons admitted more offenders than they released in 1991, 2001, and 2006 (table 12). In 2011, there were about 24,900 more releases than admissions, and 59% of this difference was due to 14,600 more releases than admissions of drug offenders. Murder was the only offense for which admissions always outnumbered releases, while larceny had higher counts of releases except in 1991.
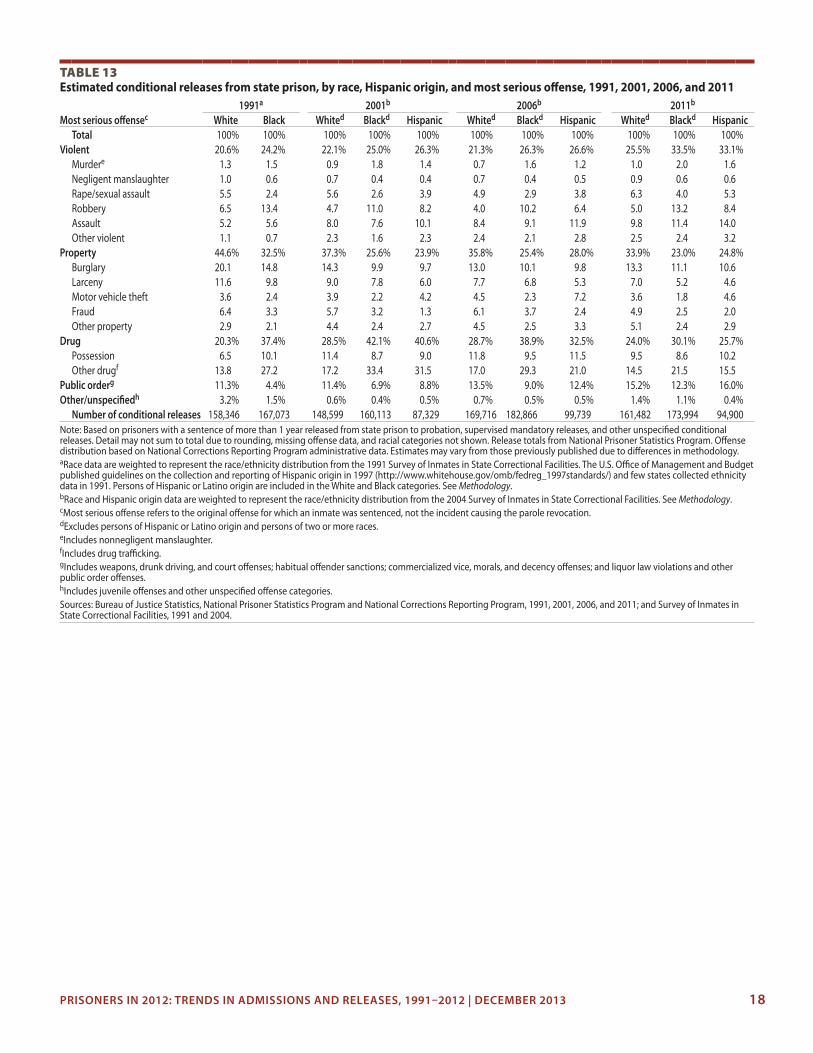
In 2011, conditional releases of violent offenders increased for inmates of all races and Hispanic origin, representing a quarter of whites and a third each of blacks and Hispanics released during 2011 (table 13). Black and Hispanic inmates convicted of violent crimes had the highest proportion of conditional releases across all offenses in 2011, in contrast to 2001 and 2006, when drug offenders were the most commonly released inmates among blacks and Hispanics. White inmates serving prison terms for property crimes had the highest number of conditional releases from 1991 to 2011, although this proportion declined over time concurrent with an increase in the number of releases of white violent and public order offenders.
PRISONERS IN 2012: TRENDS IN ADMISSIONS AND RELEASES, 1991–2012 | DECEMBER 2013 18
Table 13 Estimated conditional releases from state prison, by race, Hispanic origin, and most serious offense, 1991, 2001, 2006, and 2011
1991a 2001b 2006b 2011b
Most serious offensec White Black Whited Blackd Hispanic Whited Blackd Hispanic Whited Blackd HispanicTotal 100% 100% 100% 100% 100% 100% 100% 100% 100% 100% 100%
Violent 20.6% 24.2% 22.1% 25.0% 26.3% 21.3% 26.3% 26.6% 25.5% 33.5% 33.1%Murdere 1.3 1.5 0.9 1.8 1.4 0.7 1.6 1.2 1.0 2.0 1.6Negligent manslaughter 1.0 0.6 0.7 0.4 0.4 0.7 0.4 0.5 0.9 0.6 0.6Rape/sexual assault 5.5 2.4 5.6 2.6 3.9 4.9 2.9 3.8 6.3 4.0 5.3Robbery 6.5 13.4 4.7 11.0 8.2 4.0 10.2 6.4 5.0 13.2 8.4Assault 5.2 5.6 8.0 7.6 10.1 8.4 9.1 11.9 9.8 11.4 14.0Other violent 1.1 0.7 2.3 1.6 2.3 2.4 2.1 2.8 2.5 2.4 3.2
Property 44.6% 32.5% 37.3% 25.6% 23.9% 35.8% 25.4% 28.0% 33.9% 23.0% 24.8%Burglary 20.1 14.8 14.3 9.9 9.7 13.0 10.1 9.8 13.3 11.1 10.6Larceny 11.6 9.8 9.0 7.8 6.0 7.7 6.8 5.3 7.0 5.2 4.6Motor vehicle theft 3.6 2.4 3.9 2.2 4.2 4.5 2.3 7.2 3.6 1.8 4.6Fraud 6.4 3.3 5.7 3.2 1.3 6.1 3.7 2.4 4.9 2.5 2.0Other property 2.9 2.1 4.4 2.4 2.7 4.5 2.5 3.3 5.1 2.4 2.9
Drug 20.3% 37.4% 28.5% 42.1% 40.6% 28.7% 38.9% 32.5% 24.0% 30.1% 25.7%Possession 6.5 10.1 11.4 8.7 9.0 11.8 9.5 11.5 9.5 8.6 10.2Other drugf 13.8 27.2 17.2 33.4 31.5 17.0 29.3 21.0 14.5 21.5 15.5
Public orderg 11.3% 4.4% 11.4% 6.9% 8.8% 13.5% 9.0% 12.4% 15.2% 12.3% 16.0%Other/unspecifiedh 3.2% 1.5% 0.6% 0.4% 0.5% 0.7% 0.5% 0.5% 1.4% 1.1% 0.4%
Number of conditional releases 158,346 167,073 148,599 160,113 87,329 169,716 182,866 99,739 161,482 173,994 94,900Note: Based on prisoners with a sentence of more than 1 year released from state prison to probation, supervised mandatory releases, and other unspecified conditional releases. Detail may not sum to total due to rounding, missing offense data, and racial categories not shown. Release totals from National Prisoner Statistics Program. Offense distribution based on National Corrections Reporting Program administrative data. Estimates may vary from those previously published due to differences in methodology.aRace data are weighted to represent the race/ethnicity distribution from the 1991 Survey of Inmates in State Correctional Facilities. The U.S. Office of Management and Budget published guidelines on the collection and reporting of Hispanic origin in 1997 (http://www.whitehouse.gov/omb/fedreg_1997standards/) and few states collected ethnicity data in 1991. Persons of Hispanic or Latino origin are included in the White and Black categories. See Methodology.bRace and Hispanic origin data are weighted to represent the race/ethnicity distribution from the 2004 Survey of Inmates in State Correctional Facilities. See Methodology.cMost serious offense refers to the original offense for which an inmate was sentenced, not the incident causing the parole revocation.dExcludes persons of Hispanic or Latino origin and persons of two or more races.eIncludes nonnegligent manslaughter.fIncludes drug trafficking.gIncludes weapons, drunk driving, and court offenses; habitual offender sanctions; commercialized vice, morals, and decency offenses; and liquor law violations and other public order offenses.hIncludes juvenile offenses and other unspecified offense categories.Sources: Bureau of Justice Statistics, National Prisoner Statistics Program and National Corrections Reporting Program, 1991, 2001, 2006, and 2011; and Survey of Inmates in State Correctional Facilities, 1991 and 2004.
PRISONERS IN 2012: TRENDS IN ADMISSIONS AND RELEASES, 1991–2012 | DECEMBER 2013 19
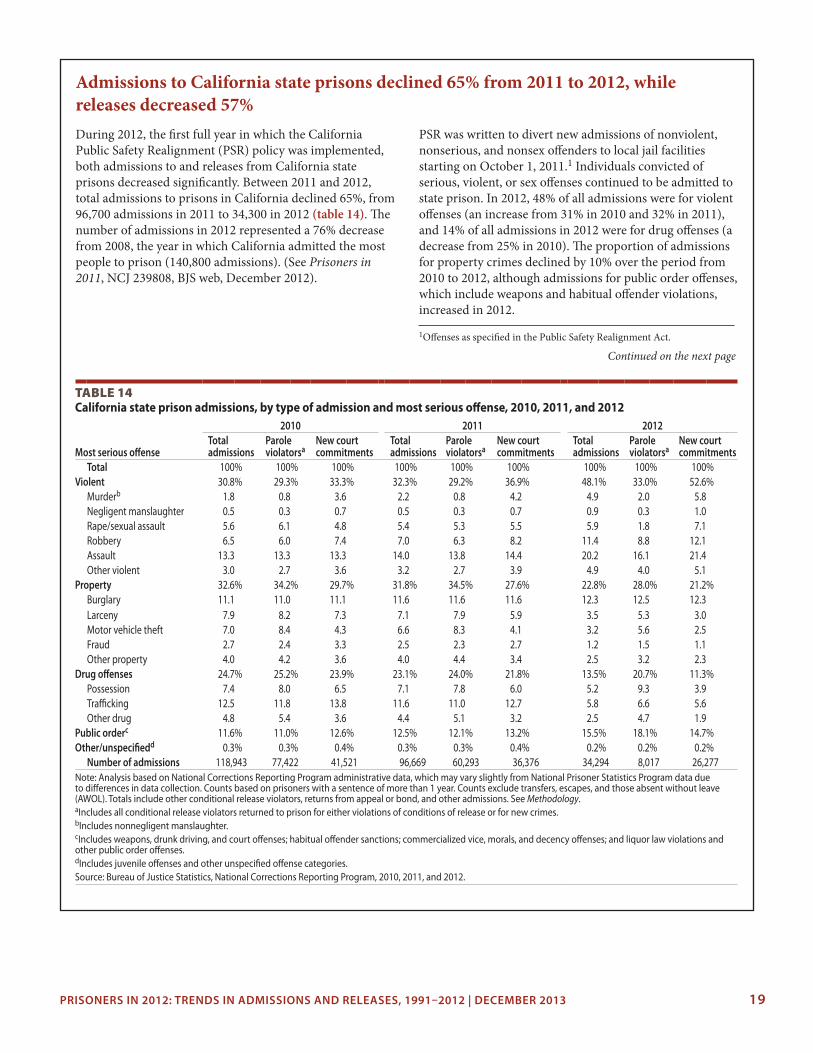
Admissions to California state prisons declined 65% from 2011 to 2012, while releases decreased 57%During 2012, the first full year in which the California Public Safety Realignment (PSR) policy was implemented, both admissions to and releases from California state prisons decreased significantly. Between 2011 and 2012, total admissions to prisons in California declined 65%, from 96,700 admissions in 2011 to 34,300 in 2012 (table 14). The number of admissions in 2012 represented a 76% decrease from 2008, the year in which California admitted the most people to prison (140,800 admissions). (See Prisoners in 2011, NCJ 239808, BJS web, December 2012).
PSR was written to divert new admissions of nonviolent, nonserious, and nonsex offenders to local jail facilities starting on October 1, 2011.1 Individuals convicted of serious, violent, or sex offenses continued to be admitted to state prison. In 2012, 48% of all admissions were for violent offenses (an increase from 31% in 2010 and 32% in 2011), and 14% of all admissions in 2012 were for drug offenses (a decrease from 25% in 2010). The proportion of admissions for property crimes declined by 10% over the period from 2010 to 2012, although admissions for public order offenses, which include weapons and habitual offender violations, increased in 2012.
Table 14 California state prison admissions, by type of admission and most serious offense, 2010, 2011, and 2012
2010 2011 2012
Most serious offenseTotal admissions
Parole violatorsa
New court commitments
Total admissions
Parole violatorsa
New court commitments
Total admissions
Parole violatorsa
New court commitments
Total 100% 100% 100% 100% 100% 100% 100% 100% 100%Violent 30.8% 29.3% 33.3% 32.3% 29.2% 36.9% 48.1% 33.0% 52.6%
Murderb 1.8 0.8 3.6 2.2 0.8 4.2 4.9 2.0 5.8Negligent manslaughter 0.5 0.3 0.7 0.5 0.3 0.7 0.9 0.3 1.0Rape/sexual assault 5.6 6.1 4.8 5.4 5.3 5.5 5.9 1.8 7.1Robbery 6.5 6.0 7.4 7.0 6.3 8.2 11.4 8.8 12.1Assault 13.3 13.3 13.3 14.0 13.8 14.4 20.2 16.1 21.4Other violent 3.0 2.7 3.6 3.2 2.7 3.9 4.9 4.0 5.1
Property 32.6% 34.2% 29.7% 31.8% 34.5% 27.6% 22.8% 28.0% 21.2%Burglary 11.1 11.0 11.1 11.6 11.6 11.6 12.3 12.5 12.3Larceny 7.9 8.2 7.3 7.1 7.9 5.9 3.5 5.3 3.0Motor vehicle theft 7.0 8.4 4.3 6.6 8.3 4.1 3.2 5.6 2.5Fraud 2.7 2.4 3.3 2.5 2.3 2.7 1.2 1.5 1.1Other property 4.0 4.2 3.6 4.0 4.4 3.4 2.5 3.2 2.3
Drug offenses 24.7% 25.2% 23.9% 23.1% 24.0% 21.8% 13.5% 20.7% 11.3%Possession 7.4 8.0 6.5 7.1 7.8 6.0 5.2 9.3 3.9Trafficking 12.5 11.8 13.8 11.6 11.0 12.7 5.8 6.6 5.6Other drug 4.8 5.4 3.6 4.4 5.1 3.2 2.5 4.7 1.9
Public orderc 11.6% 11.0% 12.6% 12.5% 12.1% 13.2% 15.5% 18.1% 14.7%Other/unspecifiedd 0.3% 0.3% 0.4% 0.3% 0.3% 0.4% 0.2% 0.2% 0.2%
Number of admissions 118,943 77,422 41,521 96,669 60,293 36,376 34,294 8,017 26,277Note: Analysis based on National Corrections Reporting Program administrative data, which may vary slightly from National Prisoner Statistics Program data due to differences in data collection. Counts based on prisoners with a sentence of more than 1 year. Counts exclude transfers, escapes, and those absent without leave (AWOL). Totals include other conditional release violators, returns from appeal or bond, and other admissions. See Methodology.aIncludes all conditional release violators returned to prison for either violations of conditions of release or for new crimes.bIncludes nonnegligent manslaughter.cIncludes weapons, drunk driving, and court offenses; habitual offender sanctions; commercialized vice, morals, and decency offenses; and liquor law violations and other public order offenses.dIncludes juvenile offenses and other unspecified offense categories.Source: Bureau of Justice Statistics, National Corrections Reporting Program, 2010, 2011, and 2012.
1Offenses as specified in the Public Safety Realignment Act.
Continued on the next page

PRISONERS IN 2012: TRENDS IN ADMISSIONS AND RELEASES, 1991–2012 | DECEMBER 2013 20
Between 2011 and 2012, the proportions of all admissions that were parole violations and new court commitments were reversed. In 2011, 62% of all admissions to California state prisons were parole violations, compared to 23% in 2012. New court commitments increased from 38% of all admissions in 2011 to 77% in 2012. In 2012, 33% of parole violation admissions to prisons and 53% of prisoners newly committed were violent offenders.
The number of inmates released from California prisons also declined in 2012, but at a slower rate than the decrease in admissions. In 2012, there were 47,500 releases from California prisons, 57% fewer than in 2011 when there were 109,500 releases (table 15). In 2012, 37% of all releases were of violent offenders, compared to 29% in 2010. Prisoners convicted of aggravated assault and robbery accounted for the majority of the increase in released prisoners. While violent offenders accounted for 29% of conditional releases in 2010, this proportion had increased to 67% in 2012.
Table 15 California state prison releases, by type of release and most serious offense, 2010, 2011, and 2012
2010 2011 2012
Most serious offenseTotal releases
Unconditional releasesa
Conditional releasesb
Total releases
Unconditional releasesa
Conditional releasesb
Total releases
Unconditional releasesa
Conditional releasesb
Total 100% 100% 100% 100% 100% 100% 100% 100% 100%Violent 29.0% 40.3% 28.7% 30.7% 16.7% 32.5% 36.9% 18.2% 66.8%
Murderc 1.2 2.3 1.1 1.4 0.3 1.4 2.4 0.2 5.4Negligent manslaughter 0.5 0.6 0.5 0.5 0.3 0.5 0.6 0.3 1.1Rape/sexual assault 5.3 9.3 5.2 5.4 2.4 5.8 5.2 1.3 11.3Robbery 6.1 7.9 6.1 6.7 2.1 7.4 9.0 1.7 20.8Assault 13.0 16.0 12.9 13.6 9.4 14.2 16.1 12.6 22.0Other violent 2.9 4.1 2.9 3.1 2.1 3.2 3.6 2.0 6.2
Property 32.8% 24.6% 33.0% 32.4% 36.8% 31.8% 27.8% 33.3% 19.1%Burglary 10.7 8.6 10.8 11.2 10.6 11.2 11.6 9.6 15.1Larceny 8.0 6.0 8.0 7.7 9.3 7.5 5.7 8.5 1.1Motor vehicle theft 7.1 4.6 7.2 6.9 8.3 6.7 5.2 7.8 1.1Fraud 2.8 2.3 2.8 2.7 3.9 2.5 2.2 3.5 0.3Other property 4.1 3.0 4.1 4.0 4.7 3.9 3.0 3.9 1.5
Drug 26.5% 23.0% 26.6% 24.8% 32.5% 23.7% 21.9% 32.6% 4.6%Possession 7.6 7.5 7.6 7.0 9.2 6.8 5.1 7.6 0.9Trafficking 13.7 10.3 13.8 13.3 17.7 12.7 13.9 20.6 3.2Other drug 5.2 5.3 5.2 4.5 5.6 4.3 2.9 4.3 0.6
Public orderd 11.4% 11.6% 11.5% 11.9% 13.8% 11.6% 13.2% 15.7% 9.2%Other/unspecifiede 0.3% 0.5% 0.3% 0.3% 0.3% 0.3% 0.3% 0.3% 0.2%
Number of releases 121,918 1,728 119,941 109,467 13,676 95,541 47,454 29,485 17,756Note: Analysis based on National Corrections Reporting Program administrative data, which may vary slightly from National Prisoner Statistics Program data due to differences in data collection. Counts based on prisoners with a sentence of more than 1 year. Counts exclude transfers, escapes, and those absent without leave (AWOL). Totals include deaths, releases to appeal or bond, and other releases. See Methodology.aIncludes expirations of sentence, communtations, and other unconditional releases.bIncludes releases to probation, supervised mandatory releases, and other unspecified conditional releases.cIncludes nonnegligent manslaughter.dIncludes weapons, drunk driving, and court offenses; habitual offender sanctions; commercialized vice, morals, and decency offenses; and liquor law violations and other public order offenses.eIncludes juvenile offenses and other unspecified offense categories.Source: Bureau of Justice Statistics, National Corrections Reporting Program, 2010, 2011, and 2012.
Continued on the next page

PRISONERS IN 2012: TRENDS IN ADMISSIONS AND RELEASES, 1991–2012 | DECEMBER 2013 21
Similar to the pattern of admission types, unconditional releases accounted for less than 2% of total releases in 2010 and 12% in 2011, compared to 62% in 2012. In 2012, 37% of prisoners were released with post custody conditions, down from 98% in 2010. Drug and property offenses accounted for 33% each of all unconditional releases in 2012. While the percentage of violent offenders unconditionally released from California state prisons decreased from 40% in 2010 to 18% in 2012, the increase in the total number of unconditional releases in 2012 resulted in a net increase of violent offenders with this type of prison release, from 670 offenders in 2010 to 5,400 offenders in 2012.
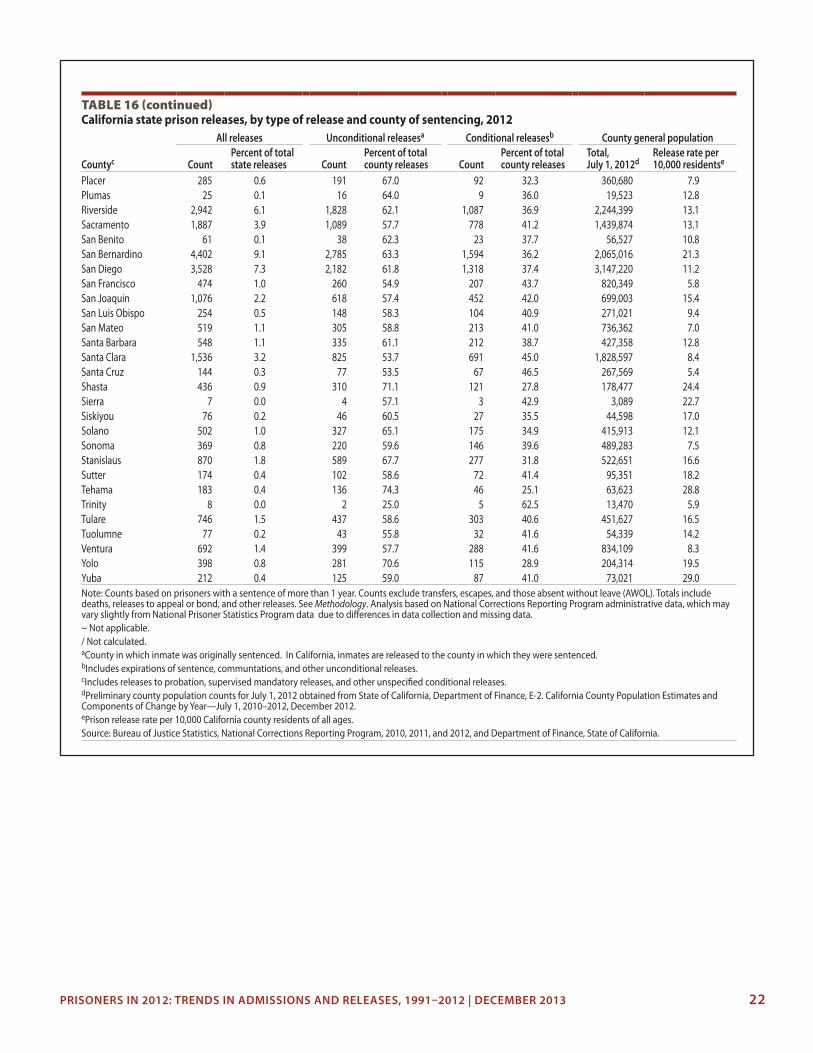
Released prisoners in California are returned to the county in which they were originally sentenced. While this does not guarantee that a former prisoner will continue to live in the same county, it provides a proxy measure to identify the counties most immediately influenced by state prison releases. In 2012, 30% of all inmates released from California state prisons (14,800 persons) were returned to Los Angeles County, followed by San Bernardino (4,400
inmates or 9.1% of all releases) and San Diego counties (3,500 or 7.3% of all releases) (table 16). Almost two-thirds of inmates released from prison to these three counties had no conditions placed on their release. Only four counties (Alameda, Colusa, Inyo, and Trinity) received more conditional releases from state prison than inmates released unconditionally.
While Los Angeles County received the largest number of inmates released from state prisons in 2012, when compared to the general population of each county, Los Angeles had a prison release rate of 14.9 per 10,000 county residents. Eighteen counties with smaller general populations had higher rates of prison release in their communities. Kings County (population 150,800) received 507 prison releases, but had a rate of 33.6 releases per 10,000 residents. After Kings County, Yuba (29.0 releases per 10,000 residents), Tehama (28.8 releases per 10,000 residents), and Shasta (24.4 releases per 10,000 residents) counties had the highest rates of released prisoners.
Table 16 California state prison releases, by type of release and county of sentencing, 2012
All releases Unconditional releasesa Conditional releasesb County general population
Countyc CountPercent of total state releases Count
Percent of total county releases Count
Percent of total county releases
Total, July 1, 2012d
Release rate per 10,000 residentse
Total 48,621 100% 29,920 ~ 18,346 ~ 37,826,160 12.9Alameda 1,117 2.3% 488 43.7% 622 55.7% 1,540,790 7.2Alpine 0 0.0 0 / 0 / 1,127 /Amador 65 0.1 53 81.5 12 18.5 36,899 17.6Butte 438 0.9 299 68.3 133 30.4 221,118 19.8Calaveras 53 0.1 35 66.0 18 34.0 45,045 11.8Colusa 31 0.1 13 41.9 18 58.1 21,614 14.3Contra Costa 462 1.0 232 50.2 227 49.1 1,069,803 4.3Del Norte 38 0.1 22 57.9 15 39.5 28,359 13.4El Dorado 136 0.3 80 58.8 53 39.0 180,599 7.5Fresno 1,739 3.6 1,117 64.2 613 35.3 946,823 18.4Glenn 41 0.1 23 56.1 16 39.0 28,208 14.5Humboldt 229 0.5 155 67.7 73 31.9 134,923 17.0Imperial 144 0.3 92 63.9 51 35.4 178,659 8.1Inyo 18 0.0 6 33.3 11 61.1 18,637 9.7Kern 1,889 3.9 1,322 70.0 560 29.6 855,522 22.1Kings 507 1.0 337 66.5 169 33.3 150,843 33.6Lake 127 0.3 77 60.6 47 37.0 64,394 19.7Lassen 33 0.1 27 81.8 6 18.2 33,650 9.8Los Angeles 14,817 30.5 9,300 62.8 5,398 36.4 9,911,665 14.9Madera 210 0.4 136 64.8 74 35.2 151,790 13.8Marin 85 0.2 47 55.3 36 42.4 254,882 3.3Mariposa 20 0.0 15 75.0 5 25.0 17,817 11.2Mendocino 97 0.2 53 54.6 44 45.4 88,566 11.0Merced 302 0.6 172 57.0 130 43.0 261,708 11.5Modoc 7 0.0 4 57.1 3 42.9 9,518 7.4Mono 4 0.0 2 50.0 2 50.0 14,258 2.8Monterey 522 1.1 292 55.9 228 43.7 422,868 12.3Napa 142 0.3 72 50.7 70 49.3 138,577 10.2Nevada 47 0.1 30 63.8 16 34.0 98,202 4.8Orange 2,870 5.9 1,701 59.3 1,152 40.1 3,071,933 9.3
Continued on the next page
PRISONERS IN 2012: TRENDS IN ADMISSIONS AND RELEASES, 1991–2012 | DECEMBER 2013 22
Placer 285 0.6 191 67.0 92 32.3 360,680 7.9Plumas 25 0.1 16 64.0 9 36.0 19,523 12.8Riverside 2,942 6.1 1,828 62.1 1,087 36.9 2,244,399 13.1Sacramento 1,887 3.9 1,089 57.7 778 41.2 1,439,874 13.1San Benito 61 0.1 38 62.3 23 37.7 56,527 10.8San Bernardino 4,402 9.1 2,785 63.3 1,594 36.2 2,065,016 21.3San Diego 3,528 7.3 2,182 61.8 1,318 37.4 3,147,220 11.2San Francisco 474 1.0 260 54.9 207 43.7 820,349 5.8San Joaquin 1,076 2.2 618 57.4 452 42.0 699,003 15.4San Luis Obispo 254 0.5 148 58.3 104 40.9 271,021 9.4San Mateo 519 1.1 305 58.8 213 41.0 736,362 7.0Santa Barbara 548 1.1 335 61.1 212 38.7 427,358 12.8Santa Clara 1,536 3.2 825 53.7 691 45.0 1,828,597 8.4Santa Cruz 144 0.3 77 53.5 67 46.5 267,569 5.4Shasta 436 0.9 310 71.1 121 27.8 178,477 24.4Sierra 7 0.0 4 57.1 3 42.9 3,089 22.7Siskiyou 76 0.2 46 60.5 27 35.5 44,598 17.0Solano 502 1.0 327 65.1 175 34.9 415,913 12.1Sonoma 369 0.8 220 59.6 146 39.6 489,283 7.5Stanislaus 870 1.8 589 67.7 277 31.8 522,651 16.6Sutter 174 0.4 102 58.6 72 41.4 95,351 18.2Tehama 183 0.4 136 74.3 46 25.1 63,623 28.8Trinity 8 0.0 2 25.0 5 62.5 13,470 5.9Tulare 746 1.5 437 58.6 303 40.6 451,627 16.5Tuolumne 77 0.2 43 55.8 32 41.6 54,339 14.2Ventura 692 1.4 399 57.7 288 41.6 834,109 8.3Yolo 398 0.8 281 70.6 115 28.9 204,314 19.5Yuba 212 0.4 125 59.0 87 41.0 73,021 29.0Note: Counts based on prisoners with a sentence of more than 1 year. Counts exclude transfers, escapes, and those absent without leave (AWOL). Totals include deaths, releases to appeal or bond, and other releases. See Methodology. Analysis based on National Corrections Reporting Program administrative data, which may vary slightly from National Prisoner Statistics Program data due to differences in data collection and missing data.~ Not applicable./ Not calculated.aCounty in which inmate was originally sentenced. In California, inmates are released to the county in which they were sentenced.bIncludes expirations of sentence, communtations, and other unconditional releases.cIncludes releases to probation, supervised mandatory releases, and other unspecified conditional releases.dPreliminary county population counts for July 1, 2012 obtained from State of California, Department of Finance, E-2. California County Population Estimates and Components of Change by Year—July 1, 2010–2012, December 2012.ePrison release rate per 10,000 California county residents of all ages. Source: Bureau of Justice Statistics, National Corrections Reporting Program, 2010, 2011, and 2012, and Department of Finance, State of California.
Table 16 (continued)California state prison releases, by type of release and county of sentencing, 2012
All releases Unconditional releasesa Conditional releasesb County general population
Countyc CountPercent of total state releases Count
Percent of total county releases Count
Percent of total county releases
Total, July 1, 2012d
Release rate per 10,000 residentse

PRISONERS IN 2012: TRENDS IN ADMISSIONS AND RELEASES, 1991–2012 | DECEMBER 2013 23
The 2012 yearend U.S. sentenced prison population declined 1.8%, driven by a decrease in the number of state prisoners
A total of 27,400 fewer prisoners were sentenced to more than 1 year in state and federal prisons at yearend 2012, than at yearend 2011, a decrease of almost 2% (table 17). The federal prison system had the largest sentenced prison population (196,600 prisoners) of any jurisdiction in 2012, followed by Texas (157,900 inmates), California (134,200 inmates), Florida (101,900 inmates), and New York (54,100 inmates). With the federal population, these five jurisdictions accounted for
43% of the sentenced U.S. prison population in 2012. Texas, California, and Florida accounted for 30% of the sentenced state prison population in 2012.
California (down 10%) had the largest percentage decrease in prison population, followed by Arkansas (down 9%), Wisconsin and Colorado (down 7% each). The prison populations in New Hampshire (up 7%) and North Dakota (up 6%) led the 24 jurisdictions with sentenced population increases in 2012. Females comprised almost 7% of the state prison population and 6% of the federal system in 2012.
Table 17 Sentenced state and federal prisoners, by sex, December 31, 2011 and 2012
2011 2012 Percent change, 2011–2012Jurisdiction Total Males Females Total Males Females Total Males Females
U.S. Total 1,538,847 1,435,141 103,706 1,511,480 1,410,191 101,289 -1.8% -1.7% -2.3%Federala 197,050 184,901 12,149 196,574 184,258 12,316 -0.2% -0.3% 1.4%State 1,341,797 1,250,240 91,557 1,314,906 1,225,933 88,973 -2.0% -1.9% -2.8%
Alabama 31,271 28,823 2,448 31,437 28,915 2,522 0.5 0.3 3.0Alaskab 2,894 2,616 278 2,974 2,690 284 2.8 2.8 2.2Arizona 38,370 35,098 3,272 38,402 35,065 3,337 0.1 -0.1 2.0Arkansas 16,037 14,938 1,099 14,615 13,567 1,048 -8.9 -9.2 -4.6California 149,025 140,972 8,053 134,211 128,180 6,031 -9.9 -9.1 -25.1Colorado 21,978 19,957 2,021 20,462 18,739 1,723 -6.9 -6.1 -14.7Connecticutb 12,549 11,865 684 11,961 11,314 647 -4.7 -4.6 -5.4Delawareb 4,003 3,815 188 4,129 3,913 216 3.1 2.6 14.9Florida 103,055 95,913 7,142 101,930 94,945 6,985 -1.1 -1.0 -2.2Georgia 53,955 50,211 3,744 53,990 50,510 3,480 0.1 0.6 -7.1Hawaiib 3,910 3,527 383 3,819 3,439 380 -2.3 -2.5 -0.8Idaho 7,739 6,854 885 7,985 6,977 1,008 3.2 1.8 13.9Illinoisc 48,427 45,562 2,865 49,348 46,599 2,749 1.9 2.3 -4.0Indiana 28,890 26,391 2,499 28,822 26,256 2,566 -0.2 -0.5 2.7Iowad 9,057 8,336 721 8,686 7,917 769 -4.1 -5.0 6.7Kansasd 9,327 8,647 680 9,398 8,724 674 0.8 0.9 -0.9Kentucky 20,952 18,575 2,377 21,466 18,919 2,547 2.5 1.9 7.2Louisiana 39,709 37,325 2,384 40,170 37,781 2,389 1.2 1.2 0.2Maine 1,952 1,810 142 1,932 1,797 135 -1.0 -0.7 -4.9Maryland 22,252 21,301 951 21,281 20,410 871 -4.4 -4.2 -8.4Massachusetts 10,316 9,822 494 9,999 9,567 432 -3.1 -2.6 -12.6Michigan 42,904 40,995 1,909 43,594 41,605 1,989 1.6 1.5 4.2Minnesota 9,800 9,156 644 9,938 9,228 710 1.4 0.8 10.2Mississippi 20,585 19,115 1,470 21,426 19,884 1,542 4.1 4.0 4.9Missouri 30,829 28,254 2,575 31,244 28,541 2,703 1.3 1.0 5.0Montana 3,678 3,274 404 3,609 3,210 399 -1.9 -2.0 -1.2Nebraska 4,511 4,159 352 4,594 4,255 339 1.8 2.3 -3.7Nevadac 12,639 11,672 967 12,744 11,706 1,038 0.8 0.3 7.3New Hampshire 2,614 2,444 170 2,790 2,583 207 6.7 5.7 21.8New Jersey 23,834 22,762 1,072 23,225 22,164 1,061 -2.6 -2.6 -1.0New Mexico 6,855 6,230 625 6,574 5,954 620 -4.1 -4.4 -0.8New York 55,262 52,973 2,289 54,073 51,846 2,227 -2.2 -2.1 -2.7North Carolina 35,102 33,030 2,072 34,983 32,846 2,137 -0.3 -0.6 3.1North Dakota 1,423 1,276 147 1,512 1,341 171 6.3 5.1 16.3Ohio 50,964 47,061 3,903 50,876 47,008 3,868 -0.2 -0.1 -0.9Oklahoma 24,024 21,693 2,331 24,830 22,369 2,461 3.4 3.1 5.6Oregon 14,459 13,343 1,116 14,801 13,574 1,227 2.4 1.7 9.9Pennsylvania 51,390 48,657 2,733 50,918 48,219 2,699 -0.9 -0.9 -1.2Rhode Islandb 2,065 1,984 81 1,999 1,916 83 -3.2 -3.4 2.5South Carolina 22,233 20,940 1,293 21,725 20,485 1,240 -2.3 -2.2 -4.1
Continued on the next page

PRISONERS IN 2012: TRENDS IN ADMISSIONS AND RELEASES, 1991–2012 | DECEMBER 2013 24
South Dakota 3,530 3,092 438 3,644 3,221 423 3.2 4.2 -3.4Tennessee 28,479 26,070 2,409 28,411 26,048 2,363 -0.2 -0.1 -1.9Texas 163,552 151,343 12,209 157,900 146,292 11,608 -3.5 -3.3 -4.9Utah 6,877 6,264 613 6,960 6,321 639 1.2 0.9 4.2Vermontb 1,598 1,496 102 1,516 1,443 73 -5.1 -3.5 -28.4Virginia 38,130 35,321 2,809 37,044 34,150 2,894 -2.8 -3.3 3.0Washington 17,808 16,420 1,388 17,254 15,920 1,334 -3.1 -3.0 -3.9West Virginia 6,803 6,056 747 7,027 6,235 792 3.3 3.0 6.0Wisconsin 21,998 20,858 1,140 20,474 19,379 1,095 -6.9 -7.1 -3.9Wyoming 2,183 1,944 239 2,204 1,966 238 1.0 1.1 -0.4
Note: Jurisdiction refers to the legal authority of state or federal correctional officials over a prisoner, regardless of where the prisoner is held. Counts are based on prisoners with sentences of more than 1 year under the jurisdiction of state or federal correctional officials. As of December 31, 2001, sentenced felons from the District of Columbia are the responsibility of the Federal Bureau of Prisons. aIncludes inmates held in nonsecure privately operated community corrections facilities and juveniles held in contract facilities.bPrisons and jails form one integrated system. Data include total jail and prison populations.cState did not submit 2012 National Prisoner Statistics (NPS) Program data, so population estimates for 2012 are imputed. See Methodology for discussion of imputation strategy.dChange in reporting methods. See National Prisoner Statistics Program jurisdiction notes.Source: Bureau of Justice Statistics, National Prisoner Statistics Program, 2011–2012.
Table 17 (Continued)Sentenced state and federal prisoners, by sex, December 31, 2011 and 2012
2011 2012 Percent change, 2011–2012Jurisdiction Total Males Females Total Males Females Total Males Females
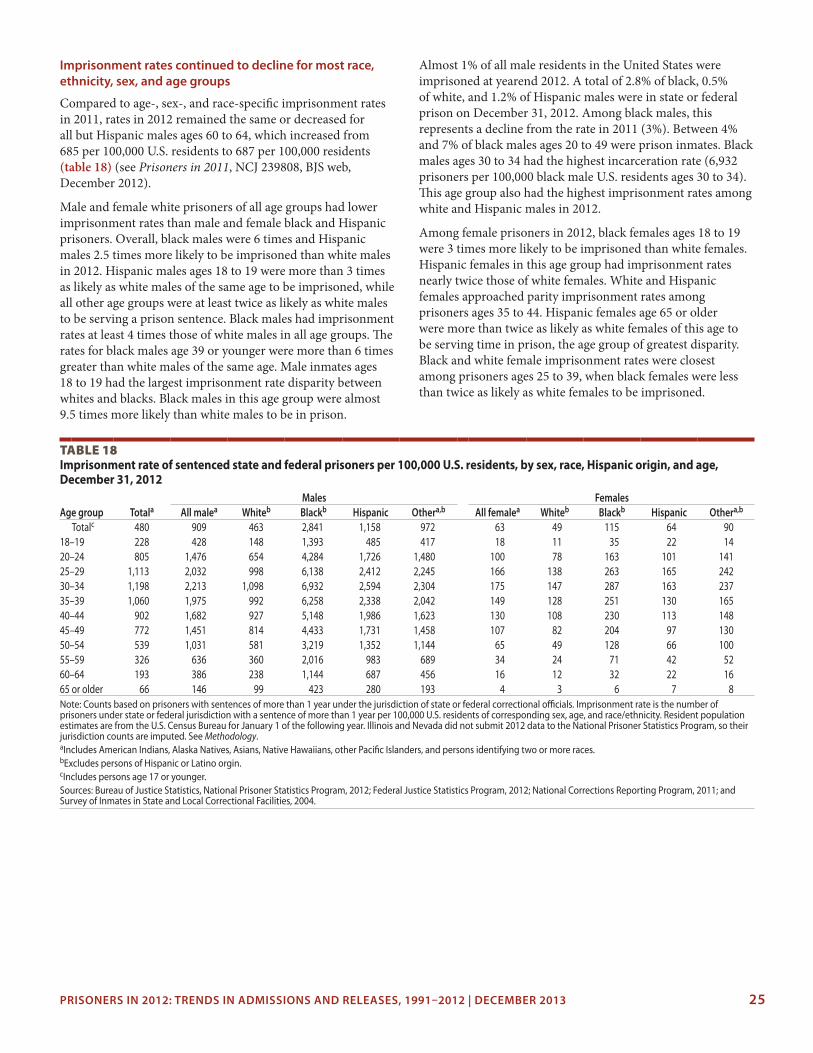
PRISONERS IN 2012: TRENDS IN ADMISSIONS AND RELEASES, 1991–2012 | DECEMBER 2013 25
Table 18 Imprisonment rate of sentenced state and federal prisoners per 100,000 U.S. residents, by sex, race, Hispanic origin, and age, December 31, 2012
Males FemalesAge group Totala All malea Whiteb Blackb Hispanic Othera,b All femalea Whiteb Blackb Hispanic Othera,b
Totalc 480 909 463 2,841 1,158 972 63 49 115 64 9018–19 228 428 148 1,393 485 417 18 11 35 22 1420–24 805 1,476 654 4,284 1,726 1,480 100 78 163 101 14125–29 1,113 2,032 998 6,138 2,412 2,245 166 138 263 165 24230–34 1,198 2,213 1,098 6,932 2,594 2,304 175 147 287 163 23735–39 1,060 1,975 992 6,258 2,338 2,042 149 128 251 130 16540–44 902 1,682 927 5,148 1,986 1,623 130 108 230 113 14845–49 772 1,451 814 4,433 1,731 1,458 107 82 204 97 13050–54 539 1,031 581 3,219 1,352 1,144 65 49 128 66 10055–59 326 636 360 2,016 983 689 34 24 71 42 5260–64 193 386 238 1,144 687 456 16 12 32 22 1665 or older 66 146 99 423 280 193 4 3 6 7 8Note: Counts based on prisoners with sentences of more than 1 year under the jurisdiction of state or federal correctional officials. Imprisonment rate is the number of prisoners under state or federal jurisdiction with a sentence of more than 1 year per 100,000 U.S. residents of corresponding sex, age, and race/ethnicity. Resident population estimates are from the U.S. Census Bureau for January 1 of the following year. Illinois and Nevada did not submit 2012 data to the National Prisoner Statistics Program, so their jurisdiction counts are imputed. See Methodology.aIncludes American Indians, Alaska Natives, Asians, Native Hawaiians, other Pacific Islanders, and persons identifying two or more races.bExcludes persons of Hispanic or Latino orgin.cIncludes persons age 17 or younger.Sources: Bureau of Justice Statistics, National Prisoner Statistics Program, 2012; Federal Justice Statistics Program, 2012; National Corrections Reporting Program, 2011; and Survey of Inmates in State and Local Correctional Facilities, 2004.
Imprisonment rates continued to decline for most race, ethnicity, sex, and age groups
Compared to age-, sex-, and race-specific imprisonment rates in 2011, rates in 2012 remained the same or decreased for all but Hispanic males ages 60 to 64, which increased from 685 per 100,000 U.S. residents to 687 per 100,000 residents (table 18) (see Prisoners in 2011, NCJ 239808, BJS web, December 2012).
Male and female white prisoners of all age groups had lower imprisonment rates than male and female black and Hispanic prisoners. Overall, black males were 6 times and Hispanic males 2.5 times more likely to be imprisoned than white males in 2012. Hispanic males ages 18 to 19 were more than 3 times as likely as white males of the same age to be imprisoned, while all other age groups were at least twice as likely as white males to be serving a prison sentence. Black males had imprisonment rates at least 4 times those of white males in all age groups. The rates for black males age 39 or younger were more than 6 times greater than white males of the same age. Male inmates ages 18 to 19 had the largest imprisonment rate disparity between whites and blacks. Black males in this age group were almost 9.5 times more likely than white males to be in prison.
Almost 1% of all male residents in the United States were imprisoned at yearend 2012. A total of 2.8% of black, 0.5% of white, and 1.2% of Hispanic males were in state or federal prison on December 31, 2012. Among black males, this represents a decline from the rate in 2011 (3%). Between 4% and 7% of black males ages 20 to 49 were prison inmates. Black males ages 30 to 34 had the highest incarceration rate (6,932 prisoners per 100,000 black male U.S. residents ages 30 to 34). This age group also had the highest imprisonment rates among white and Hispanic males in 2012.
Among female prisoners in 2012, black females ages 18 to 19 were 3 times more likely to be imprisoned than white females. Hispanic females in this age group had imprisonment rates nearly twice those of white females. White and Hispanic females approached parity imprisonment rates among prisoners ages 35 to 44. Hispanic females age 65 or older were more than twice as likely as white females of this age to be serving time in prison, the age group of greatest disparity. Black and white female imprisonment rates were closest among prisoners ages 25 to 39, when black females were less than twice as likely as white females to be imprisoned.

PRISONERS IN 2012: TRENDS IN ADMISSIONS AND RELEASES, 1991–2012 | DECEMBER 2013 26
Other select findings � In 2012, the number of prisoners released increased in
27 states (appendix table 1).
� Blacks accounted for 40% of all unconditional releases from state prison in 2001, 2006, and 2011 (appendix table 2).
� Inmates under age 45 accounted for 80% of federal and state prison admissions in 2012, compared to 72% of the yearend prison population in 2012, and 77% of released prisoners (appendix tables 3–5).
� The total U.S. prison population declined for the third consecutive year in 2012, to 1,570,400 prisoners on December 31, 2012 (appendix table 6).
� The proportion of the U.S. prison population housed in private prisons increased from 8.2% in 2011 to 8.7% in 2012 (appendix table 7).
� A total of 137,200 inmates were in the custody of private prisons at yearend 2012, a 5% increase over the 131,000 inmates in 2011.
� The number of prison inmates housed in local jail facilities on December 31, 2012 (83,600 inmates) was 2% higher than at yearend 2011.
� In 2012, the number of inmates held in local jails increased in 16 states.
� Four states housed more than 25% of their prison populations in local jails on December 31, 2012: Louisiana (52%), Kentucky (38%), Tennessee (30%), and Mississippi (29%).
� U.S. prisons held 92,900 persons identified as noncitizens in 2012, down from 102,800 noncitizen inmates in 2011 (appendix table 8). Because state and federal departments of corrections have varying definitions of noncitizen, readers should exercise caution when interpreting these results.
� State prisons held 1,300 inmates under age 18 in custody on December 31, 2012.
� Based on their reported custody counts, 18 states and the BOP were operating prison systems above 100% of their maximum reported facility capacity (appendix table 9).
� The number of prisoners serving a sentence for violent offenses in federal prison in 2012 (11,700 inmates) decreased 4% from 2011 (12,200 inmates) (appendix table 10).
� Drug offenders accounted for 50% of the male federal prison population and 58% of the female federal prison population in 2012 (appendix table 11).
� On December 31, 2012, 12% of prisoners in the federal prison system were serving time for immigration offenses and 15% had been convicted of weapons offenses.
National Prisoner Statistics Program jurisdiction notesAlabama—Prisons have not recently been rated for official capacity, but the majority of Alabama prisons are operating in a state of overcrowding. Currently, there are 26,339 beds in operation; this represents the physical capacity for inmates but is not based on staffing, programs, and services. Operational capacity differs from the BJS definition.
Alaska—Prisons and jails form one integrated system. All NPS data include jail and prison populations housed in state and out of state. Jurisdictional totals include individuals in electronic and special monitoring programs who are under the jurisdiction of the state of Alaska. All capacity measures are the same as in 2011. The count of Asian inmates includes Pacific Islanders. Alaska does not report type of admission or release. Total admissions and releases include Alaskan reported values, but state and national totals by type of admission and release do not.
Arizona—Jurisdiction counts are based on custody data and inmates in contracted beds. The “other admissions” category includes four males and one female who were mistakenly released and readmitted during 2012.
Arkansas—Jurisdiction counts of prisoners held in local jails
include county jail back-up and inmates participating in the Act 309 Program, which provides additional space for the care and custody of state inmates on a temporary basis in state-certified adult detention facilities operated by counties and cities.
California—Population counts for inmates with maximum sentences of more than 1 year include felons who are temporarily absent, such as in court, in jail, or in a hospital. The majority of temporarily absent inmates are absent for fewer than 30 days. Population counts for unsentenced inmates include civil addicts who are enrolled for treatment and are not serving a criminal conviction sentence, but are under the jurisdiction of the California Department of Corrections and Rehabilitation. In addition, the counts of unsentenced inmates include persons housed in out-of-state contract facilities. California is unable to differentiate between inmates held in federal facilities and those held in other states’ facilities. Changes in design capacity are based on information from an annual facilities planning and management report.
Colorado—Population counts include a small, undetermined number of inmates with a maximum sentence of 1 year or less.
Revised September 2, 2014

PRISONERS IN 2012: TRENDS IN ADMISSIONS AND RELEASES, 1991–2012 | DECEMBER 2013 27
Admission and release data for inmates who are absent without leave (AWOL) or who have escaped are estimated. Design and operational capacities do not include the privately run facilities in Colorado.
Connecticut—Prisons and jails form one integrated system. All NPS data include jail and prison populations. New court commitment admissions include inmates admitted in 2012 on accused status, but who received a sentence later in 2012. Legislation in July 1995 abolished the capacity law. A facility’s capacity is a fluid number based on the needs of the department. The needs are dictated by security issues, populations, court decrees, legal mandates, staffing, and physical plant areas of facilities that are serving other purposes or have been decommissioned. The actual capacity of a facility is subject to change.
Delaware—Prisons and jails form one integrated system. All NPS data include jail and prison populations. Capacity counts include the halfway houses under the Department of Corrections.
Federal Bureau of Prisons (BOP)—Data reflect inmates under BOP jurisdiction on December 30, 2012. Jurisdiction counts include inmates housed in secure private facilities where the BOP had a direct contract with a private operator, as well as inmates housed in secure facilities where there was a subcontract with a private provider at a local government facility. Jurisdiction counts also include inmates housed in jail or short-term detention and others held in state-operated or other nonfederal secure facilities. Counts include 8,932 inmates (7,798 males and 1,134 females) held in nonsecure, privately operated community corrections centers/halfway houses and 2,659 offenders on home confinement (2,278 males and 381 females). A total of 99 male and 6 female juveniles were held in contract facilities; these inmates were included in the jurisdiction totals but excluded from the counts of private, locally operated, or federally operated facilities. Due to information system configuration, Asians and Native Hawaiians or other Pacific Islanders are combined, and inmates of Hispanic origin are included in the race categories. On December 30, 2012, BOP held 71,714 male and 4,378 female inmates of Hispanic origin. Other admissions include hospitalization and treatment. Parole violation counts combine those with and without a new sentence. Expirations of sentence include good-conduct releases that usually have a separate and distinct term of supervision, as well as releases from the residential drug abuse treatment program. Other releases include vacated sentences, completion of hospitalization or treatment, and court-ordered terminations. The BOP population on December 30, 2012, was 176,658 inmates (excluding contracted and private facilities), and the rated capacity on that date was 128,615. The crowding rate was 37%.
Florida—Other conditional releases include provisional release supervision, conditional medical release, program supervision, and parole reinstatement.
Georgia—Females are not housed in privately operated
correctional facilities in Georgia. Subtotals of race, sex, and sentence length for jurisdiction and custody counts were adjusted by the Georgia Department of Corrections using interpolation to match the overall totals.
Hawaii—Prisons and jails form one integrated system. All NPS data include jail and prison populations. In custody and jurisdiction counts, sentenced felon probationers and probation violators are included with the counts of prisoners with a total maximum sentence of 1 year or less. Jurisdiction counts include dual-jurisdiction (state of Hawaii or federal) inmates currently housed in federal facilities and in contracted beds. Hawaii does not have a rated capacity for the integrated prisons and jail system. Information on foreign nationals held in correctional facilities was based on self-reports by inmates.
Idaho—Idaho defines rated capacity as 100% of maximum capacity and operational capacity as 95% of maximum capacity. Design capacity is based on original facility-designed occupancy.
Illinois—Illinois did not submit NPS data in 2012. See Methodology for a description of the data imputation procedure.
Iowa—In 2009, the Iowa Department of Corrections began including offenders on work release, the Operating While Intoxicated population, and Iowa inmates housed in out-of-state prisons and in jurisdiction counts. Iowa data included in BJS reports prior to 2009 were custody counts only. Jurisdiction counts include Iowa offenders housed in prisons in other jurisdictions who are under Iowa’s jurisdiction. The data quality and collection methodology were updated in 2012; therefore, changes from previous years’ counts may reflect these updates. Absent without leave (AWOL) admissions and releases are for the work release and the Operating While Intoxicated population. Escape admissions and releases are for the prison population only; this differs from the 2011 counts, which included escapes from work release.
Kansas—Jurisdiction counts of inmates with sentences of less than 1 year are available for 2012, but not for 2011. Admissions and releases reflect movements of the custody population with the exception of transfers, which include all Kansas prisoners regardless of custody status.
Kentucky—The decrease in the number of unconditional releases between 2011 and 2012 is due to the implementation of a mandatory reentry supervision law, which became effective on January 1, 2012.
Louisiana—Jurisdiction and capacity counts are correct as of December 27, 2012.
Maine—Fewer male state prisoners are housed in county facilities due to overcrowding at the local level. The state has been adding capacity and double-bunking at prisons.
PRISONERS IN 2012: TRENDS IN ADMISSIONS AND RELEASES, 1991–2012 | DECEMBER 2013 28
Maryland—The number of inmates with maximum sentences of more than 1 year is estimated by taking the percentages for these prisoners from the automated totals and applying them to the manual totals submitted for NPS. The number of male inmates included in the jurisdiction count of prisoners held in other state facilities may include a small number of female inmates. Maryland’s system does not capture Hispanic origin. An undetermined number of Native Hawaiians and other Pacific Islanders may be included in the count of American Indian/Alaska Natives. Maryland’s system does not distinguish between AWOL and escape releases, nor does it record the sex of inmates housed in out-of-state private prisons. The count of admissions by new court commitments may include a small but undetermined number of returns from appeal or bond. The count of unconditional releases includes court-ordered releases and a small but undetermined number of releases to appeal or bond. Other release types include interstate compact releases and releases of new admissions that were counted twice.
Massachusetts—By law, offenders in Massachusetts may be sentenced to terms of up to 2.5 years in locally operated jails and correctional institutions. This population is excluded from the state count, but is included in published population counts and rates for local jails and correctional institutions. Jurisdiction counts exclude approximately 3,271 inmates in the county system (local jails and houses of correction) who are serving a sentence of more than 1 year, but these inmates are included in imprisonment rate calculations at the request of the Massachusetts Department of Corrections. Jurisdiction and custody counts may include a small but undetermined number of inmates who were remanded to court; transferred to the custody of another state, federal, or locally operated system; or subsequently released. Due to the opening of a new correctional facility for females, the admissions, releases, and custody population of county-sentenced females serving under the jurisdiction of the Department of Corrections has decreased. After legislative changes to reduce discretionary parole releases in 2011 that caused fluctuations in the number and rate of persons released on parole, these measures remained stable during 2012. This has resulted in an apparently higher parole rate in 2012 than in 2011 for both males and females. In 2012, 261 inmates received unconditional court releases due to falsification of drug tests by one of the chemists in the state drug lab.
Michigan—Operational capacity includes institution and camp net operating capacities, as well as the population of community programs on December 31, 2012. Michigan’s new database system treats Hispanic as an ethnicity rather than a race. Because this is currently an optional field, the numbers for Hispanics are significantly underreported, and the state included them in the white race category. Escape releases and admissions consist predominantly of zero-tolerance escapes from community residential programs.
Minnesota—Jurisdiction counts include inmates temporarily housed in local jails, on work release, or on community work crew programs. Minnesota only measures operational capacity.
Admissions and releases due to AWOL or escape, returns from or releases to appeal or bond, and releases due to transfer are not included in Minnesota’s database file.
Mississippi—Custody counts exclude county regional facilities, while jurisdiction counts include these facilities. Local jails and county regional facilities are included in the jurisdiction count of inmates housed at local facilities. Parole and conditional release violators are not distinguished by their sentence status in the Mississippi file.
Missouri—The Missouri Department of Corrections does not have the design capacity of its older prisons, nor does it update design capacity for prison extension or improvements. Missouri does not use a rated capacity. The state defines operational capacity as the number of available beds, including those temporarily offline. Noncitizen data are based on self-reported place of birth.
Nebraska—By statute, inmates are housed where they are sentenced by the judge and are never housed in local jails or by another state to ease prison crowding. Nebraska defines operational capacity as its stress capacity, which is 125% of design capacity for designated facilities. The total design and operational capacity for institutions that house females includes only one multicustody facility. The department operates two co-ed facilities that represent a design capacity of 290, and that are counted in the male design and operational capacities.
Nevada—Nevada did not submit NPS data in 2012. See Methodology for a description of the data imputation procedure.
New Hampshire—The new offender database management system reports the number of inmates who are under New Hampshire’s jurisdiction but housed in other state facilities in a different manner from NPS submissions prior to 2010. New Hampshire’s operating capacity is defined as the inmate population on any given day.
New Jersey—Population counts for inmates with a maximum sentence of more than 1 year include inmates with sentences of 1 year. The New Jersey Department of Corrections has no jurisdiction over inmates with sentences of less than 1 year or over unsentenced inmates. Reporting of other conditional release admissions has changed from 2011 to better reflect the sentence status of inmates. Other releases include inmates brought too soon from the county jails into the state prison system, then released back to the county jails. New Jersey has recently undertaken a review of its prison system capacity, resulting in updated counts in 2012.
New Mexico—New Mexico does not include its inmates housed in other states under the interstate compact agreement in its total jurisdiction count. According to BJS definitions, these inmates should be included in the total state jurisdiction, and were in this report.

PRISONERS IN 2012: TRENDS IN ADMISSIONS AND RELEASES, 1991–2012 | DECEMBER 2013 29
North Carolina—As of December 1, 2011, North Carolina prisons no longer house misdemeanor offenders with sentences of less than 180 days. Rated capacity is not available. Captured escapees are not considered a prison admission type in North Carolina, and escape is not considered a type of prison release. Supervised mandatory releases are postrelease offenders. Postrelease supervision is defined as a reintegration program for serious offenders who have served extensive prison terms. This form of supervision was created by the Structured Sentencing Act of 1993.
North Dakota—Capacities include a new facility that opened in 1998 and account for double bunking in the state penitentiary.
Ohio—Population counts for inmates with a maximum sentence of more than 1 year include an undetermined number of inmates with a sentence of 1 year or less. Counts of inmates who are under Ohio’s jurisdiction but housed in federal or other state facilities are estimates. Counts of admission and release types reflect revised reporting methods. Admissions of parole violators without a new sentence include only formally revoked violators. Returns and conditional releases involving transitional control inmates are reported only after movement from confinement to a terminal release status occurs.
Oklahoma—Jurisdiction counts exclude inmates from other states who were serving time in Oklahoma prisons under the interstate compact and inmates sentenced to the Department of Corrections but not yet in custody. Jurisdiction counts include offenders in a Department of Corrections jail program, those in court, and escapees in the custody of local jails. Most inmates with sentences of less than 1 year were part of the Oklahoma Delayed Sentencing Program for Young Adults. Offenders in the custody of other states and the BOP are mostly escapees. Capacity counts have changed in Oklahoma, as only Department of Corrections facilities have an approved capacity determined by the Board of Corrections according to the standards of the American Correctional Association. Noncitizen status is determined by country of birth.
Oregon—Most offenders with a maximum sentence of less than 1 year remain under the custody of local counties rather than the Oregon Department of Corrections. Oregon does not recognize rated capacity.
Pennsylvania—All Pennsylvania inmates housed in Virginia were brought back to serve time in Pennsylvania in March 2012.
Rhode Island—Prisons and jails form one integrated system. All NPS data include jail and prison populations. Jurisdiction counts include inmates who have dual jurisdiction, or those serving Rhode Island sentences out of state while serving that state’s sentence as well. The Rhode Island data system records Hispanic as a race rather than an ethnicity and does not capture Native Hawaiian/Other Pacific Islanders or persons identifying as two or more races. Prison admissions classified as escape returns include admissions under home confinement, serving out of state, and minimum-security facilities.
South Carolina—The December 31, 2012, custody count of unsentenced individuals includes Interstate Compact Commission inmates. As of July 1, 2003, the South Carolina Department of Corrections (SCDC) began releasing inmates due for release and housed in SCDC institutions on the first day of each month. Since January 1, 2013, was a holiday, inmates eligible for release on January 1 were released on December 31, 2012. Therefore, the inmate count was at its lowest point for the month on December 31, 2012. All inmates in private facilities in South Carolina were housed in private medical facilities. Conditional release counts include inmates released under community supervision after serving 85% of their sentence under truth in sentencing. The SCDC has implemented new intensive supervision services, which are designed to promote community safety and ensure the successful reentry of young offenders back into the community. South Carolina uses the operational capacity concept in its management reports and other requested surveys.
South Dakota—Custody and jurisdiction counts of inmates serving a maximum sentence of 1 year or less included those under the sentence of probation who, as a condition of probation, must serve up to 180 days in state prison. The custody count of unsentenced inmates included all holds for the U.S. Marshals Service (sentenced and unsentenced). Commutations are not tracked separately in the South Dakota reporting system; however, they are included in expiration of sentence, supervised mandatory release, or other conditional releases. South Dakota does not separate discretionary and presumptive parole releases. The operational capacity reported is planned capacity. South Dakota does not have rated or design capacities.
Tennessee—The sex of six inmates could not be identified and were counted as males in the jurisdiction counts. Eleven inmates could not be assigned to a race category, including five females and the six assigned male inmates.
Texas—Offenders in custody were all offenders serving time in a facility owned and operated by the Texas Department of Criminal Justice at the time of data collection. Jurisdiction counts include offenders in custody and those held in privately operated prisons, intermediate-sanction facilities, substance abuse felony punishment facilities, pre-parole transfer facilities, and halfway houses; offenders temporarily released to a county for less than 30 days; and offenders awaiting paperwork for transfer to state-funded custody. Capacities exclude county jail beds because they do not have a minimum or maximum number of beds available for paper-ready and bench-warrant inmates. Admissions and releases include offenders received into an intermediate-sanction facility, which is a sanction in lieu of revocation. These offenders were counted in the parole violator category.
Vermont—Prisons and jails form one integrated system. All NPS data include jail and prison populations. Hispanic origin and persons identifying as two or more races are not collected or recorded in Vermont.

PRISONERS IN 2012: TRENDS IN ADMISSIONS AND RELEASES, 1991–2012 | DECEMBER 2013 30
Virginia—Jurisdiction counts were for December 31, 2012. As of September 1, 1998, the state is responsible for inmates with a sentence of 1 year or more, or a sentence of 12 months plus 1 day. The state was responsible for a 1-year sentence, while local authorities were responsible for a 12-month sentence. Inmates with a sentence of 12 months or less were not the responsibility of the state. New court commitments are based on fiscal year 2012, while parole violation admissions and all releases are based on calendar year 2012. The Virginia Department of Corrections maintains a count of beds (called authorized capacity) that is provided as the measure of rated capacity in this survey. The number of beds assigned by rating officials (Virginia Department of Corrections) to institutions takes into account the number of inmates who can be accommodated based on staff, programs, services, and design. Native Hawaiians and Pacific Islanders are included in the Asian race category.
Washington—Offenders sentenced to 1 year or less and unsentenced offenders generally reside in county jails, but revisions to law allow certain inmates with sentences of less than 1 year to be housed in prison. These inmates are included
in the total jurisdiction counts. Native Hawaiians and Pacific Islanders are included in the Asian race category.
Wisconsin—Custody and jurisdiction counts include 722 temporary probation and parole placements. The jurisdiction count excludes 27 male and 2 female prisoners because they were not serving a Wisconsin sentence. In 2012, both the female custody and jurisdiction populations increased, probably due to more new court commitments and parole violation admissions. Wisconsin does not code escapes as releases and returns from the escape as admissions. In 2012, 19 males and 1 female were on escape status. Design capacities for local jails and for federal, other state, and private facilities are excluded from the total design capacity measure. The reported design capacity includes the following facilities currently housing Wisconsin adult inmates: a state juvenile facility with a design capacity of 400, a non-Department of Corrections facility with a design capacity of 362, and 29 beds contracted in 20 Wisconsin county jails to temporarily house Department of Corrections inmates. The number of contracted beds has declined substantially from the 97 beds reported in 2011.
Terms and definitionsAdult imprisonment rate—The number of prisoners under state or federal jurisdiction sentenced to more than 1 year per 100,000 U.S. residents age 18 or older.
Average annual change—Average (mean) annual change across a specific period.
Capacity, design—The number of inmates that planners or architects intended for a facility.
Capacity, highest—The maximum number of beds reported across the three capacity measures: design capacity, operational capacity, and rated capacity.
Capacity, lowest—The minimum number of beds across the three capacity measures: design capacity, operational capacity, and rated capacity.
Capacity, operational—The number of inmates that can be accommodated based on a facility’s staff, existing programs, and services.
Capacity, rated—The number of beds or inmates assigned by a rating official to institutions within a jurisdiction.
Conditional releases—Includes discretionary parole, mandatory parole, postcustody probation, and other unspecified conditional releases.
Conditional release violators—Readmission to prison of persons released to discretionary parole, mandatory parole, postcustody probation, and other unspecified conditional releases.
Custody—Prisoners held in the physical custody of state or federal prisons or local jails, regardless of sentence length or authority having jurisdiction.
Imprisonment rate—The number of prisoners under state or federal jurisdiction sentenced to more than 1 year per 100,000 U.S. residents of all ages.
Inmate—A person incarcerated in a local jail, state prison, federal prison, or a private facility under contract to federal, state, or local authorities.
Jail—A confinement facility usually administered by a local law enforcement agency that is intended for adults, but sometimes holds juveniles, for confinement before and after adjudication. Such facilities include jails and city or county correctional centers; special jail facilities, such as medical treatment or release centers; halfway houses; work farms; and temporary holding or lockup facilities that are part of the jail’s combined function. Inmates sentenced to jail facilities usually have a sentence of 1 year or less. Alaska, Connecticut, Delaware, Hawaii, Rhode Island, and Vermont operate integrated systems, which combine prisons and jails.
Jurisdiction—The legal authority of state or federal correctional officials over a prisoner, regardless of where the prisoner is held.
New court commitments—Admissions into prison of offenders convicted and sentenced by a court, usually to a term of more than 1 year, including probation violators and persons with a split sentence to incarceration followed by court-ordered probation or parole.
Parole violators—All conditional release violators returned to prison for either violating conditions of release or for new crimes.

PRISONERS IN 2012: TRENDS IN ADMISSIONS AND RELEASES, 1991–2012 | DECEMBER 2013 31
Prison—A long-term confinement facility, run by a state or the federal government, that typically holds felons and offenders with sentences of more than 1 year. However, sentence length may vary by state. Alaska, Connecticut, Delaware, Hawaii, Rhode Island, and Vermont operate integrated systems, which combine prisons and jails.
Prisoner—An individual confined in a correctional facility under the legal authority (jurisdiction) of state or federal correctional officials.
Sentenced prisoner—A prisoner sentenced to more than 1 year.
Supervised mandatory releases—Conditional release with postcustody supervision generally occurring in jurisdictions using determinate sentencing statutes.
Unconditional releases—Expirations of sentences, commutations, and other unspecified unconditional releases.
MethodologyStarted in 1926 under a mandate from Congress, the National Prisoner Statistics (NPS) Program collects annual data on prisoners at yearend. The Bureau of Justice Statistics (BJS) sponsors the survey, and the U.S. Census Bureau serves as the data collection agent. BJS depends entirely on voluntary participation by state departments of corrections and the Federal Bureau of Prisons (BOP) for NPS data.
The NPS distinguishes between inmates in custody and prisoners under jurisdiction. To have custody of a prisoner, a state or the BOP must hold that inmate in one of its facilities. To have jurisdiction over a prisoner, the state or BOP must have legal authority over that prisoner, regardless of where the prisoner is incarcerated or supervised. Some states were unable to provide counts that distinguish between custody and jurisdiction. (See National Prisoner Statistics Program jurisdiction notes to determine which states did not distinguish between custody and jurisdiction counts.)
The NPS jurisdiction counts include persons held in prisons, penitentiaries, correctional facilities, halfway houses, boot camps, farms, training or treatment centers, and hospitals. Counts also include prisoners who were temporarily absent (less than 30 days), in court, or on work release; housed in privately operated facilities, local jails, or other state or federal facilities; and serving concurrent sentences for more than one correctional authority.
The NPS custody counts include all inmates held within a respondent’s facilities, including inmates housed for other correctional facilities. The custody counts exclude inmates held in local jails and in other jurisdictions. With a few exceptions, the NPS custody counts include inmates held in privately operated facilities.
Respondents to NPS surveys are permitted to update prior counts of prisoners held in custody and under jurisdiction. Some statistics on jurisdiction and sentenced prison populations for prior years have been updated in this report. All tables showing data based on jurisdiction counts, including tables of imprisonment rates, were based on the updated and most recently available data that respondents provided.
Admissions include new court commitments, parole violator returns, and other conditional release violator returns; transfers from other jurisdictions; returns of prisoners who were absent without leave (AWOL), with or without a new
sentence; escape returns, with or without a new sentence; returns from appeal or bond, and other admissions. For reporting purposes, BJS admission counts exclude transfers from other jurisdictions, AWOL returns, and escape returns.
Releases include unconditional releases (e.g., expirations of sentence or commutations), conditional releases (e.g., probations, supervised mandatory releases, or discretionary paroles), deaths, AWOLs, escapes from confinement, transfers to other jurisdictions, releases to appeal or bond, and other releases. For reporting purposes, BJS release counts exclude AWOLs, escapes, and transfers to other jurisdictions.
The NPS has historically included counts of inmates in the combined jail/prison systems in Alaska, Connecticut, Delaware, Hawaii, Rhode Island, and Vermont. The District of Columbia has not operated a prison system since yearend 2001. Felons sentenced under the District of Columbia criminal code are housed in federal facilities. Jail inmates in the District of Columbia are included in the Annual Survey of Jails. Some previously published prisoner counts and the percentage change in population include jail inmates in the District of Columbia for 2001, the last year of collection.
Additional information about the NPS, including the data collection instrument, is available on the BJS website at www.bjs.gov.
Nonreporting states
As of September 13, 2013, Illinois and Nevada had not reported any 2012 custody, jurisdiction, admission, release, or capacity data to the NPS. For both states, BJS compared past NPS submissions with analogous counts reported on their departments of corrections websites. If the ratio of past NPS data to the website data from the same year was stable over 6 years, BJS assumed that the website data could be used in this report. To generate estimates for Nevada, BJS used statistical data published on the Nevada Department of Corrections website (http://www.doc.nv.gov/sites/doc/files/pdf/stats/2012/12/StatFacts122012.pdf) for total and sex-specific custody, jurisdiction, admission and release counts, and a race and Hispanic origin distribution of the custody population as of December 31, 2012. BJS applied the 2011 proportion of unsentenced prisoners and prisoners with sentences of 1 year

PRISONERS IN 2012: TRENDS IN ADMISSIONS AND RELEASES, 1991–2012 | DECEMBER 2013 32
or less or more than 1 year to the 2012 custody and jurisdiction totals, which assumes that the distribution of sentence length did not change between 2011 and 2012. BJS also assumed that the proportion of the Nevada prison jurisdiction population housed in local jails in 2012 was the same as that reported in 2011. Similarly, BJS used the 2011 distribution of admission and release types to generate estimates from the 2012 admission and release totals. BJS used an estimate of operating capacity from June 30, 2012 (http://www.doc.nv.gov/sites/doc/files/pdf/stats/2012/12/SS_QRII_FY13.pdf). Estimates of the custody counts for Nevada were compared with the state’s submission of National Corrections Reporting Program (NCRP) data.
November 30, 2012, is the date closest to December 31, 2012, for which data were available on the Illinois Department of Corrections website (http://www2.illinois.gov/idoc/reportsandstatistics/Documents/IDOC_Quarterly%20Report_Jan_%202013.pdf). Illinois has reported identical custody and jurisdiction data to the NPS for the past 10 years; therefore, BJS made the assumption that the 2012 custody and jurisdiction counts would again be the same. BJS applied the 2011 distribution of sentence length (unsentenced, sentenced to 1 year or less, sentenced to more than 1 year) to the 2012 counts. The 2011 race and Hispanic origin distribution from Illinois was applied to the custody and jurisdiction total count from November 30, 2012.
The 2011 distribution of admission and release types was used to estimate the types of admissions and releases in 2012. BJS obtained monthly counts of admissions and releases from two quarterly reports (http://www2.illinois.gov/idoc/reportsandstatistics/Documents/IDOC_Quarterly%20Report_Apr_%202013.pdf and http://www2.illinois.gov/idoc/reportsandstatistics/Documents/IDOC_Quarterly%20Report_Jul%202012.pdf). Since these were not sex-specific counts, after summing to obtain 2012 totals, BJS applied the 2011 sex ratios for admissions and releases to the 2012 data, assuming that the proportion of males and females entering or exiting prison had not changed during 2012. Finally, BJS applied the 2011 sex-specific admission and release type distributions on the 2012 totals. Capacity counts were obtained from the April 2013 Illinois Department of Corrections quarterly report, and reflect state prison capacity as of February 28, 2013.
The imputed counts were used to calculate overall state and national totals of prisoners, and are footnoted in state-specific tables.
Estimating yearend counts of prison population, admissions, and releases by age, sex, and race or Hispanic origin
National-level estimates of the number of persons by race admitted to, released from, or under the jurisdiction of state prisons on December 31, 2012, were based on an adjustment of NPS counts to comply with Office of Management and Budget
(OMB) definitions of race and Hispanic origin. OMB defines persons of Hispanic or Latino origin as a separate category. Race categories are defined exclusive of Hispanic origin. OMB adopted guidelines for the collection of these data in 1997, requiring the collection of data on Hispanic origin in addition to data on race.
Not all NPS providers’ information systems categorize race and Hispanic origin in this way; in 1991, the earliest time point in the analysis, only a few states were able to report information on Hispanics separately from race. BJS adjusts the NPS data on race and Hispanic origin by the ratio of the relative distribution of prisoners by race and Hispanic origin in self-report inmate surveys that use OMB categories for race to the relative distribution of prisoners by race and Hispanic origin in the NPS data. This ratio was calculated for the year(s) in which BJS had an inmate survey and NPS data. For this report, the 1991 Survey of Inmates in State Correctional Facilities was used to calculate the ratio used for statistics on racial distributions in 1991; however, because so few states reported Hispanic origin in the 1991 NPS, BJS did not estimate statistics for Hispanics in 1991. The 2004 Survey of Inmates in State Correctional Facilities was used for the 2001, 2006, 2011, and 2012 time points. The ratio obtained by comparing the within-year relative distributions by race and Hispanic origin was then multiplied by the NPS distribution in a year to generate the estimate of persons by race and Hispanic origin.
Estimates of the total number of sentenced prisoners, admissions, and releases by age, sex, race, and Hispanic origin on December 31, 2012, were generated by creating separate totals for federal and state prisons. For the federal estimates, each sex-race count that BOP reported to the NPS was multiplied by the ratio of the age category count within the sex-race combination in the Federal Justice Statistics Program (FJSP) to the FJSP total count within the sex-race combination (e.g., FJSP white males ages 18 to 19 divided by FJSP white males). The resulting product yielded the FJSP-adjusted NPS counts for each sex-race combination by age group (e.g., white male prisoners ages 18 to 19 in the federal prison system). State prison age distributions for the NPS use a similar sex-race ratio adjustment based on individual-level data from the NCRP. State and federal estimates were added together to obtain national estimates for prison admissions, prison releases, and yearend prison populations.
Estimating imprisonment rates by age, sex, and race or Hispanic origin
Age-specific imprisonment rates for each age-sex-race group were calculated by dividing the estimated number of sentenced prisoners within each age group under jurisdiction on December 31, 2012, by the estimated number of U.S. residents in each age group on January 1, 2013. The result was multiplied by 100,000 and rounded to the nearest whole number. Totals by sex include all prisoners and U.S. residents, regardless of race or Hispanic origin.
PRISONERS IN 2012: TRENDS IN ADMISSIONS AND RELEASES, 1991–2012 | DECEMBER 2013 33
Estimating offense distribution in the state prison population, admissions, and releases by age, sex, and race or Hispanic origin
Total counts of admissions and releases excluded transfers, escapees, and those absent without leave (AWOL). Parole violation admissions included all conditional release violators returned to prison for either violations of conditions or for new crimes. BJS employed a ratio adjustment method to weight the individual-level race and Hispanic origin or sex-specific offense data from the NCRP to the state prison control totals for sex and the estimated race or Hispanic origin from the NPS, thereby yielding a national offense distribution for state prisoners. Inmates missing offense data were excluded from the analysis prior to the weighting. Because data submission for the NCRP typically lags behind that of the NPS, offense distribution estimates are published for the previous calendar year.
Prison capacities
State and federal correctional authorities provide three measures of their facilities’ capacity: design capacity, operational capacity, and rated capacity. Estimates of the prison populations as a percentage of capacity are based on a state or federal custody population. In general, state capacity and custody counts exclude inmates held in private facilities, although five states include prisoners held in private facilities as part of the capacity of their prison systems: Florida, Georgia, Idaho, Louisiana, and Mississippi. For these states, prison population as a percentage of capacity includes private facilities.
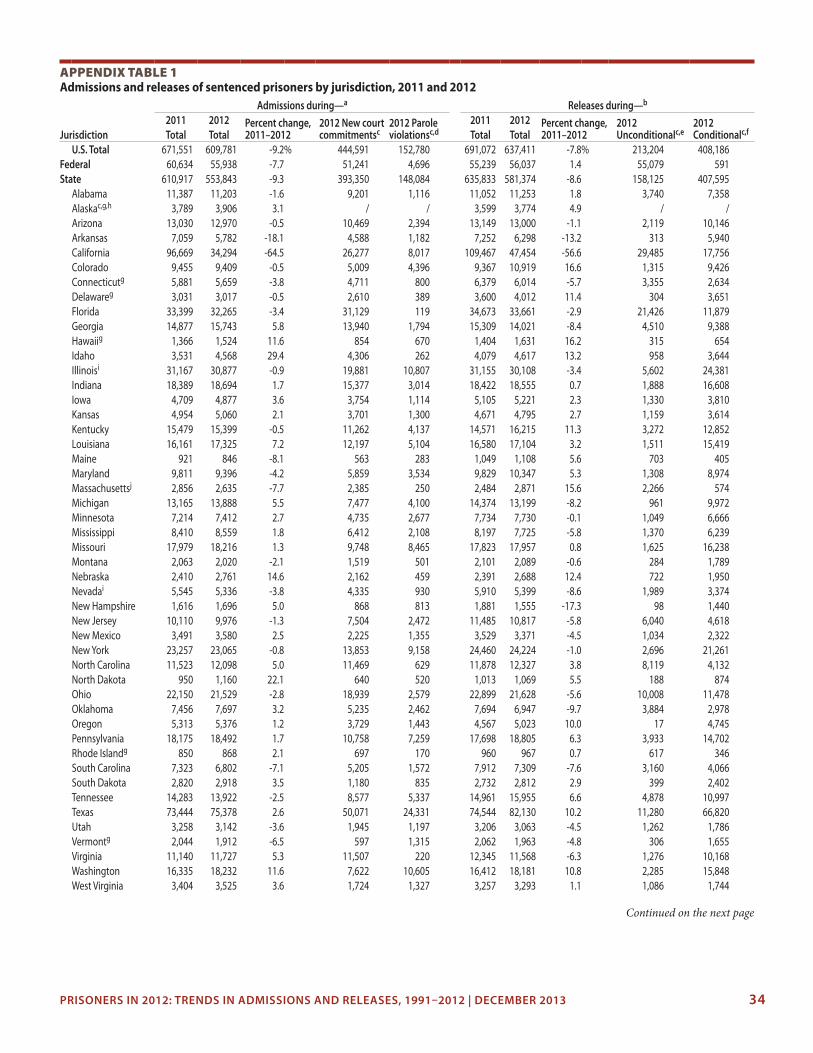
PRISONERS IN 2012: TRENDS IN ADMISSIONS AND RELEASES, 1991–2012 | DECEMBER 2013 34
appendix Table 1Admissions and releases of sentenced prisoners by jurisdiction, 2011 and 2012
Admissions during—a Releases during—b
2011 2012 Percent change, 2011–2012
2012 New court commitmentsc
2012 Parole violationsc,d
2011 2012 Percent change, 2011–2012
2012 Unconditionalc,e
2012 Conditionalc,fJurisdiction Total Total Total Total
U.S. Total 671,551 609,781 -9.2% 444,591 152,780 691,072 637,411 -7.8% 213,204 408,186Federal 60,634 55,938 -7.7 51,241 4,696 55,239 56,037 1.4 55,079 591State 610,917 553,843 -9.3 393,350 148,084 635,833 581,374 -8.6 158,125 407,595
Alabama 11,387 11,203 -1.6 9,201 1,116 11,052 11,253 1.8 3,740 7,358Alaskac,g,h 3,789 3,906 3.1 / / 3,599 3,774 4.9 / /Arizona 13,030 12,970 -0.5 10,469 2,394 13,149 13,000 -1.1 2,119 10,146Arkansas 7,059 5,782 -18.1 4,588 1,182 7,252 6,298 -13.2 313 5,940California 96,669 34,294 -64.5 26,277 8,017 109,467 47,454 -56.6 29,485 17,756Colorado 9,455 9,409 -0.5 5,009 4,396 9,367 10,919 16.6 1,315 9,426Connecticutg 5,881 5,659 -3.8 4,711 800 6,379 6,014 -5.7 3,355 2,634Delawareg 3,031 3,017 -0.5 2,610 389 3,600 4,012 11.4 304 3,651Florida 33,399 32,265 -3.4 31,129 119 34,673 33,661 -2.9 21,426 11,879Georgia 14,877 15,743 5.8 13,940 1,794 15,309 14,021 -8.4 4,510 9,388Hawaiig 1,366 1,524 11.6 854 670 1,404 1,631 16.2 315 654Idaho 3,531 4,568 29.4 4,306 262 4,079 4,617 13.2 958 3,644Illinoisi 31,167 30,877 -0.9 19,881 10,807 31,155 30,108 -3.4 5,602 24,381Indiana 18,389 18,694 1.7 15,377 3,014 18,422 18,555 0.7 1,888 16,608Iowa 4,709 4,877 3.6 3,754 1,114 5,105 5,221 2.3 1,330 3,810Kansas 4,954 5,060 2.1 3,701 1,300 4,671 4,795 2.7 1,159 3,614Kentucky 15,479 15,399 -0.5 11,262 4,137 14,571 16,215 11.3 3,272 12,852Louisiana 16,161 17,325 7.2 12,197 5,104 16,580 17,104 3.2 1,511 15,419Maine 921 846 -8.1 563 283 1,049 1,108 5.6 703 405Maryland 9,811 9,396 -4.2 5,859 3,534 9,829 10,347 5.3 1,308 8,974Massachusettsj 2,856 2,635 -7.7 2,385 250 2,484 2,871 15.6 2,266 574Michigan 13,165 13,888 5.5 7,477 4,100 14,374 13,199 -8.2 961 9,972Minnesota 7,214 7,412 2.7 4,735 2,677 7,734 7,730 -0.1 1,049 6,666Mississippi 8,410 8,559 1.8 6,412 2,108 8,197 7,725 -5.8 1,370 6,239Missouri 17,979 18,216 1.3 9,748 8,465 17,823 17,957 0.8 1,625 16,238Montana 2,063 2,020 -2.1 1,519 501 2,101 2,089 -0.6 284 1,789Nebraska 2,410 2,761 14.6 2,162 459 2,391 2,688 12.4 722 1,950Nevadai 5,545 5,336 -3.8 4,335 930 5,910 5,399 -8.6 1,989 3,374New Hampshire 1,616 1,696 5.0 868 813 1,881 1,555 -17.3 98 1,440New Jersey 10,110 9,976 -1.3 7,504 2,472 11,485 10,817 -5.8 6,040 4,618New Mexico 3,491 3,580 2.5 2,225 1,355 3,529 3,371 -4.5 1,034 2,322New York 23,257 23,065 -0.8 13,853 9,158 24,460 24,224 -1.0 2,696 21,261North Carolina 11,523 12,098 5.0 11,469 629 11,878 12,327 3.8 8,119 4,132North Dakota 950 1,160 22.1 640 520 1,013 1,069 5.5 188 874Ohio 22,150 21,529 -2.8 18,939 2,579 22,899 21,628 -5.6 10,008 11,478Oklahoma 7,456 7,697 3.2 5,235 2,462 7,694 6,947 -9.7 3,884 2,978Oregon 5,313 5,376 1.2 3,729 1,443 4,567 5,023 10.0 17 4,745Pennsylvania 18,175 18,492 1.7 10,758 7,259 17,698 18,805 6.3 3,933 14,702Rhode Islandg 850 868 2.1 697 170 960 967 0.7 617 346South Carolina 7,323 6,802 -7.1 5,205 1,572 7,912 7,309 -7.6 3,160 4,066South Dakota 2,820 2,918 3.5 1,180 835 2,732 2,812 2.9 399 2,402Tennessee 14,283 13,922 -2.5 8,577 5,337 14,961 15,955 6.6 4,878 10,997Texas 73,444 75,378 2.6 50,071 24,331 74,544 82,130 10.2 11,280 66,820Utah 3,258 3,142 -3.6 1,945 1,197 3,206 3,063 -4.5 1,262 1,786Vermontg 2,044 1,912 -6.5 597 1,315 2,062 1,963 -4.8 306 1,655Virginia 11,140 11,727 5.3 11,507 220 12,345 11,568 -6.3 1,276 10,168Washington 16,335 18,232 11.6 7,622 10,605 16,412 18,181 10.8 2,285 15,848West Virginia 3,404 3,525 3.6 1,724 1,327 3,257 3,293 1.1 1,086 1,744
Continued on the next page

PRISONERS IN 2012: TRENDS IN ADMISSIONS AND RELEASES, 1991–2012 | DECEMBER 2013 35
appendix Table 1 (continued) Admissions and releases of sentenced prisoners by jurisdiction, 2011 and 2012
Admissions during—a Releases during—b
2011 2012 Percent change, 2011–2012
2012 New court commitmentsc
2012 Parole violationsc,d
2011 2012 Percent change, 2011–2012
2012 Unconditionalc,e
2012 Conditionalc,fJurisdiction Total Total Total Total
Wisconsin 6,411 6,200 -3.3 3,774 2,426 7,825 7,724 -1.3 467 7,213Wyoming 857 907 5.8 770 137 787 878 11.6 213 659
Note: As of December 31, 2001, sentenced felons from the District of Columbia are the responsibility of the Federal Bureau of Prisons./Not reported.aCounts based on prisoners with a sentence of more than 1 year. Counts exclude transfers, escapes, and those absent without leave (AWOL). Totals include other conditional release violators, returns from appeal or bond, and other admissions. See Methodology.bCounts based on prisoners with a sentence of more than 1 year. Counts exclude transfers, escapes, and those absent without leave (AWOL). Totals include deaths, releases to appeal or bond, and other releases. See Methodology.cAlaska did not report type of admission or release. Total admissions and releases include Alaskan reported values, but state and national totals by type of admission and release do not.dIncludes all conditional release violators returned to prison for either violations of conditions of release or for new crimes.eIncludes releases to probation, supervised mandatory releases, and other unspecified conditional releases.fIncludes expirations of sentence, communtations, and other unconditional releases.gPrisons and jails form one integrated system. Data include total jail and prison populations.hState updated 2011 admission and release totals.iState did not report 2012 NPS data. Total number of admissions and releases imputed, and types of admission and release based on 2011 distribution. See Methodology.jChanges made in the legislature to reduce discretionary paroles in 2011 are reflected in a higher parole rate in 2012.Source: Bureau of Justice Statistics, National Prisoner Statistics Program, 2011–2012.

PRISONERS IN 2012: TRENDS IN ADMISSIONS AND RELEASES, 1991–2012 | DECEMBER 2013 36
appendix Table 2 Estimated unconditional releases from state prison, by race, Hispanic origin, and most serious offense, 1991, 2001, 2006, and 2011
1991a 2001b 2006b 2011b
Most serious offensec White Black Whited Blackd Hispanic Whited Blackd Hispanic Whited Blackd HispanicTotal 100% 100% 100% 100% 100% 100% 100% 100% 100% 100% 100%
Violent 26.2% 29.5% 26.5% 27.1% 32.9% 22.1% 27.7% 30.5% 20.4% 23.3% 24.6%Murdere 1.4 1.1 0.8 1.0 1.5 0.6 0.8 1.0 0.5 0.7 0.6Negligent manslaughter 2.3 1.7 0.8 0.6 1.1 0.7 0.5 0.8 0.6 0.5 0.6Rape/sexual assault 8.8 4.1 9.2 3.9 5.9 6.7 4.5 6.7 5.4 2.9 4.5Robbery 6.5 13.2 5.4 11.1 10.2 4.0 9.9 8.0 3.5 8.4 5.4Assault 5.3 8.2 8.1 9.2 11.7 8.1 10.2 11.7 8.0 8.8 10.7Other violent 2.0 1.2 2.1 1.4 2.6 2.2 1.8 2.4 2.3 2.0 2.8
Property 44.1% 41.9% 41.2% 27.2% 25.4% 36.7% 26.6% 22.8% 38.8% 25.5% 28.0%Burglary 18.9 16.5 17.1 11.1 12.8 12.9 9.7 10.5 13.9 10.7 10.2Larceny 10.9 13.1 8.6 7.6 4.3 8.4 7.8 4.7 8.0 6.3 5.7Motor vehicle theft 2.3 2.3 2.6 1.9 3.0 2.5 1.8 2.5 3.3 1.6 5.4Fraud 7.3 6.0 7.0 3.8 1.7 8.0 4.7 3.0 6.2 3.8 2.5Other property 4.8 4.1 6.0 2.8 3.6 5.0 2.6 2.2 7.4 3.1 4.2
Drug 12.1% 20.8% 16.3% 35.9% 31.4% 18.2% 31.4% 27.0% 22.0% 33.1% 31.5%Possession 4.4 9.4 7.3 11.9 6.2 7.9 11.6 13.0 6.8 6.6 7.2Other drugf 7.7 11.4 9.0 24.0 25.2 10.3 19.8 14.0 15.2 26.5 24.3
Public orderg 14.3% 5.7% 15.6% 9.4% 9.8% 22.2% 13.9% 19.3% 17.3% 17.0% 15.4%Other/unspecifiedh 3.2% 2.1% 0.4% 0.3% 0.5% 0.7% 0.4% 0.3% 1.5% 1.1% 0.5%
Number of unconditional releases 24,877 26,248 44,385 47,824 26,084 50,407 54,313 29,623 49,594 53,437 29,146Note: Based on prisoners with a sentence of more than 1 year released from state prison by expirations of sentence, commutations, and other unconditional releases. Detail may not sum to total due to rounding, missing offense data, and race categories not shown. Release totals from National Prisoner Statistics Program. Offense distribution based on National Corrections Reporting Program administrative data. Estimates may vary from those previously published due to differences in methodology.aRace data are weighted to represent the race/Hispanic origin distribution from the 1991 Survey of Inmates in State Correctional Facilities. The U.S. Office of Management and Budget published guidelines on the collection and reporting of Hispanic origin in 1997 (http://www.whitehouse.gov/omb/fedreg_1997standards/) and few states collected Hispanic origin data in 1991. Persons of Hispanic or Latino origin are included in the white and black categories. See Methodology.bRace and Hispanic origin data are weighted to represent the race/ethnicity distribution from the 2004 Survey of Inmates in State Correctional Facilities. See Methodology.cMost serious offense refers to the original offense for which an inmate was sentenced, not the incident causing the parole revocation.dExcludes persons of Hispanic or Latino origin and persons of two or more races.eIncludes nonnegligent manslaughter.fIncludes drug trafficking.gIncludes weapons, drunk driving, and court offenses; habitual offender sanctions; commercialized vice, morals, and decency offenses; and liquor law violations and other public order offenses.hIncludes juvenile offenses and other unspecified offense categories.Sources: Bureau of Justice Statistics, National Prisoner Statistics Program and National Corrections Reporting Program, 1991, 2001, 2006, and 2011; and Survey of Inmates in State Correctional Facilities, 1991 and 2004.

PRISONERS IN 2012: TRENDS IN ADMISSIONS AND RELEASES, 1991–2012 | DECEMBER 2013 37
appendix Table 3 Sentenced state and federal prisoners admitted, by age, sex, race, and Hispanic origin, 2012
Male FemaleAge group Totala All malea,b Whitec Blackc Hispanic Otherb,c All femalea,b Whitec Blackc Hispanic Otherb,c
Totald 100% 100% 100% 100% 100% 100% 100% 100% 100% 100% 100%18–19 3.5 3.8 2.4 5.1 3.8 3.4 1.5 1.2 2.2 2.1 0.520–24 17.7 18.1 15.3 20.0 19.0 18.3 14.5 13.8 15.1 15.0 15.725–29 19.3 19.1 18.0 18.3 21.2 21.5 20.6 20.9 17.3 22.5 23.030–34 16.7 16.5 16.3 15.4 18.2 16.5 18.8 18.4 17.5 20.3 21.335–39 12.4 12.2 12.5 10.8 13.3 14.0 14.0 14.2 13.5 14.6 13.640–44 10.9 10.7 12.2 9.9 9.9 10.2 12.2 12.9 12.8 10.9 9.845–49 9.0 8.8 10.4 9.0 7.0 7.5 9.9 10.0 11.3 8.7 8.750–54 5.8 5.8 7.0 6.2 3.9 4.7 5.3 5.4 6.5 3.8 4.655–59 2.6 2.6 3.3 2.8 1.8 1.7 2.0 2.1 2.6 1.4 1.560–64 1.1 1.1 1.5 1.1 0.8 0.8 0.7 0.7 0.7 0.4 0.765 or older 0.6 0.6 1.0 0.4 0.4 0.6 0.3 0.3 0.3 0.2 0.1
Number of admitted prisoners 609,781 542,940 172,843 198,251 126,005 45,841 66,841 32,685 15,360 10,925 7,872Note: Counts based on prisoners admitted to serve a sentence of more than 1 year under the jurisdiction of state or federal correctional officials. Excludes transfers, escapes, and those absent without leave (AWOL). Totals for all admissions include other conditional release violators, returns from appeal or bond, and other admissions. Missing data were imputed for Illinois and Nevada. See Methodology.aDetail may not sum to total due to rounding, inmates age 17 or younger, and missing race/Hispanic origin data.bIncludes American Indians, Alaska Natives, Asians, Native Hawaiians, other Pacific Islanders, and persons identifying two or more races.cExcludes persons of Hispanic or Latino orgin.dIncludes persons age 17 or younger.Sources: Bureau of Justice Statistics, National Prisoner Statistics Program, 2012; Federal Justice Statistics Program, 2011–2012; National Corrections Reporting Program, 2011; and Survey of Inmates in State and Local Correctional Facilities, 2004.
appendix Table 4 Sentenced state and federal prisoners, by age, sex, race, and Hispanic origin, December 31, 2012
Male FemaleAge group Totala All malea,b Whitec Blackc Hispanic Otherb,c All femalea,b Whitec Blackc Hispanic Otherb,c
Totald 100% 100% 100% 100% 100% 100% 100% 100% 100% 100% 100%18–19 1.3% 1.4% 0.8% 1.7% 1.5% 1.3% 0.8% 0.6% 0.9% 1.2% 0.0%20–24 12.1 12.2 9.4 13.8 13.4 12.5 11.0 9.9 11.5 12.9 12.125–29 15.8 15.7 13.8 15.9 17.9 18.2 17.3 17.0 16.2 20.0 20.730–34 16.7 16.6 14.9 16.9 18.8 17.9 18.1 17.8 17.5 20.0 20.735–39 13.7 13.6 12.5 13.8 15.3 14.9 14.4 14.6 14.1 14.7 13.840–44 12.5 12.4 13.3 12.0 12.0 11.6 13.5 14.0 13.7 12.4 12.145–49 10.9 10.9 12.5 10.6 9.0 9.2 11.5 11.7 12.4 9.4 9.550–54 8.0 8.1 10.0 7.7 5.9 6.8 7.4 7.7 7.7 5.3 6.955–59 4.5 4.6 5.9 4.2 3.3 3.6 3.6 3.6 3.8 2.9 3.460–64 2.3 2.4 3.4 1.8 1.6 1.9 1.5 1.8 1.3 1.2 0.965 or older 1.9 2.0 3.4 1.2 1.2 1.6 1.0 1.2 0.4 0.6 0.9
Number of sentenced prisoners 1,511,480 1,410,191 451,252 527,768 315,234 115,937 101,289 49,352 23,386 16,968 11,584Note: Counts based on prisoners with a sentence of more than 1 year under the jurisdiction of state or federal correctional officials. Missing data were imputed for Illinois and Nevada. See Methodology.aDetail may not sum to total due to rounding, inmates age 17 or younger, and missing race/Hispanic origin data.bIncludes American Indians, Alaska Natives, Asians, Native Hawaiians, other Pacific Islanders, and persons identifying two or more races.cExcludes persons of Hispanic or Latino orgin.dIncludes persons age 17 or younger.Sources: Bureau of Justice Statistics, National Prisoner Statistics Program, 2012; Federal Justice Statistics Program, 2012; National Corrections Reporting Program, 2011; and Survey of Inmates in State and Local Correctional Facilities, 2004.
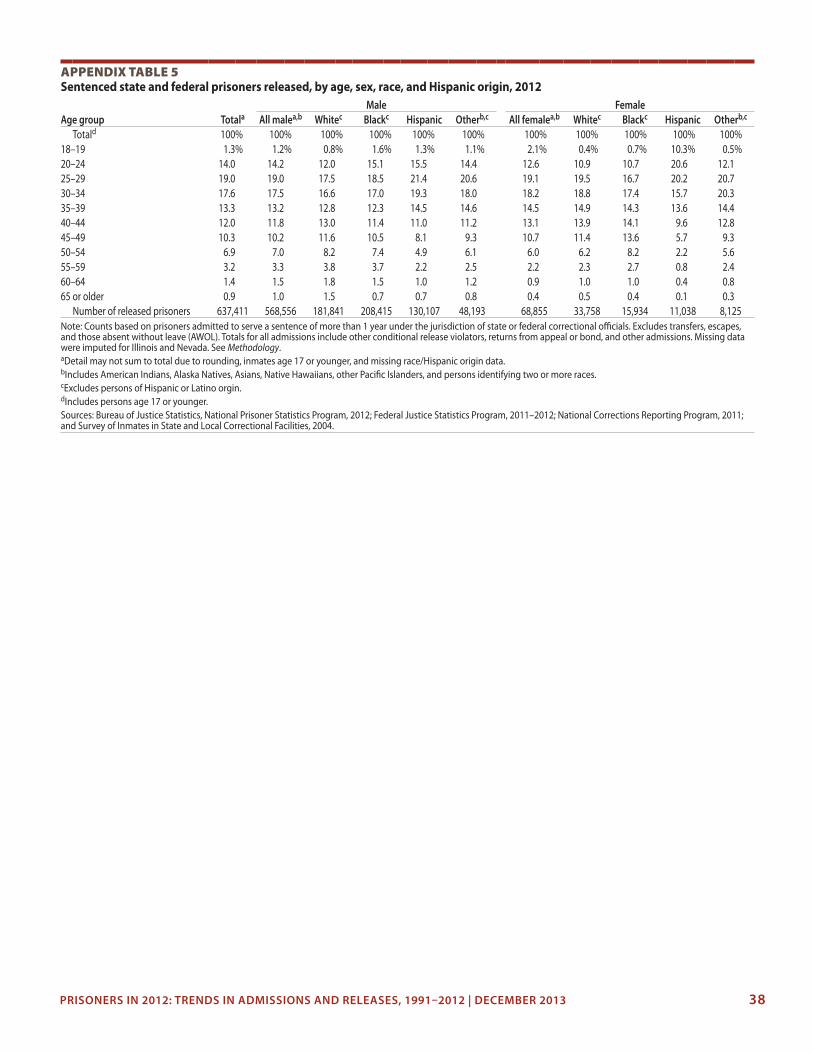
PRISONERS IN 2012: TRENDS IN ADMISSIONS AND RELEASES, 1991–2012 | DECEMBER 2013 38
appendix Table 5 Sentenced state and federal prisoners released, by age, sex, race, and Hispanic origin, 2012
Male FemaleAge group Totala All malea,b Whitec Blackc Hispanic Otherb,c All femalea,b Whitec Blackc Hispanic Otherb,c
Totald 100% 100% 100% 100% 100% 100% 100% 100% 100% 100% 100%18–19 1.3% 1.2% 0.8% 1.6% 1.3% 1.1% 2.1% 0.4% 0.7% 10.3% 0.5%20–24 14.0 14.2 12.0 15.1 15.5 14.4 12.6 10.9 10.7 20.6 12.125–29 19.0 19.0 17.5 18.5 21.4 20.6 19.1 19.5 16.7 20.2 20.730–34 17.6 17.5 16.6 17.0 19.3 18.0 18.2 18.8 17.4 15.7 20.335–39 13.3 13.2 12.8 12.3 14.5 14.6 14.5 14.9 14.3 13.6 14.440–44 12.0 11.8 13.0 11.4 11.0 11.2 13.1 13.9 14.1 9.6 12.845–49 10.3 10.2 11.6 10.5 8.1 9.3 10.7 11.4 13.6 5.7 9.350–54 6.9 7.0 8.2 7.4 4.9 6.1 6.0 6.2 8.2 2.2 5.655–59 3.2 3.3 3.8 3.7 2.2 2.5 2.2 2.3 2.7 0.8 2.460–64 1.4 1.5 1.8 1.5 1.0 1.2 0.9 1.0 1.0 0.4 0.865 or older 0.9 1.0 1.5 0.7 0.7 0.8 0.4 0.5 0.4 0.1 0.3
Number of released prisoners 637,411 568,556 181,841 208,415 130,107 48,193 68,855 33,758 15,934 11,038 8,125Note: Counts based on prisoners admitted to serve a sentence of more than 1 year under the jurisdiction of state or federal correctional officials. Excludes transfers, escapes, and those absent without leave (AWOL). Totals for all admissions include other conditional release violators, returns from appeal or bond, and other admissions. Missing data were imputed for Illinois and Nevada. See Methodology.aDetail may not sum to total due to rounding, inmates age 17 or younger, and missing race/Hispanic origin data.bIncludes American Indians, Alaska Natives, Asians, Native Hawaiians, other Pacific Islanders, and persons identifying two or more races.cExcludes persons of Hispanic or Latino orgin.dIncludes persons age 17 or younger.Sources: Bureau of Justice Statistics, National Prisoner Statistics Program, 2012; Federal Justice Statistics Program, 2011–2012; National Corrections Reporting Program, 2011; and Survey of Inmates in State and Local Correctional Facilities, 2004.

appendix Table 6 Total state and federal prisoners, by sex, December 31, 2011 and 2012
2011 2012 Percent change, 2011–2012Jurisdiction Total Males Females Total Males Females Total Males Females
U.S. Total 1,598,968 1,487,561 111,407 1,570,397 1,461,625 108,772 -1.8% -1.7% -2.4%Federala 216,362 202,462 13,900 217,815 203,766 14,049 0.7% 0.6% 1.1%State 1,382,606 1,285,099 97,507 1,352,582 1,257,859 94,723 -2.2% -2.1% -2.9%
Alabama 32,270 29,696 2,574 32,431 29,782 2,649 0.5 0.3 2.9Alaskab 5,597 4,932 665 5,633 4,934 699 0.6 0.0 5.1Arizona 40,020 36,470 3,550 40,080 36,447 3,633 0.1 -0.1 2.3Arkansas 16,108 14,995 1,113 14,654 13,594 1,060 -9.0 -9.3 -4.8California 149,569 141,382 8,187 134,534 128,436 6,098 -10.1 -9.2 -25.5Colorado 21,978 19,957 2,021 20,462 18,739 1,723 -6.9 -6.1 -14.7Connecticutb 18,324 17,090 1,234 17,530 16,312 1,218 -4.3 -4.6 -1.3Delawareb 6,739 6,202 537 6,914 6,348 566 2.6 2.4 5.4Florida 103,055 95,913 7,142 101,930 94,945 6,985 -1.1 -1.0 -2.2Georgia 55,944 52,027 3,917 55,457 51,868 3,589 -0.9 -0.3 -8.4Hawaiib 6,037 5,304 733 5,831 5,143 688 -3.4 -3.0 -6.1Idaho 7,739 6,854 885 7,985 6,977 1,008 3.2 1.8 13.9Illinoisc 48,427 45,562 2,865 49,348 46,599 2,749 1.9 2.3 -4.0Indiana 28,906 26,406 2,500 28,831 26,265 2,566 -0.3 -0.5 2.6Iowad 9,116 8,378 738 8,733 7,949 784 -4.2 -5.1 6.2Kansasd 9,327 8,647 680 9,682 8,952 730 3.8 3.5 7.4Kentucky 21,545 19,091 2,454 22,110 19,425 2,685 2.6 1.7 9.4Louisiana 39,710 37,326 2,384 40,172 37,783 2,389 1.2 1.2 0.2Maine 2,145 1,981 164 2,108 1,944 164 -1.7 -1.9 0.0Maryland 22,558 21,576 982 21,522 20,646 876 -4.6 -4.3 -10.8Massachusetts 11,623 10,832 791 11,308 10,549 759 -2.7 -2.6 -4.0Michigan 42,940 41,031 1,909 43,636 41,647 1,989 1.6 1.5 4.2Minnesota 9,800 9,156 644 9,938 9,228 710 1.4 0.8 10.2Mississippi 21,386 19,808 1,578 22,319 20,652 1,667 4.4 4.3 5.6Missouri 30,833 28,258 2,575 31,247 28,544 2,703 1.3 1.0 5.0Montana 3,678 3,274 404 3,609 3,210 399 -1.9 -2.0 -1.2Nebraska 4,616 4,247 369 4,705 4,352 353 1.9 2.5 -4.3Nevadac 12,778 11,811 967 12,883 11,845 1,038 0.8 0.3 7.3New Hampshire 2,614 2,444 170 2,790 2,583 207 6.7 5.7 21.8New Jersey 23,834 22,762 1,072 23,225 22,164 1,061 -2.6 -2.6 -1.0New Mexico 6,998 6,366 632 6,727 6,096 631 -3.9 -4.2 -0.2New York 55,436 53,124 2,312 54,210 51,963 2,247 -2.2 -2.2 -2.8North Carolina 39,440 36,800 2,640 37,136 34,675 2,461 -5.8 -5.8 -6.8North Dakota 1,423 1,276 147 1,512 1,341 171 6.3 5.1 16.3Ohio 50,964 47,061 3,903 50,876 47,008 3,868 -0.2 -0.1 -0.9Oklahoma 25,977 23,558 2,419 25,225 22,728 2,497 -2.9 -3.5 3.2Oregon 14,510 13,387 1,123 14,840 13,609 1,231 2.3 1.7 9.6Pennsylvania 51,578 48,795 2,783 51,125 48,380 2,745 -0.9 -0.9 -1.4Rhode Islandb 3,337 3,158 179 3,318 3,128 190 -0.6 -0.9 6.1South Carolina 22,914 21,528 1,386 22,388 21,051 1,337 -2.3 -2.2 -3.5South Dakota 3,535 3,094 441 3,650 3,227 423 3.3 4.3 -4.1Tennessee 28,479 26,070 2,409 28,411 26,048 2,363 -0.2 -0.1 -1.9Texas 172,224 158,036 14,188 166,372 152,823 13,549 -3.4 -3.3 -4.5Utah 6,879 6,266 613 6,962 6,323 639 1.2 0.9 4.2Vermontb 2,053 1,905 148 2,034 1,907 127 -0.9 0.1 -14.2Virginia 38,130 35,321 2,809 37,044 34,150 2,894 -2.8 -3.3 3.0Washington 17,847 16,452 1,395 17,271 15,934 1,337 -3.2 -3.1 -4.2West Virginia 6,826 6,074 752 7,070 6,265 805 3.6 3.1 7.0Wisconsin 22,657 21,472 1,185 22,600 21,375 1,225 -0.3 -0.5 3.4Wyoming 2,183 1,944 239 2,204 1,966 238 1.0 1.1 -0.4
Note: Jurisdiction refers to the legal authority of state or federal correctional officials over a prisoner, regardless of where the prisoner is held. Counts are based on prisoners of any sentence length under the jurisdiction of state or federal correctional officials. As of December 31, 2001, sentenced felons from the District of Columbia are the responsibility of the Federal Bureau of Prisons. aIncludes inmates held in nonsecure privately operated community corrections facilities and juveniles held in contract facilities.bPrisons and jails form one integrated system. Data include total jail and prison populations.cState did not submit 2012 National Prisoner Statistics (NPS) Program data, so population estimates for 2012 are imputed. See Methodology for discussion of imputation strategy.dChange in reporting methods. See National Prisoner Statistics Program jurisdiction notes.Source: Bureau of Justice Statistics, National Prisoner Statistics Program, 2011–2012.

appendix Table 7 Prisoners held in the custody of private prisons and local jails, December 31, 2011 and 2012
Inmates held in private prisonsa Inmates held in local jails
Jurisdiction 2011 2012Percent change 2011–2012
Percentage of total jurisdiction, 2012 2011 2012
Percent change 2011–2012
Percentage of total jurisdiction, 2012
U.S. Total 130,972 137,220 4.8% 8.7% 82,053 83,603 1.9% 5.3%Federalb 38,546 40,446 4.9 18.6 1,439 795 -44.8 0.4State 92,426 96,774 4.7% 7.1% 80,614 82,808 2.7% 6.1%
Alabama 545 538 -1.3 1.7 2,148 2,382 10.9 7.3Alaskac 1,688 1,733 2.7 30.8 0 0 0.0 0.0Arizona 6,457 6,435 -0.3 16.1 0 0 0.0 0.0Arkansas 0 0 0.0 0.0 883 584 -33.9 4.0California 697 608 -12.8 0.5 57 0 -100.0 0.0Colorado 4,303 3,939 -8.5 19.3 116 134 15.5 0.7Connecticutc 855 817 -4.4 4.7 0 0 0.0 0.0Delawarec 0 0 0.0 0.0 0 0 0.0 0.0Florida 11,827 11,701 -1.1 11.5 1,267 1,197 -5.5 1.2Georgia 5,615 7,900 40.7 14.2 3,100 4,896 57.9 8.8Hawaiic 1,767 1,636 -7.4 28.1 0 0 0.0 0.0Idaho 2,332 2,725 16.9 34.1 588 467 -20.6 5.8Illinoisd 0 / / / 0 / / /Indiana 2,952 4,251 44.0 14.7 1,504 797 -47.0 2.8Iowa 0 0 0.0 0.0 0 0 0.0 0.0Kansas 74 83 12.2 0.9 1 0 -100.0 0.0Kentucky 2,050 812 -60.4 3.7 7,190 8,487 18.0 38.4Louisiana 2,951 2,956 0.2 7.4 20,866 21,571 3.4 53.7Maine 0 0 0.0 0.0 110 72 -34.5 3.4Maryland 78 27 -65.4 0.1 151 178 17.9 0.8Massachusetts 0 0 0.0 0.0 163 196 20.2 1.7Michigan 0 0 0.0 0.0 36 42 16.7 0.1Minnesota 0 0 0.0 0.0 562 614 9.3 6.2Mississippi 4,669 4,334 -7.2 19.4 5,996 6,528 8.9 29.2Missouri 0 0 0.0 0.0 0 0 0.0 0.0Montana 1,418 1,418 0.0 39.3 523 488 -6.7 13.5Nebraska 0 0 0.0 0.0 56 32 -42.9 0.7Nevadad 0 / / / 100 102 2.0 0.8New Hampshire 0 0 0.0 0.0 20 43 115.0 1.5New Jersey 2,887 2,717 -5.9 11.7 200 109 -45.5 0.5New Mexico 2,853 2,999 5.1 44.6 0 0 0.0 0.0New York 0 0 0.0 0.0 14 0 -100.0 0.0North Carolina 30 30 0.0 0.1 0 0 0.0 0.0North Dakota 0 0 0.0 0.0 55 106 92.7 7.0Ohio 3,004 5,343 77.9 10.5 0 0 0.0 0.0Oklahoma 6,026 6,423 6.6 25.5 2,088 2,373 13.6 9.4Oregon 0 0 0.0 0.0 0 0 0.0 0.0Pennsylvania 1,195 1,219 2.0 2.4 609 489 -19.7 1.0Rhode Islandc 0 0 0.0 0.0 0 0 0.0 0.0South Carolina 20 16 -20.0 0.1 366 374 2.2 1.7South Dakota 11 15 36.4 0.4 73 64 -12.3 1.8Tennessee 5,147 5,165 0.3 18.2 8,660 8,618 -0.5 30.3Texas 18,603 18,617 0.1 11.2 11,906 10,814 -9.2 6.5Utah 0 0 0.0 0.0 1,529 1,574 2.9 22.6Vermontc 522 504 -3.4 24.8 0 0 0.0 0.0Virginia 1,569 1,559 -0.6 4.2 7,474 7,389 -1.1 19.9Washington 0 0 0.0 0.0 386 279 -27.7 1.6West Virginia 0 0 0.0 0.0 1,677 1,735 3.5 24.5Wisconsin 36 18 -50.0 0.1 149 70 -53.0 0.3Wyoming 245 236 -3.7 10.7 9 4 -55.6 0.2
Note: As of December 31, 2001, sentenced felons from the District of Columbia are the responsibility of the Federal Bureau of Prisons./Not reported.aIncludes prisoners held in the jurisdiction’s own private facilities, as well as private facilities in another state.bIncludes federal prisoners held in nonsecure, privately operated facilities (8,932), as well as prisoners on home confinement (2,659).cPrisons and jails form one integrated system. Data include total jail and prison populations.dState did not submit 2012 National Prisoner Statistics (NPS) Program data. Local jail value for Nevada estimated based on 2011 data.Source: Bureau of Justice Statistics, National Prisoner Statistics Program, 2011, 2012.
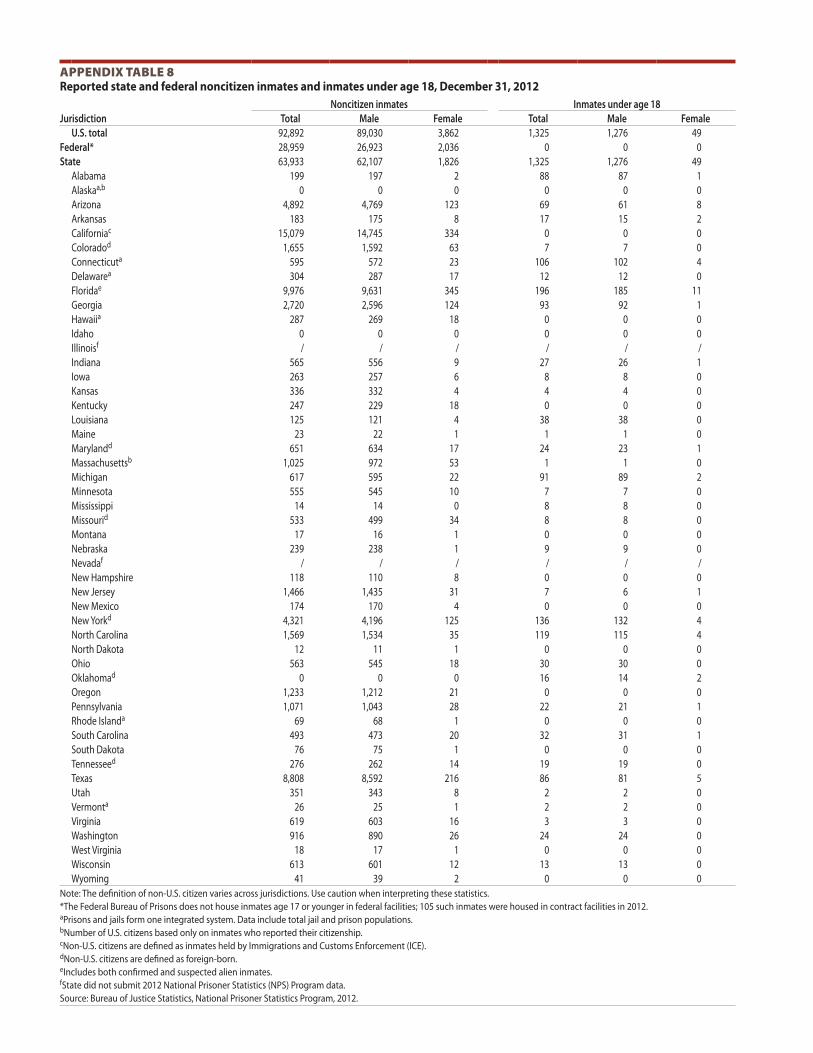
appendix Table 8 Reported state and federal noncitizen inmates and inmates under age 18, December 31, 2012
Noncitizen inmates Inmates under age 18Jurisdiction Total Male Female Total Male Female
U.S. total 92,892 89,030 3,862 1,325 1,276 49Federal* 28,959 26,923 2,036 0 0 0State 63,933 62,107 1,826 1,325 1,276 49
Alabama 199 197 2 88 87 1Alaskaa,b 0 0 0 0 0 0Arizona 4,892 4,769 123 69 61 8Arkansas 183 175 8 17 15 2Californiac 15,079 14,745 334 0 0 0Coloradod 1,655 1,592 63 7 7 0Connecticuta 595 572 23 106 102 4Delawarea 304 287 17 12 12 0Floridae 9,976 9,631 345 196 185 11Georgia 2,720 2,596 124 93 92 1Hawaiia 287 269 18 0 0 0Idaho 0 0 0 0 0 0Illinoisf / / / / / /Indiana 565 556 9 27 26 1Iowa 263 257 6 8 8 0Kansas 336 332 4 4 4 0Kentucky 247 229 18 0 0 0Louisiana 125 121 4 38 38 0Maine 23 22 1 1 1 0Marylandd 651 634 17 24 23 1Massachusettsb 1,025 972 53 1 1 0Michigan 617 595 22 91 89 2Minnesota 555 545 10 7 7 0Mississippi 14 14 0 8 8 0Missourid 533 499 34 8 8 0Montana 17 16 1 0 0 0Nebraska 239 238 1 9 9 0Nevadaf / / / / / /New Hampshire 118 110 8 0 0 0New Jersey 1,466 1,435 31 7 6 1New Mexico 174 170 4 0 0 0New Yorkd 4,321 4,196 125 136 132 4North Carolina 1,569 1,534 35 119 115 4North Dakota 12 11 1 0 0 0Ohio 563 545 18 30 30 0Oklahomad 0 0 0 16 14 2Oregon 1,233 1,212 21 0 0 0Pennsylvania 1,071 1,043 28 22 21 1Rhode Islanda 69 68 1 0 0 0South Carolina 493 473 20 32 31 1South Dakota 76 75 1 0 0 0Tennesseed 276 262 14 19 19 0Texas 8,808 8,592 216 86 81 5Utah 351 343 8 2 2 0Vermonta 26 25 1 2 2 0Virginia 619 603 16 3 3 0Washington 916 890 26 24 24 0West Virginia 18 17 1 0 0 0Wisconsin 613 601 12 13 13 0Wyoming 41 39 2 0 0 0
Note: The definition of non-U.S. citizen varies across jurisdictions. Use caution when interpreting these statistics.*The Federal Bureau of Prisons does not house inmates age 17 or younger in federal facilities; 105 such inmates were housed in contract facilities in 2012.aPrisons and jails form one integrated system. Data include total jail and prison populations.bNumber of U.S. citizens based only on inmates who reported their citizenship. cNon-U.S. citizens are defined as inmates held by Immigrations and Customs Enforcement (ICE). dNon-U.S. citizens are defined as foreign-born.eIncludes both confirmed and suspected alien inmates. fState did not submit 2012 National Prisoner Statistics (NPS) Program data.Source: Bureau of Justice Statistics, National Prisoner Statistics Program, 2012.
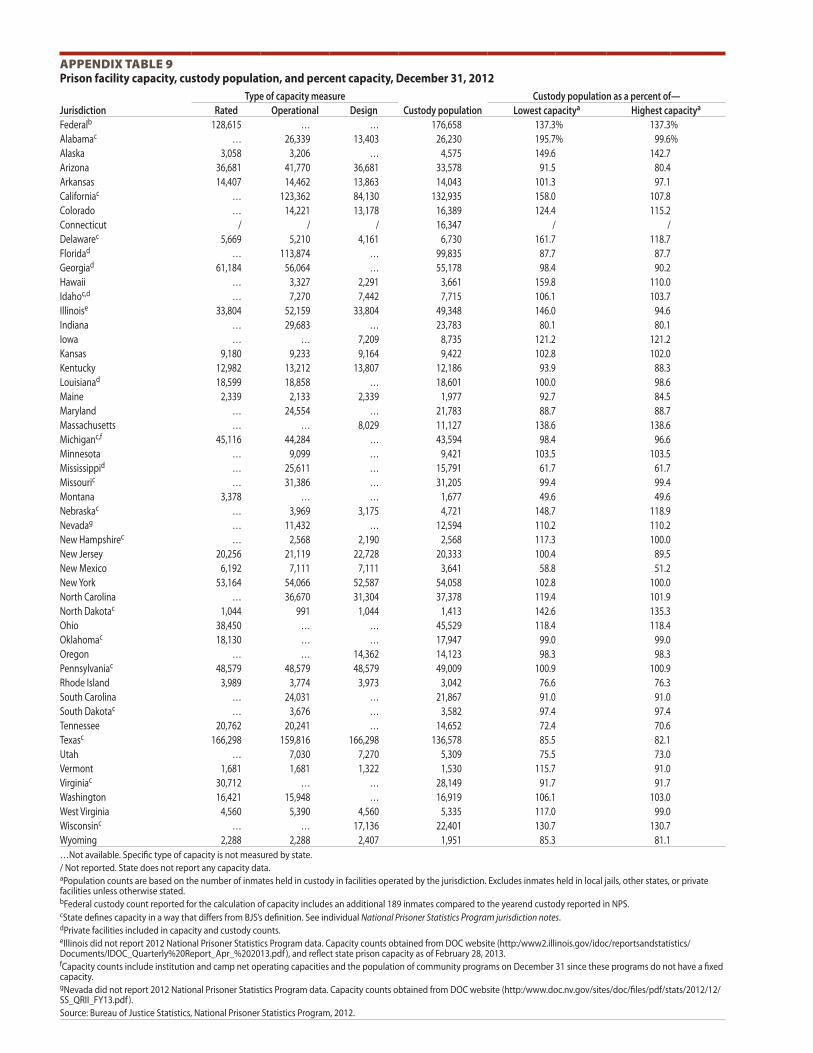
appendix Table 9 Prison facility capacity, custody population, and percent capacity, December 31, 2012
Type of capacity measure Custody population as a percent of—Jurisdiction Rated Operational Design Custody population Lowest capacitya Highest capacitya
Federalb 128,615 … … 176,658 137.3% 137.3%Alabamac … 26,339 13,403 26,230 195.7% 99.6%Alaska 3,058 3,206 … 4,575 149.6 142.7Arizona 36,681 41,770 36,681 33,578 91.5 80.4Arkansas 14,407 14,462 13,863 14,043 101.3 97.1Californiac … 123,362 84,130 132,935 158.0 107.8Colorado … 14,221 13,178 16,389 124.4 115.2Connecticut / / / 16,347 / /Delawarec 5,669 5,210 4,161 6,730 161.7 118.7Floridad … 113,874 … 99,835 87.7 87.7Georgiad 61,184 56,064 … 55,178 98.4 90.2Hawaii … 3,327 2,291 3,661 159.8 110.0Idahoc,d … 7,270 7,442 7,715 106.1 103.7Illinoise 33,804 52,159 33,804 49,348 146.0 94.6Indiana … 29,683 … 23,783 80.1 80.1Iowa … … 7,209 8,735 121.2 121.2Kansas 9,180 9,233 9,164 9,422 102.8 102.0Kentucky 12,982 13,212 13,807 12,186 93.9 88.3Louisianad 18,599 18,858 … 18,601 100.0 98.6Maine 2,339 2,133 2,339 1,977 92.7 84.5Maryland … 24,554 … 21,783 88.7 88.7Massachusetts … … 8,029 11,127 138.6 138.6Michiganc,f 45,116 44,284 … 43,594 98.4 96.6Minnesota … 9,099 … 9,421 103.5 103.5Mississippid … 25,611 … 15,791 61.7 61.7Missouric … 31,386 … 31,205 99.4 99.4Montana 3,378 … … 1,677 49.6 49.6Nebraskac … 3,969 3,175 4,721 148.7 118.9Nevadag … 11,432 … 12,594 110.2 110.2New Hampshirec … 2,568 2,190 2,568 117.3 100.0New Jersey 20,256 21,119 22,728 20,333 100.4 89.5New Mexico 6,192 7,111 7,111 3,641 58.8 51.2New York 53,164 54,066 52,587 54,058 102.8 100.0North Carolina … 36,670 31,304 37,378 119.4 101.9North Dakotac 1,044 991 1,044 1,413 142.6 135.3Ohio 38,450 … … 45,529 118.4 118.4Oklahomac 18,130 … … 17,947 99.0 99.0Oregon … … 14,362 14,123 98.3 98.3Pennsylvaniac 48,579 48,579 48,579 49,009 100.9 100.9Rhode Island 3,989 3,774 3,973 3,042 76.6 76.3South Carolina … 24,031 … 21,867 91.0 91.0South Dakotac … 3,676 … 3,582 97.4 97.4Tennessee 20,762 20,241 … 14,652 72.4 70.6Texasc 166,298 159,816 166,298 136,578 85.5 82.1Utah … 7,030 7,270 5,309 75.5 73.0Vermont 1,681 1,681 1,322 1,530 115.7 91.0Virginiac 30,712 … … 28,149 91.7 91.7Washington 16,421 15,948 … 16,919 106.1 103.0West Virginia 4,560 5,390 4,560 5,335 117.0 99.0Wisconsinc … … 17,136 22,401 130.7 130.7Wyoming 2,288 2,288 2,407 1,951 85.3 81.1…Not available. Specific type of capacity is not measured by state./ Not reported. State does not report any capacity data.aPopulation counts are based on the number of inmates held in custody in facilities operated by the jurisdiction. Excludes inmates held in local jails, other states, or private facilities unless otherwise stated.bFederal custody count reported for the calculation of capacity includes an additional 189 inmates compared to the yearend custody reported in NPS. cState defines capacity in a way that differs from BJS’s definition. See individual National Prisoner Statistics Program jurisdiction notes. dPrivate facilities included in capacity and custody counts.eIllinois did not report 2012 National Prisoner Statistics Program data. Capacity counts obtained from DOC website (http:/www2.illinois.gov/idoc/reportsandstatistics/Documents/IDOC_Quarterly%20Report_Apr_%202013.pdf), and reflect state prison capacity as of February 28, 2013.fCapacity counts include institution and camp net operating capacities and the population of community programs on December 31 since these programs do not have a fixed capacity.gNevada did not report 2012 National Prisoner Statistics Program data. Capacity counts obtained from DOC website (http:/www.doc.nv.gov/sites/doc/files/pdf/stats/2012/12/SS_QRII_FY13.pdf).Source: Bureau of Justice Statistics, National Prisoner Statistics Program, 2012.

PRISONERS IN 2012: TRENDS IN ADMISSIONS AND RELEASES, 1991–2012 | DECEMBER 2013 43
appendix Table 10 Sentenced federal prisoners, by sex and most serious offense, September 30, 2002, 2011, and 2012
2002 2011 2012 Percent change 2011–2012Most serious offense All inmates Male Female All inmates Male Female All inmates Male Female All inmates Male Female
Total 143,040 133,732 9,308 197,050 184,901 12,149 196,574 184,258 12,316 -0.2% -0.3% 1.4%Violent 13,586 13,147 438 12,212 11,723 492 11,688 11,226 463 -4.3% -4.2% -5.9%
Homicidea 1,253 1,191 61 1,482 1,361 120 1,378 1,272 106 -7.0 -6.5 -11.8Robbery 9,611 9,307 304 7,618 7,378 241 7,110 6,904 206 -6.7 -6.4 -14.6Other violent 2,722 2,649 73 3,113 2,983 130 3,201 3,050 151 2.8 2.2 15.8
Property 10,033 8,533 1,500 10,777 8,713 2,053 11,568 9,250 2,318 7.3% 6.2% 12.9%Burglary 230 219 11 211 198 13 172 159 13 -18.6 -19.6 -2.6Fraud 6,517 5,472 1,045 8,128 6,453 1,665 8,827 6,964 1,863 8.6 7.9 11.9Other property 3,286 2,842 444 2,438 2,061 375 2,569 2,127 442 5.4 3.2 17.9
Drugb 80,986 74,823 6,163 103,352 95,971 7,372 99,426 92,291 7,135 -3.8% -3.8% -3.2%Public order 37,353 36,219 1,134 69,459 67,359 2,119 72,519 70,219 2,300 4.4% 4.2% 8.6%
Immigration 15,628 15,314 314 22,255 21,651 610 23,700 23,020 680 6.5 6.3 11.5Weapons 13,781 13,574 207 30,088 29,591 508 30,046 29,567 480 -0.1 -0.1 -5.6Other 7,944 7,332 612 17,117 16,117 1,000 18,773 17,633 1,141 9.7 9.4 14.1
Other/unspecifiedc 1,083 1,009 73 1,250 1,135 114 1,372 1,272 100 9.8% 12.0% -12.3%Note: Counts are based on prisoners with a sentence of more than 1 year under federal jurisdiction. See Methodology.: Not calculated. 2011 data included individuals commiting drug and public order crimes that could not be separated from valid unspecified records.aIncludes murder, negligent, and nonnegligent manslaughter.bIncludes trafficking, possession, and other drug offenses.cIncludes offenses not classified.Sources: Bureau of Justice Statistics, National Prisoner Statistics Program and Federal Justice Statistics Program, 2002, 2011, and 2012.
appendix Table 11 Sentenced federal prisoners, by sex and most serious offense, September 30, 2002, 2011, and 2012
2002 2011 2012Most serious offense All inmates Male Female All inmates Male Female All inmates Male Female
Total 143,040 133,732 9,308 197,050 184,901 12,149 196,574 184,258 12,316Violent 9.5% 9.8% 4.7% 6.2% 6.3% 4.0% 5.9% 6.1% 3.8%
Homicidea 0.9 0.9 0.7 0.8 0.7 1.0 0.7 0.7 0.9Robbery 6.7 7.0 3.3 3.9 4.0 2.0 3.6 3.7 1.7Other violent 1.9 2.0 0.8 1.6 1.6 1.1 1.6 1.7 1.2
Property 7.1% 6.4% 16.1% 5.5% 4.7% 16.9% 5.9% 5.0% 18.8%Burglary 0.2 0.2 0.1 0.1 0.1 0.1 0.1 0.1 0.1Fraud 4.6 4.1 11.2 4.1 3.5 13.7 4.5 3.8 15.1Other property 2.3 2.1 4.8 1.2 1.1 3.1 1.3 1.2 3.6
Drugb 56.7% 55.9% 66.2% 52.4% 51.9% 60.7% 50.6% 50.1% 57.9%Public order 26.0% 27.1% 12.2% 35.2% 36.4% 17.4% 36.9% 38.1% 18.7%
Immigration 10.9 11.5 3.4 11.3 11.7 5.0 12.1 12.5 5.5Weapons 9.6 10.1 2.2 15.3 16.0 4.2 15.3 16.0 3.9Other 5.6 5.5 6.6 8.7 8.7 8.2 9.6 9.6 9.3
Other/unspecifiedc 0.8% 0.8% 0.8% 0.6% 0.6% 0.9% 0.7% 0.7% 0.8%Note: Counts are based on prisoners with a sentence of more than 1 year under federal jurisdiction. See Methodology.: Not calculated. 2011 data included individuals commiting drug and public order crimes that could not be separated from valid unspecified records.aIncludes murder, negligent, and non-negligent manslaughter.bIncludes trafficking, possession, and other drug offenses.cIncludes offenses not classified.Sources: Bureau of Justice Statistics, National Prisoner Statistics Program and Federal Justice Statistics Program, 2002, 2011, and 2012.
Revised August 1, 2014

Office of Justice ProgramsInnovation • Partnerships • Safer Neighborhoods
www.ojp.usdoj.gov
The Bureau of Justice Statistics, located in the Office of Justice Programs, U.S. Department of Justice, collects, analyses, and disseminates statistical information on crime, criminal offenders, victims of crime, and the operation of justice systems at all levels of government. William J. Sabol is acting director.
This report was written by E. Ann Carson and Daniela Golinelli. Erinn Herberman, Sheri Simmons, and Josephine Palma verified the report.
Jill Thomas and Lynne McConnell (Lockheed Martin) edited the report, and Barbara Quinn, Tina Dorsey, and Morgan Young produced the report.
December 2013, NCJ 243920