trends in bonded foil strain gage force …trends in bonded foil strain gage force transducers by...
TRANSCRIPT

TRENDS IN BONDED FOIL STRAIN GAGE FORCE TRANSDUCERS by LaVar Clegg, Engineering Manager, Interface, Inc.
INTRODUCTION. At the commemoration of 60 years of bonded electric resistance strain gages, it is appropri-ate that we review the state of the art in their applications. Force transducers based on bonded foil strain gage technology have become successful commercial products and contributors to the world's standard of living. They are used in a vast variety of applications. They are made to measure forces from grams to tons. This paper presents views on some key aspects of these transducers, aspects which demonstrate progress in their quality and utility, as they have matured over the years. Attention will not be given here to the technical details of foil strain gages, as they are adequately addressed elsewhere.
STRAIN SENSING CONCEPT Referring to the simple transducer model in Fig. 1, a strain gage is bonded to a flexure or forcebearing structure via some media. The function of the flexure is two fold: to provide a stressed surface area which is suitable for gage bonding and to provide mechanical con-nections by which the structure can be loaded. Ideally, the mechanical connections are isolated from the gaged area such that the strain being sensed is relatively independent of the connections, whether they be threads,
The gage itself is made from material which has controllable electrical resistance and ex-hibits a useful gage factor. Techniques are available for depositing gage material di-rectly on to a surface by vacuum evaporation or sputtering. This produces a molecular bond which would appear to be ideal. How-ever, it is limited by the fact that all useful flexure materials are metals and all gages are by necessity electrical conductors. Therefore the bond in this model must function as an electrical insulator as well as an adhesive. Insulating material as an intermediate layer can be vacuum deposited under the gage and this is an acceptable solution, but this thin film approach has limited use because of cost and the limitation of work piece size in vacuum chambers.
Flexures which are electrical insulators would permit direct molecular bonding of gages but to date, no acceptable insu-lating material has been found. Ceramics are the prime can-didates but they are too brittle to make good flexures. Thus, thin film hybrid circuit technology such as that exemplified in Fig. 3 has limited application to transducers even though it has many positive engineering features including the op-portunity fo high gage resistance (many Kohms) and geo-metric design flexibility.
So bonding is done today, as it has been for many years, with organic materials. They serve as both adhesives and insulators. And there is a third function which is that of being a plastic layer between the flexure and gage which provides a means of controlling creep. Thus, ironically, the best bond materials are poor engineering materials, having plastic characteristics. For the bonded foil model, the bond consists of gage backing or lamination film plus adhesive and is typically about 0.001 inch thick.

Flexure materials exhibit positive creep. That is, with time the deflection under load increases. A plastic bond contributes negative creep due to its tendency to relax with time in its function of trans-ferring strain from the flexure to the gage. So by careful design, net creep can be made to be near zero. The design variable commonly used to adjust creep is the "end loop" length of the gage serpen-tines. This dimension, illustrated in Fig. 2, is easily made to any value for a given pattern and it is not uncommon for a transducer manufacturer to have at hand patterns covering a range of lengths so that the random variables of manufacturing can be compen-
FLEXURE MATERIALS The desirable materials have a high ratio of yield strength to modulus of elasticity, above 5 or so as shown in Fig. 4. Alloy steels such as E4340 and its derivatives are the work horses of flexure materials. They exhibit a high ratio as well as reasonable cost. They have excellent fatigue resistance. Their disad-vantage is susceptibility to rust and corrosion, de-manding protection by plating or painting.
Precipitation hardening stainless steels are good flexure materials and offer corrosion resistance. 17-4PH is widely used. 15-5PH is a more pure version and would be expected to offer some ad-vantage in performance, such as lower hysteresis and better uniformity, but it has been the experi-ence of the author that no advantage can be meas-ured. Therefore 17-4PH is the economical winner. There has been a shift toward using it, at the ex-pense of the alloy steels, in recent years due to the increased costs of plating and painting as a result of environmental regulations. Aluminum is a very good material, producing load cells with excellent linearity, hysteresis, and creep. Type 2024 has proven to be best. Being a low modulus material, aluminum is appropriate for transducers of relatively low capacity.
FLEXURE DESIGNS Force transducer flexures are made in a wide vari-ety of styles. Fig. 5 through Fig. 10 show some examples. Each style has certain advantages and disadvantages. Normally, each style is best over a particular force range. Note Fig. 10 which demon-strates 3 different approaches to the same prob-lem. All 3 load cells are 50,000 Ibf capacity. The double-ended beam is material-efficient and per-forms well. The single-ended beam is large and heavy, having exceeded its ideal range. The col-umn canister is also material-efficient but with-stands less extraneous load than the beams.
Fig.10 Three Types of 50,000 lb Load Cells
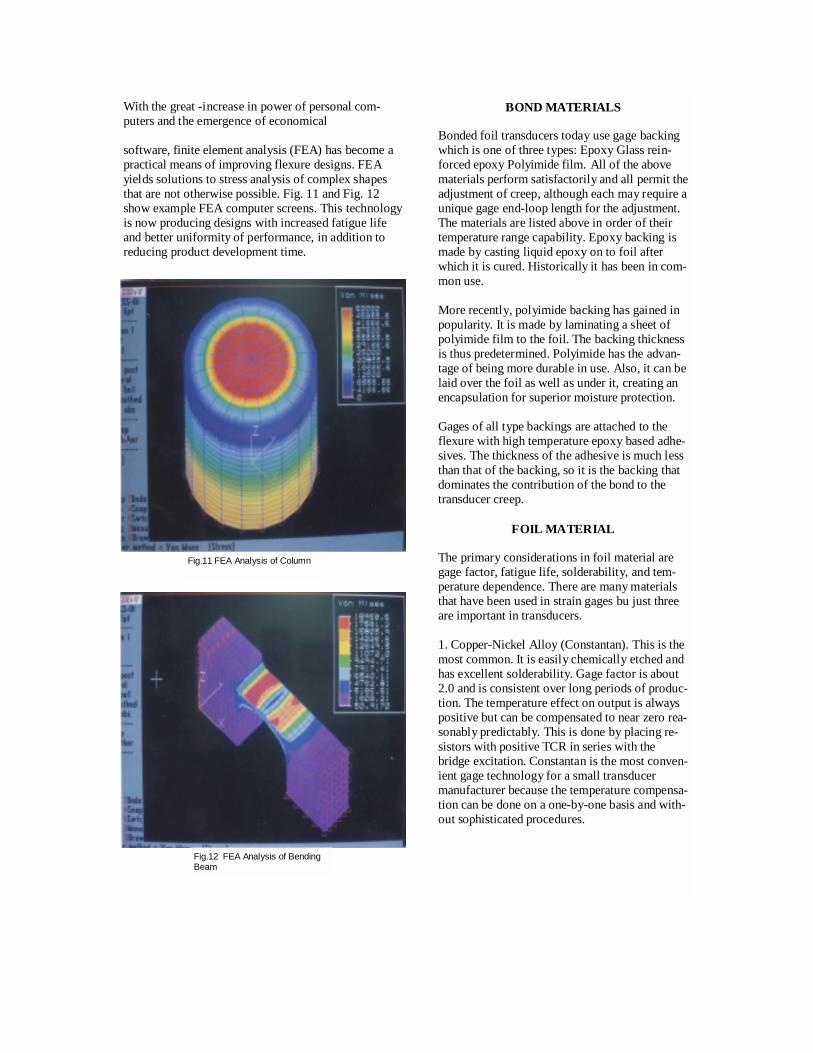
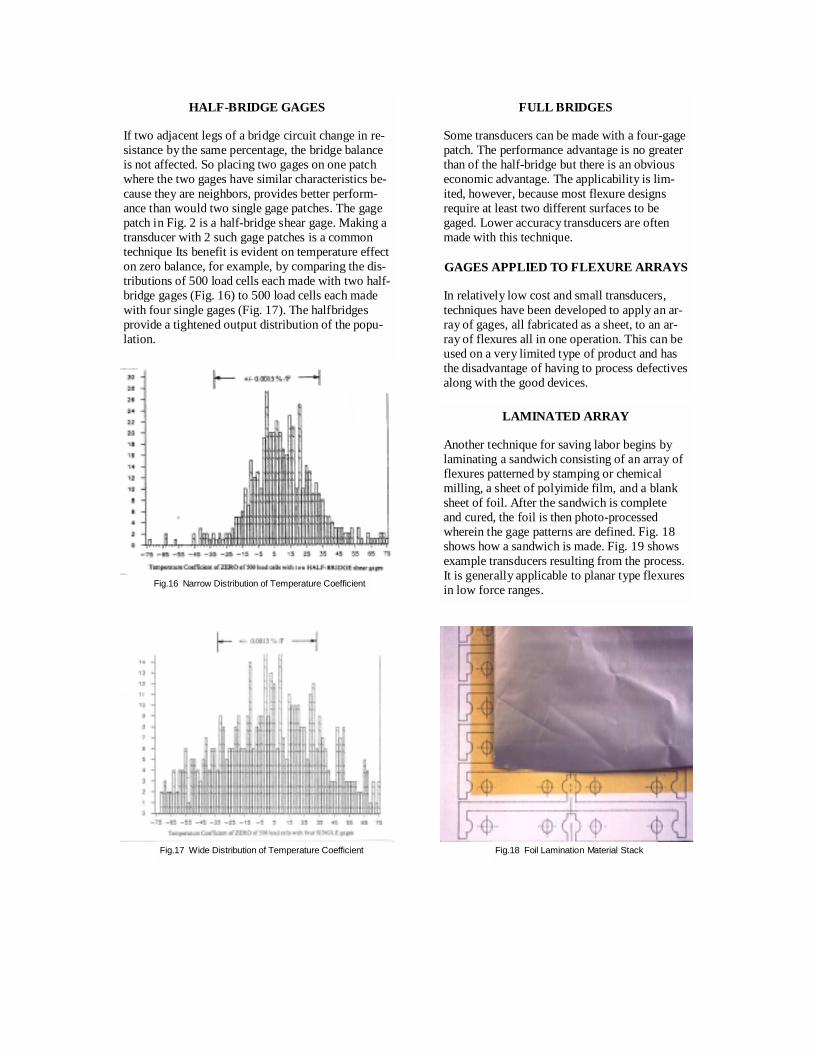
With the great -increase in power of personal com-puters and the emergence of economical software, finite element analysis (FEA) has become a practical means of improving flexure designs. FEA yields solutions to stress analysis of complex shapes that are not otherwise possible. Fig. 11 and Fig. 12 show example FEA computer screens. This technology is now producing designs with increased fatigue life and better uniformity of performance, in addition to reducing product development time.
Fig.11 FEA Analysis of Column
Fig.12 FEA Analysis of Bending Beam
BOND MATERIALS Bonded foil transducers today use gage backing which is one of three types: Epoxy Glass rein-forced epoxy Polyimide film. All of the above materials perform satisfactorily and all permit the adjustment of creep, although each may require a unique gage end-loop length for the adjustment. The materials are listed above in order of their temperature range capability. Epoxy backing is made by casting liquid epoxy on to foil after which it is cured. Historically it has been in com-mon use. More recently, polyimide backing has gained in popularity. It is made by laminating a sheet of polyimide film to the foil. The backing thickness is thus predetermined. Polyimide has the advan-tage of being more durable in use. Also, it can be laid over the foil as well as under it, creating an encapsulation for superior moisture protection. Gages of all type backings are attached to the flexure with high temperature epoxy based adhe-sives. The thickness of the adhesive is much less than that of the backing, so it is the backing that dominates the contribution of the bond to the transducer creep.
FOIL MATERIAL The primary considerations in foil material are gage factor, fatigue life, solderability, and tem-perature dependence. There are many materials that have been used in strain gages bu just three are important in transducers. 1. Copper-Nickel Alloy (Constantan). This is the most common. It is easily chemically etched and has excellent solderability. Gage factor is about 2.0 and is consistent over long periods of produc-tion. The temperature effect on output is always positive but can be compensated to near zero rea-sonably predictably. This is done by placing re-sistors with positive TCR in series with the bridge excitation. Constantan is the most conven-ient gage technology for a small transducer manufacturer because the temperature compensa-tion can be done on a one-by-one basis and with-out sophisticated procedures.

2. Nickel-Chromium Alloy (Karma). Relative to Constantan, Karma has slightly higher gage fac-tor, greater fatigue life, and a higher operating temperature range. Most importantly, it has the capability of inherent modulus compensation, eliminating the need for compensating resistors. This is done by treating the foil to have a nega-tive temperature coefficient of gage factor which exactly counters the positive temperature coefficient of modulus of the flexure. The ad-vantage of transducers constructed with this technology is not only a reduction in parts count but an improvement in dynamic temperature performance because there are fewer compo-nents in the bridge circuit to contribute thermal time constants. Karma modulus compensated technology is not friendly to the casual user. Manufacturers using it must devote considerable resource to testing, adjusting the process, and lot qualification. Thus, the benefit does not come free. With the idea that simpler is better, Fig. 13 and Fig. 14 demonstrate the Karma contribution where a column load cell with Constantan technology may be compared to a shear load cell with Karma technology. 3. Platinum-Tungsten. This material is less con-venient and more costly. It has the best fatigue life, highest operating temperature range, and a high gage factor of about 4.6. Gages made of this material are primarily used in niche applica-tions which require one or more of the above advantages. A sampling of various strain gages used in force transducers is shown in Fig. 15.
Fig.13 Relatively Complex Circuit
Fig.14 Relatively Simple Circuit
Fig.15 Representative Strain Gages
INTEGRATED MANUFACTURING APPROACHES
The nature of balanced bridge circuits suggests that transducer performance should be enhanced by matching the gage characteristics of each leg of a bridge. There is also expectation of lower cost by in-tegrated manufacturing. Some techniques of integrat-ing to achieve both objectives have evolved.
HALF-BRIDGE GAGES If two adjacent legs of a bridge circuit change in re-sistance by the same percentage, the bridge balance is not affected. So placing two gages on one patch where the two gages have similar characteristics be-cause they are neighbors, provides better perform-ance than would two single gage patches. The gage patch in Fig. 2 is a half-bridge shear gage. Making a transducer with 2 such gage patches is a common technique Its benefit is evident on temperature effect on zero balance, for example, by comparing the dis-tributions of 500 load cells each made with two half-bridge gages (Fig. 16) to 500 load cells each made with four single gages (Fig. 17). The halfbridges provide a tightened output distribution of the popu-lation.
Fig.16 Narrow Distribution of Temperature Coefficient
Fig.17 Wide Distribution of Temperature Coefficient
FULL BRIDGES Some transducers can be made with a four-gage patch. The performance advantage is no greater than of the half-bridge but there is an obvious economic advantage. The applicability is lim-ited, however, because most flexure designs require at least two different surfaces to be gaged. Lower accuracy transducers are often made with this technique. GAGES APPLIED TO FLEXURE ARRAYS In relatively low cost and small transducers, techniques have been developed to apply an ar-ray of gages, all fabricated as a sheet, to an ar-ray of flexures all in one operation. This can be used on a very limited type of product and has the disadvantage of having to process defectives along with the good devices.
LAMINATED ARRAY Another technique for saving labor begins by laminating a sandwich consisting of an array of flexures patterned by stamping or chemical milling, a sheet of polyimide film, and a blank sheet of foil. After the sandwich is complete and cured, the foil is then photo-processed wherein the gage patterns are defined. Fig. 18 shows how a sandwich is made. Fig. 19 shows example transducers resulting from the process. It is generally applicable to planar type flexures in low force ranges.
Fig.18 Foil Lamination Material Stack

PERFORMANCE OF MODERN FORCE TRANSDUCERS
The bonded foil transducer is a mature technol-ogy. While some aspects of their manufacture and use have changed little in years, there have been gradual improvements in the manufactur-ing and characterization of them. It is interest-ing to look at the state of performance of the key parameters.
RANGES AND STYLES The applications of transducers are too numer-ous to list. They are made in ranges of a few ounces to millions of pounds. For example, Fig. 20 shows 8-ounce transducers which are less than 1/2 inch long. Fig. 21 shows a 16 inch 500,000 lb low profile load cell flexure, dwarf-ing a 500 lbf flexure by its side.
Fig.19 Example Transducers from Lamination Process
Fig.20 Small Transducers 1/2 Inch Long
Fig.21 Large Transducers, 4 and 16 Inch Diameter
NONLINEARITY Weighing applications, particularly those which are legal for trade, usually demand low nonlinearity to meet error band limits. While it is common to correct transducer nonlinearity in a digital indicator or signal conditioner, it seems nevertheless that linear trans-ducers are much preferred. By careful design of flex-ures, gages, and assembly thereof, linearity can be made quite good. For example, Fig. 22 illustrates how linearity of a particular bending beam load cell is only fair with naive location of the gages. Then through an understanding of the distribution of the stresses involved, more strategic location of the gages results in excellent linearity.
Column type load cells are inherently nonlinear. They are commonly linearized by placing high gage factor silicon strain gages of a few ohms resistance in series with the bridge excitation, as shown in Fig. 13. The disadvantage of this is a decrease in reliability and fatigue resistance relative to shear and bending type load cells.
Fig.22 Example of Nonlinearity Correction

In contrast to weighing applications, in most test-ing applications the magnitude of nonlinearity is of only secondary importance. Smooth output characteristic and repeatability are more impor-tant. Fig. 23 illustrates an excellent load cell. Nonlinearity is about -0.03% but the calibration curve is smooth and follows closely a polynomial equation, allowing the computation of load cell output at any load.
Fig.23 Well-behaved Nonlinearity
HYSTERESIS Low hysteresis is demanded by weighing applica-tions because it is common for weighments to be taken when descending from a higher load as well as when ascending from a lower load. Unlike nonlinearity, it is not so easy to compensate for it with digital electronics. Therefore it is a key de-sign variable. Sometimes hysteresis is important in testing appli-cations but often it is less important because it may be that measurements are taken only on as-ceriding loads. Also, if measurements are taken on descending loads, a separate calibration curve may be permitted. The hysteresis shown in Fig. 22 is quite low and would be acceptable for almost any application. That shown in Fig. 24 is perhaps too high for some applications but is smooth and wellbehaved, being very acceptable in many cases. Fig. 24 dem-onstrates, as a note of interest, that hysteresis tends to obey a second degree polynomial equa-tion probably more closely even than do the as-cending and descending calibrations which may have higher degree curve fit equations.
In general, hysteresis is dependent on flexure ma-terial and mechanical design. It may be positive or negative. As is intuitive, an integral object usually exhibits positive hysteresis. Negative hysteresis is more commonly associated with joints or connec-tions. So in testing a transducer for hysteresis it is sometimes a challenge to isolate that which is due to the transducer and that which is caused by con-nections to it.
Fig.24 Well-behaved Hysteresis
Stainless steel, while enjoying popularity due to corrosion resistance, has the disadvantage of relatively high positive hysteresis. It can be helped by special proprietary heat treat proce-dures which maximize the transformation of aus-tenite to martensite upon cooling. For manufac-turers who have control over the entire strain gage fabrication process, it is possible to make gages which compensate for positive hysteresis. It is done by controlling the hardness of Con-stantan foil. This is not particularly intuitive and is the result of much empirical work.
CREEP Perhaps more than any other parameter, low creep is a key identifier of a good transducer. A good transducer returns to zero quickly upon removal of a load. See Fig. 25 and Fig. 26 show-ing examples of good and poor zero return on calibration curves. It is creep that prevents a good return. It is desired that creep not only be low but that it have a low temperature dependence. Obtaining low creep is particularly challenging at elevated temperatures, where it tends to go more positive.

Fig.25 Good Return to Zero Indicates Good Creep
Fig.26 Poor Return to Zero Indicates Poor Creep
Creep can be either positive or negative and is deter-mined by design, being dependent on flexure, bond, and gage materials plus strain distribution and gage geometry. The variable used for control is the gage end tab length, as explained earlier (Fig. 2). Technically, creep is not a single phenomenon but it can be simplified for practical purposes to being a logarithmic function with time. This has been demon-strated in creep tests ranging from a few seconds to several weeks. Thus, a typical transducer which has creep of 0.01 % creep in 20 minutes, would have about 0.003 % in one minute and about 0.022 % in one day.
EXTRANEOUS LOAD SENSITIVITY Single axis transducers, the only type being address in this paper, are intended to respond to forces on the primary axis. Forces other than this, as shown in Fig. 27, are called extraneous. It would be nice in most cases if they did not exist. But they probably will
exist, so it is then desirable that the transducer have low response to them. This is usually more impor-tant in testing than in weighing applications because mounting hardware in scales often isolates the transducer somewhat from extraneous loads. An ex-ample of such hardware is shown in Fig. 28.
Fig.27 Axial and Extraneous Loads
Fig.28 Ball and Socket Method of Isolating Extraneous Loads

Considering eccentric loads as one example of extra-neous, as illustrated in Fig. 29, it is interesting to survey the spectrum of sensitivity. Measurements on many styles and brands have given results from near zero to about 2%/inch. Lower than 0.1 Winch is considered excellent. Low Profile designs such as exemplified in Fig. 30 and Fig. 31 are designed to have low sensitivity and can be adjusted if necessary by virtue of their symmetrical configuration. Fig. 32 is a plot of output vs eccentric load position, 8 posi-tions 45' apart, for a low profile type load cell as shown in Fig 31. The several curves represent a changing sensitivity as adjustment is made by alter-ing individual beam dimensions selectively. It can be seen that a very low sensitivity can be achieved.
Fig.29 Eccentric Loads
Fig.30 Symmetry of Bending Low Profile Load Cell
Fig.31 Symmetry of Shear Low Profile Load Cell (cut-away view)
Fig.32 Correction Curves of Output vs Eccentric Load Position, Shear Low Profile Load Cell
Attempts have been made to adjust eccentric load response electronically. This involves various schemes of shunting or otherwise weighting selec-tively certain gages in the bridge circuit. These have not proven to be commercially practical. In general, extraneous load sensitivity is kept low by symmetrical machining and assembly. CNC ma-chines and machine tools have improved over the years permitting very low machined tolerances and correspondingly high symmetry.
TEMPERATURE EFFECT ON ZERO The signal from a bridge circuit with no load applied is called zero balance. It typically is near zero mVN but never exactly zero. Its value is handled in the signal conditioning as an offset. If all legs of a bridge have exactly, the same.

temperature characteristic the temperature effect on zero will be nil. However, even with the precautions of using matched gages, small differences in TCR and response to temperature induced strain will re-sult in some temperature coefficient of zero balance. Fortunately, it can be made to a manageable magni-tude by selecting or compensating. Unfortunately, this parameter cannot be systematically predicted or characterized but is a random. Therefore, each trans-ducer must be tested individually to determine if it needs compensation. Manufacturers have learned to do this testing in volume, subjecting each transducer to high and low temperatures, calculating the error, and making an adjustment. The adjustment is made either by installing a short length of temperature sensitive wire into the appro-priate leg (in series with a gage) of the bridge or by breaking shorting links in a bonded resistor ladder. The histograms of two large populations shown re-spectively in Fig. 16 and Fig. 17 demonstrate the advantage of half-bridge patches over single gage patches., The balance is less temperature sensitive due to the inherent better matching of gage pairs. With this half-bridge technique it is possible for a high percentage of production to meet the common commercial specification of ±0.001 5%/'F without adjustment. The test for temperature effect on zero is very effec-tive in identifying good transducers because they will not only have a low slope of zero balance with temperature, but the test will repeat. The diagram in Fig. 33 is effective in visualizing this. In a test that starts at room temperature, goes to extremes, and then returns to room temperature, the resulting curve should close. Otherwise, the stability of the device with temperature is in question.
Fig.33 Curve Closure Indicates Good Repeatability
Temperature effect on zero is most important in appli-cations where zero cannot be re-established regularly. For example, in a typical scale, zero is established be-tween weighings. But on the other hand, with a tank instrumented for weighing, it may be days or weeks between returning to zero.
TEMPERATURE EFFECT ON OUTPUT The output of transducers is naturally temperature sen-sitive due to the temperature coefficient of modulus of the flexure material and to the temperature coefficient of gage factor of the strain gages. With Constantan gages the output will always increase with temperature unless compensated. Compensation can be done with temperature sensitive resistors placed in series with the bridge excitation as in Fig. 13. The simpler circuit of Fig. 14 using self-compensating Karma gages has the advantages of better thermal dynamic response and lower component count. Unlike temperature effect on zero, the effect on output is systematic and can be managed on a lot basis by carefully controlling and characterizing gage, flexure, and resistor materials. Legal weighing applications generally require a low effect, somewhat better than the traditional ±0.0008%/'F specification. In such cases, individual testing may yet be warranted. Note that compensation to output is done with resistors placed in series with the bridge whereas compensation to zero balance is done with resistors placed within the bridge.
REPEATABILITY The specification commonly found on load cell data sheets for nonrepeatability, typically about 0.01 or 0.02%FS, is not particularly meaningful. The reason is because there is no standard for measuring it. It is dif-ficult to separate the non repeatability of the transducer from that of the test equipment. And a good transducer is as repeatable as good force test equipment. A good approach to repeatability is the procedure out-lined in ASTM E74, Calibration of ForceMeasuring Instruments for Verifying the Force Indication of Test-ing Machines. This procedure is finding widespread use because it addresses the need for a standard proce-dure and it is practical. E74 realizes that there is nonre-peatability in test setups and uses this fact as part of the calibration procedure, which is basically to per-form multiple test runs with the transducer position rotated between runs, fit a polynomial equation to the test.

points, calculate a standard deviation of the test points relative to the fitted equation, and from that calculate an uncertainty number. The uncer-tainty is then used to figure a force range over which the transducer is considered to be useful. The plot in Fig. 23 is per the E74 procedure. Note that there are 3 data points at each test force and a smooth curve is fitted to the total of 30 points.
LONG TERM STABILITY Stability of zero is usually of greater interest in the short term while stability of output is of great interest in the long term. Better long term stabil-ity means less frequent need to recalibrate force standards, verify test machines, or seal scales. Stability of output data over many years has only recently been available. For such data to be valid, it must be taken under the most repeatable cir-cumstances. In the USA, this rather unequivo-cally means testing performed by NIST with dead weights. Several load cells at Interface, Inc. have been tested by NIST at regular intervals under similar conditions and procedures over a period of 20 years. Fig. 34 is a plot of the output of one representative load cell over the period from 1979 to 1995. As might be expected, the drift with time decreases with time, initially showing a slope of about +0.0080/o/year and fi-nally a slope of about ±0.0020/o/year. This data pertains to high accuracy low profile shear load cells such as pictured in Fig. 9, with alloy steel flexure and Karma temperature compensated gages.
Fig.34 Long Term Stability of Output, Low Profile Load Cell
The mechanism of long term output drift is not known. One could speculate that it relates to the aging of materi-als. The slope seems to always be positive, meaning that output increases with time. Possible explanations for the drift include drift in the modulus of the flexure, drift of the gage factor of the gages, and oxidation of the flexure.
CONTRIBUTION OF MODERN DATA
ACQUISITION Better information is improving transducers. With the tre-mendous increase in economical computer power made available in personal computers it is practical to control data acquisition in the laboratory as well as on the production floor. Statistical data that once took hours of labor to gather is now avail-able almost free. Data can be stored in vast data bases at very little cost. One example of using modern equipment to test load cell is shown in Fig. 35. Here, two signal conditioning instru-ments which plug directly into a PC bus were operated un-der computer control and the program was set to simply record readings every few seconds. One instrument meas-ured load cell output and the other measured ambient tem-perature. Temperature was changed from 80 to 200, 250, 275, 300, and 320'F, and return to 800 F. At each tempera-ture a load was applied and released. Because many read-ings are taken, information from this test can be obtained without concern of noise. The raw data was imported into a spreadsheet and plotted From this single plot, the follow-ing parameters can be quantified: creep, creep return, creep recovery, temperature sensitivity of creep, temperature ef-fect on zero, temperature effect on output, permanent zero shift. Also, it can be seen that stable behavior ceased at the highest temperature as evidenced by the negative slope of output, meaning that the operating temperature range of the gages had been exceeded, which was the principle pur-pose of the test.
Fig.35 Example of Multi-parameter Analysis Using Modern Data Acquisition

An example of using information from a data base of manufacturing tests is shown in Fig. 36 where the rated output has been retrieved and plotted for 5000 units of a particular model. Because the capacity of the transducer is only 10 pounds, meaning that the beam thickness is very small and subject to manufacturing tolerances, it is of interest to view the distribution of output and evalu-ate the variation. One could further view this data in other ways in order to learn about the process controls and variables. For example, Fig. 37 shows output plot-ted against date of test and Fig. 38 shows output plotted against serial number. Such analyses can often point to clues for improving the product consistency.
Fig.36 Distribution of Output on 5000 Production Units
Fig.37 Output vs Manufacturing Date on 5000 Production Units
Fig.38 Output vs Serial Number on 5000 Production Units
KEYWORDS AND DEFINITIONS AMBIENT TEMPERATURE The temperature of the medium surrounding the LOAD CELL. AXIAL LOAD A load applied along the PRIMARY AXIS CALIBRATION The comparison of LOAD CELL OUTPUT against standard test loads. CAPACITY The maximum AXIAL LOAD a LOAD CELL is designed to measure within its specifications. CREEP The change in LOAD CELL SIGNAL occurring with time while under load and with all environmental conditions and other variables remaining constant. Normally expressed in units of % of applied load over a specified time interval. It is common practice to characterize creep with a constant load at or near CAPACITY. ECCENTRIC LOAD Any load applied parallel to but not concentric with the PRIMARY AXIS. FULL SCALE or FS The OUTPUT corresponding to the maximum AXIAL LOAD in a specific test or application. It may be any load up to and including CAPACITY. GAGE FACTOR The ratio of relative change in electrical resistance to strain. HYSTERESIS The algebraic difference between OUTPUT at a given load descending from FS and OUTPUT at the same load ascending from minimum load. Normally expressed in units of %FS. It is common for characterization to be measured at 40-60 %FS. LOAD CELL A device which produces an OUTPUT propor-tional to an applied force load.
NONLINEARITY The algebraic difference between OUTPUT at a spe-cific load and the corresponding point on the straight line drawn between zero and FS. Normally expressed in units of %FS. It is common for characterization to be measured at 40-60 %FS. NON REPEATABILITY The maximum difference between OUTPUT readings for repeated loadings under identical loading and en-vironmental conditions. Normally expressed in units of %RO. OUTPUT The algebraic difference between the SIGNAL at ap-plied load and the SIGNAL at minimum load. PRIMARY AXIS The axis along which the LOAD CELL is designed to be loaded. RATED OUTPUT or RO The algebraic difference between the SIGNAL at minimum load+CAPACITY and the SIGNAL at minimum load. SIDE LOAD Any load at the point of AXIAL LOAD application acting at 90 ' to the PRIMARY AXIS. SIGNAL The absolute level of the measurable quantity into which a force input is converted. TCR Temperature coefficient of resistance. TEMPERATURE EFFECT ON OUTPUT The change in OUTPUT due to a change in AMBI-ENT TEMPERATURE. Normally expressed as the slope of a chord spanning the COMPENSATED TEMPERATURE RANGE and in units of 0/6/'F or 0/6/1000F. TEMPERATURE EFFECT ON ZERO The change in ZERO BALANCE due to a change in AMBIENT TEMPERATURE. .Normally expressed as the slope of a chord spanning the COMPEN-SATED TEMPERATURE RANGE and in units of %RO/'F or %RO/1 00- F. TEMPERATURE RANGE, COMPENSATED The range of temperature over which the LOAD CELL is compensated to maintain OUTPUT and ZERO BALANCE within specified limits.
TEMPERATURE RANGE, OPERATING The extremes of AMBIENT TEMPERATURE within which the LOAD CELL will operate without permanent adverse change to any of its performance characteristics. ZERO BALANCE The SIGNAL of the LOAD CELL in the no load condition.