trends in chemical concentration in sedi- … · organic compounds in sediment cores from the four...
TRANSCRIPT

TRENDS IN CHEMICAL CONCENTRATION IN SEDI-MENT CORES FROM THREE LAKES IN NEW JERSEY AND ONE LAKE ON LONG ISLAND, NEW YORK
Water-Resources Investigations Report 02-4272
National Water-Quality Assessment Program
U.S. Department of the InteriorU.S. Geological Survey

TRENDS IN CHEMICAL CONCENTRATION IN SEDI-MENT CORES FROM THREE LAKES IN NEW JERSEY AND ONE LAKE ON LONG ISLAND, NEW YORK
By Gary R. Long, Mark A. Ayers, Edward Callender, and Peter C. Van Metre
U.S. GEOLOGICAL SURVEYWater-Resources Investigation Report 02-4272
West Trenton, New Jersey2003
U.S. DEPARTMENT OF THE INTERIOR
GALE A. NORTON, Secretary
U.S. GEOLOGICAL SURVEY
Charles G. Groat, Director
For additional information Copies of this report can be write to: purchased from: District Chief U.S. Geological Survey U.S Geological Survey Branch of Information Services Mountain View Office Park Box 25286 810 Bear Tavern Road Denver, CO 80225-0286 West Trenton, NJ 08628
CONTENTS
Page
Abstract.......................................................................................................................................................... 1Introduction.................................................................................................................................................... 2
Purpose and scope ............................................................................................................................ 2Acknowledgments ............................................................................................................................ 3
Description of study area ............................................................................................................................... 3Clyde Potts Reservoir ....................................................................................................................... 3Newbridge Pond ............................................................................................................................... 5Orange Reservoir .............................................................................................................................. 5Packanack Lake ................................................................................................................................ 5
Chemical constituents selected for analysis .................................................................................................. 5Trace elements .................................................................................................................................. 5Organochlorine compounds.............................................................................................................. 6Polycyclic aromatic hydrocarbons.................................................................................................... 6
Collection, processing, analysis, and age dating of sediment cores .............................................................. 7Collection, processing, and analysis................................................................................................. 7Age dating......................................................................................................................................... 7Data analysis..................................................................................................................................... 8
Occurrence of, and trends in, trace elements................................................................................................. 9Arsenic.............................................................................................................................................. 9Cadmium .......................................................................................................................................... 9Chromium....................................................................................................................................... 12Lead ................................................................................................................................................ 12Mercury .......................................................................................................................................... 12Nickel.............................................................................................................................................. 13Zinc................................................................................................................................................. 13
Occurrence of, and trends in, hydrophobic organic compounds ................................................................. 13Chlordane........................................................................................................................................ 13Dieldrin........................................................................................................................................... 14Total dichlorodiphenyl-trichloroethane .......................................................................................... 14Total polychlorinated biphenyls ..................................................................................................... 16Polycyclic aromatic hydrocarbons.................................................................................................. 16
Effect of watershed characteristics and regulatory action on constituent concentrations in sedment......... 16Trace elements ................................................................................................................................ 16Organochlorine compounds............................................................................................................ 19Polycyclic aromatic hydrocarbons.................................................................................................. 19
Summary and conclusions ........................................................................................................................... 20References cited........................................................................................................................................... 22
ILLUSTRATIONS
Figure 1. Map showing location of the study lakes in New Jersey and on Long Island, New York ........ 42-7. Graphs showing:
2. Vertical distribution of trace elements in sediment cores from four study lakes .......... 113. Vertical distribution of organochlorine compounds in sediment cores from four
study lakes................................................................................................................. 154. Vertical distribution of total polycyclic aromatic hyrocarbons (PAHs) in sediment
cores from four study lakes ....................................................................................... 155. Relation of log-transformed decadal lead concentrations in sediment cores to log-
transformed decadal populaton of the municipalities adjacent to each study lake ... 186. Relation of log-transformed decadal zinc concentrations in sediment cores to log-
transformed decadal populaton of the municipalities adjacent to each study lake ... 187. Population of municipalities adjacent to each of the four study lakes, 1930-90........... 18
iii

TABLES
Table 1. Characteristics of watersheds for Clyde Potts Reservoir, Orange Reservoir, andPackanack Lake in New Jersey and Newbridge Pond on Long Island, New York.................... 3
2. Statistically significant trends in concentrations of trace elements and hydrophobicorganic compounds in sediment cores from the four study lakes ............................................ 10
iv

CONVERSION FACTORS AND ABBREVIATIONS
Conversion Factors
Multiply By To obtain
Length
inch (in.) 25.4 millimetermile (mi) 1.609 kilometer
Area
square mile (mi2) 2.590 square kilometer (km2)
Mass
pound, avoirdupois (lb) 0.4536 kilogram (kg)
Abbreviation
Abbreviated water-quality unit used in report: µg/g, micrograms per gram
v
FOREWORD
The U.S. Geological Survey (USGS) is committed to serve the Nation with accurate and timely scientific information that helps enhance and protect the overall quality of life, and facili-tates effective management of water, biological, energy, and mineral resources. Information on the quality of the Nation’s water resources is of critical interest to the USGS because it is so integrally linked to the long-term availability of water that is clean and safe for drinking and recreation and that is suitable for industry, irrigation, and habitat for fish and wildlife. Escalating population growth and increasing demands for the multiple water uses make water availability, now measured in terms of quantity and quality, even more critical to the long-term sustainability of our communities and ecosys-tems.
The USGS implemented the National Water-Quality Assessment (NAWQA) Program to support national, regional, and local information needs and decisions related to water-quality man-agement and policy. Shaped by and coordinated with ongoing efforts of other Federal, State, and local agencies, the NAWQA Program is designed to answer: What is the condition of our Nation’s streams and ground water? How are the conditions changing over time? How do natural features and human activities affect the quality of streams and ground water, and where are those effects most pronounced? By combining information on water chemistry, physical characteristics, stream habitat, and aquatic life, the NAWQA Program aims to provide science-based insights for current and emerging water issues. NAWQA results can con-tribute to informed decisions that result in practical and effective water-resource management and strategies that protect and restore water quality.
Since 1991, the NAWQA Program has imple-mented interdisciplinary assessments in more than 50 of the Nation’s most important river basins and aquifers, referred to as Study Units. Collectively, these Study Units account for more than 60 percent of the overall water use and population served by public water supply, and are representative of the Nation’s major hydrologic landscapes, priority ecological resources, and agricultural, urban, and natural sources of contamination.
Each assessment is guided by a nationally consistent study design and methods of sampling and analysis. The assessments thereby build local knowledge about water-quality issues and trends in a particular stream or aquifer while providing an understanding of how and why water quality varies regionally and nationally. The consistent, multi-
scale approach helps to determine if certain types of water-quality issues are isolated or pervasive, and allows direct comparisons of how human activities and natural processes affect water quality and ecological health in the Nation’s diverse geo-graphic and environmental settings. Comprehen-sive assessments on pesticides, nutrients, volatile organic compounds, trace metals, and aquatic ecology are developed at the national scale through comparative analysis of the Study-Unit findings.
The USGS places high value on the commu-nication and dissemination of credible, timely, and relevant science so that the most recent and available knowledge about water resources can be applied in management and policy decisions. We hope this NAWQA publication will provide you the needed insights and information to meet your needs, and thereby foster increased awareness and involvement in the protection and restoration of our Nation’s waters.
The NAWQA Program recognizes that a national assessment by a single program cannot address all water-resource issues of interest. External coordination at all levels is critical for a fully integrated understanding of watersheds and for cost-effective management, regulation, and conservation of our Nation’s water resources. The Program, therefore, depends extensively on the advice, cooperation, and information from other Federal, State, interstate, Tribal, and local agencies, non-government organizations, industry, academia, and other stakeholder groups. The assis-tance and suggestions of all are greatly appreci-ated.
Robert M. Hirsch Associate Director for Water
vi


1
ABSTRACT
Sediment cores were extracted from three lakes in northeastern New Jersey and one lake on western Long Island, New York, as part of the U.S. Geological Survey National Water-Quality Assessment Program. Sediment layers were dated by use of cesium-137 (137Cs), copper, lead, or dichlorodiphenyl-trichloroethane (DDT) profiles. Sediment layers were analyzed for seven selected trace elements, including arsenic, cadmium, chromium, lead, mercury, nickel, and zinc, and five hydrophobic organochlorine compounds, including chlordane, dieldrin, total DDT, total polychlorinated biphenyls (PCBs), and total polycyclic aromatic hydrocarbons (PAHs).
All seven trace elements were detected throughout the cores from all four lakes. Concentrations of all elements, except arsenic, were elevated in the three cores from lakes within urbanized watersheds (Packanack Lake, Orange Reservoir, and Newbridge Pond) relative to the concentrations in the lake core collected below the largely forested, reference watershed (Clyde Potts Reservoir). Results of trend analyses indicate that concentrations of all trace elements, with the exception of arsenic and lead, were relatively constant throughout the core from the minimally urbanized Clyde Potts Reservoir. In urban lakes, significant upward trends in concentrations from deeper to shallower sediments were observed either to peak concentrations or throughout the core for all elements, with the exception of chromium at all lakes and arsenic and nickel at Orange Reservoir. This finding indicates that changes in population and land use in the urbanized watersheds over the period of sedimentary record have contributed to upward trends in trace-element concentrations. Although downward trends in concentrations were observed
for some trace elements in the years after their concentrations peaked, concentrations of all trace elements in urban lake cores were higher in the most recently deposited sediments than at the base of each respective core.
Lead concentrations over time were highly correlated with the population in the vicinity of the lake until the concentration peak in sediment deposited in the mid-1970’s. Concentrations of lead in lake sediment appear to be closely related to the use of leaded gasoline because lead concentrations generally decreased after the use of leaded gasoline was phased-out in the mid-1970’s. Zinc concentrations were highly correlated with population over the entire length of the core. In general, zinc concentrations increased in the three urbanized watersheds, probably in response to increasing population and vehicular use. This trend was not evident at Clyde Potts Reservoir, however, where vehicular traffic in the watershed is minimal.
Detectable concentrations of chlordane, total DDT, and total PCBs were present in cores from all lakes; however, dieldrin was detected only in the Newbridge Pond and Packanack Lake cores. Concentrations generally were higher in cores from the urbanized Newbridge Pond and Orange Reservoir watersheds than in those from the minimally urbanized Clyde Potts Reservoir watershed. With the exception of chlordane in the Clyde Potts and Orange Reservoir cores, concentrations of the four organochlorine compounds had significant downward trends from peak concentrations to recently deposited sediment or non-significant trends throughout the core. On the basis of these findings and as a result of regulatory actions prohibiting the production and use of these compounds, downward trends in sedimentary concentrations are expected to continue; however, the persistence of these
TRENDS IN CHEMICAL CONCENTRATION IN SEDIMENT CORES FROM THREE LAKES IN NEW JERSEY AND ONE LAKE ON LONG ISLAND, NEW YORK
By Gary R. Long, Mark A. Ayers, Edward Callender, and Peter C. Van Metre
2
compounds indicates that a substantial amount of time may be required to purge them from the watersheds.
Concentrations of PAHs in sediment generally increased with population growth and urbanization, probably as a result of increased fossil-fuel combustion (gasoline and home-heating fuels and other uses (roads and parking lots paved with asphalt) associated with increased urban development and vehicular traffic. This finding is supported by low concentrations of PAHs in Packanack Lake sediments in the 1930’s, before the watershed was urbanized and when automobiles were comparatively rare. As vehicular use and urbanization increase in these watersheds, the general increase of PAH concentrations in lake sediments can be expected to continue.
Data from this study indicate that changes in population, land use, and chemical use in the urbanized watersheds over the period of sedimentary record have contributed to upward trends in concentrations of trace elements and hydrophobic organic compounds. Although downward trends were observed for some constituents in the years after their concentrations peaked, concentrations of most constituents in urban lake cores were higher in the most recently deposited sediments than at the base of each respective core and in the reference lake cores. Similar trends in concentrations of these constituents have been observed in sediment cores from other urban lakes across the United States.
INTRODUCTION
A main objective of the U.S. Geological Survey (USGS) National Water Quality Assessment Program (NAWQA) is to define trends (or lack of trends) in the quality of the Nation’s water resources (Leahy and others, 1990; Ayers and others, 2000). Trend analyses are important because they aid in understanding how anthropogenic activities have affected water quality in the past and how continued activity may affect future water quality. Trends also are an important tool to evaluate the effectiveness of
environmental regulations designed to reduce the input of contaminants into aquatic systems.
Trend analyses typically are applied to historical water-quality data sets that contain multiple years of water-quality records. When such historic data are lacking or incomplete, however, other techniques can be used to assess water-quality trends. One such technique is the chemical analysis of sediment cores from reservoirs and lakes (Eisenreich and others, 1989; Callender and Robbins, 1993; Van Metre and Callender, 1996). As soil erodes from land surfaces within a watershed, it is transported by streams to downstream lakes and reservoirs where it settles and accumulates. Trace elements and hydrophobic organic compounds, including organochlorine compounds and polycyclic aromatic hydrocarbons (PAHs), sorb to fine-grained sediment particles and, thus, are transported through the watershed and deposited at the bottom of lakes and reservoirs. By determining the age of the sediment in cores and measuring the concentrations of trace elements and hydrophobic organic compounds associated with the dated sediment, a record can be obtained of the trace elements and hydrophobic organic compounds input to the watershed over a period of time. This technique was used to document trends in the quality of runoff to lakes in the 6,000-mi2 Long Island-New Jersey (LINJ) NAWQA study area in order to examine the relation between runoff-water quality and past anthropogenic activities.
Purpose and Scope
This report describes trends in concen-trations of seven selected trace elements and five hydrophobic organic compounds in multiple age-dated sediment cores extracted from four lakes in small watersheds (less than 5 mi2) in the LINJ NAWQA study area. Three of the lakes are in northeastern New Jersey and one is on western Long Island, New York. Urban land use in the four watersheds ranges from 13.7 to 99.7 percent. The relation of trends in the concentrations of selected contaminants to changes in population and land use in the four watersheds also is described.

3
Acknowledgments
We thank the owners and managers of the lakes for providing access to and information about each lake. We thank Michael Dorsey, Kathryn Conko, Steven Terracciano, Craig Weiss, and Timothy Wilson of the USGS for their contributions during the field-work segment of this lake-sediment coring study. We also thank Kathryn Conko for performing the trace element laboratory analyses.
DESCRIPTION OF STUDY AREA
The LINJ study area encompasses the coastal watersheds of New Jersey, all of Long Island, New York, and a small part of southeastern New York that drain into New Jersey. With a 1990 population of more than 12 million people concentrated in northeastern New Jersey and western Long Island, the study area is one of the more densely populated areas in the Nation (Ayers and others, 2000). Urban residential, commercial, and industrial land use dominate northeastern New
Jersey and western Long Island. Three of the four study lakes are located in northeastern New Jersey and one is on western Long Island (fig. 1).
Clyde Potts Reservoir
Clyde Potts Reservoir, 5 mi west of Morristown, in Morris County, New Jersey, was constructed in 1931 as a water-supply reservoir for the Southeast Morris County Municipal Utilities Authority. The 2.08-mi2 watershed that drains to the reservoir is in the upper Whippany River basin. The Clyde Potts Reservoir watershed is largely forested, with limited urban-residential development and population density (table 1). Therefore, atmospheric pathways are likely the predominant source of contaminants to the watershed. Clyde Potts Reservoir is considered to be minimally disturbed relative to the other lakes and is considered a reference site for this study.
Table 1. Characteristics of watersheds for Clyde Potts Reservoir, Orange Reservoir, and Packanack Lake in New Jersey and Newbridge Pond on Long Island, New York [Listed in order of increasing urban-residential land use and population density; Other, this land-use category is the sum of agricultural, water, wetland, and barren land; mi2, square mile]
Lake watershed
Mid-1990s land use, in percent of basin area 1990 population density
(people/mi2)
Basin area (mi2)
Urban-residential
Urban-industrial
commercialForest Other
Clyde Potts Reservoir 12.2 1.5 77.7 8.6 386 2.1
Orange Reservoir 60.6 8.6 25.5 5.3 2,160 4.5
Packanack Lake 72.9 3.5 14.3 9.4 2,160 1.9
Newbridge Pond 87.2 12.5 0 .3 7,250 5.1

4
0
0
10 20 MILES
15 30 KILOMETERS
0 1 MILE
0 1 KILOMETER
0 1 MILE
0 1 KILOMETER
0 1 MILE
0 1 KILOMETER
0 1 MILE
0 1 KILOMETER
41¡
40¡30’
74¡30’ 74¡ 73¡30’
EXPLANATION
Urban residential
Urban commerical-industrial
Agriculture
Forest
Water
Wetlands
Barren
1990’s LAND USE
Figure 1. Location of the study lakes in New Jersey and Long Island, New York.
Lake watershed area
1930’s urban area
1950’s urban area
EXPLANATION
LAND USE
1970’s urban area
1990’s urban area
Study area boundary
Clyde PottsReservoir
Packanack Lake
Orange Reservoir
Newbridge Pond
5
Newbridge Pond
Newbridge Pond, just east of Merrick, in Nassau County, Long Island, New York, was constructed in 1895 to supply water to the City of New York. Its use as a water-supply source was abandoned a few decades later. Development of the 3.1-mi2 watershed started in the early 1900’s with most development occurring in the 1920’s and 1940’s. By the late 1940’s, the watershed was mostly developed as urban land. Compared to other study lakes, land use for the Newbridge Pond watershed had the highest percentage of urban-residential and urban-industrial/commercial land use in the mid-1990’s (table 1). The 1990 population density here is more than 7,250 people per square mile, which is at least 3 times that of any of the other lake watersheds in this study (table 1). The watershed is intersected by two major highways--one near the southern outlet of the pond and the other in the central part of the basin (fig. 1).
Orange Reservoir
Orange Reservoir, in West Orange, Essex County, New Jersey, was constructed in the early 1880’s as a water-supply reservoir and is currently (2002) maintained by the City of Orange for that purpose. The 4.5-mi2 watershed is in the upper Rahway River basin. Development surrounding Orange Reservoir occurred rapidly in the early 1900’s when public transportation opened commuter passage to Newark and Manhattan (Essex County, 2000). The population surrounding Orange Reservoir increased steadily from 1900 to 1970, with the greatest increase between 1950 and 1960 (New Jersey Department of Labor, 1991). The Orange Reservoir watershed has the second largest percentage of urban-industrial/commercial land use in the study area (8.6 percent); however, about 25 percent of the watershed remains forested (table 1).
Packanack Lake
Packanack Lake, in Wayne Township, Passaic County, New Jersey, was constructed in 1930 on Packanack Brook in the Pompton River watershed. The population density of the 1.9-mi2 watershed is comparable to that of Orange Reservoir. Urban-residential is the predominant land use (table 1). The population of the area began to increase in the 1930’s, increased most from 1950 to 1970, and stabilized or declined slightly since then (New Jersey Department of Labor, 1991).
CHEMICAL CONSTITUENTS SELECTED FOR ANALYSIS
Trace Elements
Trace elements occur in the environment as a product of geologic weathering and human activities that release point- and nonpoint-source contamination. No major point sources of trace elements are known to be present in these watersheds; however, potential nonpoint sources in study watersheds include runoff from urban surfaces, soil erosion, and atmospheric deposition of materials emitted from fossil-fuel combustion, including automobile exhaust and industrial metal processing (Brigham and others, 1997; Forstner and Wittman, 1983; Harte and others, 1991; Ondov and others, 1982). Once introduced to the environment, trace elements tend to sorb to fine-grained sediments (Forstner and Wittman, 1983). These sediments are transported downstream until they reach areas of deposition such as lakes or reservoirs. The accumulation of trace-element-sorbed particles commonly makes sediments the most concentrated pool of trace elements in the aquatic environment (Miller and others, 1992). Arsenic (As), cadmium (Cd), chromium (Cr), lead (Pb), mercury (Hg), nickel (Ni), and zinc (Zn) were selected for detailed analysis in this study.
6
Organochlorine Compounds
Organochlorine compounds are a class of synthetic chemicals that include chlordane, dichlorodiphenyl-trichloroethane (DDT), dieldrin, and polychlorinated biphenyl compounds (PCBs), all of which have been widely used for agricultural and industrial purposes since World War II. Organochlorine compounds tend to be chemically stable, environmentally persistent, and toxic to living organisms (Nadakavukaren, 1995). Organochlorine compounds are similar to trace elements in that they tend to sorb to sediments carried in runoff and accumulate in the depositional areas of lakes and reservoirs.
Introduced in 1947, chlordane was manufactured as a pesticide used to control soil pests, particularly termites (Harte and others, 1991). Chlordane is stable in soils and is not degraded through hydrolysis, oxidation, or direct photolysis, making it environmentally persistent (U.S. Environmental Protection Agency, 1979). Possible modes of entry into the aquatic environment include drift from aerial spraying, surface runoff, subsurface seepage, misapplication, and domestic and industrial effluents (Canadian Council of Resource and Environment Ministers, 1992). In 1978, the U.S. Environmental Protection Agency (USEPA) cancelled agricultural uses of chlordane; all uses were banned in 1988 (U.S. Environmental Protection Agency, 1997).
DDT was developed in 1939 as an agricultural insecticide. The early success of DDT in controlling insect pests led to its widespread use throughout the United States. It is not readily degraded through hydrolysis, oxidation, or direct photolysis, making it environmentally persistent (U.S. Environmental Protection Agency, 1979). In the aquatic environment, DDT binds strongly to sediment, making sorption a dominant fate process (U.S. Environmental Protection Agency, 1979). In 1972, the USEPA banned the use of DDT after its toxic bioaccumulation effects on wildlife were discovered; however, because of its widespread use and long half-life, it is still commonly found in the environment (U.S. Environmental Protection Agency, 1997; Harte and others, 1991). In this
study, total DDT was calculated as the sum of DDT and its degradation products DDD and DDE.
Dieldrin, a compound in the same class of insecticides as chlordane, was first synthesized in 1948 and used primarily to control soil insects, including the corn rootworm (Ware, 1994). Dieldrin is environmentally persistent and strongly adsorbs to soil sediment (U.S. Environmental Protection Agency, 1979). The USEPA canceled most uses of dieldrin in 1971 (Sittig, 1980), although use as an alternative termiticide to chlordane was allowed until the mid-1980’s.
PCBs were synthesized in the 1930’s and used as plasticizers, hydraulic lubricants, components in pesticides, and dielectric fluids in electric capacitors (Smith and others, 1988). PCBs are degraded only through slow biological pathways; therefore, they remain persistent in the environment (U.S. Environmental Protection Agency, 1979). They strongly sorb to sediment and organic matter, making areas of sediment deposition an important sink (U.S. Environmental Protection Agency, 1979). After four decades, production and use of PCBs were banned in 1979; however, PCBs are still present within the aquatic environment (U.S. Environmental Protection Agency, 1997; Harte and others, 1991). In the current analysis, total PCB concentration was calculated as the sum of three arochlors of PCBs (arochlor mixtures 1252, 1254, and 1260).
Polycyclic Aromatic Hydrocarbons
PAHs are a class of organic compounds with a fused-ring aromatic structure. PAHs result from the incomplete combustion of organic carbon, including the incomplete combustion of wood, solid waste, and fossil fuels. PAHs also can be derived directly from use and release of coal and oil products in the urban environment, including spillage or seepage of fossil-fuel products, industrial and domestic discharges, urban surface wash off, and atmospheric deposition (Rand and Petrocelli, 1985). PAHs are present in asphalt road surfaces, vehicle tires, and condensation from vehicle exhaust (Rand and Petrocelli, 1985).
7
Therefore, runoff from paved surfaces is likely an important source of PAHs in the study watersheds. In this study, total PAH concentration was calculated as the sum of 60 individual PAH compounds.
COLLECTION, PROCESSING, ANALYSIS, AND AGE DATING OF SEDIMENT CORES
Collection, Processing, and Analysis
In September 1997, sediment cores were collected from the deepest area in each of the four study lakes. Cores were extracted using a 2.5-inch-diameter Benthos gravity corer and (or) a Wildco box corer1 measuring 6 by 6 inches square by 8 inches tall. The plastic-lined corers were lowered with a winch from a 16-ft inflatable zodiac raft outfitted with a crane over the bow (Van Metre and Mahler, 1999). More information on coring can be found at the USGS web site http://tx.usgs.gov/coring/.
Multiple cores were extracted from each site. The first core extracted at the site was used to visually describe the physical characteristics of the sediments, especially total thickness of lake sediment and depth of the pre-reservoir land surface. This information was an aid in selecting layers for chemical analysis. Additional cores then were collected for each type of chemical analysis. The contents of each core were carefully extruded to a prescribed vertical distance and 1- to 2-cm-thick horizontal slices of sediment, which represent the desired discrete layers of sediment over time, were removed. Sediment analyzed for organic compounds was placed in baked glass jars and chilled pending submittal to the USGS National Water Quality Laboratory. Sediment for analysis of radionuclides and trace elements was placed in cleaned polyethylene jars and chilled pending analysis.
Organic compounds (organochlorine compounds and PAHs) were measured by gas chromatography (Furlong and others, 1996; Foreman and others, 1995). Trace elements, with the exception of mercury, were measured by inductively coupled plasma/atomic adsorption spectrometry and graphite-furnace atomic adsorption (Arbogast, 1996). Mercury was analyzed by cold vapor atomic adsorption spectrometry. Cesium-137 (137Cs), a radionuclide used in age dating, was measured by radioactive counting (Callender and Robbins, 1993).
Age Dating
The assignment of dates to each respective horizontal slice or layer was based on date-depth markers and assumed rates of sedimentation between end points. The top of the core was assigned the sampling date (1997.75) and, if pre-reservoir material was discovered, the base was assigned the date of reservoir impoundment. For the Newbridge Pond cores, a date-depth marker was determined by use of 137Cs, a by-product of nuclear weapons testing that initially was detected in the atmosphere in 1953 and reached peak atmospheric concentrations in 1964. The concentration of 137Cs peaked at a 41-cm depth in the Newbridge Pond core; therefore, this layer was assigned a date of 1964.0. The rate of sediment accumulation between the date-depth marker (1964.0) and the top of the core (1997.75) was determined and, by assuming a constant sedimentation rate, was used to date the remaining layers of the core.
For other cores, alternative date-depth markers were used because the 137Cs peak was not sufficiently defined. In the cores analyzed for trace elements at Clyde Potts and Orange Reservoirs, peak concentrations of lead were assigned a date of 1975, an approximate date in which peak concentrations have been reported in reservoir sediment (Callender and Van Metre, 1997).
1Use of brand, trade, or firm names is for descriptive purposes only and does not constitute endorsement by the U.S. government.
8
Sampling dates and lead peaks that are evident 3.75 and 15 cm from the top of the Clyde Potts and Orange Reservoir cores, respectively, were used as date-depth markers to determine sedimentation rates. In the Orange Reservoir core analyzed for hydrophobic organic compounds, the peak concentration of total DDT, observed 23 cm from the top of the core, was assigned a date of 1962. This date is an approximation based on data from other NAWQA reservoir cores that indicate a consistent peak in total DDT concentrations occurred in the early 1960’s (Van Metre and Callender, 1996). Sedimentation rates were determined for the Orange Reservoir core on the basis of the 1962 total DDT peak and the sampling date. In the Clyde Potts core that was analyzed for hydrophobic organic compounds, the total PCB peak occurred 12.5 cm from the top of the core. This layer was assigned a date of 1970.0, an approximation based on data from other reservoir cores that indicate a consistent total PCB peak in the late 1960’s (Van Metre and others, 1998). This date-depth marker was used with the sampling date to determine the sedimentation rate in the Clyde Potts Reservoir core.
For the Packanack Lake cores, the assumption of constant sedimentation was problematic. For the core that was analyzed for hydrophobic organic compounds, when the impoundment date and a constant sedimentation rate were used, age estimates resulted in peak concentrations of total DDT dated in the early 1980’s, much later than typically observed in many other lake and reservoir cores collected in NAWQA studies (Van Metre and others, 1998). For the core that was analyzed for trace elements, a sharp increase in copper concentrations at 18 cm from the top was correlated with the onset of copper sulfate (CuSO4) treatments of the lake, which began in approximately 1953 (Phillip Gianinio, Packanack Lake Country Club and Community Association, oral commun., 1999). Age estimates made using the copper date-depth marker and assuming a constant sedimentation rate resulted in peak lead concentrations dated in the late 1980’s, which is also much later than typically observed in other lake and reservoir cores collected in NAWQA studies (Callender and Van Metre,
1997). Results indicate that mass sedimentation rates likely decreased between the occurrence of the date-depth markers and the top of the core.
Callender and Robbins (1993) found that decreasing sedimentation rates were common in reservoirs and typically fit an exponential model. Following their approach, an exponential sedimentation model was fit to the Packanack Lake cores. For the core analyzed for hydrophobic organic compounds, the date of the pre-reservoir surface, the DDT maxima, and the sampling date were used as control points in the model. The same model variables, scaled to a smaller overall sedimentation rate, were fit to the core analyzed for trace elements with the copper date-depth marker and the sampling date as control points. Although there is uncertainty associated with the designation of dates to individual sample intervals in the cores, corroborative evidence provided by multiple date-depth markers, including total DDT peaks, total PCB peaks, and lead peaks, indicates that most dates are probably within a few years of actual deposition dates.
Data Analysis
Spearman’s rank correlation was used to evaluate trends in constituent concentrations in the lake cores. The significance of Spearman’s Rho coefficient (p) was determined on the basis of the number of observations in each analysis. Spearman’s Rho coefficients were considered to be statistically significant at a 95-percent confidence interval (p<0.05). Constituent concentrations with “less than” remarks were estimated to be 50 percent of the reporting limit for use in the correlation analyses. Concentrations of organochlorine compounds with “less than” remarks for core layers with dates prior to the known synthesis date of the respective compound were assummed to be zero and removed from trend analyses. Linear regression analyses were performed to evaluate relations between decadal average concentrations of lead and zinc, and decadal population. Historical population data specific to each basin could not be obtained; therefore, population was estimated by summing

9
decadal population data of municipalities surrounding each basin (New Jersey Department of Labor, 1991). Lead, zinc, and population data were log-transformed to obtain a normal distribution (Shapiro-Wilk p-values > 0.05).
OCCURRENCE OF, AND TRENDS IN, TRACE ELEMENTS
Trace elements derived from geologic and anthropogenic sources tend to sorb to fine-grained sediment in streams and accumulate at the bottoms of lakes and reservoirs. All selected trace elements were detected throughout all four cores. The cores analyzed for trace elements contained sediment dated as follows: Newbridge Pond, about 1959; Packanack Lake, about 1947; Orange Reservoir, about 1921; and Clyde Potts Reservoir, about 1935.
Depositional rates in the trace-element cores differed among the lakes. The highest linear sedimentation rate of 0.47 in/yr (1.2 cm/yr) was observed in the Newbridge Pond core. The rate was 0.16 in/yr (0.4 cm/yr) for the Orange Reservoir and Packanack lake cores and 0.04 in/yr (0.1 cm/yr) for the Clyde Potts Reservoir core.
Arsenic
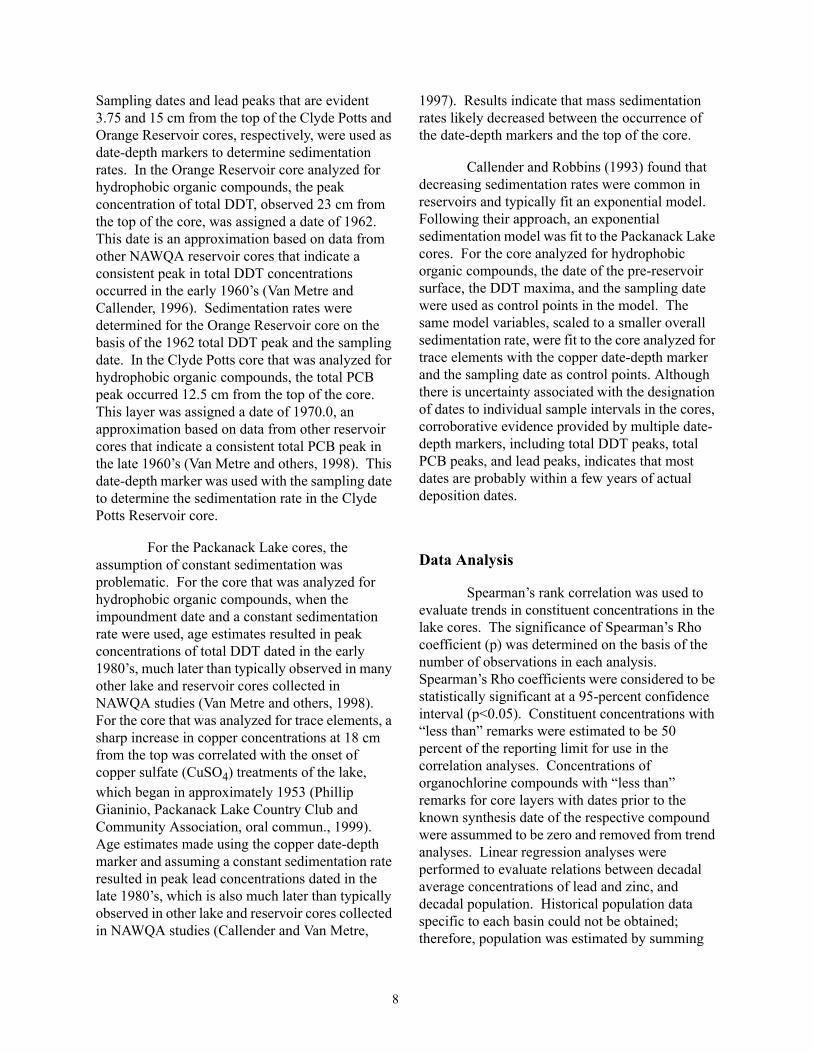
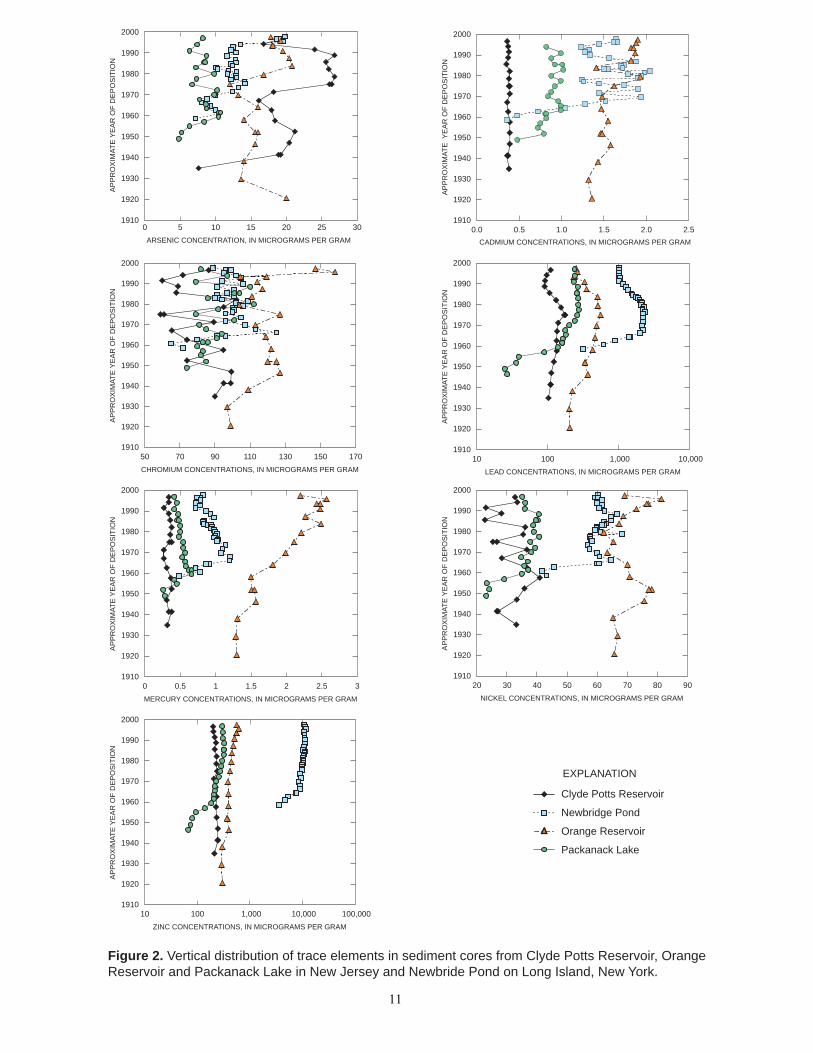
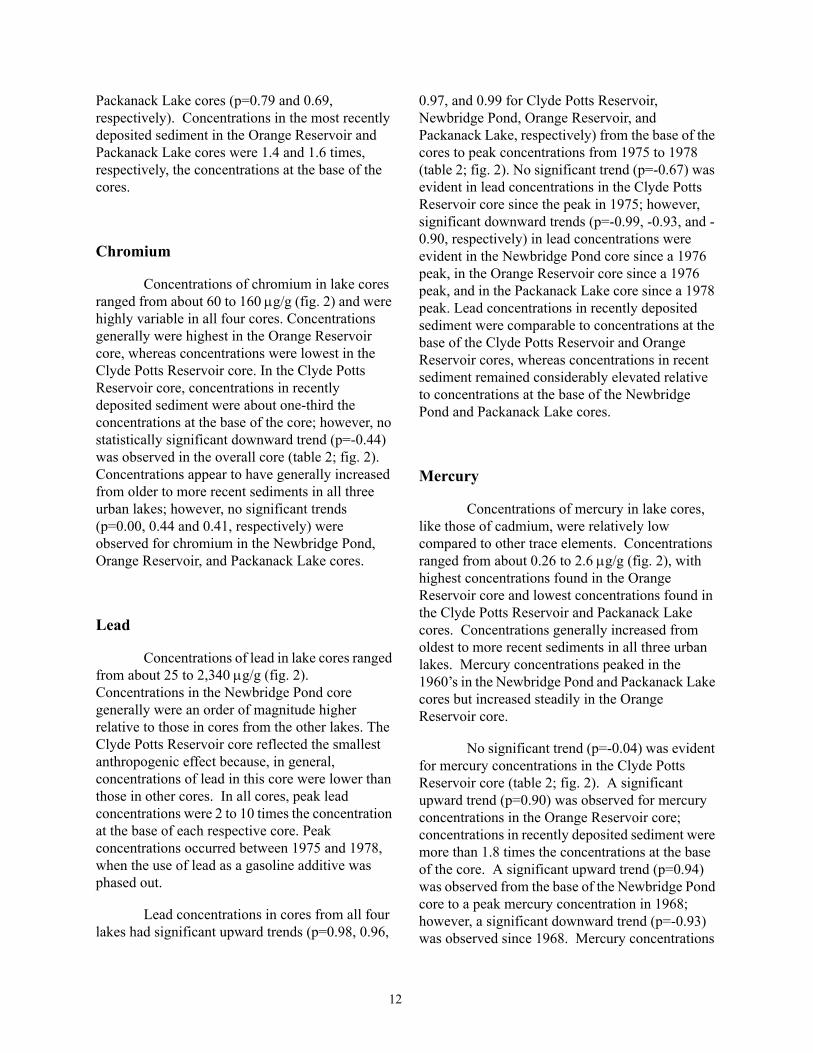
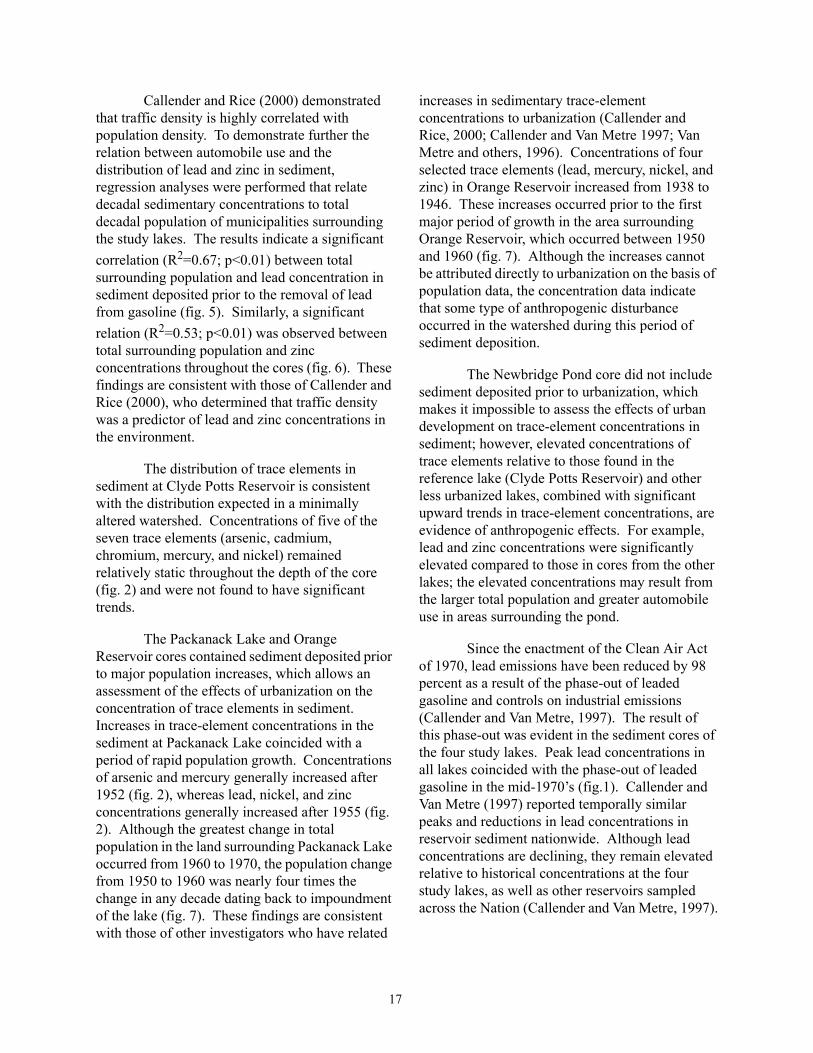
Sedimentary concentrations of arsenic in lake cores ranged from about 5 to 27 µg/g (fig. 2). This variation probably reflects differences in watershed geology and indigenous sediment inputs as much as differences in anthropogenic inputs from the application of arsenical pesticides. Concentrations were lowest and most consistent in the Packanack Lake core, whereas the largest concentrations and variations were observed in the Clyde Potts Reservoir core. These results can be attributed to the geology of the areas. No significant trend (p=0.38) was evident in the Clyde Potts Reservoir core, although concentrations in recently deposited sediment were more than 2.5 times the concentrations at the base of the core. Concentrations of arsenic in sediment in the Newbridge Pond core had a statistically significant
upward trend (p=0.59) from the oldest to most recently deposited sediment (table 2; fig. 2). The upward trend reflects concentrations in recently deposited sediment that were more than 2.0 times the concentrations at the base of the Newbridge Pond core. A significant upward trend (p=0.89) in arsenic concentrations was observed from the base of the Packanack Lake core to the peak concentration in 1961; however, no significant trend (p =-0.49) was observed from the 1961 peak to the most recently deposited sediments. Concentrations in recent sediment remain nearly 1.5 times those in sediment at the base of the Packanack Lake core. No significant trend (p=0.10) was evident for arsenic concentrations from the base of the Orange Reservoir core to the peak concentration in 1984; however, a significant downward trend (p=-0.94) was observed from the 1984 peak concentration to the most recently deposited sediment. Arsenic concentrations in recently deposited sediment remain approximately 1.2 times the concentrations at the base of the Orange Reservoir core.
Cadmium
Concentrations of cadmium in lake cores were low (from 0.4 to 2.0 µg/g, fig. 2) relative to those of other trace elements, except mercury. Concentrations were lowest and exceptionally stable in the Clyde Potts Reservoir core, for which no significant trends (p=-0.37) were observed (table 2; fig. 2). The largest variations and concentrations of cadmium were evident in the Newbridge Pond core. Concentrations generally increased from older to more recent sediments in all three urban lakes. A significant upward trend (p=0.76) in cadmium concentrations was evident from the base of the Newbridge Pond core to the peak concentration in 1982, followed by a significant downward trend (p=-0.53) from the 1982 peak to the most recently deposited sediment. In the Newbridge Pond core, cadmium concentrations in recently deposited sediment were nearly 4.0 times the concentrations at the base. Cadmium concentrations had significant upward trends from the oldest to the most recently deposited sediment in the Orange Reservoir and

10
Table 2. Statistically significant trends in concentrations of trace elements and hydrophobic organic compounds in sediment cores from Clyde Potts Reservoir, Orange Reservoir, and Packanack Lake in New Jersey and Newbridge Pond on Long Island, New York [ND = insufficient data for test; dashes (--) = no trend detected; significant upward trend in red; significant downward trend in blue; (0.59), Spearman’s Rho coefficient; * = significance at 95 percent confidence level; ** = significance at 99 percent confidence level]
Constituent
Direction of trend(s)
Clyde Potts Reservoir Newbridge Pond Orange Reservoir Packanack Lake
Trace elements
Arsenic --Significant upward trend
from older to younger sediments (0.59**)
No significant trend to 1984, downward trend
since then (-0.94**)
Significant upward trend to 1961 (0.89**), no
significant trend since then
Cadmium --
Significant upward trend to 1982 (0.76**),
downward trend since then (-0.53*)
Significant upward trend from older to younger
sediments (0.79**)
Significant upward trend from older to younger
sediments (0.69**)
Chromium -- -- -- --
Lead
Significant upward trend to 1975 (0.98**), no trend
since then
Significant upward trend to 1976 (0.96**),
downward trend since then (-0.99**)
Significant upward trend to 1975 (0.97**),
downward trend since then (-0.93**)
Significant upward trend to 1978 (0.99**), downward trend since then (-0.90**)
Mercury --
Significant upward trend to 1968 (0.94**),
downward trend since then (-0.93**)
Significant upward trend from older to younger
sediments (0.90**)
Significant upward trend to 1960 (0.89*), downward trend since then (-0.96**)
Nickel --Significant upward trend
from older to younger sediments (0.49**)
--Significant upward trend
from older to younger sediments (0.67**)
Zinc
Significant downward trend from older to younger sediments
(-0.50*)
Significant upward trend from older to younger
sediments (0.93**)
Significant upward trend from older to younger
sediments (0.95**)
Significant upward trend from older to younger
sediments (0.95**)
Hydrophobic Organic Compounds
Chlordane
Significant upward trend from older to younger
sediments (0.68**)
Significant upward trend to 1969 (1.00**),
downward trend since then (-0.76**)
Significant upward trend from older to younger
sediments (0.75**)--
Dieldrin ND
Significant upward trend to 1970 (1.00**),
downward trend since then (-0.65*)
ND --
Total DDT --No significant trend to 1962, downward since
then (-0.81**)
Significant downward trend from older to younger sediments
(-0.85**)
--
Total PCB --
Significant upward trend to1962 (1.00**),
downward trend since then (-0.62*)
--
Significant upward trend to 1973 (0.73*), significant
downward trend since then (-0.74*)
Total PAH --Significant upward trend
from older to younger sediments (0.89**)
--Significant upward trend
from older to younger sediments (0.71**)
11
1910
1920
1930
1940
1950
1960
1970
1980
1990
2000
10 100 1,000 10,000 100,000
ZINC CONCENTRATIONS, IN MICROGRAMS PER GRAM
AP
PR
OX
IMA
TE
YE
AR
OF
DE
PO
SIT
ION
1910
1920
1930
1940
1950
1960
1970
1980
1990
2000
20 30 40 50 60 70 80 90
NICKEL CONCENTRATIONS, IN MICROGRAMS PER GRAM
AP
PR
OX
IMA
TE
YE
AR
OF
DE
PO
SIT
ION
1910
1920
1930
1940
1950
1960
1970
1980
1990
2000
0 0.5 1 1.5 2 2.5 3
MERCURY CONCENTRATIONS, IN MICROGRAMS PER GRAM
AP
PR
OX
IMA
TE
YE
AR
OF
DE
PO
SIT
ION
1910
1920
1930
1940
1950
1960
1970
1980
1990
2000
10 100 1,000 10,000
LEAD CONCENTRATIONS, IN MICROGRAMS PER GRAM
AP
PR
OX
IMA
TE
YE
AR
OF
DE
PO
SIT
ION
1910
1920
1930
1940
1950
1960
1970
1980
1990
2000
50 70 90 110 130 150 170
CHROMIUM CONCENTRATIONS, IN MICROGRAMS PER GRAM
AP
PR
OX
IMA
TE
YE
AR
OF
DE
PO
SIT
ION
1910
1920
1930
1940
1950
1960
1970
1980
1990
2000
0.0 0.5 1.0 1.5 2.0 2.5
CADMIUM CONCENTRATIONS, IN MICROGRAMS PER GRAM
AP
PR
OX
IMA
TE
YE
AR
OF
DE
PO
SIT
ION
1910
1920
1930
1940
1950
1960
1970
1980
1990
2000
0 5 10 15 20 25 30
ARSENIC CONCENTRATION, IN MICROGRAMS PER GRAM
AP
PR
OX
IMA
TE
YE
AR
OF
DE
PO
SIT
ION
Figure 2. Vertical distribution of trace elements in sediment cores from Clyde Potts Reservoir, OrangeReservoir and Packanack Lake in New Jersey and Newbride Pond on Long Island, New York.
EXPLANATION
Clyde Potts Reservoir
Newbridge Pond
Orange Reservoir
Packanack Lake
12
Packanack Lake cores (p=0.79 and 0.69, respectively). Concentrations in the most recently deposited sediment in the Orange Reservoir and Packanack Lake cores were 1.4 and 1.6 times, respectively, the concentrations at the base of the cores.
Chromium
Concentrations of chromium in lake cores ranged from about 60 to 160 µg/g (fig. 2) and were highly variable in all four cores. Concentrations generally were highest in the Orange Reservoir core, whereas concentrations were lowest in the Clyde Potts Reservoir core. In the Clyde Potts Reservoir core, concentrations in recently deposited sediment were about one-third the concentrations at the base of the core; however, no statistically significant downward trend (p=-0.44) was observed in the overall core (table 2; fig. 2). Concentrations appear to have generally increased from older to more recent sediments in all three urban lakes; however, no significant trends (p=0.00, 0.44 and 0.41, respectively) were observed for chromium in the Newbridge Pond, Orange Reservoir, and Packanack Lake cores.
Lead
Concentrations of lead in lake cores ranged from about 25 to 2,340 µg/g (fig. 2). Concentrations in the Newbridge Pond core generally were an order of magnitude higher relative to those in cores from the other lakes. The Clyde Potts Reservoir core reflected the smallest anthropogenic effect because, in general, concentrations of lead in this core were lower than those in other cores. In all cores, peak lead concentrations were 2 to 10 times the concentration at the base of each respective core. Peak concentrations occurred between 1975 and 1978, when the use of lead as a gasoline additive was phased out.
Lead concentrations in cores from all four lakes had significant upward trends (p=0.98, 0.96,
0.97, and 0.99 for Clyde Potts Reservoir, Newbridge Pond, Orange Reservoir, and Packanack Lake, respectively) from the base of the cores to peak concentrations from 1975 to 1978 (table 2; fig. 2). No significant trend (p=-0.67) was evident in lead concentrations in the Clyde Potts Reservoir core since the peak in 1975; however, significant downward trends (p=-0.99, -0.93, and -0.90, respectively) in lead concentrations were evident in the Newbridge Pond core since a 1976 peak, in the Orange Reservoir core since a 1976 peak, and in the Packanack Lake core since a 1978 peak. Lead concentrations in recently deposited sediment were comparable to concentrations at the base of the Clyde Potts Reservoir and Orange Reservoir cores, whereas concentrations in recent sediment remained considerably elevated relative to concentrations at the base of the Newbridge Pond and Packanack Lake cores.
Mercury
Concentrations of mercury in lake cores, like those of cadmium, were relatively low compared to other trace elements. Concentrations ranged from about 0.26 to 2.6 µg/g (fig. 2), with highest concentrations found in the Orange Reservoir core and lowest concentrations found in the Clyde Potts Reservoir and Packanack Lake cores. Concentrations generally increased from oldest to more recent sediments in all three urban lakes. Mercury concentrations peaked in the 1960’s in the Newbridge Pond and Packanack Lake cores but increased steadily in the Orange Reservoir core.
No significant trend (p=-0.04) was evident for mercury concentrations in the Clyde Potts Reservoir core (table 2; fig. 2). A significant upward trend (p=0.90) was observed for mercury concentrations in the Orange Reservoir core; concentrations in recently deposited sediment were more than 1.8 times the concentrations at the base of the core. A significant upward trend (p=0.94) was observed from the base of the Newbridge Pond core to a peak mercury concentration in 1968; however, a significant downward trend (p=-0.93) was observed since 1968. Mercury concentrations

13
in recently deposited sediment are only slightly higher than concentrations at the base of the Newbridge Pond core (fig. 2). Similarly, for the Packanack Lake core, a significant upward trend (p=0.89) was observed to a 1960 peak concentration followed by a significant downward trend (p=-0.96) in sediment deposited since 1960. Concentrations in recently deposited sediment, however, were nearly twice those observed at the base of the Packanack Lake core (fig. 2).
Nickel
Concentrations of nickel in lake cores ranged from about 23 to 81 µg/g (fig. 2). The highest concentrations were present in the Orange Reservoir and Newbridge Pond cores, whereas the lowest concentrations were present in the Clyde Potts Reservoir and Packanack Lake cores. No significant trends were evident for nickel concentrations in the Clyde Potts and Orange Reservoir cores (p=-0.27 and 0.31, respectively) (table 2; fig. 2). Concentrations in cores from the other two urban lakes, in general, increased from oldest to more recent sediments. Significant upward trends (p=0.49 and 0.67, respectiviely) in nickel concentrations were evident in the Newbridge Pond and Packanack Lake cores; however, concentrations in recently deposited sediment were only 1.3 and 1.5 times the concentrations at the base of the Newbridge Pond and Packanack Lake cores, respectively.
Zinc
Concentrations of zinc in lake cores ranged from about 67 to 11,800 µg/g (fig. 2), the highest range of the trace elements sampled. Zinc concentrations were highest in the Newbridge Pond core and generally were two orders of magnitude higher than those in the other lake cores (fig. 2). The Clyde Potts Reservoir core reflected the smallest anthropogenic effect; a significant downward trend (p=-0.50) in zinc concentrations from oldest to youngest sediment was observed (table 2; fig. 2). Zinc concentrations generally
increased from oldest to more recent sediment in the cores of the three urban lakes. Significant upward trends (p=0.93, 0.95, and 0.95 for Newbridge Pond, Orange Reservoir, and Packanack Lake, respectively) were evident in cores from the urban lakes; zinc concentrations in recent sediment were 2 to 3 times the concentrations at the base of each respective core.
OCCURRENCE OF, AND TRENDS IN, HYDROPHOBIC ORGANIC COMPOUNDS
Hydrophobic organic compounds (organochlorine pesticides, PCBs, and PAHs) tend to sorb to fine-grained sediment and consequently accumulate in sediments of lakes and reservoirs. The sediment used in organochlorine compound analysis dated to approximately 1970 in the Clyde Potts Reservoir core, 1952 in the Newbridge Pond core, 1932 in the Packanack Lake core, and 1950 in the Orange Reservoir core.
The highest linear sedimentation rate (1.2 cm/yr) was observed in the Newbridge Pond core, followed by 0.7 cm/yr and 0.6 cm/yr in the Orange Reservoir and Packanack Lake cores, respectively. The lowest linear sedimentation rate (0.5 cm/yr) was observed in the minimally affected Clyde Potts Reservoir core.
Chlordane
Concentrations of chlordane in lake cores ranged from about 5.9 to 14,000 µg/kg (fig. 3), the highest range of the four organochlorine compounds sampled. Concentrations were highest in the Newbridge Pond core and generally were one to three orders of magnitude greater than those in other lake cores (fig. 3). The Clyde Potts Reservoir core reflected the smallest anthropogenic effect, with the lowest chlordane concentrations of all lakes (fig. 3). A significant upward trend in chlordane concentrations (p=0.56) was observed from the oldest to most recently deposited sediment in the Clyde Potts Reservoir core

14
(table 2); however, concentrations in recently deposited sediment were only slightly elevated relative to those at the base of the core (fig. 3). Chlordane concentrations in the three urban lakes generally increased from the oldest to the most recently deposited sediment. Concentrations in the Packanack Lake core were highly variable and, as a result, no significant trend (p=0.26) was observed (table 2; fig. 3). A significant upward trend (p=1.00) was evident in sediment from the base of the Newbridge Pond core to the peak chlordane concentration in 1970. In sediment deposited since 1970, a significant downward trend (p=0.76) in concentrations was observed (table 2; fig. 3). In the Orange Reservoir core, a significant upward trend (p=0.75) in chlordane concentrations was evident from the oldest sediment to the most recently deposited sediment. Chlordane concentrations in recently deposited sediment were more than 2 and 3 times the concentrations at the base of the Newbridge Pond and Orange Reservoir cores, respectively (fig. 3).
Dieldrin
Dieldrin concentrations were less than the detection limit at all depths in the Clyde Potts and Orange Reservoir cores (fig. 3). Dieldrin initially was detected in the Packanack Lake core in 1953 sediment at a concentration of 12 µg/kg. It was detected intermittently in sediment deposited after 1953 at similarly low concentrations, although no significant trend (p=0.13) was evident (table 2; fig. 3). Dieldrin was detected in the Newbridge Pond core at an initial concentration of 42 µg/kg in 1952 sediment, at a peak concentration of 470 µg/kg in 1970 sediment, and at approximately 150 µg/kg in the most recent sediment (fig. 3). A significant upward trend (p=1.00) was observed from the base of the Newbridge Pond core to the 1970 peak concentration, followed by a significant downward trend (p=-0.65) from 1970 to the most recently deposited sediment.
Total Dichlorodiphenyl-trichloroethane
Concentrations of total DDT in lake cores ranged from about 3.5 to 4,460 µg/kg, with the highest concentrations observed in the Newbridge Pond core (fig. 3). Lowest concentrations were found in the Clyde Potts Reservoir core, reflecting the smallest anthropogenic effect (fig. 3). Total DDT concentrations in recent sediments in the Clyde Potts core were approximately one-half the concentrations at the base of the core; however, the downward trend (p=-0.37) was not significant (table 2; fig. 3). No significant trend (p=-0.05) in total DDT concentrations was observed in the Packanack Lake core; however, concentrations in the most recently deposited sediment were elevated relative to concentrations at the base of the core (table 2; fig. 3). In the two other urban cores, distinct peaks in total DDT concentrations were evident in 1962. In the Orange Reservoir core, a significant upward trend (p=1.00) was observed from the base of the core to the 1962 peak. From 1962 to the most recently deposited sediment, a significant downward trend (p=-0.78) in total DDT concentrations was evident (table 2; fig.3). This downward trend resulted in total DDT concentrations in recently deposited sediment that were approximately one-fifth the concentrations at the base of the core. The upward trend in total DDT concentrations from the base of the Newbridge Pond core to the 1962 peak was not statistically significant (p=0.80); however, the downward trend observed from the peak to the most recently deposited sediment was significant (p=-0.81). As a result, total DDT concentrations in the most recently deposited sediment were less than one-half the concentrations found at the base of the Newbride Pond core (fig. 3).

15
1930
1940
1950
1960
1970
1980
1990
2000
1,000 10,000 100,000 1,000,000
AP
PR
OX
IMA
TE
YE
AR
OF
DE
PO
SIT
ION
TOTAL PAH CONCENTRATION, IN MICROGRAMS PER KILOGRAM
Figure 4. Vertical distribution of total polycyclic aromatic hydrocarbons (PAHs) in sediment cores from Clyde Potts Reservoir, Orange Reservoir, and Packanack Lake in New Jersey and Newbridge Pond on Long Island, New York.
EXPLANATION
Clyde Potts Reservoir
Newbridge Pond
Orange Reservoir
Packanack Lake
1930
1940
1950
1960
1970
1980
1990
2000
100 1,000 10,000
TOTAL PCB CONCENTRATION, IN MICROGRAMS PER KILOGRAM
AP
PR
OX
IMA
TE
YE
AR
OF
DE
PO
SIT
ION
Year of cancellation of all uses
101
EXPLANATION
1930
1940
1950
1960
1970
1980
1990
2000
100 1,000 10,000
TOTAL DDT CONCENTRATION, IN MICROGRAMS PER KILOGRAM
AP
PR
OX
IMA
TE
YE
AR
OF
DE
PO
SIT
ION
101
Year of synthesis of compoundYear of cancellation of all usesOpen symbols indicate no detections
EXPLANATION
1930
1940
1950
1960
1970
1980
1990
2000
100 1,000
AP
PR
OX
IMA
TE
YE
AR
OF
DE
PO
SIT
ION
DIELDRIN CONCENTRATION, IN MICROGRAMS PER KILOGRAM
101
EXPLANATION
Year of synthesis of compound Year of cancellation of most usesYear of cancellation of all usesOpen symbols indicate no detections
1930
1940
1950
1960
1970
1980
1990
2000
100 1,000 10,000 100,000
EXPLANATION
AP
PR
OX
IMA
TE
YE
AR
OF
DE
PO
SIT
ION
CHLORDANE CONCENTRATION, IN MICROGRAMS PER KILOGRAM
Year of synthesis of compound Year of cancellation of agricultural usesYear of cancellation of all usesOpen symbols indicate no detections
101
Figure 3. Vertical distribution of organochlorine compounds in sediment cores from Clyde Potts Reservoir, Orange Reservoir, and Packanack Lake in New Jersey and Newbridge Pond on Long Island, New York.

16
Total Polychlorinated Biphenyls
Concentrations of total PCBs (fig. 3) ranged from about 10 to 116 µg/kg in the cores from the three New Jersey lakes but were one to two orders of magnitude higher in the Newbridge Pond core (maximum of 1,910 µg/kg). Total PCBs in the Newbridge Pond core increased from an initial concentration of 69 µg/kg in 1952 sediment to a peak of 1,910 µg/kg in 1962 sediment. Total PCB concentrations in sediment deposited since 1962 decreased to approximately 600 µg/kg in the most recently deposited sediments (fig. 3). The upward trend in total PCBs to the 1962 peak sediment concentration was significant (p=1.00), as was the downward trend (p=-0.62) from the 1962 peak to the most recently deposited sediment (table 2).
Concentrations of total PCBs in the Clyde Potts Reservoir core, like those of other hydrophobic organic compounds, generally were lower than concentrations in other cores (fig. 3). Although concentrations of total PCBs in the Clyde Potts core were highly variable, a significant downward trend (p=-0.60) from the oldest to most recently deposited sediment was observed (table 2; fig. 3). In the Packanack Lake core, a significant upward trend (p=0.73) was observed in total PCB concentrations from the base to the 1973 peak concentration (table 2; fig. 3). A significant downward trend (p=-0.74) was evident in sediment deposited since the 1973 peak; however, total PCB concentrations in recently deposited sediment remained elevated relative to concentrations in the base of the core (table 2; fig. 3). Total PCB concentrations were variable throughout the Orange Reservoir core and showed no significant trend (p=-0.18).
Polycyclic Aromatic Hydrocarbons
PAHs were detected throughout the four cores in concentrations that ranged from about 1,700 µg/kg (Packanack Lake) in 1932 sediment to a peak concentration of about 230,000 µg/kg (Newbridge Pond) in 1997 sediment (fig. 4). Concentrations of PAHs generally were lower in
the Clyde Potts Reservoir core than in cores from the urban lakes; however, the PAH concentations were lowest at the base of the Packanack Lake core (fig. 4), which contained sediment deposited prior to the urbanization of the watershed. No significant trends (p=-0.06 and 0.34, respectively) in total PAH concentrations were evident in the Clyde Potts Reservoir and Orange Reservoir cores (table 2; fig. 4); however, significant upward trends (p=0.89 and 0.71, respectively) were observed in the Newbridge Pond and Packanack Lake cores. Total PAH concentrations in recently deposited sediment in Newbridge Pond and Packanack Lake were more than 8 times the concentrations at the base of each respective core.
EFFECT OF WATERSHED CHARACTERISTICS AND REGULATORY ACTION ON CONSTITUENT CONCENTRATIONS IN SEDIMENT
Trace Elements
Lead and zinc are associated with the use of automobiles; lead was a major component of gasoline until its removal in the mid-1970’s, and zinc is a component of rubber tires and a by-product of fossil fuel combustion (Callender and Rice, 2000). In all lakes, significant upward trends were observed for lead concentrations in sediment deposited from the base of the core to the peak in the mid-1970’s. The effect of automobile use on the distribution of lead in sediment was supported further by the significant downward trends observed for all lakes, except Clyde Potts Reservoir, in the sediments deposited after phase-out of leaded gasoline. Upward trends in zinc concentrations were significant throughout the cores from the three urban lakes. In Orange Reservoir and Packanack Lake, the concentrations of both elements began to increase in the mid-1940’s to early 1950’s, concurrent with an increase in the number of automobiles fueled by leaded gasoline (Callender and Rice, 2000).
17
Callender and Rice (2000) demonstrated that traffic density is highly correlated with population density. To demonstrate further the relation between automobile use and the distribution of lead and zinc in sediment, regression analyses were performed that relate decadal sedimentary concentrations to total decadal population of municipalities surrounding the study lakes. The results indicate a significant correlation (R2=0.67; p<0.01) between total surrounding population and lead concentration in sediment deposited prior to the removal of lead from gasoline (fig. 5). Similarly, a significant relation (R2=0.53; p<0.01) was observed between total surrounding population and zinc concentrations throughout the cores (fig. 6). These findings are consistent with those of Callender and Rice (2000), who determined that traffic density was a predictor of lead and zinc concentrations in the environment.
The distribution of trace elements in sediment at Clyde Potts Reservoir is consistent with the distribution expected in a minimally altered watershed. Concentrations of five of the seven trace elements (arsenic, cadmium, chromium, mercury, and nickel) remained relatively static throughout the depth of the core (fig. 2) and were not found to have significant trends.
The Packanack Lake and Orange Reservoir cores contained sediment deposited prior to major population increases, which allows an assessment of the effects of urbanization on the concentration of trace elements in sediment. Increases in trace-element concentrations in the sediment at Packanack Lake coincided with a period of rapid population growth. Concentrations of arsenic and mercury generally increased after 1952 (fig. 2), whereas lead, nickel, and zinc concentrations generally increased after 1955 (fig. 2). Although the greatest change in total population in the land surrounding Packanack Lake occurred from 1960 to 1970, the population change from 1950 to 1960 was nearly four times the change in any decade dating back to impoundment of the lake (fig. 7). These findings are consistent with those of other investigators who have related
increases in sedimentary trace-element concentrations to urbanization (Callender and Rice, 2000; Callender and Van Metre 1997; Van Metre and others, 1996). Concentrations of four selected trace elements (lead, mercury, nickel, and zinc) in Orange Reservoir increased from 1938 to 1946. These increases occurred prior to the first major period of growth in the area surrounding Orange Reservoir, which occurred between 1950 and 1960 (fig. 7). Although the increases cannot be attributed directly to urbanization on the basis of population data, the concentration data indicate that some type of anthropogenic disturbance occurred in the watershed during this period of sediment deposition.
The Newbridge Pond core did not include sediment deposited prior to urbanization, which makes it impossible to assess the effects of urban development on trace-element concentrations in sediment; however, elevated concentrations of trace elements relative to those found in the reference lake (Clyde Potts Reservoir) and other less urbanized lakes, combined with significant upward trends in trace-element concentrations, are evidence of anthropogenic effects. For example, lead and zinc concentrations were significantly elevated compared to those in cores from the other lakes; the elevated concentrations may result from the larger total population and greater automobile use in areas surrounding the pond.
Since the enactment of the Clean Air Act of 1970, lead emissions have been reduced by 98 percent as a result of the phase-out of leaded gasoline and controls on industrial emissions (Callender and Van Metre, 1997). The result of this phase-out was evident in the sediment cores of the four study lakes. Peak lead concentrations in all lakes coincided with the phase-out of leaded gasoline in the mid-1970’s (fig.1). Callender and Van Metre (1997) reported temporally similar peaks and reductions in lead concentrations in reservoir sediment nationwide. Although lead concentrations are declining, they remain elevated relative to historical concentrations at the four study lakes, as well as other reservoirs sampled across the Nation (Callender and Van Metre, 1997).

18
EXPLANATION
Clyde Potts Reservoir
Newbridge Pond
Orange Reservoir
Packanack Lake
1930
1940
1950
1960
1970
1980
1990
2000
0 25,000 50,000 75,000 100,000 125,000 150,000
YE
AR
Figure 7. Population of municipalities adjacent to Clyde Potts Reservoir, Orange Reservoir, andPackanack Lake in New Jersey and NewbridgePond on Long Island, New York, 1930-1990.
POPULATION
R2 = 0.53
1.50
1.70
1.90
2.10
2.30
2.50
2.70
2.90
3.10
3.00 3.50 4.00 4.50 5.00 5.50
Figure 6. Relation of log-transformed decadal zinc concentrations in sediment cores to log-transformed decadal population of the municipalities adjacent to Clyde Potts Reservoir,Orange Reservoir, and Packanack Lake in New Jersey and Newbridge Pond on Long Island,New York.
LOG-TRANSFORMED DECADAL POPULATION
LOG
-TR
AN
SF
OR
ME
D D
EC
AD
AL
ZIN
C C
ON
CE
NT
RA
TIO
NS
R2 = 0.67
1.00
1.50
2.00
2.50
3.00
3.50
3.00 3.50 4.00 4.50 5.00 5.50
Figure 5. Relation of log-transformed decadal lead concentrations in sediment cores to log-transformed decadal population of the municipalities adjacent to Clyde Potts Reservoir, Orange Reservoir, and Packanack Lake in New Jersey and Newbridge Pond on Long Island, New York.
LOG-TRANSFORMED DECADAL POPULATION
LOG
-TR
AN
SF
OR
ME
D D
EC
AD
AL
LEA
D C
ON
CE
NT
RA
TIO
N
19
Organochlorine Compounds
The detection of organochlorine compounds in the lake sediment cores is an indication of past use and environmental persistence of these compounds within the study watersheds. All of the organochlorine compounds evaluated in this study had been banned from use in the United States for at least 1 decade prior to sampling; however, concentrations of three of the four compounds were detected at all four lakes.
Organochlorine concentrations generally were elevated in cores from Orange Reservoir and Newbridge Pond, whose watersheds have a high percentage of urban-industrial/commercial-land use and total population in surrounding areas. In contrast, concentrations in sediment at Clyde Potts Reservoir, the study reference site, generally were low relative to those in sediment in the more developed basins.
Concentrations of organochlorine compounds in Newbridge Pond sediment were of particular concern. The peak chlordane concentration in sediment cores was from one to three orders of magnitude greater than that at other lakes in this study and more than two orders of magnitude greater than those in sediment cores sampled in other urban environments in the United States (P.C. Van Metre, U.S. Geological Survey, written commun., 1998). Peak total DDT concentration was about 3.5 to 100 times the peaks in other lakes in this study and about 5 times the highest peak concentration reported nationally. The peak concentration of total PCBs was more than 25 times the peak concentrations in other study lakes and more than 5 times the next greatest peak concentration in the Nation. Peak dieldrin concentrations, like those of other organochlorine compounds, were approximately 30 times the peak concentration at Packanack Lake, the only other study lake where it was detected. Newbridge Pond had the highest dieldrin peak of lakes sampled across the Nation; the concentration was more than 80 times the next highest peak.
A general decline in concentrations of organochlorine compounds was evident in cores from the four study lakes. At Newbridge Pond,
concentrations of all four compounds were found to have significant downward trends from peak concentrations. With the exception of chlordane in the Clyde Potts Reservoir and Orange Reservoir cores, concentrations of the four organochlorine compounds were determined to have significant downward trends from peak concentrations to those in recently deposited sediment or non-significant trends throughout the core (table 2). These results indicate that concentrations of organochlorine compounds in lake sediment either are declining or remaining static. These results are consistent with those of other investigations of organochlorine concentrations in sediment, which showed general downward trends (Van Metre and others, 1997; Van Metre and others, 1998). On the basis of these findings and because of the regulatory actions prohibiting the production and use of these compounds, the downward trends in concentrations of organochlorine compounds in sediment are expected to continue. Concentrations in the lakes, particularly Newbridge Pond, remain elevated relative to concentrations at the base of each respective core (fig. 3). Furthermore, the persistent nature of these compounds indicates that a substantial amount of time may be required to purge them completely from the watershed.
Polycyclic Aromatic Hydrocarbons
The accumulation of PAHs in sediment has been related to factors associated with urbanization and industrialization, particularly the incomplete combustion of fossil fuels (Pereira and others, 1999). The results of this study are somewhat consistent with this finding in that sediments from the lake in the minimally urbanized watershed (Clyde Potts Reservoir) were determined to contain relatively static and low concentrations of PAHs compared to those from other lakes. Furthermore, Newbridge Pond and Packanack Lake, the two watersheds with the highest urban-residential land use, were found to have significant upward trends in PAH concentrations throughout the cores. These upward trends in PAH concentrations were consistent with increasing total population of the areas surrounding Newbridge Pond and Packanack Lake. PAH concentrations at the base of the
20
Packanack Lake core, the only core to include sediment deposited prior to urbanization and widespread automobile use, were lower than those determined at the reference site. These results are consistent with those of Van Metre and others (2000), who reported increased PAH concentrations in reservoirs and lakes within urbanized watersheds with high vehicular traffic. The distribution of PAHs in the Orange Reservoir core deviated somewhat from this relation. Although concentrations were elevated relative to those in the lakes with less developed watersheds, PAH concentrations in the Orange Reservoir core actually decreased between 1950 and 1970, when the total population of the surrounding area was increasing.
In the three urban-lake cores, significant upward trends were observed either to peak concentrations or throughout the core for most trace elements and hydrophobic organic compounds. This indicates that changes in population, land use, and chemical use in the urbanized watersheds over the period of sedimentary record have contributed to upward trends in concentrations. Although downward trends were observed for some constituents in the years after their concentrations peaked, concentrations of most constituents remain elevated in the most recently deposited sediments in urban lake cores relative to those in the base of each respective core and relative to those in the reference lake cores. Similar trends in concentrations of trace elements and hydrophobic organic compounds have been observed in other urban-lake-sediment cores across the United States (Callender and Rice, 2000; Van Metre and others, 2000; Van Metre and others, 1998; Van Metre and others, 1997).
SUMMARY AND CONCLUSIONS
Sediment cores from three urban lakes, two in New Jersey and one on Long Island, New York, and from one non-urban lake in New Jersey were analyzed for trace elements and hydrophobic organic compounds. Spearman’s rank correlation was used to evaluate trends in constituent
concentrations. Core layers were dated by use of cesium-137, copper, lead, or DDT profiles.
Trace elements (arsenic, cadmium, chromium, lead, mercury, nickel, and zinc) were detected throughout the cores of all four lakes. Concentrations of most elements, with the exception of arsenic, were higher in the cores from the three lakes within urbanized watersheds than in the core from the largely forested, reference watershed (Clyde Potts Reservoir). The highest concentrations of cadmium, lead, and zinc were found in the Newbridge Pond core on Long Island, New York. Concentrations of lead and zinc in the Newbridge Pond core generally were one and two orders of magnitude greater than concentrations in cores from the other lakes, respectively. The highest concentrations of chromium, mercury, and nickel were present in the core from Orange Reservoir in New Jersey.
Results of trend analyses indicate that concentrations of trace elements in lake sediments, with the exception of chromium, were affected by urbanization. Concentrations in cores from the urban lakes showed significant upward trends from older to more recent sediment either to peak concentrations or throughout the entire core for all trace elements, except chromium at all three lakes and arsenic and nickel from Orange Reservoir. This indicates that changes in population and land use within the urbanized watersheds over the period of sedimentary record could have contributed to the upward trends in trace-element concentrations. Although downward trends were observed for some trace elements after their peaks in cores from urban lakes, concentrations of all trace elements remained elevated in the most recently deposited sediments relative to concentrations in the base of each respective core.
No significant trends were detected, however, in concentrations of five of seven trace elements in the sediment core from minimally urbanized Clyde Potts Reservoir. Concentrations of zinc in the Clyde Potts Reservoir core had a significant downward trend from oldest to youngest sediments, and concentrations of lead had a significant upward trend to a peak in 1975.

21
Changes in concentrations of lead and zinc, trace elements associated with automobile use, were highly correlated with changes in total decadal population of the area surrounding the reservoirs. Population is an indicator of vehicular traffic, which is an indicator of gasoline use (a probable lead source) and tire wear (a probable zinc source). Lead concentrations over time were highly correlated with population in the vicinity of all lakes until the peak concentration in sediment deposited in the mid-1970’s. Concentrations of lead in lake sediment generally decreased since the use of leaded gasoline was phased out in the mid-1970’s. Although this downward trend was significant, concentrations of lead in recent sediment from urban lakes remain elevated relative to sediment deposited at the base of the cores. Zinc concentrations were highly correlated with population over the entire depth of the core. In general, zinc concentrations increased in the three urbanized watersheds, presumably in response to increasing population and vehicular use; however, this trend was not evident in the Clyde Potts Reservoir watershed, where vehicular use is minimal.
Detectable concentrations of chlordane, total DDT, and total PCBs were found in sediment from all lakes. Dieldrin was detected only in the Newbridge Pond and Packanack Lake cores. Sedimentary concentrations of organochlorine compounds, in general, have decreased since regulatory action was taken to discontinue their production and use in the 1970’s and 1980’s. Concentrations of the four organochlorine compounds, except chlordane in the Clyde Potts and Orange Reservoir cores, had significant downward trends from peak concentrations to recently deposited sediment or non-significant trends throughout the core; however, because of the environmental persistence of these compounds, they are still found in detectable concentrations a decade after their use was discontinued. Concentrations generally were higher at Newbridge Pond and Orange Reservoir, watersheds with increased population and urban-industrial/commercial-land use, than at Clyde Potts Reservoir, the forested, reference site. Concentrations of organochlorine compounds were particularly high at Newbridge Pond where
concentrations were much higher than at other urban reservoirs sampled nationally. Without additional input of these compounds, the general downward trend in concentrations at most sites probably will continue; however, the persistence of these compounds indicates that a substantial amount of time may be required to purge them completely from the watersheds.
PAH concentrations in sediment generally increased with population and urbanization, presumably as a result of the increased fossil-fuel combustion (gasoline and home-heating fuels) and other uses (roads and parking lots paved with asphalt) associated with increased urban development and vehicular traffic. This finding is supported by low concentrations of PAHs in Packanack Lake sediments in the 1930’s, before the watershed was urbanized and when automobiles were comparatively rare. As vehicular use and urbanization increase in these watersheds, the general increase in PAH concentrations in lake sediments can be expected to continue. Many PAH compounds are known to be toxic to some aquatic organisms, therefore, an upward trend might be a cause for concern for the health of aquatic life in streams that drain the more populated (greater than 2,000 people per square mile) watersheds of the study area.
Data from this study indicate that changes in population, land use, and chemical use in the urbanized watersheds over the period of sedimentary record have contributed to upward trends in concentrations of trace elements and hydrophobic organic compounds. Although downward trends were observed for some constituents in the years after their concentrations peaked, concentrations of most constituents in urban lake cores remain elevated in the most recently deposited sediments relative to the base of each respective core and relative to those in the reference lake cores. Similar trends in concentrations of these constituents have been observed in other urban-lake-sediment cores across the United States.

22
REFERENCES CITED
Arbogast, Belinda, ed., 1996, Analytical methods manual for the mineral resource surveys program: U.S. Geological Survey Open-File Report 96-525, 248 p.
Ayers, M.A., Stackelberg, P.E., and, Kennen, J.G., 2000, Water quality of the Long Island-New Jersey Coastal Drainages: U.S. Geological Survey Circular 1201, 40 p.
Brigham, M.E., Goldstein, R.M., and Tornes, L.H., 1997, Trace elements and organic chemicals in stream-bottom sediments and fish tissues, Red River of the North Basin, Minnesota, North Dakota, and South Dakota, 1992-95: U.S. Geological Survey Water Resources Investigations Report 97-4043, 32 p.
Callender, Edward and Rice, K.C., 2000, The urban environmental gradient: Anthropogenic influences on the spatial and temporal distributions of lead and zinc in sediments: Environmental Science and Technology, v. 34, no. 2, p. 232-238.
Callender, Edward and Van Metre, P.C., 1997, Reservoir sediment cores show U.S. lead declines: Environmental Science and Technology, v. 31, no. 9, p. 424-428.
Callender, Edward, and Robbins, J.A., 1993, Transport and accumulation of radionuclides and stable elements in a Missouri River reservoir: Water Resources Research, v. 29, p. 1787-1804.
Canadian Council of Resource and Environment Ministers, 1992, Canadian Water-Quality Guidelines: Ottawa, Ontario, Ecosystems Sciences and Evaluations Directorate, 218 p.
Eisenreich, S.J., Capel, P.D., Robbins, J.A., and Boubonniere, R., 1989, Accumulation and diagenesis of chlorinated hydrocarbons in lacustrine sediments: Environmental Science and Technology, v. 23, no. 9, p. 1116-1126.
Essex County, 2000, Essex County New Jersey Government, accessed May 1999, at URL http://co.essex.nj.us/history0.htm.
Foreman, W.T., Connor, B.F., Furlong, E.T., Vaught, D.G., and Merten, L.M., 1995, Methods of analysis by the U.S. Geological Survey National Water Quality Laboratory—Determination of organochlorine pesticides and polychlorinated biphenyls in bottom sediment by dual capillary-column gas chromatography with electron-capture detection: U.S. Geological Survey Open-File Report 95-140, 78 p.
Forstner, Ulrich, and Wittman, G.T.W., eds., 1983, Metal pollution in the aquatic environment (2d ed.): New York, Springer-Verlag, 486 p.
Furlong, E.T., Vaught, D.G., Merten, L.M., Foreman, W.T., and Gates, P.M., 1996, Methods of analysis by the U.S. Geological Survey National Water Quality Laboratory; determination of semivolatile organic compounds in bottom sediment by solvent extraction, gel permeation chromatographic fractionation, and capillary-column gas chromatography/mass spectrometry: U.S. Geological Survey Open-File Report 95-719, 67 p.
Harte, John, Holdren, Cheryl, Schneider, Richard, and Shirley, Christine, 1991, Toxics A to Z -- A guide to everyday pollution hazards: Los Angeles, Calif., University of California Press, 478 p.
Leahy, P.P., Rosenshein, J.S., and Knopman, D.S., 1990, Implementation plan for the National Water-Quality Assessment Program: U.S. Geological Survey Open-File Report 90-174, 10 p.
Miller, P.A., Munkittrick, K.R., and Dixon, D.G., 1992, Relationship between concentrations of copper and zinc in water, sediment, benthic invertebrates, and tissues of white sucker (Catostomus commersoni) at metal-contaminated sites: Canadian Journal of Fisheries and Aquatic Sciences, v. 49, p. 978-984.
Nadakavukaren, Anne, 1995, Our global environment--A health perspective (4th ed.): Prospect Heights, Ill., Waveland Press, 711 p.
23
REFERENCES CITED--Continued
New Jersey Department of Labor, 1991, New Jersey Population Trends 1790-1990: New Jersey State Data Center, Division of Labor Market and Demographic Research, 70 p.
Ondov, J.M., Zoller, W.H., and Gorden, G.E., 1982, Trace element emissions on aerosols from motor vehicles: Environmental Science and Technology, v. 16, no. 6, p. 318-328.
Pereira, W.E., Hostettler, F.D., Luoma, S.N., van Geen, Alexander, Fuller, C.C., and Anima, R.J., 1999, Sedimentary record of anthropogenic and biogenic polycyclic aromatic hydrocarbons in San Francisco Bay, California: Marine Chemistry, v. 64, p. 99-113.
Rand, G.M., and Petrocelli, S.R., 1985, Fundamentals of aquatic toxicology: Washington, D.C.,Hemisphere Publishing Corporation, 666 p.
Sittig, Marshall, ed., 1980, Pesticide manufacturing and toxic materials control encyclopedia: Park Ridge, N.J., Nopes Data Corporation, 810 p.
Smith, J.A., Witkowski, P.J., and Fusillo, T.V., 1988, Manmade organic compounds in the surface waters of the United States-A review of current understanding: U.S. Geological Survey Circular 1007, 92 p.
U.S. Environmental Protection Agency, 1979, Water-related environmental fate of 129 priority pollutants, Volume 1: Washington, D.C., Office of Water, EPA-440/4-79-029a, 473 p.
U.S. Environmental Protection Agency, 1997, Guidance for assessing chemical contaminant data for use in fish advisories--Volume 2 risk assessment and fish consumption limits (2d ed.): Washington, D.C., Office of Water, EPA 823-B-97-009, chap. 5, 146 p.
Van Metre, P.C., Mahler, B.J., and Furlong, E.T., 2000, Urban sprawl leaves its PAH signature: Environmental Science and Technology, v. 34, no. 19, p. 4064-4070.
Van Metre, P.C., and Mahler, B.J., 1999, Town Lake bottom sediments: a chronicle of water quality changes in Austin, Texas, 1960-1998: U.S. Geological Survey Fact Sheet 99-183, 6 p.
Van Metre, P.C., Wilson, J.T., Callender, Edward, and Fuller, C.C., 1998, Similar rates of decrease of persistent, hydrophobic and particle-reactive contaminants in riverine systems: Environmental Science and Technology, v. 32, no. 21, p. 3312-3317.
Van Metre, P.C., Callender, Edward, and Fuller, C.C., 1997, Historical trends in organochlorine compounds in river basins identified using sediment cores from reservoirs: Environmental Science and Technology, v. 31, no. 8, p. 2339-2344.
Van Metre, P.C., and Callender, Edward, 1996, Identifying water-quality trends in the Trinity River, Texas, USA, 1969-1992, using sediment cores from Lake Livingston: Environmental Geology, v. 28, no. 4, p. 190-200.
Van Metre, P.C., Land, L.F., and Braun, C.L., 1996, Water-quality trends using sediment cores from White Rock Lake, Dallas, Texas: U.S. Geological Fact Sheet FS-217-96, 4 p.
Ware, G.W., 1994, The pesticide book (4th ed.): Fresno, Calif., Thomson Publications, 386 p.