trends in concentrations of nitrate and total dissolved solids in
TRANSCRIPT

Science of the Total Environment 452–453 (2013) 125–136
Contents lists available at SciVerse ScienceDirect
Science of the Total Environment
j ourna l homepage: www.e lsev ie r .com/ locate /sc i totenv
Trends in concentrations of nitrate and total dissolved solids in public supply wells ofthe Bunker Hill, Lytle, Rialto, and Colton groundwater subbasins, San BernardinoCounty, California: Influence of legacy land use
Robert Kent ⁎, Matthew K. LandonU.S. Geological Survey California Water Science Center, 4165 Spruance Road, Suite 200, San Diego, CA 95101-0812, USA
H I G H L I G H T S
► Groundwater nitrate and total dissolved solids (TDS) concentrations were evaluated.► NO3 and TDS concentrations generally correlate with the same explanatory variables.► Nitrate and TDS were increasing in about one-third of wells.► Wells with increasing nitrate tended to also be increasing in TDS.► Increasing nitrate concentrations are associated with legacy agricultural land use.
⁎ Corresponding author. Tel.: +1 619 225 6151; fax:E-mail address: [email protected] (R. Kent).
0048-9697/$ – see front matter. Published by Elsevier Bhttp://dx.doi.org/10.1016/j.scitotenv.2013.02.042
a b s t r a c t
a r t i c l e i n f oArticle history:Received 13 November 2012Received in revised form 31 January 2013Accepted 13 February 2013Available online 15 March 2013
Keywords:GroundwaterTrendsNitrateTotal dissolved solidsPublic supply
Concentrations and temporal changes in concentrations of nitrate and total dissolved solids (TDS) in ground-water of the Bunker Hill, Lytle, Rialto, and Colton groundwater subbasins of the Upper Santa Ana ValleyGroundwater Basin were evaluated to identify trends and factors that may be affecting trends. One hundred,thirty-one public-supply wells were selected for analysis based on the availability of data spanning at least11 years between the late 1980s and the 2000s.Forty-one of the 131 wells (31%) had a significant (pb0.10) increase in nitrate and 14 wells (11%) had a signif-icant decrease in nitrate. For TDS, 46 wells (35%) had a significant increase and 8 wells (6%) had a significant de-crease. Slopes for the observed significant trends ranged from−0.44 to 0.91 mg/L/yr for nitrate (as N) and−8 to13 mg/L/yr for TDS.Increasing nitrate trends were associated with greater well depth, higher percentage of agricultural land use,and being closer to the distal end of the flow system. Decreasing nitrate trends were associated with the oc-currence of volatile organic compounds (VOCs); VOC occurrence decreases with increasing depth.The relations of nitrate trends to depth, lateral position, and VOCs imply that increasing nitrate concentra-tions are associated with nitrate loading from historical agricultural land use and that more recent urbanland use is generally associated with lower nitrate concentrations and greater VOC occurrence. IncreasingTDS trends were associated with relatively greater current nitrate concentrations and relatively greateramounts of urban land. Decreasing TDS trends were associated with relatively greater amounts of naturalland use. Trends in TDS concentrations were not related to depth, lateral position, or VOC occurrence,reflecting more complex factors affecting TDS than nitrate in the study area.
Published by Elsevier B.V.
1. Introduction
1.1. Environmental setting
Groundwater is the main source of water supply in the Bunker Hill,Lytle, Rialto, and Colton groundwater subbasins of the Upper Santa AnaValley Groundwater Basin (Duell and Schroeder, 1989; Woolfenden andKadhim, 1997), and it is actively managed to control the concentrations
+1 619 225 6101.
.V.
of nitrate and total dissolved solids (TDS) (Danskin et al., 2006). Manage-ment strategies there include desalting operations, targeted pumping tohydraulically control the movement of high-salinity groundwater, crea-tion of treatment wetlands, and limits on concentrations of nitrogenand TDS in wastewater discharged to the watershed (WildermuthEnvironmental Inc., 2000). High concentrations of nitrate in groundwaterused for water supply are of concern because of the association betweennitrate concentrations greater than the USEPA maximum contaminantlevel (MCL) of 10 mg/L and infant methemoglobinemia (Johnson andKross, 1990; Greer and Shannon, 2005) and the association between cer-tain types of cancer and nitrate concentrations even less than the USEPA

126 R. Kent, M.K. Landon / Science of the Total Environment 452–453 (2013) 125–136
MCL (Neill, 1989; Weyer et al., 2001). Nationwide, fertilizers and septicleachate are the primary sources of nitrate concentrations higher thandrinking water thresholds in groundwater used for public supply(Dubrovsky et al., 2010). All groundwater contains some dissolved solids,and groundwater may be naturally-high in TDS in some settings, such asgeothermal and arid areas of groundwater discharge (Hem, 1992). In ad-dition to natural sources, TDS can enter groundwater by engineered re-charge of water that has been degraded by human use. In the UpperSantaAnaWatershed,mostmunicipalwastewater and agricultural drain-age are returned to the groundwater basins (Santa Ana Regional WaterQuality Control Board, 1994). High concentrations of TDS in groundwaterused for water supply make the water less acceptable to consumers be-cause TDS can cause an objectionable taste or odor (U.S. EnvironmentalProtection Agency, 2006). Therefore, an understanding of the distributionof concentrations of nitrate and TDS and whether these are generally in-creasing, decreasing, or remaining constant over time is of value to waterresource managers.
The Bunker Hill (A and B), Lytle, Rialto, and Colton groundwatersubbasins cover approximately 440 square kilometers (km2), andare located in the northeast corner of the Upper Santa Ana ValleyGroundwater Basin in San Bernardino County, California (Fig. 1). An-nual precipitation ranges from 300 to more than 750 mm within thestudy area drainages, with higher precipitation in the adjacent SanBernardino and San Gabriel Mountains (California Department ofWater Resources, 2004; Danskin et al., 2006). Historical land use inthe study area, starting in the early 1800s, was primarily agriculture,but agricultural land use has been declining since the mid-1940s, andhas been replaced by urban land use (Scott, 1977).
Regionally, groundwater flows from the San Bernardino Mountainfront, where recharge from mountain runoff (both natural andengineered) is focused, and from the Lytle subbasin into the BunkerHill subbasins and, subsequently discharges across the San Jacintofault into the Rialto and Colton subbasins (Duell and Schroeder,1989). Precipitation on the valley floor and urban and agricultural re-turn flows also contribute areally-distributed recharge across thestudy area. Aquifer materials are mostly coarse-grained near themountain front and grade to finer grained sand, silts and clayswhere groundwater exits the study area at focused discharge areasnear the San Jacinto and Rialto-Colton faults (Izbicki et al., 1998;Wildermuth Environmental Inc., 2000; Dawson et al., 2003). Themajor ion composition of groundwater in the study area is dominatedby calcium and bicarbonate, but this composition shifts slightly tohigher percentages of sodium and sulfate as groundwater flowsdowngradient (Izbicki et al., 1998).
Groundwater quality in the Upper Santa Ana Watershed is beingassessed as part of the California StateWater Boards' Groundwater Am-bientMonitoring and Assessment (GAMA, http://www.waterboards.ca.gov/gama/) Priority Basin Project, conducted in cooperation with theU.S. Geological Survey (USGS) (http://ca.water.usgs.gov/gama/; Kentand Belitz, 2009, 2012). The present study, conducted as part of theGAMAPriority Basin Project, examines current concentrations and tem-poral trends for concentrations of nitrate and total dissolved solids(TDS) in 131 public supply wells located in the Bunker Hill, Lytle, Rialto,and Colton groundwater subbasins.
1.2. Previous work
For several decades, the Santa Ana Regional Water Quality ControlBoard (SARWQCB) and the Santa Ana Watershed Project Authority(SAWPA) have recognized that TDS and total inorganic nitrogen(TIN) are the most important water-quality issues in the Santa AnaBasin, and much work has been done to monitor concentrations of
Fig. 1. A. Map showing nitrate concentrations and trends, land-use categories, water level cLytle, Rialto, and Colton subbasins. B. Map showing TDS concentrations and trends, land-usetures of the Bunker Hill, Lytle, Rialto, and Colton subbasins.
these constituents in its water sources (Eccles, 1979; Duell andSchroeder, 1989; Santa Ana Regional Water Quality Control Board,1994; Wildermuth Environmental Inc., 1998, 2000; Hamlin et al.,2002; Kent and Belitz, 2004; Santa Ana River Watermaster, 2010).Monitoring has resulted in a variety of water-quality management strat-egies along with regular public reporting of nitrate and TDS concentra-tions (Wildermuth Environmental Inc., 2000; Santa Ana Regional WaterQuality control Board, 2004; Santa Ana Watershed Project Authority,2009—Chapter 5.2). However, a statistical analysis of changes in concen-trations of TDS and nitrate in individual wells over decadal or longer pe-riods has not been performed to date.
Reviews on methods to perform water-quality trend analysis(Hirsch et al., 1991; Loftis, 1996) reveal that it is necessary to havea working definition of the word “trend.” The term “trend”, as usedhere, refers to a statistically significant change in concentration (de-crease or increase) over time. There are two primary types of trendestimation: step trend hypothesis (measuring differences before andafter a specific time), and monotonic change (without direction re-versal) over time (Hirsch et al., 1991).
Temporal trends of groundwater quality are difficult to assess dueto the long time scales involved with groundwater movement and theresulting changes in quality, although relatively short-term studiesmay be used to monitor the progress of remediation efforts (Ebertset al., 2005). Lindsey and Rupert (2012) performed step-trend analy-ses using the results from decadal-scale sampling of 56 well networksin the United States, supplemented with time-series (monotonicchange) analyses using the results from biennial-scale sampling fora subset of the same networks, and found significant changes (mostlyincreases) in the concentrations of chloride, dissolved solids, and ni-trate in many of the networks at both time scales. Several studieshave compared methods aimed at detecting trends, and have evaluat-ed the ability of these methods to predict future changes in ground-water quality (Stuart et al., 2007; Visser et al., 2009). In the easternSan Joaquin Valley of California, Burow et al. (2007, 2008) used sever-al methods to evaluate temporal trends in groundwater nitrate con-centrations, and concluded that concentrations in the deep part ofthe aquifer system are lower than in the shallower parts, but thatthe deep parts are likely to see increases with time. In a part of theeastern San Joaquin Valley, Landon et al. (2011) determined thattrends in groundwater nitrate concentrations in public-supply wellswere primarily related to land use, stratigraphy, and depth and onlyslightly influenced by oxidation–reduction conditions. WildermuthEnvironmental Inc. (2005, 2008) have assessed nitrate and TDS con-centrations for groundwater in the Upper Santa Ana Watershed, andhave identified where these constituents may be currently increasingor decreasing. For the five groundwater subbasins investigated here,Wildermuth Environmental Inc. found TDS to currently be at higherconcentrations compared to historical ambient conditions in two sub-basins (Bunker Hill A and Colton), at lower concentrations in twosubbasins (Bunker Hill B and Lytle), and at approximately equal con-centrations in one subbasin (Rialto). They found nitrate to currentlybe at higher concentrations in all of these subbasins except for BunkerHill B, where current nitrate concentrations were found to be lowerthan historical ambient conditions. While changes in water qualityover time may be generally assessed by comparing the findings ofthese, and other reports on groundwater quality in the Upper SantaWatershed (Eccles, 1979; Duell and Schroeder, 1989; Hamlin et al.,2002; Kent and Belitz, 2009), to our knowledge, no previous studyhas performed a statistical evaluation of temporal trends in TDS or ni-trate concentrations in wells of the Upper Santa Ana Valley ground-water basin, and attempted to relate these trends to potentialexplanatory factors.
ontours (1997), location and cultural and hydrogeological features of the Bunker Hill,categories, water level contours (1997), location and cultural and hydrogeological fea-


Table 1Summary statistics for wells analyzed for trends in concentrations of nitrate and TDS.
Number of wells analyzed 131
Range Median
Duration of record (years) 13–22 19Number of values for each parameter 4–21 13Start year 1986–1990 1987End year 2001–2008 2005
128 R. Kent, M.K. Landon / Science of the Total Environment 452–453 (2013) 125–136
The Bunker Hill, Lytle, Rialto, and Colton groundwater subbasinsare part of a critical aquifer system of great importance for a growingurban population, and they have been studied extensively(Woolfenden and Kadhim, 1997; Woolfenden and Koczot, 2001;Danskin et al., 2006). This area has nearly 300 public-supply wellsthat have been sampled for groundwater quality by the USGS andthe California Department of Public Health (CDPH) over approxi-mately two decades. This study identifies an approach for assessingtrends in groundwater quality making use of historical data and ac-counting for driving forces, including the sampling position (well lo-cation) in the flow system.
2. Methods
2.1. Selection of wells and data
Wells in the study area were selected based on the availability of>10 years of data in which at least one sample was collected be-tween 1986 and 1990, and at least one sample was collected between2001 and 2008. In addition, at least four analyses for each well arenecessary to attain a p-value less than 0.1 for the Mann–Kendalltest (see below); thus, a minimum of 4 data points was necessaryfor a well to be selected for the study. The study uses groundwaterquality data for public supply wells from sampling for regulatorycompliance made available to the GAMA program by the CDPHalong with data from the USGS National Water Information Systemdatabase including GAMA data. It should be noted that using dataon groundwater from public supply wells may introduce a biastoward water suitable for drinking since wells that produce non-potable water are removed from a public supply system. The predom-inant source of data for most wells was from the CDPH, supplementedwith USGS data. For a few wells the predominant source of data wasthe USGS. Comparability of data from the CDPH and the USGS wasverified by statistically testing the differences and relative standarddeviations (standard deviation of the two measured concentrationsdivided by their means) between nitrate and TDS results reportedby the CDPH and the USGS for the same wells. Wilcoxon signed-rank tests were performed on 66 matched pairs of samples collectedby each agency for both nitrate and TDS. Samples in each pair werecollected at the same well within 2 months of each other and the66 pairs ranged in date from 1989 to 2007 (nearly the entire studyperiod). No statistical difference between CDPH and USGS datawas found (α=0.1) for either nitrate or TDS by the Wilcoxonsigned-rank tests, suggesting that nitrate and TDS data from thetwo agencies are comparable. The mean relative standard deviations(Mueller and Titus, 2005) were b7% for nitrate, and b4% for TDS,suggesting that the variability in results between the two datasources was low.
To test whether seasonal fluctuations in concentrations occur andcould affect the analysis of long-term trends, the months duringwhich samples were collected, were categorized as “wet” (Novemberthru April) and “dry” (May thru October). The categories were basedon normal precipitation data for San Bernardino County and compiledby the National Climatic Data Center, the National Oceanic and Atmo-spheric Administration, and the National Weather Service (http://www.idcide.com/weather/ca/san-bernardino.htm, accessed November2, 2012). A Wilcoxon rank-sum test was used to determine if therewere significant differences between the samples collected during“wet”months from those collected during “dry”months. TheWilcoxonrank sum test is a nonparametric alternative to a two-sample t-test thatis not dependent upon data distribution (Helsel and Hirsch, 2002). Re-sults from theWilcoxon rank-sum test indicated that samples collectedduring “wet” months had significantly lower TDS concentrations thanthose collected during “dry”months suggesting that the annual season-al cycles of precipitation or groundwater pumping affect the measuredTDS concentrations. A significant difference between wet and dry
months was not found for nitrate concentrations. However, data wereoften not available for both wet and dry seasons of a given year. Moredata were available for the dry season than for the wet season. Therefore,samples collected during “wet”monthswere excluded from the analyses.If more than one set of results for nitrate and TDS concentrations wasavailable for a dry season, the median result for each parameter wasused to represent that season. It should be noted that, by excluding re-sults from the wet season, the TDS concentrations reported here are bi-ased slightly high. One-hundred and thirty-one wells met the datarequirements described above, andwere included in the trend analyses.Including wells with as few as 4 measurements fails to satisfy the EUGroundwater Directive recommending at least 8 points for trend analy-sis (Grath et al., 2001). Of the 131 wells evaluated for trends, 27 wellshad fewer than 8 measurements, and the power of the test to detecttrends for those wells was likely less than for the other 104 wells. Thestudy period and number of observationswere variable for thewells in-cluded in the study (Table 1).
2.2. Determination of categories for trends and concentrations
The nonparametric Mann–Kendall trend test (Mann, 1945; Helseland Hirsch, 2002) was used to test for the significance of a Kendall's τcorrelation of nitrate or TDS concentration and time in the 131 wells.The Sen slope estimator (mg/L/yr) was calculated to estimate trendmagnitude (Sen, 1968; Hirsch et al., 1991). For the purpose of thisstudy an attained significance level (p) less than or equal to a thresholdvalue (α) of 0.1was considered statistically significant. Based on the re-sults of the trend test, thewells were categorized as decreasing, increas-ing, or no detected trend with regard to nitrate and TDS. Similarly,current nitrate and TDS concentrations in samples from the wellswere categorized as low, moderate, or high, similar to the characteriza-tion scheme used in assessment reports produced by the GAMA pro-gram (Landon et al., 2010; Kent and Belitz, 2012). High concentrationsare those greater than the drinking water benchmark concentrationfor the constituent: 10 mg/L as N for nitrate, and 500 mg/L for TDS.The benchmark used for nitrate is the USEPA MCL. The benchmark of500 mg/L for TDS is the USEPA secondary maximum contaminantlevel (SMCL) and the lower of two recommended SMCLs used by theCalifornia Department of Public Health (CDPH). The GAMA programuses the upper recommended level used by the CDPH of 1000 mg/L.Moderate concentrations are those greater than half the benchmarkand less than or equal to the benchmark. Low concentrations are at orless than half the benchmark. The current concentrations used in thisstudy are the median of all values measured during the 2000s for eachconstituent.
2.3. Evaluation of well attributes and potential explanatory factors
Current concentrations and the trend categorical groups (decreas-ing, increasing, or no detected trend) for each constituent were testedfor relations with other water-quality parameters and well character-istics. Other water-quality parameters evaluated as potential explan-atory factors included occurrence of volatile organic compounds(VOCs) and perchlorate concentrations. VOCs were evaluated inthree ways as potential explanatory factors: number of VOCs detectedin the most recent available sample, the summed concentrations of

Table 2Concentration and trend categories for nitrate and TDS in study area wells.
Number of wells
Increasing Decreasing No significantchange
Sum
NitrateAll wells 41 14 76 131High >10 mg/L as N 3 1 4 8Moderate >5≤10 mg/L 19 6 23 48Low≤5 mg/L 19 7 49 75
TDSAll wells 46 8 77 131High>500 mg/L 2 0 4 6Moderate >250≤500 mg/L 32 4 52 88Low≤250 mg/L 12 4 21 37
129R. Kent, M.K. Landon / Science of the Total Environment 452–453 (2013) 125–136
detected VOCs in the most recent available sample, and the meanconcentration of the sum of detected VOCs in all available samples.VOC occurrence and concentration data investigated for relationswith nitrate and TDS had some limitations. USGS data on volatile or-ganic compounds (VOCs) were available for only 35 of the 131 wellsevaluated in this study. In contrast to the limited availability of USGSdata, VOC results were available from the California Department ofHealth for all of the wells spanning the study period, but the analyti-cal reporting levels for these data were generally an order of magni-tude greater than those for USGS data. Therefore, the data were notcomparable, making it necessary to perform the three evaluations de-scribed above separately for each of the two data sources.
Well characteristics that were evaluated included well depth, depthto the top of the uppermost perforation, land use surrounding the well,and position of thewell in the regional groundwater flow system.Depthwas hypothesized to be related to water-quality trends because it hascommonly been observed to be related to aquifer geochemistry andcan be a surrogate for groundwater residence time (Appelo andPostma, 1999; McMahon et al., 2008). Well-construction data were de-termined from driller's logs, ancillary records of well owners, or NWIS(Kent and Belitz, 2009).
Groundwater quality has been linked to land use characteristics(U.S. Geological Survey, 1999). Land-use statistics for circleswith a radi-us of 500-m around each well (Johnson and Belitz, 2009) were used toassess the relation of 3 broad categories of land use—urban, agricultural,and natural—to concentrations and trends of nitrate and TDS. Johnsonand Belitz (2009) demonstrated statistically that land use in a 500-mcircle around a well is likely to be predictive of land use in the contrib-uting area of a well, which is inaccurately known due to uncertainties inflow paths. Land use was classified into the three major categories for1992, near the beginning of the study period (Nakagaki et al., 2007),and 2001, near the end of the study period (Homer et al., 2004). The“natural” land use classification included forest and shrub land, aswell as bare land without vegetation.
Nitrate and TDS trends were hypothesized to be related to hori-zontal position in the flow system because groundwater residencetime and flow-path length should generally increase from the proxi-mal to the distal end of the flow system. Recharge also occurs alongthe flow path so that younger water mixes with older water inunconfined and semi-confined zones of the flow system. Normalizedlateral position is a proxy for the horizontal position of a well in theregional groundwater-flow system (Landon et al., 2011). Groundwa-ter flow in the study area primarily flows from the northeastern,northwestern, and southeastern margins of the valley-fill depositsalong the mountain fronts, converging towards the valley center,near where the Santa Ana River crosses the southwestern boundaryof Bunker Hill subbasin and exits the study area (Izbicki et al., 1998;Dawson et al., 2003) (Fig. 1). Groundwater flow at this outlet maybe constrained by the San Jacinto and Rialto-Colton faults at thesouthwestern margins of the Bunker Hill and Colton subbasins, re-spectively. For this study, the normalized lateral position of eachwell in the flow system was quantified in 2 ways: land-surface eleva-tion, and normalized distance to the down-gradient end of the flowsystem. Groundwater in alluviummoves under a natural hydraulic gra-dient that generally conforms to surface topography (Toth, 1963).Therefore, the land-surface elevation of a well typically corresponds toits water level and, consequently, to its horizontal position in the flowsystem. The second measure of lateral position, normalized distanceto the down-gradient end of flow system, was calculated by determin-ing the relative distance remaining for water in the well to exit thestudy area flow system. This normalized distance varies from 0 at thedowngradient or distal end to 1 at the upgradient or proximal end ofthe flow system based on flow paths suggested by Izbicki et al. (1998)and Dawson et al. (2003).
TDS consists of major cations and anions (including nitrate). Anexamination of the changes in the proportions of individual ions in
the groundwater over the study period might suggest processes con-tributing to trends in the concentrations of nitrate and TDS, and maysignal changes in water sources. For each well, changes over the studyperiod were calculated for the cationic charge percentages contribut-ed by calcium, magnesium, sodium, and potassium. This was done foreach well by subtracting the median charge percentage contributedby each cation to the total cationic charge in samples collected inthe 1980s from the median value in samples collected in the 2000s.Changes in the anionic charge percentage values for bicarbonate, car-bonate, sulfate, chloride, fluoride, and nitrate were calculated thesame way. Changes in concentrations of the major ions over thestudy period were also examined.
2.4. Statistical tests used to evaluate potential explanatory factors
Kendall's τ tests were performed to determine whether currentnitrate and TDS concentrations were significantly correlated withthe potential explanatory factors. The potential explanatory factorswere then evaluated for relationships with the wells in the threetrend categories for nitrate and TDS. Kruskal–Wallis rank-sum testswere performed to determine whether or not there were statisticallysignificant differences in potential explanatory factors between cate-gories of wells having increasing trends, decreasing trends, or no de-tectable trends. The Kruskal–Wallis rank-sum test is a nonparametricalternative to a one-way analysis of variance (Helsel and Hirsch,2002). Finally, one-sided Wilcoxon rank-sum tests were performedfor just the wells exhibiting increasing or decreasing temporal trends.For this test, the no-trend groupwas excluded to more specifically de-fine the differences between increasing and decreasing wells. The jus-tification for this one-sided approach is that it cannot be assumed thatthe influence of explanatory factors on the direction and magnitudeof temporal trends will act like a gradient that passes through a neu-tral or “no-trend” outcome. Rather, it seems more likely that the wellsnot exhibiting temporal trends are wells that possess some, as yetunidentified, characteristic that makes the water quality in thosewells less vulnerable to change in either direction.
3. Results
3.1. Current concentrations of nitrate and TDS
High concentrations of nitrate and TDS occur infrequently in thestudy area but moderate concentrations are relatively widespread. Sixpercent (6%) of the wells analyzed for trends had current nitrate con-centrations that were high (>10 mg/L as N), 37% had moderate nitrateconcentrations (>5≤10), and 57% had lownitrate concentrations (≤5)(Table 2). Current TDS concentrations were high (>500 mg/L) in 5% ofthe wells, moderate (>250≤500) in 67%, and low (≤250) in 28%
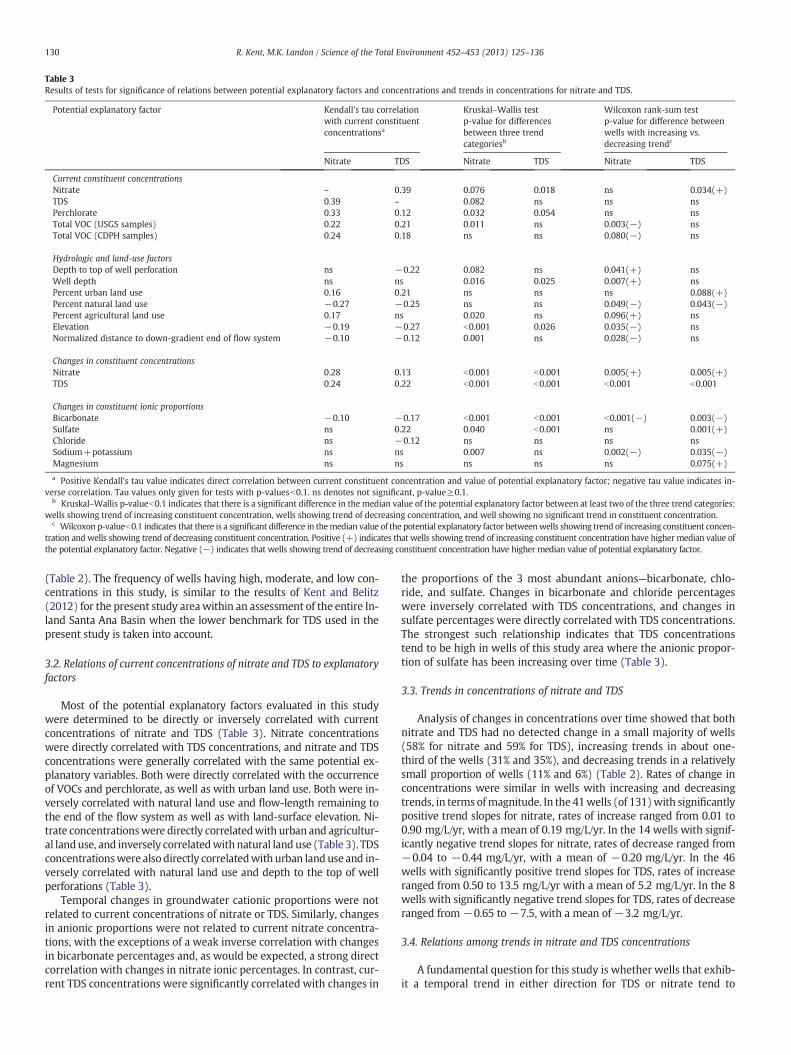
Table 3Results of tests for significance of relations between potential explanatory factors and concentrations and trends in concentrations for nitrate and TDS.
Potential explanatory factor Kendall's tau correlationwith current constituentconcentrationsa
Kruskal–Wallis testp-value for differencesbetween three trendcategoriesb
Wilcoxon rank-sum testp-value for difference betweenwells with increasing vs.decreasing trendc
Nitrate TDS Nitrate TDS Nitrate TDS
Current constituent concentrationsNitrate – 0.39 0.076 0.018 ns 0.034(+)TDS 0.39 – 0.082 ns ns nsPerchlorate 0.33 0.12 0.032 0.054 ns nsTotal VOC (USGS samples) 0.22 0.21 0.011 ns 0.003(−) nsTotal VOC (CDPH samples) 0.24 0.18 ns ns 0.080(−) ns
Hydrologic and land-use factorsDepth to top of well perforation ns −0.22 0.082 ns 0.041(+) nsWell depth ns ns 0.016 0.025 0.007(+) nsPercent urban land use 0.16 0.21 ns ns ns 0.088(+)Percent natural land use −0.27 −0.25 ns ns 0.049(−) 0.043(−)Percent agricultural land use 0.17 ns 0.020 ns 0.096(+) nsElevation −0.19 −0.27 b0.001 0.026 0.035(−) nsNormalized distance to down-gradient end of flow system −0.10 −0.12 0.001 ns 0.028(−) ns
Changes in constituent concentrationsNitrate 0.28 0.13 b0.001 b0.001 0.005(+) 0.005(+)TDS 0.24 0.22 b0.001 b0.001 b0.001 b0.001
Changes in constituent ionic proportionsBicarbonate −0.10 −0.17 b0.001 b0.001 b0.001(−) 0.003(−)Sulfate ns 0.22 0.040 b0.001 ns 0.001(+)Chloride ns −0.12 ns ns ns nsSodium+potassium ns ns 0.007 ns 0.002(−) 0.035(−)Magnesium ns ns ns ns ns 0.075(+)
a Positive Kendall's tau value indicates direct correlation between current constituent concentration and value of potential explanatory factor; negative tau value indicates in-verse correlation. Tau values only given for tests with p-valuesb0.1. ns denotes not significant, p-value≥0.1.
b Kruskal–Wallis p-valueb0.1 indicates that there is a significant difference in the median value of the potential explanatory factor between at least two of the three trend categories:wells showing trend of increasing constituent concentration, wells showing trend of decreasing concentration, and well showing no significant trend in constituent concentration.
c Wilcoxon p-valueb0.1 indicates that there is a significant difference in themedian value of the potential explanatory factor betweenwells showing trend of increasing constituent concen-tration and wells showing trend of decreasing constituent concentration. Positive (+) indicates that wells showing trend of increasing constituent concentration have higher median value ofthe potential explanatory factor. Negative (−) indicates that wells showing trend of decreasing constituent concentration have higher median value of potential explanatory factor.
130 R. Kent, M.K. Landon / Science of the Total Environment 452–453 (2013) 125–136
(Table 2). The frequency of wells having high, moderate, and low con-centrations in this study, is similar to the results of Kent and Belitz(2012) for the present study areawithin an assessment of the entire In-land Santa Ana Basin when the lower benchmark for TDS used in thepresent study is taken into account.
3.2. Relations of current concentrations of nitrate and TDS to explanatoryfactors
Most of the potential explanatory factors evaluated in this studywere determined to be directly or inversely correlated with currentconcentrations of nitrate and TDS (Table 3). Nitrate concentrationswere directly correlated with TDS concentrations, and nitrate and TDSconcentrations were generally correlated with the same potential ex-planatory variables. Both were directly correlated with the occurrenceof VOCs and perchlorate, as well as with urban land use. Both were in-versely correlated with natural land use and flow-length remaining tothe end of the flow system as well as with land-surface elevation. Ni-trate concentrationswere directly correlatedwith urban and agricultur-al landuse, and inversely correlatedwith natural land use (Table 3). TDSconcentrationswere also directly correlatedwith urban land use and in-versely correlated with natural land use and depth to the top of wellperforations (Table 3).
Temporal changes in groundwater cationic proportions were notrelated to current concentrations of nitrate or TDS. Similarly, changesin anionic proportions were not related to current nitrate concentra-tions, with the exceptions of a weak inverse correlation with changesin bicarbonate percentages and, as would be expected, a strong directcorrelation with changes in nitrate ionic percentages. In contrast, cur-rent TDS concentrations were significantly correlated with changes in
the proportions of the 3 most abundant anions—bicarbonate, chlo-ride, and sulfate. Changes in bicarbonate and chloride percentageswere inversely correlated with TDS concentrations, and changes insulfate percentages were directly correlated with TDS concentrations.The strongest such relationship indicates that TDS concentrationstend to be high in wells of this study area where the anionic propor-tion of sulfate has been increasing over time (Table 3).
3.3. Trends in concentrations of nitrate and TDS
Analysis of changes in concentrations over time showed that bothnitrate and TDS had no detected change in a small majority of wells(58% for nitrate and 59% for TDS), increasing trends in about one-third of the wells (31% and 35%), and decreasing trends in a relativelysmall proportion of wells (11% and 6%) (Table 2). Rates of change inconcentrations were similar in wells with increasing and decreasingtrends, in terms ofmagnitude. In the 41wells (of 131)with significantlypositive trend slopes for nitrate, rates of increase ranged from 0.01 to0.90 mg/L/yr, with a mean of 0.19 mg/L/yr. In the 14 wells with signif-icantly negative trend slopes for nitrate, rates of decrease ranged from−0.04 to −0.44 mg/L/yr, with a mean of −0.20 mg/L/yr. In the 46wells with significantly positive trend slopes for TDS, rates of increaseranged from 0.50 to 13.5 mg/L/yr with a mean of 5.2 mg/L/yr. In the 8wells with significantly negative trend slopes for TDS, rates of decreaseranged from −0.65 to −7.5, with a mean of −3.2 mg/L/yr.
3.4. Relations among trends in nitrate and TDS concentrations
A fundamental question for this study is whether wells that exhib-it a temporal trend in either direction for TDS or nitrate tend to

−10
−5
0
5
10
15
−0.6 −0.4 −0.2 0 0.2 0.4 0.6 0.8 1
Tot
al d
isso
lved
sol
ids
tren
d sl
ope,
in m
illig
ram
s pe
r lit
er p
er y
ear
Nitrate trend slope, in milligrams per liter per year
Fig. 2. Graph showing trend slope values for concentrations of nitrate and TDS (mg/L/yr)in the study area. Only wells with a significant trend for nitrate, TDS, or both arerepresented.
131R. Kent, M.K. Landon / Science of the Total Environment 452–453 (2013) 125–136
exhibit the same trend for the other parameter. This generally ap-pears to be the case (Figs. 1A and B, 2). Temporal TDS trends werefound to directly correlate with temporal nitrate trends. Paired TDSand nitrate trend slope values were directly correlated regardless ofwhether slopes that had failed the significance test (p>0.1) were in-cluded in the correlation (Kendall's τ=0.35), excluded from it(Kendall's τ=0.34), or assigned a slope value of zero (Kendall's τ=0.26).
Of the 60 wells with significant increasing trends for either TDS ornitrate, 27 wells had increasing trends for both parameters, and 33wells had increases in either TDS or nitrate, but not both (Fig. 2).In con-trast, only 2 wells decreasing in nitrate were also decreasing in TDS.Moreover, 4 wells with a significant decreasing trend for one parameterhad a significant increasing trend for the other parameter (Fig. 2).
3.5. Spatial patterns for observed trends in nitrate and TDS
Most wells with significant increasing trends for both parameterswere located near the boundary between the Bunker Hill A and Bun-ker Hill B subbasins, north of the Santa Ana River (Fig. 1a and b). Inother parts of the study area, trends, in either direction, were gener-ally observed for only one of the two parameters. Only one well (of11) in the Rialto subbasin had a significant trend, and that well hadincreasing trends for both parameters. In contrast, half of the wells(9 out of 18) in the Lytle subbasin had significant trends, but almostexclusively for TDS; increasing in the northern half, decreasing inthe southern half. Wells located north of the Santa Ana River tendedto be increasing for nitrate, while those located south of the rivertended to be decreasing or exhibiting no trend for nitrate.
3.6. Relations of trends in nitrate and TDS to their current concentrations
Trends in nitrate and TDS were not related to current concentra-tions of nitrate and TDS in most cases, except for an association ofhigher nitrate concentrations with increasing TDS trends. Therewere no significant differences in current TDS concentrations amongwells categorized as having increasing, decreasing, or no detectedtrends for either nitrate or TDS (Table 3). While current nitrate con-centrations were significantly different among wells categorized ashaving increasing, decreasing, or no detected trends for nitrate(Table 3), they were not significantly different between wells with in-creasing nitrate trends and wells with decreasing nitrate trends. Cur-rent nitrate concentrations were significantly different among wells
categorized as having increasing, decreasing, or not detected trendsfor TDS. Specifically, wells with increasing TDS trends had higher cur-rent nitrate concentrations than wells with decreasing TDS trends(Table 3).
3.7. Relations of trends in concentrations of nitrate and TDS to explana-tory factors
Wells with an increasing trend in nitrate concentrations had sig-nificantly greater total depth and depth to the top of perforationsthan did wells with decreasing nitrate trends. Well depth and depthto top of perforations were significantly different among wells cate-gorized as having increasing, decreasing, or no detected trends for ni-trate (Table 3). There was not a significant relationship between TDStrend groups (increasing or decreasing) and well depths (Table 3).
Wells with an increasing trend in nitrate concentrations had sig-nificantly lower VOC concentrations (Table 3) and numbers of VOCsdetected than wells with decreasing nitrate concentrations. In con-trast with nitrate, VOC occurrence did not correlate with trends inTDS concentrations (Table 3).
The results of this study do not indicate clear relations betweenperchlorate concentrations and trends in nitrate and TDS concentra-tions (Table 3). Perchlorate contamination constitutes a groundwater-quality concern that may rival those of nitrate and TDS in the studyarea, particularly in the western part of the study area; the Rialto-Colton subbasin (Woolfenden, 2007).
Natural and agricultural land uses were related to trends in nitrateconcentration in the study area (Table 3). Land use in the study areaas a whole in 1992 (near the beginning of the study period) was45% natural, 8% agricultural, and 47% urban (Nakagaki et al., 2007).The study area has undergone increasing urban land use before, dur-ing, and since the study period, and by 2001 land use was 28% natural,3% agricultural, and 69% urban (Homer et al., 2004). Wells with an in-creasing trend in nitrate concentrations had significantly higher pro-portions of agricultural land use in 1992. Seventy-one percent of thewells located in areas with at least 20% agricultural land use had in-creasing trends for nitrate (Fig. 3A). Wells with increasing trends innitrate or TDS concentrations had significantly lower natural landuse than did wells with decreasing nitrate or TDS trends (Table 3,Fig. 3a and b). Similarly, wells located in areas with higher percent-ages of natural land use were more likely to have decreasing trendsin both nitrate and TDS concentrations than areas with less naturalland use. In contrast, wells located in areas with relatively higherpercentages of urban land use were slightly more likely to have in-creasing trends for TDS concentrations (Table 3). There was not a sig-nificant correlation between urban land use and trends in nitrateconcentrations (Table 3).
Statistically significant relations were identified between positionin the regional groundwater flow system and temporal trends in ni-trate concentrations. Wells with increasing trends for nitrate concen-trations tended to be located at significantly lower elevations and atsignificantly more distal positions in the regional groundwater flowsystem (normalized distance to down-gradient end of flow system)than were wells with decreasing trends for nitrate. No statisticallysignificant relations were identified between either of these measuresof hydrologic position and TDS trends.
There were a number of significant relations between changes inthe proportions of the various major ions and trends in concentra-tions for both nitrate and TDS. Changes in the cationic proportion ofcalcium were directly correlated with trends in nitrate concentra-tions. Changes in proportion for the cations of sodium and potassiumand the anions of bicarbonate, carbonate and fluoride were inverselyrelated to trends in nitrate concentrations (Table 3). Changes in ionicproportions for wells that had significant increasing trends for nitrateconcentrations are shown in a trilinear “Piper” (Piper, 1944) plot(Fig. 4A).

Nat
ural
Urban
Agricultural
100 80 60 40 20 0
0
20
40
60
80
100
100
80
60
40
20
0
Increasing
Decreasing
No trend
Land use > 20% agricultural
A
Nitrate trends by land use (1993)
EXPLANATIONB
TDS trends by land use (1993)
Increasing
Decreasing
No trend
Land use > 20% agricultural
EXPLANATION
Nat
ural
Urban
Agricultural
100 80 60 40 20 0
0
20
40
60
80
100
100
80
60
40
20
0
Fig. 3. A. Trilinear diagram showing nitrate trend direction for groundwater in study area wells by major land-use category, and highlighting wells in areas with greater than 20%agricultural land use. B. Trilinear diagram showing TDS trend direction for groundwater in study area wells by major land-use category, and highlighting wells in areas with greaterthan 20% agricultural land use.
132 R. Kent, M.K. Landon / Science of the Total Environment 452–453 (2013) 125–136
Changes in cationic or anionic proportions were significantly re-lated to trends in TDS concentrations for all major ions except for po-tassium and chloride. The relations were direct for changes in theproportions of calcium, magnesium, and sulfate. The relations were
Percent of milliequivalent per liter
Calcium
100
80
60
40
20
0
0
20
40
60
80
100
Mag
nesi
um
0
20
40
60
80
1
00
Sodium
plus Potassium
Chloride, Fluoride, Nitrite plus Nitrate
0
20
40
60
80
100
100 80
60 40
20 0
Bica
rbon
ate
100
80
60
40
20
0
Sulfate
0
20
40
60
80
1
00
Sulfa
te p
lus
Chl
orid
e
0 20
40 60
80 100
Calcium
plus Magnesium
100
80
60
40
20
0
100 80
60 40
20 0 Pe
rcen
t Percent
Wells with increasing NO3
1980s
2000s
Individualwell
Medianvalue
EXPLANATION
A
Fig. 4. A. Trilinear “Piper” plot of ionic proportions in the 1980s compared to the 2000s for grplot of ionic proportions in the 1980s compared to the 2000s for groundwater in wells wit
inverse for changes in the proportions of sodium and bicarbonate(Table 3). The anionic proportion of sulfate has increased, whilethe proportion of bicarbonate has decreased in wells that had signif-icant increasing trends in TDS concentrations from the 1980s to the
Percent of milliequivalent per liter
Calcium
100
80
60
40
20
0
0
20
40
60
80
100
Mag
nesi
um
0
20
40
60
80
1
00
Sodium
plus Potassium
Chloride, Fluoride, Nitrite plus Nitrate
0
20
40
60
80
100
100 80
60 40
20 0
Bica
rbon
ate
100
80
60
40
20
0
Sulfate
0
20
40
60
80
1
00
Sulfa
te p
lus
Chl
orid
e
0 20
40 60
80 100
Calcium
plus Magnesium
100
80
60
40
20
0
100 80
60 40
20 0 Pe
rcen
t Percent
Wells with increasing TDS
1980s
2000s
Individualwell
Medianvalue
EXPLANATION
B
oundwater in wells with increasing trends in nitrate concentrations. B. Trilinear “Piper”h increasing trends in TDS concentrations.

133R. Kent, M.K. Landon / Science of the Total Environment 452–453 (2013) 125–136
2000s (Fig. 4B). Changes in cationic proportions during this periodwere less notable than anionic changes in the trend wells with in-creasing TDS. The proportions of calcium and magnesium increasedslightly, while the proportion of sodium+potassium decreasedslightly (Fig. 4B).
4. Discussion and conclusions
The pattern of increasing nitrate concentrations through time inrelatively deep and downgradient wells likely reflects the legacy ofhistorical agricultural land use. Wells with increasing trends in nitrateconcentrations had significantly greater total depths and depths tothe top of perforations than wells with decreasing trends in nitrateconcentrations. This finding may seem surprising, since shallowgroundwater is often considered more susceptible to contaminationthan is deep groundwater (Duell and Schroeder, 1989; Nolan et al.,2002; Dubrovsky et al., 2010). Indeed, VOCs occur more at shallowwell depths in the Inland Santa Ana Basin (Belitz et al., 2004) and, na-tionwide, increasing urban land use and shallow well depths wereamong the most important factors associated with VOCs in aquifers(Zogorski et al., 2006). VOCs enter the study area groundwater pri-marily from the most important current sources of recharge: urbanrunoff (Belitz et al., 2004) and engineered recharge (Carter et al.,2008). These more recent sources of recharge to the now-urbanizedBunker Hill, Lytle, Rialto, and Colton groundwater subbasins havelower nitrate concentrations than did historical recharge when theland use was primarily agricultural. Agricultural land use, which cantypically have nitrate nitrogen concentrations greater than 5 mg/L(U.S. Geological Survey, 1999), has been declining in the Santa AnaBasin since the mid-1940s (Scott, 1977), and has been replaced byurban land use. Urban runoff in the Upper Santa Ana Watershed hasnitrate6 nitrogen concentrations of about 1 mg/L (Kent and Belitz,2004). Mountain runoff, which recharges these subbasins bothnaturally and through engineered recharge operations (Danskin etal., 2006), typically has nitrate nitrogen concentrations less than1 mg/L (Kent and Belitz, 2004). Imported water delivered by theMetropolitan Water District is also used for engineered recharge inthe subbasins (Woolfenden and Koczot, 2001; Danskin et al., 2006),and has nitrate nitrogen concentrations of about 1 or 2 mg/L(California State Polytechnic University, Pomona, 2010). By the1990s, relatively few wells in the study area were located nearagricultural activity, but of those few wells, most showed increasingtrends for nitrate concentrations (Fig. 3a).
Increasing nitrate trends were also associated with lateral positionin the study area (measured by each well's elevation and normalizeddistance to down-gradient end of flow system). Wells located a rela-tively short distance along the groundwater flow path were morelikely to have decreasing trends for nitrate, and wells located furtheralong the flow path were more likely to have increasing trends. Basedon tritium and carbon-14 age tracers and distributions of modern an-thropogenic constituents, results of Izbicki et al. (1998, figure 8) andKent and Belitz (2012, figure D3) indicate that groundwater in thedowngradient portions of the flow system predominantly enteredthe flow system as recharge before the decline of agriculture in thestudy area starting in the mid-1940s (Scott, 1977). Available age-tracer data for the specific wells analyzed in this study were insuffi-cient to investigate this directly. Such data only exists for 12 of the131 wells, and it is expected that there would be mixing of ground-water of different ages in the relatively long screens.
It should be noted that, similar to VOC occurrence, well lateral po-sition covaries inversely with well depth, meaning that wells high inthe watershed tend to be shallower than wells on the valley floor.This observation complicates interpreting the apparent relations be-tween nitrate trends and depth (direct) and nitrate trends and lateralposition (inverse). To evaluate whether the relation of nitrate trendsand depth occurred independently of lateral position, wells in the
upgradient or proximal portion of the flow system (with a land sur-face elevation>1400 feet) were excluded. As a group, the 22 exclud-ed wells had relatively shallow depths. The depths of the remaining86 wells with depth data located at elevations below 1400 feet wereevenly distributed over the depth range represented in the studyarea. Almost half (42) of the wells with depth data and located at el-evations below 1400 feet showed temporal trends, either increasingor decreasing, for nitrate concentrations. A Wilcoxon test performedon only those trend-exhibiting wells located at elevations below1400 feet indicated a significant direct relation between well depthand nitrate trend (p=0.007). Therefore, it is concluded that, inde-pendent of lateral position, groundwater in relatively deeper wellsis more likely to have an increasing trend for nitrate concentrationthan groundwater in relatively shallowwells, and groundwater in rel-atively shallow wells is more likely to have a decreasing trend for ni-trate concentration than groundwater in relatively deep wells.
Similar to the observed covariation between lateral position andwell depth, elevation (a proxy for lateral position) also covaries withall 3 land use categories evaluated here. In the study area there is a di-rect correlation between elevation and natural land use (natural landuse is predominant at high elevations), and inverse correlations be-tween elevation and both urban and agricultural land uses. To evaluatewhether the observed significant relations between nitrate trends andagricultural and natural land uses occurred independently of elevation,the same procedure as described above forwell depths and lateral posi-tion was performed for land use and elevation. Results from theWilcoxon tests performed only on wells located at elevations below1400 feet indicated that there is still a significant direct relation be-tween agricultural land use and nitrate trend (p=0.084). However,the inverse relation between natural land use and nitrate trend ob-served when the test was performed on all wells was not found to besignificant for the lower-elevation subset of wells. Therefore, resultsfrom this study cannot definitively separate the effects of elevationfrom those of natural land use on the inverse relation that both poten-tial explanatory factors were determined to have with nitrate trends.
Regardless of the processes involved, the observed relation betweennatural land use and decreasing trends in concentration for both TDSand nitrate suggests that human activities play a role in explaining nitrateand TDS trends. Natural land use serves as a reverse proxy indicator ofhuman (urban and agricultural) land uses, and human land use hasbeen linked to increases in groundwater TDS (Thiros, 2010). Most of thepresent study area with natural land use is steep, hindering both urbanand agricultural development (Belitz et al., 2004). Most of this steep ter-rain has never been under intensive human land use. In contrast, landthat is relatively flat in the study area has been subject to intensivehuman land use; first mostly for agriculture, then, largely converted toresidential and urban use (Scott, 1977; Danskin et al., 2006).
Significant correlations observed between changes in proportionsof the various major ions and trends in TDS concentrations also sug-gest an anthropogenic explanation for increasing TDS. The strongestionic relation was a direct one between sulfate concentrations andproportions (replacing bicarbonate) and increases in TDS. In a LosAngeles groundwater basin study, increases in groundwater sulfateconcentrations were assumed to indicate increased presence of re-charge water imported from the Colorado River (Sloss et al., 1999).Agricultural activities can cause increases in sulfate in groundwaterby application of fertilizers containing sulfur (Jurgens et al., 2008)and/or through mobilization of natural sulfate in soil moisture orminerals in the unsaturated zone by agricultural irrigation returnflows or artificial recharge (Thornton, 1997; Schoups et al., 2006).Engineered recharge facilities are prevalent in the present studyarea. While these mostly use local surface water diversions from theSanta Ana River, Mill Creek, and Lytle Creek for their recharge (SanBernardino Valley Water Conservation District, 2011), importedwater delivered by the Metropolitan Water District is also used forengineered recharge in the subbasins (Danskin et al., 2006; Woolfenden

134 R. Kent, M.K. Landon / Science of the Total Environment 452–453 (2013) 125–136
and Koczot, 2001). However, wells with increasing proportions of sulfatein the present study did not tend to be close to recharge facilities.Where-as recharge facilities tend to be close to the mountain fronts in the studyarea, wells with increasing proportions of sulfate tend to be at lowerelevations and at significantly more distal positions in the regionalgroundwater flow system. There was also a significant direct correlationbetween increasing proportions of sulfate and urban land use (p-valuefor Kendall's τ test=0.02). This finding is consistent with a study onwater sources of streams in the Santa Ana Basin that found that a streamfor which base flow consisted primarily of urban runoff, had the highestsulfate anionic proportion, with the exception of a site receiving geother-mal discharges (Kent and Belitz, 2004).
The lack of correlation between concentrations and increasing ordecreasing trends in nitrate in this study probably reflects that thesource of high nitrate is past rather than current land use. Such lackof correlation is in contrast with the results of Landon et al. (2011)in a portion of the eastern San Joaquin Valley of California thatfound that nitrate concentrations and increasing trends were corre-lated. In the eastern San Joaquin Valley the source of relatively highnitrate concentrations and increasing nitrate concentrations is ongo-ing modern agricultural land use (Burow et al., 2008). In contrast, inthe Bunker Hill, Lytle, Rialto, and Colton subbasins, urban land usewith low nitrate loading has replaced much of the agricultural landuse that was the predominant land use in the first half of the 20thcentury. Wells with increasing nitrate trends in relatively deeperwells predominantly in the downgradient portion of the groundwatersystem may be capturing a larger fraction of agriculturally-rechargedgroundwater, which is mixing with groundwater of different ages andlower initial nitrate concentrations. As a consequence of this mixing inrelatively deep public-supply wells at the downgradient end of theflow system, nitrate concentrations could be increasing over time butwould not necessarily have nitrate concentrations that are higher thannitrate concentrations in other parts of the system. Thus, the lack of cor-relation of nitrate concentrations and nitrate trends is consistent withother evidence described earlier that the effects of legacy agriculturalland use primarily explain nitrate trends in this study area.
The statistically significant direct correlation between nitrate andTDS trend slopes suggests some common explanatory factors for in-creasing trends in both parameters when they were observed(Table 3). In contrast, wells with decreases in nitrate and wells withdecreases in TDS rarely corresponded (Fig. 2), suggesting that differ-ent processes may explain decreases in the two constituents. Thegeneral lack of correlation between TDS trends and most of the po-tential explanatory factors evaluated here suggests that the causesfor TDS trends are more complex than for nitrate trends. TDS is de-rived from a variety of both natural and human sources (Hem,1992). Natural sources of TDS in groundwater are the result of thedissolution of minerals contained in the aquifer rocks and soils.Human-derived sources of TDS in the Bunker Hill and Rialto-Coltongroundwater basins include imported water, urban runoff, and agri-cultural return water (Anning et al., 2007).
It is unlikely that denitrification is significantly affecting nitrateconcentrations in the study area. Previous studies have indicatedthat decreases in nitrate concentrations can occur as a result of deni-trification in some aquifers with geochemically reduced groundwater(Korom, 1992; Tesoriero et al., 2007; McMahon and Chapelle, 2008).However, most groundwater in public supply wells of the UpperSanta Ana Watershed is oxic (dissolved oxygen>0.5 mg/L) (Hamlinet al., 2002; Kent and Belitz, 2012). In laboratory studies, the O2 con-centration threshold required for the onset of denitrification has gen-erally been observed to be b0.3 mg/L (Tiedje, 1988; Seitzinger et al.,2006; Coyne, 2008) but evidence for denitrification has been notedin well samples with O2 of up to 2 mg/L (Böhlke et al., 2002, 2007;Beller et al., 2004; McMahon et al., 2004, 2008; Green et al., 2008)as a consequence of mixing of waters with different age and chemicalcharacteristics (Green et al., 2010). Nevertheless, this study area is
more oxic than that of a recent study in the eastern San Joaquin Valleyof California where, about 80% of the groundwater system is oxic andabout 20% is reducing groundwater. Landon et al. (2011) found thattrends in nitrate concentrations in the eastern San Joaquin Valley studywere primarily controlled by agricultural land use effects and wereonly slightly affected by groundwater oxidation–reduction conditions.
This study, along with that conducted by Landon, et al. (2011)provides a pilot demonstration of trend analysis in a large numberof wells using historical data. It represents a systematic effort to findrelations between observed trends and a wide array of explanatory fac-tors, complementing previous status assessments (Eccles, 1979; Duelland Schroeder, 1989; Santa Ana Regional Water Quality ControlBoard, 1994; Hamlin et al., 2002) and long-term monitoring efforts(Wildermuth Environmental Inc., 1998; 2000; Santa Ana RiverWatermaster, 2010). Results from the present study indicate that it ispossible to identify trends after just over a decade of study if there areenough observations (a minimum of four with methods used here).Trend analyses are better able to discern existing trends with a greaternumber of samples. Most of the wells evaluated for this study continueto bemonitored for nitrate and TDS concentrations, providing anoppor-tunity for periodic trends analysis in the future.
Conflict of interest
All the authors have no conflicts of interest.
Acknowledgments
The authors appreciate the financial support of the California StateWater Resources Control Board, the cooperation of well owners inCalifornia, the efforts of USGS colleagues who participated in the sam-pling program, and the reviewers at the USGS and STOTEN who helpedimprove the paper.
References
Anning DW, Bauch NJ, Gerner SJ, Flynn ME, Hamlin SN, Moore SJ, Schaefer DH,Anderholm SK, Spangler LE. Dissolved solids in basin-fill aquifers and streams inthe southwestern United States. U.S. Geological Survey Scientific Investigations Re-port 2006-5315; 2007 [revised 2010 v. 1.1. 168 pp.].
Appelo CAJ, Postma D. Geochemistry, groundwater, and pollution. Rotterdam, theNetherlands: A.G. Balkema; 1999 [649 pp.].
Belitz K, Hamlin SN, Burton CA, Kent R, Fay RG, Johnson T. Water quality in the Santa AnaBasin, California, 1999–2001. U.S. Geological Survey Circular 1238; 2004 [37 pp.].
Beller HR, Madrid V, Hudson GB, McNab WW, Carlsen T. Biogeochemistry and naturalattenuation of nitrate in groundwater at an explosives test facility. Appl Geochem2004;19:1483–94.
Böhlke JK, Wanty R, Tuttle M, Delin G, Landon M. Denitrification in the recharge areaand discharge area of a transient agricultural nitrate plume in a glacial outwashsand aquifer, Minnesota. Water Resour Res 2002;38(7):1105.
Böhlke JK, O'Connell ME, Prestegaard KL. Ground water stratification and delivery ofnitrate to an incised stream under varying flow conditions. J Environ Qual2007;36(3):664–80.
Burow KR, Dubrovsky NM, Shelton JL. Temporal trends in concentrations of DBCP andnitrate in groundwater in the eastern San Joaquin Valley, California, USA.Hydrogeol J 2007;15:991-1007.
Burow KR, Shelton JL, Dubrovsky NM. Regional nitrate and pesticide trends in ground-water in the Eastern San Joaquin Valley, California. J Environ Qual 2008;37(5_Sup-plement):S-249–63.
California Department ofWater Resources. Upper Santa Ana Valley groundwater basin. Bun-ker Hill subbasin: California's Groundwater Bulletin, 118; 2004 [Accessed October 25,2012 at http://www.water.ca.gov/pubs/groundwater/bulletin_118/basindescriptions/8-2.06.pdf].
California State Polytechnic University, Pomona. 2009 Water Quality Report. AccessedOctober 25, 2012 at http://www.csupomona.edu/~fpm/management/mechanical/waterqualityreport2009.pdf2010.
Carter JM, LaphamWW, Zogorski JS. Occurrence of volatile organic compounds in aqui-fers of the United States. J Am Water Resour Assoc 2008;44(2):399–416.
Coyne MS. Biological denitrification. In: Schepers JS, Raun W, editors. Nitrogen in agri-cultural systems. Madison, WI: Aeron Mongr 49, Am Soc of Agron/Crop Sci Soc ofAm/Soil Sci Soc of Am; 2008. p. 201–53.
Danskin WR, McPherson KR, Woolfenden LR. Hydrology, description of computermodels, and evaluation of selected water-management alternatives in the SanBernardino Area, California. U.S. Geological Survey Open-File Report 2005-1278;2006. [178 pp. and 2 pl].
135R. Kent, M.K. Landon / Science of the Total Environment 452–453 (2013) 125–136
Dawson BJM, Belitz K, Land M, Danskin WR. Stable isotopes and volatile organic com-pounds along seven ground-water flow paths in divergent and convergent flowsystems, Southern California, 2000. U.S. Geological Survey Water-Resources Inves-tigations Report 03-4059; 2003. [79 pp.].
Dubrovsky NM, Burow KR, Clark GM, Gronberg JM, Hamilton PA, Hitt KJ, et al. The qual-ity of our Nation's waters—nutrients in the Nations streams and groundwater,1992–2004. U.S. Geological Survey Circular 1350; 2010. [174 pp.].
Duell LFW, Schroeder RA. Appraisal of ground-water quality in the Bunker Hill Basin ofSan Bernardino Valley, California. U.S. Geological Survey Water-Resources Investi-gations Report 88-4203; 1989. [69 pp.].
Eberts SM, Jones SA, Braun CL, Harvey GJ. Long-term changes in ground water chemis-try at a phytoremediation demonstration site. Ground Water 2005;43(2):178–86.
Eccles LA. Ground-water quality in the Upper Santa Ana River Basin, Southern California.U.S. Geological SurveyWater Resources Investigations Report 79-113; 1979. [51 pp.].
Grath J, Scheidleder A, Uhlig S, Weber K, Kralik M, Keimel T, et al. The EUWater FrameworkDirective: statistical aspects of the identification of groundwater pollution trends, andaggregation of monitoring results. Final Report. Austrian Federal Ministry of Agricultureand Forestry, Environment andWater Management (Ref.: 41.046/01-IV1/00 and GZ 162500/2-1/6/00), European Commission (Grant Agreement Ref.: Subv 99/130794), inkind contributions by project partners. Vienna: European Commission; 2001.
Green CT, Puckett LJ, Böhlke JK, Bekins BA, Phillips SP, Kauffman LJ, et al. Limited occur-rence of denitrification in four shallow aquifers in agricultural areas of the UnitedStates. J Environ Qual 2008;37:994-1009.
Green CT, Böhlke JK, Bekins BA, Phillips SP. Mixing effects on apparent reaction ratesand isotope fractionation during denitrification in a heterogeneous aquifer.Water Resour Res 2010;46:W08525. http://dx.doi.org/10.1029/2009WR008903.
Greer FR, Shannon M. Infant methemoglobinemia: the role of dietary nitrate in foodand water. Pediatrics 2005;116(3):784–6.
Hamlin SN, Belitz K, Kraja S, Dawson BJ. Ground-water quality in the Santa Ana water-shed, California: overview and data summary. U.S. Geological Survey Water-Resources Investigations Report 02-4243; 2002. [137 pp.].
Helsel DR, Hirsch RM. Statistical methods in water resources. U.S. Geological SurveyTechniques of Water-Resources Investigations, bk.4:chap.A3; 2002. [510 pp. Avail-able at: http://water.usgs.gov/pubs/twri/twri4a3/].
Hem D. Study and interpretation of the chemical characteristics of natural water. U.S.Geological Survey Water-Supply Paper, 2254; 1992 [263 pp.].
Hirsch RM, Alexander RB, Smith RA. Selection of methods for the detection and estima-tion of trends in water quality. Water Resour Res 1991;27(5):803–13.
Homer C, Huang C, Yang L, Wylie B, Coan M. Development of a 2001 national landcover database for the United States. Photogramm Eng Remote Sens2004;70(7):829–40.
Izbicki JA, Danskin WR, Mendez GO. Chemistry and isotopic composition of groundwater along a section near the Newmark Area, San Bernardino County, California.U.S. Geological Survey Water-Resources Investigations Report 97-4179; 1998. [27pp.].
Johnson TD, Belitz K. Assigning land use to supply wells for the statistical characteriza-tion of regional groundwater quality: correlating urban land use and VOC occur-rence. J Hydrol 2009;370:100–8.
Johnson CJ, Kross BC. Continuing importance of nitrate contamination of groundwaterand wells in rural areas. Am J Ind Med 1990;18:449–56.
Jurgens BC, Burow KR, Dalgish BA, Shelton JL. Hydrogeology, water chemistry, and fac-tors affecting the transport of contaminants in the zone of contribution of apublic-supply well in Modesto, eastern San Joaquin Valley, California. U.S. Geolog-ical Survey Scientific Investigations Report 2008-5156; 2008. [78 pp.].
Kent R, Belitz K. Concentrations of dissolved solids and nutrients in water sources andselected streams of the Santa Ana Basin, California, October 1998–September 2001.U.S. Geological Survey Water-Resources Investigations Report 03-4326; 2004. [61pp. Available at: http://pubs.usgs.gov/wri/wrir034326/].
Kent R, Belitz K. Ground-water quality data in the Upper Santa Ana Watershed StudyUnit, November 2006 to March 2007: results from the California GAMA Program.U.S. Geological Survey Data Series, 404; 2009 [116 pp. Available at: http://pubs.usgs.gov/ds/404].
Kent R, Belitz K. Status of groundwater quality in the Upper Santa Ana Watershed,November 2006—March 2007: California GAMA Priority Basin project. U.S. Geo-logical Survey Scientific Investigations Report 2012-5052; 2012. [88 pp.].
Korom SF. Natural denitrification in the saturated zone: a review. Water Resour Res1992;28(6):1657–68.
Landon MK, Belitz K, Jurgens BC, Kulongoski JT, Johnson TD. Status and understandingof groundwater quality in the Central Eastside San Joaquin Basin, 2006: CaliforniaGAMA Priority Basin Project. U.S. Geological Survey Scientific Investigations Report2009-5266; 2010. [97 pp.].
Landon MK, Green CT, Belitz K, Singleton MJ, Esser BK. Distribution of reductionoxidation conditions and changes in nitrate concentrations over time in ground-water, Central-Eastside San Joaquin Valley, California. Hydrogeol J 2011;19:1203–24.
Lindsey BD, Rupert MG. Methods for evaluating temporal groundwater quality dataand results of decadal-scale changes in chloride, dissolved solids, and nitrate con-centrations in groundwater in the United States, 1988–2010. U.S. Geological Sur-vey Scientific Investigations Report 2012-5049; 2012. [46 pp.].
Loftis JC. Trends in groundwater quality. Hydrol Process 1996;10:335–55.Mann HB. Nonparametric test against trend. Econometrica 1945;13:245–59.McMahon PB, Chapelle FH. Redox processes and water quality of selected principal
aquifer systems. Ground Water 2008;46(2):259–71.McMahon PB, Böhlke JK, Christenson SC. Geochemistry radiocarbon ages, and
paleorecharge conditions along a transect in the central High Plains aquifer, south-western Kansas, USA. Appl Geochem 2004;19(11):1655–86.
McMahon PB, Böhlke JK, Kauffman LJ, Kipp KL, Landon MK, Crandall CA, et al. Source andtransport control on the movement of nitrate to public supply wells in selected prin-cipal aquifers of the United States. Water Resour Res 2008;44(W04401). [16 pp.].
Mueller DK, Titus CJ. Quality of nutrient data from streams and ground water sampledduring water years 1992–2001. U.S. Geological Survey Scientific Investigations Re-port 2005-5106; 2005. [27 pp.].
Nakagaki N, Price CV, Falcone JA, Hitt KJ, Ruddy BC. Enhanced National Land Cover Data1992 (NLCDe 92). U.S. Geological Survey Raster digital data; 2007 [Available athttp://water.usgs.gov/lookup/getspatial?nlcde92].
Neill M. Nitrate concentrations in river waters in the south-east of Ireland and their re-lationship with agricultural practice. Water Res 1989;23(11):1339–55.
Nolan BT, Hitt KJ, Ruddy BC. Probability of nitrate contamination of recently rechargedgroundwater in the conterminous United States. Environ Sci Technol 2002;36(10):2138–45.
Piper AM. A graphic procedure in the geochemical interpretation of water analyses. AmGeophys Union Trans 1944;25:914–23.
San Bernardino Valley Water Conservation District. Engineering Investigation of theBunker Hill Basin 2010–2011: Groundwater Conditions in the San Bernardino Val-leyWater Conservation District. Accessed October 25, 2012 at http://www.sbvwcd.dst.ca.us/reports-data/bunkerhill/2011EngineeringInvestigation.pdf2011.
Santa Ana Regional Water Quality Control Board. Water Quality Control Plan: Santa AnaRiver basin. Santa Ana Region VIII, Riverside, California; 1994 [variously paged].
Santa Ana Regional Water Quality Control Board. Resolution No. R8-2004-0001, Resolutionamending the water quality control plan for the Santa Ana River Basin to incorporatean updated total dissolved solids (TDS) and nitrogen management plan. AccessedOctober 25, 2012, at http://www.waterboards.ca.gov/rwqcb8/board_decisions/adopted_orders/orders/2004/04_001.pdf2004.
Santa Ana River Watermaster. Thirty-ninth annual report of the Santa Ana RiverWatermaster for water year October 1, 2008–September 30, 2009. 159 pp. AccessedNovember 22, 2010 at http://webserver.sbvmwd.com/imgs/reports/SARWM_2008-09.pdf2010.
Santa Ana Watershed Project Authority. 2009 Santa Ana Integrated Watershed Plan—An Integrated Regional Water Management Plan. Available at http://www.sawpa.org/owow-generalinfo.html2009.
Schoups G, Hopmans JW, Tanji KK. Evaluation of model complexity and space-time res-olution on the prediction of long-term soil salinity dynamics, western San JoaquinValley, California. Hydrol Process 2006;20:2647–68.
Scott MB. Development of water facilities in the Santa Ana River Basin, California,1810–1968. U.S. Geological Survey Open-File Report 77–398; 1977. [247 pp.].
Seitzinger S, Harrison JA, Böhkje JK, Bouwman AF, Lowrance R, Peterson B, et al. Deni-trification across landscapes and waterscapes: a synthesis. Ecol Appl 2006;16(6):2064–90.
Sen PK. Estimates of the regression coefficient based on Kendall's Tau. J Am Stat Assoc1968;63:1379–89.
Sloss EM, McCaffrey DF, Fricker RD, Geschwind SA, Ritz BR. Groundwater Recharge withReclaimed Water: Birth Outcomes in Los Angeles County, 1982–19930-8330-2770-0; 1999 [149 pp.].
Stuart ME, Chilton PJ, Kinniburgh DG, Cooper DM. Screening for long-term trendsin groundwater nitrate monitoring data. Q J Eng Geol Hydrogeol 2007;40:361–76.
Tesoriero AJ, Saad DA, Burow KR, Frick EA, Puckett LJ, Barbash J. Linking ground waterage and chemistry data along flow paths: implications for trends and transforma-tions of nutrients and pesticides. J Contam Hydrol 2007;94:139–55.
Thiros SA. Section 12. Conceptual understanding and groundwater quality of thebasin-fill aquifers in the Santa Ana Basin, California. In: Thiros SA, Bexfield LM,Anning DW, Huntington JM, editors. U.S. Geological Survey Professional Paper,1781. ; 2010. p. 219–65.
Thornton EC. Origin of Increased sulfate in groundwater at the ETF disposal site, Pre-pared for the U.S. Department of Energy under Contract DE-AC06-76RLO 1830,Pacific Northwest National Laboratory Richland, Washington 99352; 1997[Accessed October 25, 2012, at http://www.osti.gov/bridge/servlets/purl/548888-AscOkj/webviewable/548888.pdf].
Tiedje JM. Ecology of denitrification and dissimilatory nitrate reduction to ammonium.In: Zhender AJB, editor. Biology of anaerobic microorganisms. New York: Wiley;1988. p. 179–244.
Toth J. A theoretical analysis of groundwater flow in a small drainage basin. J GeophysRes 1963;68(16):4795–812.
U.S. Environmental Protection Agency. 2006 edition of the drinking water standardsand health advisories, updated August 2006: U.S. Environmental Protection Agen-cy, Office of Water EPA/822/R-06-013; 2006 [Available at http://www.epa.gov/waterscience/criteria/drinking/dwstandards.pdf].
U.S. Geological Survey. The quality of our Nation's waters—nutrients and pesticides.U.S. Geological Survey Circular, 1225; 1999 [82 pp.].
Visser A, Dubus I, Broers HP, Brouyère Korcz M, Orban P, Goderniaux P, et al. Compar-ison of methods for the detection and extrapolation of trends in groundwater qual-ity. J Environ Monit 2009;11:2030–43.
Weyer PJ, Cerhan JR, Kross BC, Hallberg GR, Kantamneni J, Breuer G, et al. Municipaldrinking water nitrate level and cancer risk in older women: The Iowa Women'sHealth Study. Epidemiology 2001;12(3):327–38.
Wildermuth Environmental Inc. Nitrogen losses from recycled water systems, TIN/TDSStudy Phase 2A-Task 1.4. 415 North El Camino Real, Suite A, San Clemente, California92672: Wildermuth Environmental, Inc.; 1998.
Wildermuth Environmental Inc. TIN/TDS study—phase 2A of the Santa Ana watershed,development of groundwater management zones, estimation of historic and cur-rent TDS and nitrogen concentrations in groundwater, final technical memoran-dum, July; 2000.

136 R. Kent, M.K. Landon / Science of the Total Environment 452–453 (2013) 125–136
Wildermuth Environmental Inc. Recomputation of ambient water quality in the Santa AnaRiver Watershed for the period 1984 to 2003, Final Technical Memorandum, Preparedfor BasinMonitoring Program Task Force, November; 2005 [Accessed October 25, 2012at http://www.sawpa.org/documents/roundtable/basinmonitoring/AWQ_2003.pdf].
Wildermuth Environmental Inc. Recomputation of ambient water quality in theSanta Ana River Watershed for the period 1987 to 2006, Final Technical Memo-randum, Prepared for Basin Monitoring Program Task Force, August; 2008[Accessed October 25, 2012 at http://www.sawpa.org/documents/roundtable/basinmonitoring/AWQ_2006.pdf].
Woolfenden LR. Aquifer susceptibility to perchlorate contamination in a highly urban-ized environment, GQ07: securing groundwater quality in urban and industrial en-vironments. Proc. 6th International Groundwater Quality Conference held inFremantle, Western Australia, 2–7 December; 2007.
Woolfenden LR, Kadhim D. Geohydrology and water chemistry in the Rialto-ColtonBasin, San Bernardino County, California. U.S. Geological Survey Water ResourcesInvestigations Report 97-4012; 1997. [101 pp.].
Woolfenden LR, Koczot KM. Numerical simulation of ground-water flow and assess-ment of the effects of artificial recharge in the Rialto-Colton Basin, San BernardinoCounty, California. U.S. Geological Survey Water Resources Investigations Report00-4243; 2001. [148 pp.].
Zogorski JS, Carter JM, Ivahnenko T, Lapham WW, Moran MJ, Rovew BL, et al. Thequality of our Nation's water—volatile organic compounds in the Nation's ground-water and drinking-water supply wells. U.S. Geological Survey Circular, 1292; 2006[101 pp.].