trends in dealmaking, fundraising, and partnerships: the ... · • covers announced total deal...
TRANSCRIPT

Trends in Dealmaking, Fundraising, and Partnerships:The Changing Landscape
May 9, 2018

2
Agenda
• Dealmaking 2017 Year-in-Review
• IPO Trends
• Partnering & Preparing for BIO International
• Q&A

Dealmaking 2017
Year-in-Review
Presented by Richard Harrison
This report contains general information only and is based on the experiences and research of Clarivate Analytics practitioners. Clarivate Analytics is not, by means of this report, rendering business, financial, investment, or other professional advice or services. This report is not a substitute for such professional advice or services, nor should it be used as a basis for any decision or action that may affect your business. Before making any decision or taking any action that may affect your business, you should consult a qualified professional advisor. Clarivate Analytics, its affiliates, and related entities shall not be responsible for any loss sustained by any person who relies on this report.
Disclaimer

5
Overview of all life sciences deals captured by Cortellis in 2017 by percentage
M&A9%
Licenses45%
Asset purchases
4%
Funding19%
Commercial12%
Other10%
Service1%
Total Volume
M&A67%
Licenses20%
Asset Purchases
9%
Total Announced Dollars
4234Total transactions
announced in 2017
$376 BTotal deal dollars
announced in 2017
• Unless otherwise noted, all dollars throughout presentation are USD and are nominal figures (not corrected for inflation).• Transaction types: M&A = 50-100%acquisitions, mergers, reverse mergers; Licenses = licenses, joint ventures, research
collaborations; Asset Purchases = products and business unit acquisitions; Funding = acquisitions of < 50% equity, grants, loans, other funding types; Commercial = distribution, supply, co-promotion agreements; Service = contract services; Other = royalty buyouts, spin-outs, settlements.
Funding 1.6%; Commercial 1.1%, Service 1.2%, Other 0.1%

6
All life sciences deals in 2017 vs. 2016 by number and total deal size $ billion
M&A, 547 M&A, 449
Licenses1749 Licenses
1680
Asset Purch, 250 Asset Purch,
197
Funding866 Funding
889
Commercial514 Commercial
544
Other, 404Other, 435
Service39 Service
40
0
500
1000
1500
2000
2500
3000
3500
4000
4500
5000
2016 2017
Volume
M&A$228
M&A$254
Licenses$88
Licenses$76
Asset Purch, $23
Asset Purch, $32**
**
$0
$50
$100
$150
$200
$250
$300
$350
$400
2016 2017
Announced $ billion
42344369
$376 B
$354 B
** Funding $7.3 (2016), $6.0 (2017); Commercial $4.8, $4.2; Service $0.5, $0.3; Other (royalty buy-out, spin-out, settlement) $2.4, $4.4.
2017 Dealmaking
Year-in-Review
Mergers and Acquisitions (M&A)
8
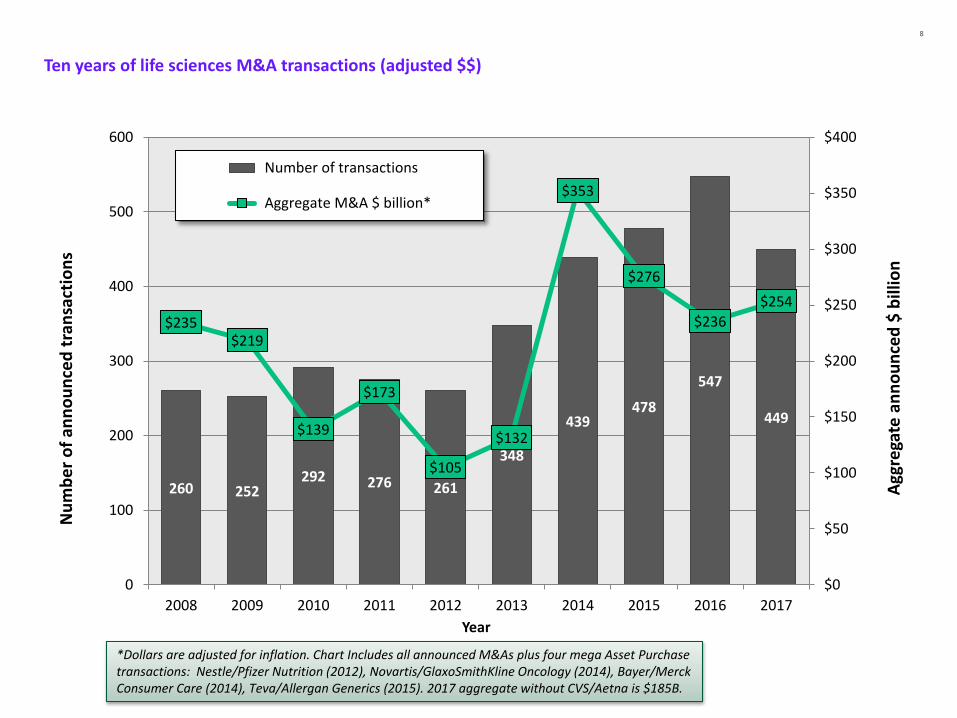
Ten years of life sciences M&A transactions (adjusted $$)
260 252292 276 261
348
439478
547
449
$235$219
$139
$173
$105
$132
$353
$276
$236
$254
$0
$50
$100
$150
$200
$250
$300
$350
$400
0
100
200
300
400
500
600
2008 2009 2010 2011 2012 2013 2014 2015 2016 2017
Agg
rega
te a
nn
ou
nce
d $
bill
ion
Nu
mb
er
of
ann
ou
nce
d t
ran
sact
ion
s
Year
Number of transactions
Aggregate M&A $ billion*
*Dollars are adjusted for inflation. Chart Includes all announced M&As plus four mega Asset Purchase transactions: Nestle/Pfizer Nutrition (2012), Novartis/GlaxoSmithKline Oncology (2014), Bayer/Merck Consumer Care (2014), Teva/Allergan Generics (2015). 2017 aggregate without CVS/Aetna is $185B.
9
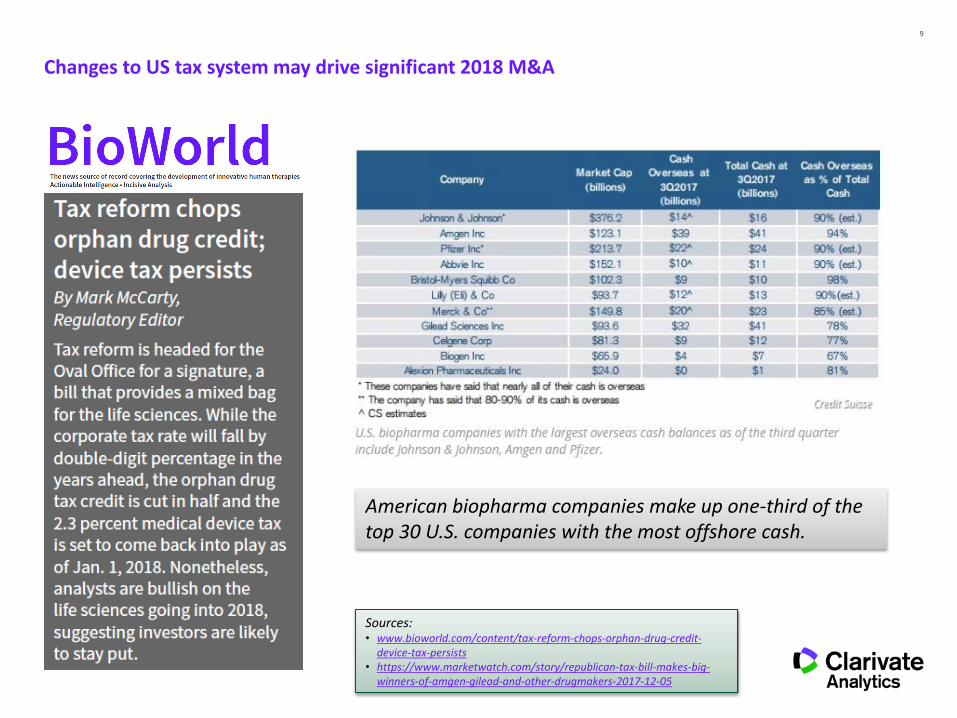
Changes to US tax system may drive significant 2018 M&A
Sources:• www.bioworld.com/content/tax-reform-chops-orphan-drug-credit-
device-tax-persists• https://www.marketwatch.com/story/republican-tax-bill-makes-big-
winners-of-amgen-gilead-and-other-drugmakers-2017-12-05
American biopharma companies make up one-third of the top 30 U.S. companies with the most offshore cash.

10
$2.0
$2.1
$2.3
$2.3
$2.5
$2.8
$3.9
$4.3
$4.6
$4.9
$5.0
$5.2
$6.5
$7.2
$9.1
$11.9
$16.6
$24.2
$30.2
$69.0
$0 $10 $20 $30 $40 $50 $60 $70
Deal size ($ billion)
Top twenty M&As of 2017 by total size
Pharmacies/Insurance
Therapeutics
Medical devices
Nutrition
Therapeutics
Animal health
Services
Medical devices
Therapeutics
Services
Medical devices
Services
Therapeutics
Medical diagnostics
Healthcare data
Medical devices
Therapeutics
Nutrition
Medical devices
Services
Sector
Future milestones
Total at closure $ billion
KEY:
Pending closure
CVS Caremark/Aetna
Johnson & Johnson/Actelion
Reckitt Benckiser/Mead Johnson & Co
Gilead Sciences/Kite Pharma
Thermo Fisher Scientific/Patheon
Avantor Performance Materials/VWR International
Takeda/ARIAD
Pamplona Capital Management/PAREXEL
Unitedhealth Group/DaVita
I N C Research/Inventiv Health Clinical
Fresenius/Akorn
Novartis/Advanced Accelerator Applications
Internet Brands/Webmd Health Corp
Allergan/ZELTIQ Aesthetics
Bristol-Myers Squibb/IFM Therapeutics ($300 M upfront + $2.12 B milestones)
Nestle Health Science/Atrium Innovations
Royal Philips Electronics/The Spectranetics
Fresenius America/NxStage Medical
BD Technologies/CR Bard
M&M Mars/Vca Antech
11
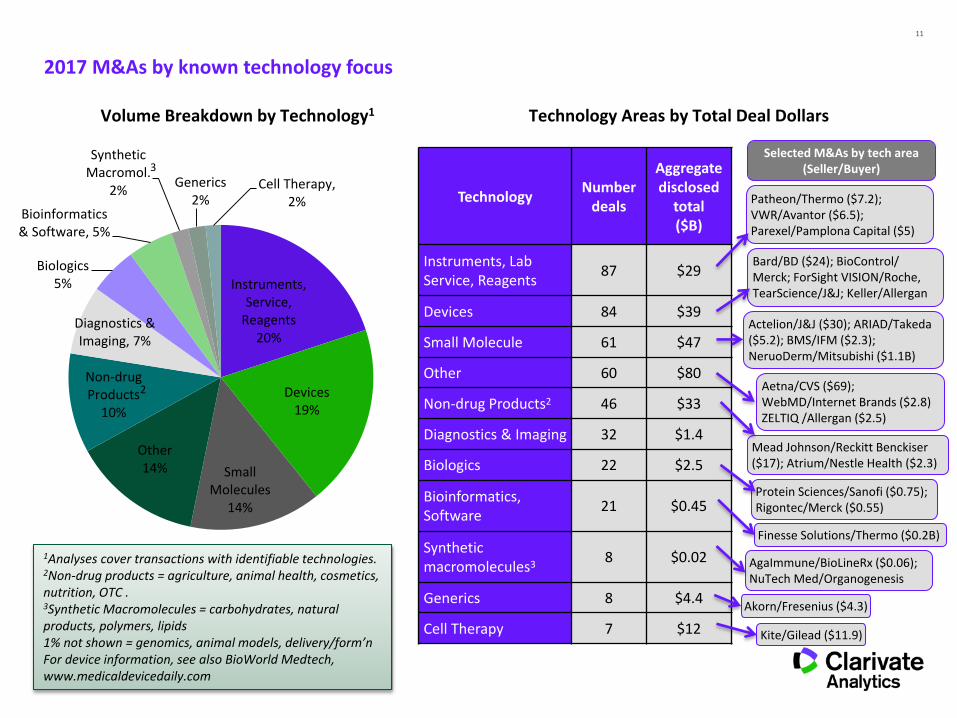
2017 M&As by known technology focus
Volume Breakdown by Technology1 Technology Areas by Total Deal Dollars
Instruments, Service,
Reagents20%
Devices19%
Small Molecules
14%
Other14%
Non-drug Products
10%
Diagnostics & Imaging, 7%
Biologics5%
Bioinformatics & Software, 5%
Synthetic Macromol.
2%Generics
2%Cell Therapy,
2% TechnologyNumber
deals
Aggregatedisclosed
total($B)
Instruments, Lab Service, Reagents
87 $29
Devices 84 $39
Small Molecule 61 $47
Other 60 $80
Non-drug Products2 46 $33
Diagnostics & Imaging 32 $1.4
Biologics 22 $2.5
Bioinformatics, Software
21 $0.45
Syntheticmacromolecules3
8 $0.02
Generics 8 $4.4
Cell Therapy 7 $12
Patheon/Thermo ($7.2);VWR/Avantor ($6.5);Parexel/Pamplona Capital ($5)
Bard/BD ($24); BioControl/ Merck; ForSight VISION/Roche, TearScience/J&J; Keller/Allergan
Aetna/CVS ($69); WebMD/Internet Brands ($2.8) ZELTIQ /Allergan ($2.5)
Actelion/J&J ($30); ARIAD/Takeda ($5.2); BMS/IFM ($2.3); NeruoDerm/Mitsubishi ($1.1B)
Mead Johnson/Reckitt Benckiser ($17); Atrium/Nestle Health ($2.3)
Protein Sciences/Sanofi ($0.75); Rigontec/Merck ($0.55)
Akorn/Fresenius ($4.3)
Kite/Gilead ($11.9)
2
AgaImmune/BioLineRx ($0.06); NuTech Med/Organogenesis
Selected M&As by tech area (Seller/Buyer)
Finesse Solutions/Thermo ($0.2B)
3
1Analyses cover transactions with identifiable technologies.2Non-drug products = agriculture, animal health, cosmetics, nutrition, OTC .3Synthetic Macromolecules = carbohydrates, natural products, polymers, lipids1% not shown = genomics, animal models, delivery/form’nFor device information, see also BioWorld Medtech, www.medicaldevicedaily.com

12
0
10
20
30
40
50
60
Pe
rce
nt
bre
akd
ow
n o
f M
&A
s b
y TA 2016 2017
2016 vs. 2017 M&As by known therapeutic focus
Not shown:
TAs for which there
were ≤5 M&As
announced in 2017:
• Hematology
• Gastroenterology
• Toxicity
• Respiratory
• Endo/Met
Analysis covers M&A transactions with an identifiable core therapeutic focus.
Volume Breakdown by Rx Area 2016 vs. 2017

13
Drug pipeline by therapy area and development stage
Oncology
Immune/ Inflam
Neurology
InfectionGastro-intestinal
Endocrine/ Metabolic
Respiratory
Hematologic
Genito-urinary
Cardio
Derm
Musculo-skeletal
Ophthalm Tox/Intox
Drug pipeline by TA and highest development stageDrug pipeline breakdown by TA
0% 20% 40% 60% 80% 100%
Toxicity/Intox
Ophthalm
Musculoskeletal
Dermatologic
Cardiovascular
Genitourinary
Hematologic
Respiratory
Endo/Metabolic
Gastrointestinal
Infection
Neurology
Immune/Inflam
Oncology
Discovery Phase 1 Phase 2 Phase 3 Launched
Data extracted from Cortellis for Competitive Intelligence and cover all development programs captured as of Dec 31, 2017.

2017 Dealmaking
Year-in-Review
Licenses, Joint Ventures, and Research Collaborations
15
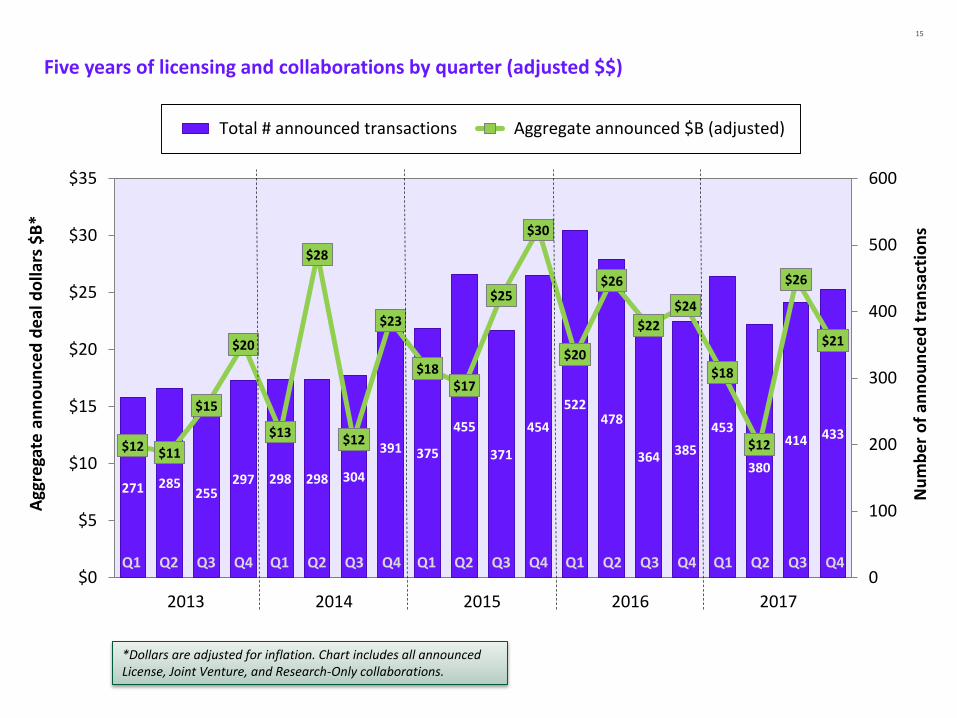
Five years of licensing and collaborations by quarter (adjusted $$)
271 285255
297 298 298 304
391 375
455
371
454
522478
364 385
453
380
414 433$12 $11
$15
$20
$13
$28
$12
$23
$18$17
$25
$30
$20
$26
$22
$24
$18
$12
$26
$21
$0
$5
$10
$15
$20
$25
$30
$35
0
100
200
300
400
500
600
Agg
rega
te a
nn
ou
nce
d d
eal
do
llars
$B
*
Nu
mb
er
of
ann
ou
nce
d t
ran
sact
ion
s
Total # announced transactions Aggregate announced $B (adjusted)
2013 2014 2015 2016 2017
Q1 Q2 Q3 Q4Q1 Q2 Q3 Q4Q1 Q2 Q3 Q4Q1 Q2 Q3 Q4Q1 Q2 Q3 Q4
*Dollars are adjusted for inflation. Chart includes all announced License, Joint Venture, and Research-Only collaborations.
16
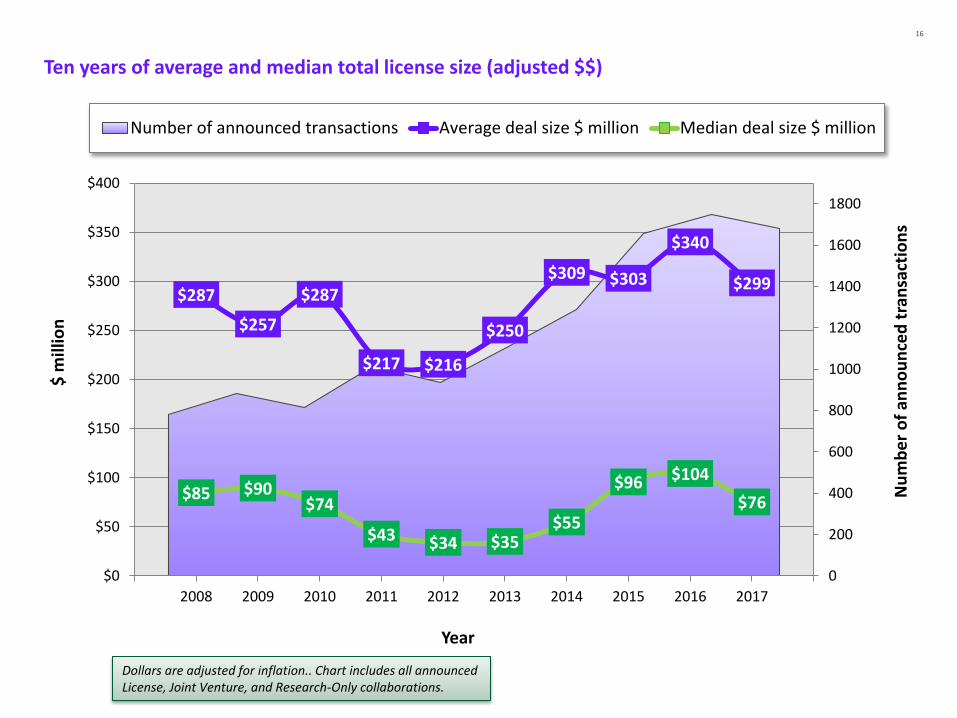
Ten years of average and median total license size (adjusted $$)
$287
$257
$287
$217 $216
$250
$309 $303
$340
$299
$85 $90$74
$43 $34 $35$55
$96 $104
$76
0
200
400
600
800
1000
1200
1400
1600
1800
$0
$50
$100
$150
$200
$250
$300
$350
$400
2007 2008 2009 2010 2011 2012 2013 2014 2015 2016 2017 2018
Nu
mb
er
of
ann
ou
nce
d t
ran
sact
ion
s
$ m
illio
n
Year
Number of announced transactions Average deal size $ million Median deal size $ million
Dollars are adjusted for inflation.. Chart includes all announced License, Joint Venture, and Research-Only collaborations.

17
$1 billion-plus licensing transactions of 2017
$30
$66
$90
$1,250
$300
$413
$80
$50
$60
$400
$175
$103
$31
$105
$45
$27
$50
$1,600
$1,000
$1,000
$1,030
$1,066
$1,090
$1,110
$1,150
$1,200
$1,260
$1,393
$1,410
$1,452
$1,465
$1,550
$1,655
$1,803
$1,831
$1,865
$2,145
$2,802
$2,830
$8,500
0 1000 2000 3000 4000 5000 6000 7000 8000
Vir/Visterra
Vir/Alnylam
Amgen/Immatics
Merck KGaA/F-Star Delta
Allergan/Editas
Bayer/PeptiDream
Janssen/PeptiDream
Arrys/AskAt
Biogen/Forward
Biogen/BMS
Celgene/BeiGene
Dermira/Roche
Janssen/Zymeworks
Amgen/CytomX
Bayer/Loxo
Novartis/Ionis/Akcea
Eli Lilly/CureVac
Servier/Pieris
BMS/Halozyme
AstraZeneca/Pieris
Sanofi/Ablynx
Allergan/Assembly
Merck/AstraZeneca
Upfront + equity ($M)
Total deal value ($M)
Oncology /Launched
GI/Discovery
Immune-Inflam/Discovery
Respiratory/Discovery
Oncology/Discovery
Oncology/Discovery
Cardio/Phase 2
Oncology /Phase 2 (upfront undisclosed)
Unspecified/Discovery
Derm/Phase 2
Oncology/Launched
Immune-inflam/Launched
Metabolic, Cardio/Discovery (upfront undisclosed)
Diverse/Discovery (upfront undisclosed)
Ophth/Discovery
Oncology/Discovery
Infection/Discovery (upfront undisclosed)
Infection/Phase 2 (upfront undisclosed)
Neuro/Phase 1
Discovery stage alliances
Total announced deal size $ million
Cancer/Drug delivery
Oncology/Discovery
Oncology /Pre-registration
Oncology/Discovery

18
Ten-year trend in upfront cash license payments (adjusted $$)
$0
$5
$10
$15
$20
$25
$30
$35
$40
$45
$50
25th percentile Median 75th percentile Average
$ m
illio
n*
2008 2009 2010 2011 2012 2013 2014 2015 2016 2017
2017 upfront cash**
25th percentile $3 M
Median $10 M
75th percentile $40 M
Average $35 M
Dollars are adjusted for inflation. Chart includes all announced License, Joint Venture, and Research-Only collaborations that reported an upfront cash payment. **2017 data exclude Merck/AstraZeneca and Biogen/Forward.

19
Top 20 upfront cash payments in 2017 licensing transactions
Rank Licensee Licensor Upfront $M Stage Rx Area
1 Merck & Co AstraZeneca $1,600* Approved Oncology
2 Biogen Forward Pharma $1,250* Approved Autoimm/Inflam
3 Bayer Loxo Oncology $400 Phase 2 Oncology
4 Novartis Ionis $375 Phase 2 Cardiovascular
5 Nanjing Legend Janssen $350 Phase 2 Oncology
6 Biogen Bristol-Myers Squibb $300 Phase 1 Neurology
7 Celgene BeiGene $263 Approved Oncology
8 Merck KGaA Vertex $230 Phase 2 Oncology
9 AbbVie Alector $205 Discovery Neurology
10 Roche Bristol-Myers Squibb $170 Phase 1 Musculoskeletal
11 Incyte MacroGenics $150 Phase 1 Oncology
11 Eli Lilly Nektar $150 Phase 1 Autoimm/Inflam
11 Allergan Lysosomal Therapeutics $150 Discovery Neurology
14 Sanofi AstraZeneca $126 Phase 2 Infection
15 Bristol-Myers Squibb Halozyme $105 Drug delivery Autoimm/Inflam
16 Takeda Oncology TESARO $100 Approved Oncology
17 Allergan Editas Medicine $90 Discovery Ophthalmologic
18 Dermira Roche $80 Phase 2 Dermatologic
19 Jazz ImmunoGen $75 Approved Oncology
20 Pfizer Basilea $72 Discovery Infection
*Calculations on prior slide exclude Merck/AstraZeneca and Biogen/Forward.
20
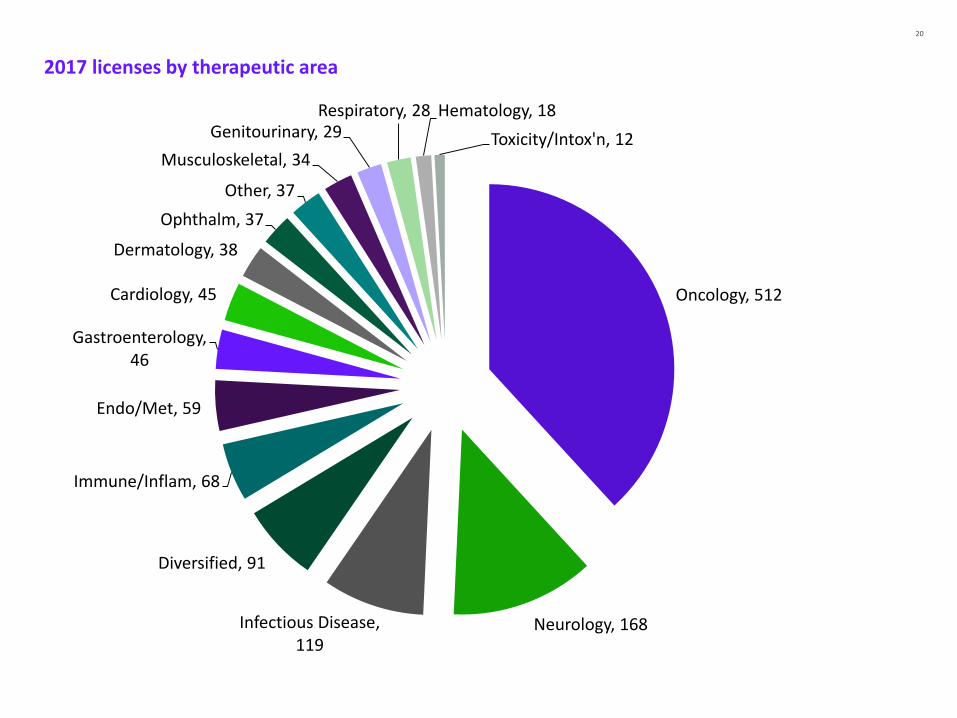
2017 licenses by therapeutic area
Oncology, 512
Neurology, 168Infectious Disease, 119
Diversified, 91
Immune/Inflam, 68
Endo/Met, 59
Gastroenterology, 46
Cardiology, 45
Dermatology, 38
Ophthalm, 37
Other, 37
Musculoskeletal, 34
Genitourinary, 29Respiratory, 28 Hematology, 18
Toxicity/Intox'n, 12

21
2017 license transactions by headquarters of licensor (sellside) party
United States1158
United Kingdom153
Canada108
Japan106
Germany84 China
81
Switzerland; 63
France; 59
Australia; 51
South Korea; 46
Israel; 30Belgium; 29
Denmark; 23
Netherlands; 23
Spain; 23
Sweden; 22
Italy; 18
Ireland; 15
Singapore; 14Finland; 9
India; 9Taiwan; 8Norway; 6
24 other countries < 5 deals each; 40
Other239
By region: North America 1269; Europe 534; Asia 271; Australia/NZ 53; Middle East 32; Central /South America 10; Eastern Europe 7; Africa 2

2017 Dealmaking
Year-in-Review
Top Pharma Dealmakers
23
$0
$10
$20
$30
$40
$50
$60
$70
0
5
10
15
20
25
30
35
40
20
17
to
tal r
eve
nu
es
($ b
illio
n)
Nu
mb
er
of
ann
ou
nce
d t
ran
sact
ion
s
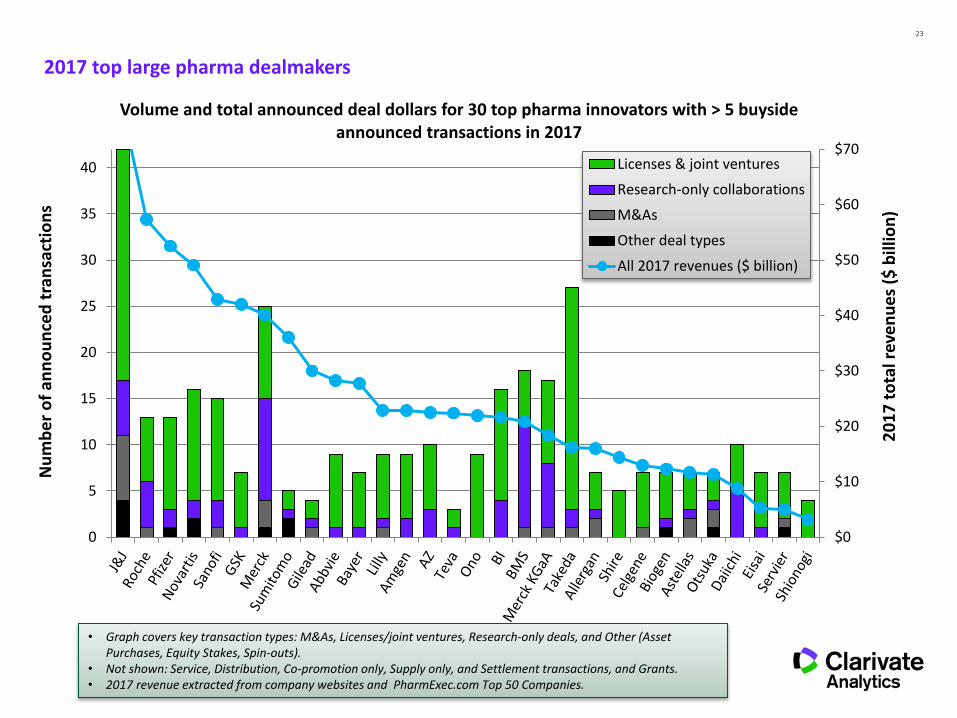
Volume and total announced deal dollars for 30 top pharma innovators with > 5 buyside announced transactions in 2017
Licenses & joint ventures
Research-only collaborations
M&As
Other deal types
All 2017 revenues ($ billion)
2017 top large pharma dealmakers
• Graph covers key transaction types: M&As, Licenses/joint ventures, Research-only deals, and Other (Asset Purchases, Equity Stakes, Spin-outs).
• Not shown: Service, Distribution, Co-promotion only, Supply only, and Settlement transactions, and Grants. • 2017 revenue extracted from company websites and PharmExec.com Top 50 Companies.

24
2017 therapy area focus for top large pharma dealmakers
Oncology
Neuro
Immune/Inflam
Infectious
GI Diversified
Ophthal
Endo/Met
Cardio
Musculoskel
Respiratory
Hematology
Other0
10
20
30
40
50
110
Genitourinary
Volume and total announced deal dollars by therapy area for top pharma dealmakers
• Covers announced total deal size for key transactions types, M&As, Licenses/joint ventures, Research-only deals, and Other (Asset Purchases, Equity Stakes, Spin-outs), with identifiable therapeutic focus areas.
• Not shown: Toxicity, Unknown and Not Applicable therapy areas. • Companies are those among the top 50 pharmaceutical companies who announced 5 or more buyside
transactions in 2017.
Nu
mb
er
of
ann
ou
nce
d t
ran
sact
ion
s w
ith
th
era
py
are
a fo
cus
> $30 billion
$5 - 10 billion
$1 - $5 billion
$0.1 - $0.9 billion
<$100 million or unannounced
Bubble size represents aggregate deal dollars:
Derm
25
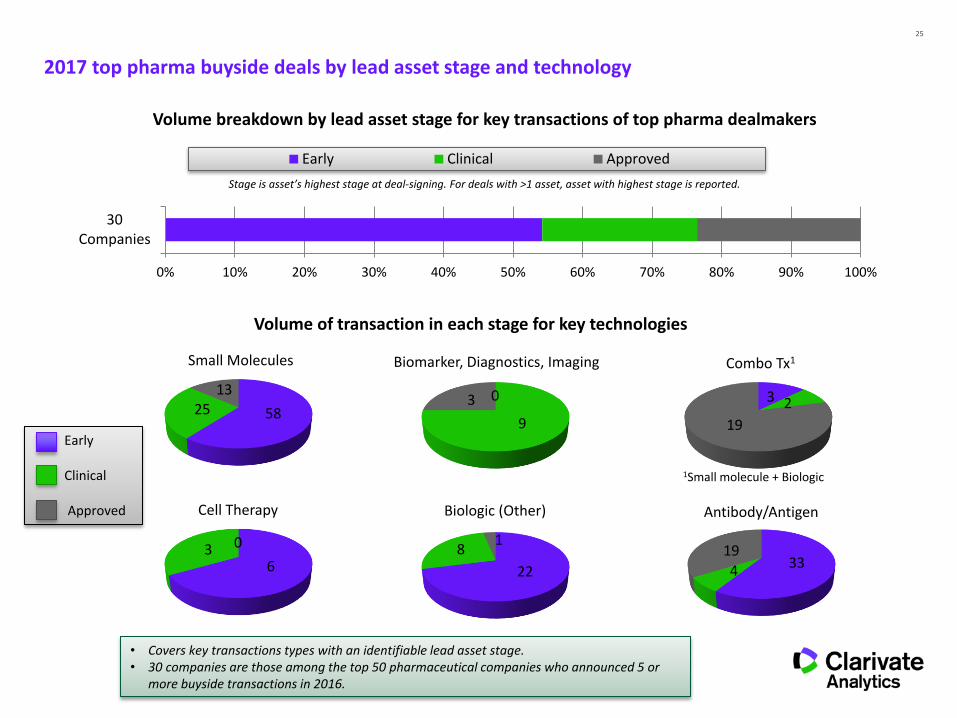
2017 top pharma buyside deals by lead asset stage and technology
0% 10% 20% 30% 40% 50% 60% 70% 80% 90% 100%
30Companies
Volume breakdown by lead asset stage for key transactions of top pharma dealmakers
Early Clinical Approved
• Covers key transactions types with an identifiable lead asset stage.• 30 companies are those among the top 50 pharmaceutical companies who announced 5 or
more buyside transactions in 2016.
582513
Small Molecules
334
19
Antibody/Antigen
22
81
Biologic (Other)
63 0
Cell Therapy
3 2
19
Combo Tx1
0
9
3
Biomarker, Diagnostics, Imaging
Stage is asset’s highest stage at deal-signing. For deals with >1 asset, asset with highest stage is reported.
Volume of transaction in each stage for key technologies
1Small molecule + Biologic
Early
Clinical
Approved
26Contributors
Laura Vitez has over 25 years of experience in the life sciences industry. She has held lead or advisory roles at multiple small biotechs, a mid-sized pharma company, and two consulting firms, bringing in over $2B deal dollars. She holds an MS in biochemistry and a BA in mathematics and chemistry
Lisa Christadore has 5+ years consulting with pharmaceutical clients across R&D, clinical, competitive intelligence, and BD. She has interviewed over 100 physicians, scientists, and investors and works closely with Clarivate’s Deals Intelligence team. She is a medical writer, deals enthusiast, and holds a PhD in Biochemistry with a focus on drug discovery.
Helen Dowden is a strategic intelligence professional with more than 20 years pharmaceutical industry experience. She has a PhD in pharmacology, and is currently working as a Consultant within Clarivate’s Life Sciences Professional Services team. Helen has expertise in oncology deals analysis.
Paul D’Souza has over 11 years as a pharmaceutical industry analyst, maintaining and analysing content on various competitive intelligence databases, including Clarivate Analytics’ Cortellis Deals Intelligence module, to support decision making across the pharmaceutical sector. He currently analyses quarterly trends in pharmaceutical mergers & acquisitions and licensing activity and holds an MBA and a BSc in Pharmacology & Physiology.
Jennifer Berbaum is a drug discovery research scientist with over 15 years of experience in all steps of drug discovery. Jen has delivered projects focused on competitive, clinical, and target intelligence, drug device compatibility, breakthrough therapy designation, and R&D outsourcing feasibility. Jen has technical expertise in Cortellis data export and analysis. She has a PhD in Biological Sciences.
IPO Trends
Presented by Peter Winter

28
IPO trends since 2000
$0
$1,000
$2,000
$3,000
$4,000
$5,000
$6,000
$7,000
$8,000
Biopharma IPO value ($M)
Source: BioWorld
0
10
20
30
40
50
60
70
80
90
Biopharma IPO volume
Source: BioWorld

29
$0
$500
$1,000
$1,500
$2,000
$2,500
$3,000
$3,500
$4,000
$4,500
2008 2009 2010 2011 2012 2013 2014 2015 2016 2017 2018
IPO value by quarter ($M)
1Q
2Q
3Q
4Q
Source: BioWorld

30
0
5
10
15
20
25
30
35
2008 2009 2010 2011 2012 2013 2014 2015 2016 2017 2018
IPO volume by quarter
1Q
2Q
3Q
4Q
Source: BioWorld

31
Notable IPOs 2008-2017


Partnering in 5 Steps
1. Create/update your company’s profile
2. Update your calendar availability
3. Search for potential partners & send tailored meeting requests
4. Actively manage your Message Center
5. BIO will schedule acceptedmeeting requests with mutual availability starting May 14

In & Out-Licensing Intentions (BIO 2018)
Out-Licensing64%
Both
23%
In-Licensing13%
2018 BIO Convention Companies:• Nearly 2/3 are looking
for out-licensing opportunities
• Nearly ¼ are seeking in- and out-licensing

Most Popular Asset Types (BIO 2018)

Most Popular Therapy Areas (BIO 2018)
*Data reflects companies listing a primary or secondary therapeutic area of interest

Investors: Preferred Company Stage (BIO 2018)
2018 BIO Convention Investors slant toward earlier-stage companies
Venture23%
Early stage21%
Growth17%
Seed
16%
Expansion12%
Mezzanine11%
*Investors could designate multiple stages of interest

Investors: Preferred Therapeutic Areas (BIO 2018)

39
Putting It Into Practice

Identifying Target Companies
Segment your search
• Public v. private
• Therapeutic areas of focus
• Last round of funding
• Countries of interest
• In- and out-licensors
• Assets
– Type (cell therapy, protein, small molecule, etc.)
– Development phase
– Clinical indication
– MoA
– Whether asset is partnered
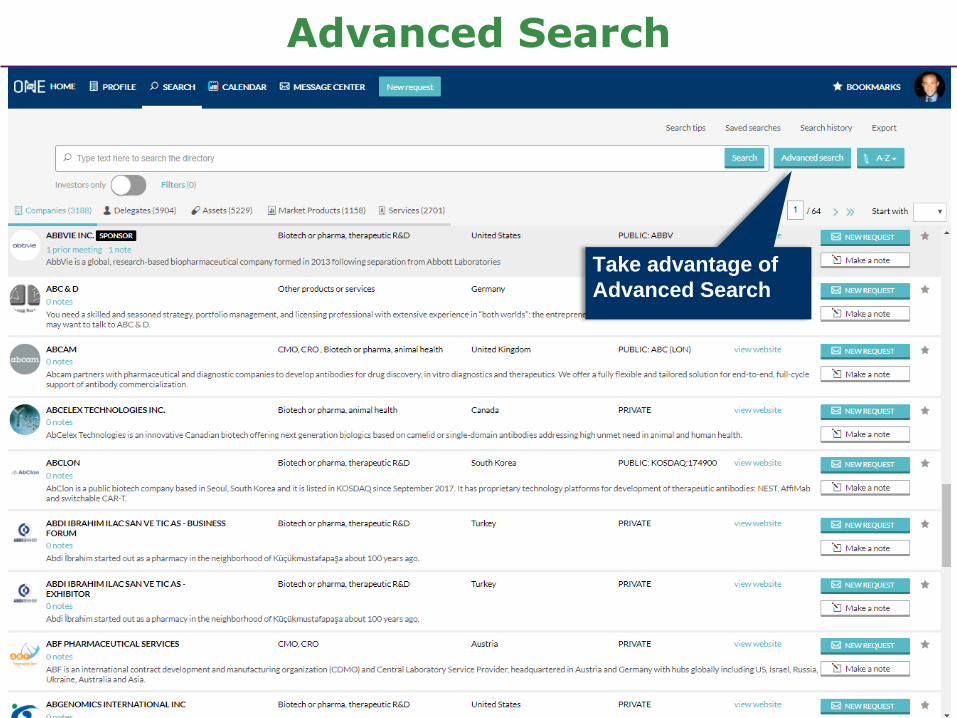
Advanced Search
Take advantage of
Advanced Search

Advanced Search
Combine searches
across tabs
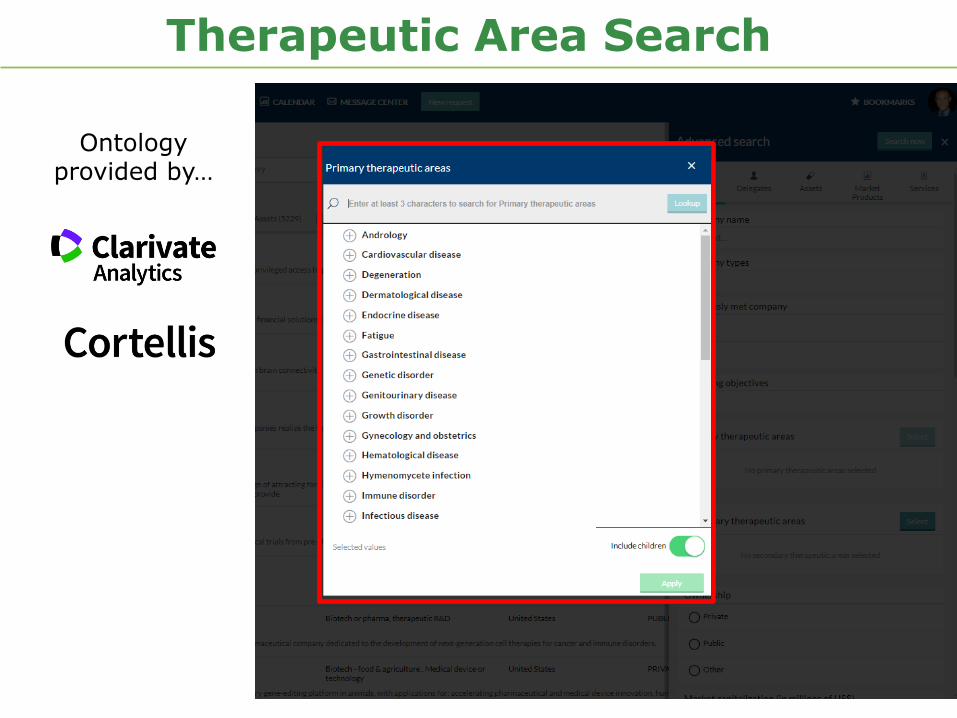
Therapeutic Area Search
Ontology provided by…

Advanced Search
MoA, phase,
technologies,
and more

BIO One-on-One Case StudiesBiotech vs. Biotech. Who secured more meetings?
• Logging in early and checking often for new companies.
• Tailoring the subject of meeting requests.
• Targeting the message body of each meeting request.
• Following up on non-responses (“Requested” meetings) 10 days and 3 days before the Convention.
Participants secured 5X – 7X more meetings by:
Company
Number of
Requests Start Date
Unique
Subject
Lines
Unique
Messages
Scheduled
Meetings
Private Biotech 1 60 4 weeks before 60 60 32
Private Biotech 2 15 1 week before 1 1 6
Public Biotech 1 50 3 weeks before 50 50 35
Public Biotech 2 10 1 week before 2 2 5
5X
7X

Q&A
Thank you!


48
Clarivate Analytics Life Sciences
Clarivate Analytics is the global leader in providing trusted insights and analytics to accelerate the pace of innovation.
Building on a heritage going back more than a century and a half, we have built some of the most trusted brands across the innovation lifecycle, including Web of Science, Cortellis, Derwent, Techstreet, CompuMark, and MarkMonitor.
Today, Clarivate Analytics is a new and independent company on a bold entrepreneurial mission to help our clients radically reduce the time from new ideas to life-changing innovations.
Cortellis Competitive IntelligenceLeading pipeline database for depth and breadth of content
Cortellis Deals IntelligenceRapid insights into critical deal making trends
Cortellis Regulatory IntelligenceMost comprehensive regulatory content and analysis
Cortellis Clinical Trials IntelligenceBroadest source of clinical trials intelligence
MetaCoreProprietary toolbox for discovery of biological pathways
Integrity & Drug Research AdvisorUnique provider of multifaceted drug research content
BioWorld NewsDaily actionable intelligence and incisve analysis