trends in duck breeding populations, 1955-2007 khristi a
TRANSCRIPT

TRENDS IN DUCK BREEDING POPULATIONS, 1955-2007
Khristi A. Wilkins, Mark C. Otto, Guthrie S. Zimmerman, Emily D. Silverman, and Mark D. Koneff
U.S. Fish and Wildlife Service
Division of Migratory Bird Management 11510 American Holly Drive
Laurel, MD 20708-4002
Administrative Report – July 11, 2007
This report summarizes information about the status of duck populations and wetland habitats during spring 2007, focusing on areas encompassed by the U.S. Fish and Wildlife (USFWS) and Canadian Wildlife Services’ (CWS) Waterfowl Breeding Population and Habitat Survey. This report does not include information from surveys conducted by State or Provincial agencies. In the traditional survey area, which includes strata 1-18, 20-50, and 75-77 (Fig. 1), the total duck population estimate (excluding scoters [Melanitta spp.], eiders [Somateria and Polysticta spp.], long-tailed ducks [Clangula hyemalis], mergansers [Mergus and Lophodytes spp.], and wood ducks [Aix sponsa]) was 41.2 ± 0.8 [SE] million birds. This was 14% greater than last year’s estimate of 36.2 ± 0.6 million birds and 24% above the 1955-2006 long-term averagea (Tables 1-12). Mallard (Anas platyrhynchos) abundance was 8.0 ± 0.3 million birds, which was 10% above last year’s estimate of 7.3 ± 0.2 million birds and 7% above the long-term average (Appendix A). Blue-winged teal (A. discors) abundance was 6.7 ± 0.4 million birds. This value was the third highest estimate since 1955, 14% greater than last year’s estimate of 5.9 ± 0.3 million birds, and 48% above the long-term average. Estimated abundances of gadwall (A. strepera; 3.4 ± 0.2 million) and Northern shovelers (A. clypeata; 4.6 ± 0.2 million) were also above those of last year (+19% and +24%, respectively) and well above their long-term averages (+96% and +106%, respectively). Estimated abundance of American wigeon (A. americana; 2.8 ± 0.2 million) was 29% greater than last year but similar to the long-term average. Estimated abundances of green-winged teal (A. crecca; 2.9 ± 0.2 million), redheads (Aythya americana; 1.0 ± 0.08 million), and canvasbacks (A. valisineria; 0.9 ± 0.09 million) were similar to last year’s, but were each >50% above their long-term averages. Abundances of Northern shovelers, redheads, and canvasbacks were the highest ever estimated in this survey area, and the a Populations are considered to have changed from the previous year or long-term average if observed significance value associated with change is ≤ 0.10. Actual p-values are given in tables.

abundance of green-winged teal was the second highest estimated for this region. Estimates for Northern pintails (Anas acuta; 3.3 ± 0.2 million) and scaup (Aythya affinis and A. marila combined; 3.5 ± 0.2 million) were unchanged from those of 2006, and remained below long-term averages (-19% and -33%, respectively). Overall, habitat conditions for breeding waterfowl in 2007 were similar or slightly improved compared to conditions in 2006. The total pond estimate (Prairie Canada and U.S. combined) was 7.0 ± 0.3 million ponds. This was 15% greater than last year’s estimate of 6.1 ± 0.2 million ponds and 44% higher than the long-term average of 4.9 ± 0.03 million ponds. For the third year in a row, habitat conditions were good or excellent in the northern grasslands and parklands of southern Saskatchewan and southern Manitoba. Three years of plentiful precipitation has generally maintained or improved the quality of the wetland and upland vegetation in this region. The 2007 estimate of ponds in Prairie Canada was 5.0 ± 0.3 million. This was a 13% increase from last year’s estimate (4.4 ± 0.2 million), 49% above the 1955-2006 average (3.4 ± 0.03 million), and the fourth highest number of Canadian ponds on record (Table 12; Figure 2). However, some areas of the parklands of southern Saskatchewan experienced severe flooding resulting from record amounts of spring runoff and some nests may have flooded. The southern grasslands of Saskatchewan and Manitoba remained dry, and were in fair to poor condition. Conditions in southern Alberta, which have generally been either fair or poor for much of the last decade, improved for the second consecutive year, largely due to melting of large snowpacks and wet soil conditions. Habitat conditions in U.S. prairies were highly variable, ranging from good to poor. The 2007 pond estimate for the north-central U.S. of 2.0 ± 0.1 million was 19% greater than last year’s estimate (1.6 ± 0.09 million) and 29% above the long-term average (1.5 ± 0.02 million). The drought conditions seen last year in the Eastern Dakotas were improved by abundant fall and winter precipitation, especially in eastern South Dakota. Exceptionally heavy rain events during May helped to improve conditions in eastern Montana and parts of the Dakotas. Unfortunately, the area affected by this rain did not include the high quality duck habitat of the Missouri Coteau region in the Eastern Dakotas. Although this precipitation occurred after many ducks had moved through the survey area, it probably benefited renesting birds and improved vegetation quality in wetlands and uplands, thereby aiding brood survival. Habitat in the bush regions of the traditional survey area (Alaska, Northern Manitoba, Northern Saskatchewan, Western Ontario) was mostly classified as good due to a normal spring ice break-up and generally good water conditions in the beaver ponds, river deltas, and small lakes and ponds that are characteristic of this region. Spring phenology and water levels varied slightly in local areas. For example, spring was slightly late in the Old Crow Flats, slightly early in the Yukon Delta, and slightly drier in the Yukon Flats compared to other regions in Alaska, but habitat conditions were still generally good across the bush region. The exceptions were the somewhat drier conditions in northwest Saskatchewan and central Alberta and the potential for some flooding in northern Saskatchewan and Manitoba.
2

The boreal forests of the eastern survey area were generally in good or excellent condition this spring, except for a few drier patches in Northern Quebec that were in fair condition. Spring arrived early in the James and Hudson Bay Lowlands for the 3rd consecutive year, and habitat conditions were classified as excellent. In eastern and southern Ontario, the winter snowpack was below normal; however, a good frost seal, spring runoff, and spring storms left this region in good condition at the time of the survey. Storms following the survey period produced local flooding of some nesting habitat. Wetland basins in Quebec were adequately charged and spring temperatures were near normal. There was some potential for flooding of nests in Maine and the Maritimes due to heavy rain during mid-May, but this was not as problematic as it had been during the past few years. Newfoundland and Labrador experienced a late spring compared to the last 5 years, with the northernmost part of the survey region in Labrador still frozen in late May. However, this region was still considered in good condition. In 2005, the USFWS and CWS began to integrate several previously-independent waterfowl surveys of eastern North America. Specifically, new analytical methods were used to generate composite estimates from USFWS and CWS survey data, total indicated bird definitions for American black ducks were modified to provide a common index across the surveys, and adjustments were made to the geographic stratification of eastern North America. Additional refinements to analytical methods are incorporated in the estimates presented in this report. For these reasons, population estimates presented in this report for the eastern survey area (that encompasses strata 51-72) are not directly comparable with estimates presented in reports presented prior to 2006. Specifically, composite estimates are presented for only a portion of the eastern survey area and include data only from strata 51, 52, 63, 64, 66, 67, 68, 70, 71, and 72. These strata were chosen for composite estimation because at least one survey (i.e., that is either the CWS or USFWS survey) was conducted for each of these strata for the full period of record of the eastern survey (1990-2007). In cases where the USFWS has traditionally not recorded observations to the species level, estimates are provided only for multiple-species groupings (i.e., scoters, mergansers, goldeneyes, scaup). As soon as possible, we intend to produce species-specific estimates based solely on CWS plot survey data for: surf scoter (Melanitta perspicillata) black scoter (M. nigra), hooded merganser (Lophodytes cucullatus), common merganser (Mergus merganser), red- breasted merganser (M. serrator), common goldeneye (Bucephela clangula), Barrow’s goldeneye (B. islandica), and greater and lesser scaup. Analytical methods applied to eastern survey area data and results will be presented in greater detail in the 2007 Waterfowl Status Report. We anticipate additional refinements to composite estimates for the eastern survey area in the coming years as the USFWS and CWS work toward a final integrated survey design and analytical approach. Population estimates for all species were similar to last year and to the 1990-2006 averages (Table 13; Figures 6-7). The exceptions were American black ducks (Anas rubripes; 539,000 ducks, +16%) and ring-necked ducks (Aythya collaris; 617,000 ducks, +20%), which increased over the 1990-2006 averages.
3

The data in this report were contributed by the following individuals: Alaska, Yukon Territory, and Old Crow Flats (Strata 1-12): E. Mallek and D. Groves Northern Alberta, Northeastern British Columbia, and Northwest Territories (Strata 13-
18, 20, and 77): C. Ferguson and D. Benning d Northern Saskatchewan and Northern Manitoba (Strata 21-24): F. Roetker and P. Yakupzack Southern and Central Alberta (Strata 26-29, 75, and 76): Air E. Huggins and J. Mitchell Ground J. Leafloor a, F. Baldwin a, K. Froggatt b, E. Hofman b, M. Barr c, D. Chambers c,
N. Clements a, C. Downie a, T. Gunderson a, S. Leach a, T. Matthews c, I. McFarlane c, B. Peers c, J. Pierce c, C. Twerdoclib a, and N. Wiebe a
Southern Saskatchewan (Strata 30-35): Air P. Thorpe, T. Lewis, B. Larned, and G. Zimmerman Ground D. Nieman a, K. Dufour a, K. Warner a, A. Williams a, D. Caswell a, M. Schuster a,
G. Ball b, J. Caswell c, P. Rakowski a, B, Bartzen a, L. Brennan c, A. Crosby a, P. Nieman a, D. Paslowski a, L. Sitter a, K. Wilkins, N. Astleford a, M. Gillespie b, C. Meuckon a, D. Routhier a, and D. Walker a
Southern Manitoba (Strata 25 and 36-40): Air B. Larned and G. Zimmerman Ground D. Caswell a, M. Schuster a, G. Ball b, J. Caswell c, P. Rakowski a, N. Astleford a,
M. Gillespie b, C. Meuckon a, D. Routhier a, and D. Walker a Montana and Western Dakotas (Strata 41-44): Air R. Bentley and P. Fasbender Ground P. Garrettson, K. Fleming, and E. Silverman Eastern Dakotas (Strata 45-49): Air J. Solberg and R. Cox d Ground K. Kruse, S. Beauchaine, J. Gleason, M. Grovijahn b, and J. Hoskins Western Ontario and Central Quebec (Strata 50, 68-69): Air J. Wortham, G. Boomer, and D. Fronczak Helicopter D. Holtby b, G. Boomer, and P. Padding Central and Eastern Ontario, Hudson and James Bay Lowlands of Ontario, and Southern
Quebec (Strata 51-54, 56-59): M. Koneff, D. Forsell, and R. Raftovich Maine and Maritimes (Strata 62-67, 70): J. Bidwell and J. Goldsberry d
4

Canadian Wildlife Service helicopter plot survey Quebec: D. Bordage a, C. Lepage a, and S. Orichefsky a Ontario: R. Ross a, D. Fillman a, D. McNicol a, and J. Bionda d New Brunswick and Nova Scotia: B. Pollard a Labrador and Newfoundland: S. Gilliland a Habitat information was provided by U.S. Fish and Wildlife Service and Canadian Wildlife Service biologists. a Canadian Wildlife Service b State, Provincial, or Tribal Conservation Agency c Ducks Unlimited - Canada d Other organization All others – U.S. Fish and Wildlife Service
5

� ���� ���
� ���� ���� ���� ���� ���
� ���� ���� ���
� ���
� ���� ��� � ��� � ��� � ��� � ��
� ��
� ���� ���
� ���� ���
� ���
� ���� ���
� ���� ��� � ���
� ���
� ��� � ���� ���
� ���� ���
� ���
� ���� ��� � ���
� ���
� ���� ���� ��� � ���� ���
� ���� ��� � ��
� ���
� �� ���
� ���
� ��� ��
� ��� �� � ��
� ��
� ��
� ��� ���
� ��� � ���� ���
� ���
� ��
� ���� ���
� �
� ���
� ���� ���
��� ���
� �� �
6

Table 1. Duck breeding population estimates (in thousands) for regions in the traditional survey area.
Change from 2006 Change from LTA
Region 2007 2006 % P LTA a % P
Alaska-Yukon Territory – Old Crow Flats 5,690 4,755 +20 <0.001 3,574 +59 <0.001
C. & N. Alberta – N.E. British Columbia - Northwest Territories 6,137 5,132 +20 0.006 7,114 -14 0.001
N. Saskatchewan- N. Manitoba - W. Ontario 3,197 2,711 +18 0.280 3,541 -10 0.415
S. Alberta 4,293 4,581 -6 0.290 4,289 0 0.983
S. Saskatchewan 11,036 10,096 +9 0.128 7,401 +49 <0.001
S. Manitoba 1,322 1,796 -26 <0.001 1,549 -15 0.001
Montana and Western Dakotas 1,625 1,910 -15 0.036 1,619 0 0.951
Eastern Dakotas 7,857 5,181 +52 <0.001 4,220 +86 <0.001
Total b 41,157 36,160 +14 <0.001 33,307 +24 <0.001
a Long-term average, 1955-2006. b Includes 10 species in Appendix A plus American black duck, ring-necked duck, goldeneyes, bufflehead, and ruddy duck; excludes eiders, long-tailed duck, scoters, mergansers, and wood duck. Table 2. Mallard breeding population estimates (in thousands) for regions in the traditional survey area.
Change from 2006 Change from LTA
Region 2007 2006 % P LTA % P
Alaska-Yukon Territory – Old Crow Flats 581 516 +13 0.364 360 +61 <0.001
C. & N. Alberta – N.E. British Columbia - Northwest Territories 887 558 +59 0.002 1,075 -17 0.025
N. Saskatchewan- N. Manitoba - W. Ontario 588 656 -10 0.538 1,149 -49 <0.001
S. Alberta 830 901 -8 0.364 1,095 -24 <0.001
S. Saskatchewan 2,155 1,832 +18 0.076 2,067 +4 0.567
S. Manitoba 387 511 -24 0.038 381 +2 0.870
Montana and Western Dakotas 553 679 -19 0.124 503 +10 0.413
Eastern Dakotas 2,049 1,624 +26 0.050 861 +138 <0.001
Total 8,032 7,277 +10 0.033 7,491 +7 0.053
7

Table 3. Gadwall breeding population estimates (in thousands) for regions in the traditional survey area.
Change from 2006 Change from LTA
Region 2007 2006 % P LTA % P
Alaska-Yukon Territory – Old Crow Flats 3 2 +71 0.556 2 +71 0.508
C. & N. Alberta – N.E. British Columbia - Northwest Territories 100 135 -26 0.336 49 +106 0.003
N. Saskatchewan- N. Manitoba - W. Ontario 14 16 -16 0.674 27 -50 <0.001
S. Alberta 343 455 -25 0.081 311 +10 0.307
S. Saskatchewan 1,317 1,202 +10 0.580 568 +132 <0.001
S. Manitoba 110 125 -12 0.562 68 +63 0.034
Montana and Western Dakotas 266 216 +23 0.365 194 +37 0.129
Eastern Dakotas 1,201 673 +78 <0.001 494 +143 <0.001
Total 3,355 2,825 +19 0.050 1,714 +96 <0.001 Table 4. American wigeon breeding population estimates (in thousands) for regions in the traditional survey area.
Change from 2006 Change from LTA
Region 2007 2006 % P LTA % P
Alaska-Yukon Territory – Old Crow Flats 1,113 822 +35 0.004 517 +115 <0.001
C. & N. Alberta – N.E. British Columbia - Northwest Territories 843 570 +48 0.050 906 -7 0.579
N. Saskatchewan- N. Manitoba - W. Ontario 139 105 +32 0.314 250 -44 <0.001
S. Alberta 170 189 -10 0.574 294 -42 <0.001
S. Saskatchewan 325 282 +15 0.455 422 -23 0.023
S. Manitoba 9 16 -47 0.063 61 -86 <0.001
Montana and Western Dakotas 121 120 +1 0.965 109 +11 0.598
Eastern Dakotas 83 67 +23 0.462 49 +70 0.047
Total 2,803 2,171 +29 0.001 2,608 +7 0.205
8

Table 5. Green-winged teal breeding population estimates (in thousands) for regions in the traditional survey area.
Change from 2006 Change from LTA
Region 2007 2006 % P LTA % P
Alaska-Yukon Territory – Old Crow Flats 823 780 +5 0.670 366 +125 <0.001
C. & N. Alberta – N.E. British Columbia - Northwest Territories 862 751 +15 0.541 752 +15 0.448
N. Saskatchewan- N. Manitoba - W. Ontario 328 303 +8 0.659 199 +65 0.006
S. Alberta 283 178 +59 0.179 193 +46 0.176
S. Saskatchewan 495 401 +24 0.347 233 +113 0.001
S. Manitoba 33 65 -49 0.007 52 -36 <0.001
Montana and Western Dakotas 44 34 +30 0.356 40 +10 0.650
Eastern Dakotas 43 75 -43 0.192 46 -7 0.810
Total 2,911 2,587 +13 0.199 1,881 +55 <0.001 Table 6. Blue-winged teal breeding population estimates (in thousands) for regions in the traditional survey area.
Change from 2006 Change from LTA
Region 2007 2006 % P LTA % P
Alaska-Yukon Territory – Old Crow Flats 9 0 +- - 1 +588 0.264
C. & N. Alberta – N.E. British Columbia - Northwest Territories 369 316 +17 0.597 271 +36 0.191
N. Saskatchewan- N. Manitoba - W. Ontario 108 82 +32 0.396 262 -59 <0.001
S. Alberta 669 864 -23 0.263 613 +9 0.697
S. Saskatchewan 2,380 2,228 +7 0.652 1,237 +92 <0.001
S. Manitoba 274 426 -36 0.005 383 -28 0.001
Montana and Western Dakotas 277 346 -20 0.235 265 +4 0.790
Eastern Dakotas 2,610 1,598 +63 <0.001 1,494 +75 <0.001
Total 6,694 5,860 +14 0.077 4,527 +48 <0.001
9

Table 7. Northern shoveler breeding population estimates (in thousands) for regions in the traditional survey area.
Change from 2006 Change from LTA
Region 2007 2006 % P LTA % P
Alaska-Yukon Territory – Old Crow Flats 580 409 +42 0.027 269 +115 <0.001
C. & N. Alberta – N.E. British Columbia - Northwest Territories 346 193 +80 0.044 213 +62 0.062
N. Saskatchewan- N. Manitoba - W. Ontario 28 12 +137 0.161 42 -34 0.200
S. Alberta 977 701 +39 0.009 367 +167 <0.001
S. Saskatchewan 1,656 1,612 +3 0.880 666 +149 <0.001
S. Manitoba 116 178 -35 0.007 109 +6 0.569
Montana and Western Dakotas 169 163 +3 0.887 150 +13 0.547
Eastern Dakotas 682 414 +65 0.001 390 +75 <0.001
Total 4,553 3,680 +24 0.011 2,206 +106 <0.001 Table 8. Northern pintail breeding population estimates (in thousands) for regions in the traditional survey area.
Change from 2006 Change from LTA
Region 2007 2006 % P LTA % P
Alaska-Yukon Territory – Old Crow Flats 1,135 1,041 +9 0.473 915 +24 0.018
C. & N. Alberta – N.E. British Columbia - Northwest Territories 234 126 +86 0.056 374 -37 0.006
N. Saskatchewan- N. Manitoba - W. Ontario 5 6 -7 0.899 40 -87 <0.001
S. Alberta 324 611 -47 <0.001 719 -55 <0.001
S. Saskatchewan 960 1,024 -6 0.724 1,214 -21 0.011
S. Manitoba 15 57 -74 <0.001 111 -87 <0.001
Montana and Western Dakotas 118 264 -55 <0.001 269 -56 <0.001
Eastern Dakotas 544 257 +111 <0.001 455 +19 0.187
Total 3,335 3,386 -2 0.841 4,098 -19 <0.001
10

Table 9. Redhead breeding population estimates (in thousands) for regions in the traditional survey area.
Change from 2006 Change from LTA
Region 2007 2006 % P LTA % P
Alaska-Yukon Territory – Old Crow Flats 2 10 -83 0.176 2 +10 0.886
C. & N. Alberta – N.E. British Columbia - Northwest Territories 80 59 +35 0.345 39 +106 0.016
N. Saskatchewan- N. Manitoba - W. Ontario 10 5 +93 0.326 28 -64 <0.001
S. Alberta 179 154 +16 0.571 117 +53 0.051
S. Saskatchewan 414 435 -5 0.831 195 +113 0.001
S. Manitoba 72 102 -30 0.273 72 -1 0.962
Montana and Western Dakotas 6 12 -51 0.249 9 -39 0.260
Eastern Dakotas 247 139 +78 0.013 168 +47 0.021
Total 1,009 916 +10 0.443 630 +60 <0.001 Table 10. Canvasback breeding population estimates (in thousands) for regions in the traditional survey area.
Change from 2006 Change from LTA
Region 2007 2006 % P LTA % P
Alaska-Yukon Territory – Old Crow Flats 92 73 +25 0.615 91 +1 0.980
C. & N. Alberta – N.E. British Columbia - Northwest Territories 139 109 +27 0.487 73 +89 0.048
N. Saskatchewan- N. Manitoba - W. Ontario 34 13 +167 0.109 55 -37 0.123
S. Alberta 127 76 +67 0.141 64 +99 0.039
S. Saskatchewan 324 287 +13 0.642 184 +76 0.029
S. Manitoba 77 87 -12 0.739 57 +37 0.220
Montana and Western Dakotas 17 12 +36 0.503 8 +113 0.069
Eastern Dakotas 54 33 +66 0.141 33 +66 0.090
Total 865 691 +25 0.117 565 +53 0.001
11

Table 11. Scaup (greater and lesser combined) breeding population estimates (in thousands) for regions in the traditional survey area.
Change from 2006 Change from LTA
Region 2007 2006 % P LTA % P
Alaska-Yukon Territory – Old Crow Flats 1,191 884 +35 0.022 914 +30 0.014
C. & N. Alberta – N.E. British Columbia - Northwest Territories 1,261 1,169 +8 0.603 2,599 -51 <0.001
N. Saskatchewan- N. Manitoba - W. Ontario 271 335 -19 0.288 582 -53 <0.001
S. Alberta 182 214 -15 0.538 351 -48 <0.001
S. Saskatchewan 302 391 -23 0.339 416 -27 0.079
S. Manitoba 50 97 -48 0.064 134 -63 <0.001
Montana and Western Dakotas 15 19 -20 0.535 53 -72 <0.001
Eastern Dakotas 179 138 +30 0.256 98 +83 0.003
Total 3,452 3,247 +6 0.424 5,147 -33 <0.001
12

Table 12. Estimated number (in thousands) of May ponds in portions of prairie and parkland Canada and the northcentral U.S.
Change from 2006 Change from LTA
Survey area 2007 2006 % P LTA a % P
Prairie Canada
S. Alberta 1,225 996 +23 0.175 728 +68 0.001
S. Saskatchewan 3,000 2,719 +10 0.318 1,980 +52 <0.001
S. Manitoba 815 735 +11 0.413 674 +21 0.054
Subtotal 5,040 4,450 +13 0.085 3,382 +49 <0.001
Northcentral U.S.
Montana and Western Dakotas 740 615 +20 0.147 531 +39 0.004
Eastern Dakotas 1,223 1,030 +19 0.058 995 +23 0.002
Subtotal 1,963 1,644 +19 0.017 1,525 +29 <0.001
Grand total 7,003 6,094 +15 0.014 4,869 +44 <0.001
aLong-term average. Prairie and parkland Canada, 1961-2006; northcentral U.S. and Grand total, 1974-2006.
0.0
1.0
2.0
3.0
4.0
5.0
6.0
7.0
8.0
9.0
10.0
1960 1965 1970 1975 1980 1985 1990 1995 2000 2005
Milli
ons
Figure 2. Number of ponds in May and 90% confidence intervals in prairie Canada and the northcentral U.S.
13
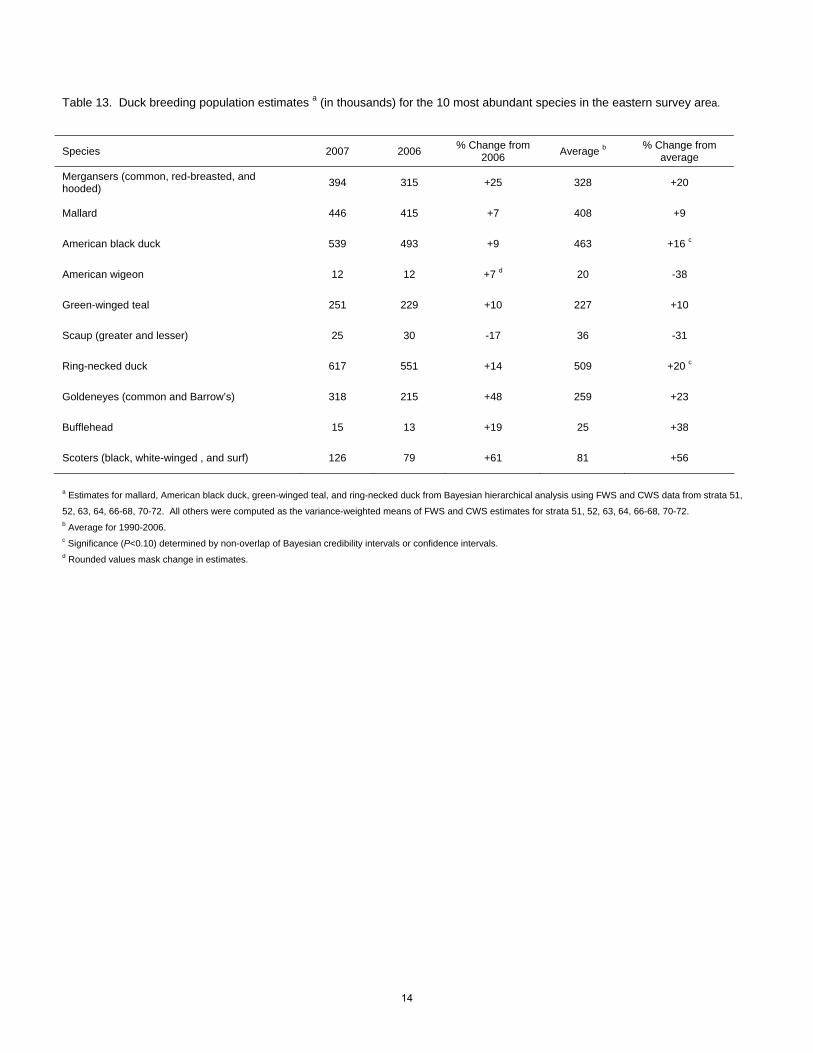
Table 13. Duck breeding population estimates a (in thousands) for the 10 most abundant species in the eastern survey area.
Species 2007 2006 % Change from 2006 Average b % Change from
average
Mergansers (common, red-breasted, and hooded) 394 315 +25 328 +20
Mallard 446 415 +7 408 +9
American black duck 539 493 +9 463 +16 c
American wigeon 12 12 +7 d 20 -38
Green-winged teal 251 229 +10 227 +10
Scaup (greater and lesser) 25 30 -17 36 -31
Ring-necked duck 617 551 +14 509 +20 c
Goldeneyes (common and Barrow’s) 318 215 +48 259 +23
Bufflehead 15 13 +19 25 +38
Scoters (black, white-winged , and surf) 126 79 +61 81 +56
a Estimates for mallard, American black duck, green-winged teal, and ring-necked duck from Bayesian hierarchical analysis using FWS and CWS data from strata 51,
52, 63, 64, 66-68, 70-72. All others were computed as the variance-weighted means of FWS and CWS estimates for strata 51, 52, 63, 64, 66-68, 70-72. b Average for 1990-2006. c Significance (P<0.10) determined by non-overlap of Bayesian credibility intervals or confidence intervals. d Rounded values mask change in estimates.
14

Figu
re 4
. B
reed
ing
wat
erfo
wl h
abita
t con
ditio
ns d
urin
g th
e 20
06W
ater
fow
l Bre
edin
g Po
pula
tion
and
Hab
itat S
urve
y, a
s jud
ged
by U
.S. F
ish
and
Wild
life
Serv
ice
Flyw
ay B
iolo
gist
s.
Poor
Fair
Goo
d
Exce
llent
15

Figu
re 3
. B
reed
ing
wat
erfo
wl h
abita
t con
ditio
ns d
urin
g th
e 20
07W
ater
fow
l Bre
edin
g Po
pula
tion
and
Hab
itat S
urve
y, a
s jud
ged
by U
.S. F
ish
and
Wild
life
Serv
ice
Flyw
ay B
iolo
gist
s.
Poor
Fair
Goo
d
Exce
llent
16

Figure 5. Breeding population estimates, 90% confidence intervals, and North American Waterfowl Management Plan population goal (dashed line) for selected species in the traditional survey area (strata 1-18, 20-50, 75-77).
Mallard
0
2
4
6
8
10
12
14
1955 1965 1975 1985 1995 2005
Year
Mill
ions
American wigeon
0
1
2
3
4
5
1955 1965 1975 1985 1995 2005Year
Mill
ions
Gadwall
0
1
2
3
4
5
1955 1965 1975 1985 1995 2005Year
Mill
ions
Blue-winged teal
0
1
2
3
4
5
6
7
8
9
1955 1965 1975 1985 1995 2005
Year
Mill
ions
Green-winged teal
0
1
2
3
4
1955 1965 1975 1985 1995 2005
Year
Mill
ions
Total ducks
20
25
30
35
40
45
50
1955 1965 1975 1985 1995 2005
Year
Mill
ions
17

Figure 5 (continued).
Northern pintail
0
2
4
6
8
10
12
1955 1965 1975 1985 1995 2005
Year
Mill
ions
Canvasback
0.0
0.2
0.4
0.6
0.8
1.0
1.2
1955 1965 1975 1985 1995 2005
Year
Mill
ions
Redhead
0.0
0.2
0.4
0.6
0.8
1.0
1.2
1.4
1955 1965 1975 1985 1995 2005
Year
Mill
ions
Scaup
0
2
4
6
8
10
1955 1965 1975 1985 1995 2005
Year
Mill
ions
Northern shoveler
0
1
2
3
4
5
6
1955 1965 1975 1985 1995 2005
Year
Mill
ions
18
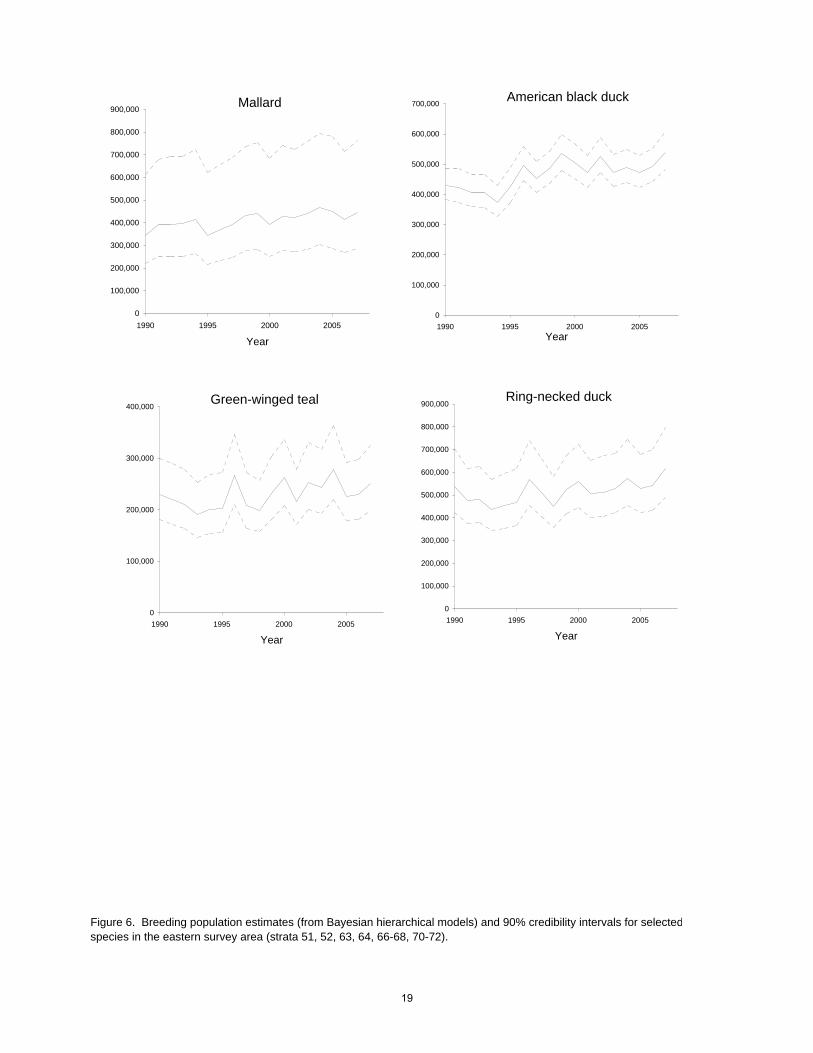
Figure 6. Breeding population estimates (from Bayesian hierarchical models) and 90% credibility intervals for selected species in the eastern survey area (strata 51, 52, 63, 64, 66-68, 70-72).
Mallard
0
100,000
200,000
300,000
400,000
500,000
600,000
700,000
800,000
900,000
1990 1995 2000 2005
Year
American black duck
0
100,000
200,000
300,000
400,000
500,000
600,000
700,000
1990 1995 2000 2005Year
Ring-necked duck
0
100,000
200,000
300,000
400,000
500,000
600,000
700,000
800,000
900,000
1990 1995 2000 2005
Year
Green-winged teal
0
100,000
200,000
300,000
400,000
1990 1995 2000 2005
Year
19

Figure 7. Breeding population estimates (variance-weighted means) and 90% confidence intervals for selected species in the eastern survey area (strata 51, 52, 63, 64, 66-68, 70-72).
American wigeon
0
10,000
20,000
30,000
40,000
50,000
60,000
70,000
1990 1995 2000 2005Year
Scaup
0
20,000
40,000
60,000
80,000
100,000
120,000
1990 1995 2000 2005
Year
Goldeneyes
0
100,000
200,000
300,000
400,000
500,000
1990 1995 2000 2005
Year
Scoters
0
50,000
100,000
150,000
200,000
250,000
300,000
350,000
1990 1995 2000 2005
Year
Bufflehead
0
10,000
20,000
30,000
40,000
50,000
60,000
70,000
80,000
1990 1995 2000 2005
Year
Mergansers
0
100,000
200,000
300,000
400,000
500,000
600,000
700,000
1990 1995 2000 2005
Year
20

Appendix A. Breeding population estimates and standard errors (in thousands) for 10 species of ducks from the traditional survey area (strata 1-18, 20-50, 75-77). Mallard Gadwall American wigeon Green-winged teal Blue-winged teal
Year N ES N ES N ES N ES N ES 1955 8777.3 457.1 651.5 149.5 3216.8 297.8 1807.2 291.5 5305.2 567.6 1956 10452.7 461.8 772.6 142.4 3145.0 227.8 1525.3 236.2 4997.6 527.6 1957 9296.9 443.5 666.8 148.2 2919.8 291.5 1102.9 161.2 4299.5 467.3 1958 11234.2 555.6 502.0 89.6 2551.7 177.9 1347.4 212.2 5456.6 483.7 1959 9024.3 466.6 590.0 72.7 3787.7 339.2 2653.4 459.3 5099.3 332.7 1960 7371.7 354.1 784.1 68.4 2987.6 407.0 1426.9 311.0 4293.0 294.3 1961 7330.0 510.5 654.8 77.5 3048.3 319.9 1729.3 251.5 3655.3 298.7 1962 5535.9 426.9 905.1 87.0 1958.7 145.4 722.9 117.6 3011.1 209.8 1963 6748.8 326.8 1055.3 89.5 1830.8 169.9 1242.3 226.9 3723.6 323.0 1964 6063.9 385.3 873.4 73.7 2589.6 259.7 1561.3 244.7 4020.6 320.4 1965 5131.7 274.8 1260.3 114.8 2301.1 189.4 1282.0 151.0 3594.5 270.4 1966 6731.9 311.4 1680.4 132.4 2318.4 139.2 1617.3 173.6 3733.2 233.6 1967 7509.5 338.2 1384.6 97.8 2325.5 136.2 1593.7 165.7 4491.5 305.7 1968 7089.2 340.8 1949.0 213.9 2298.6 156.1 1430.9 146.6 3462.5 389.1 1969 7531.6 280.2 1573.4 100.2 2941.4 168.6 1491.0 103.5 4138.6 239.5 1970 9985.9 617.2 1608.1 123.5 3469.9 318.5 2182.5 137.7 4861.8 372.3 1971 9416.4 459.5 1605.6 123.0 3272.9 186.2 1889.3 132.9 4610.2 322.8 1972 9265.5 363.9 1622.9 120.1 3200.1 194.1 1948.2 185.8 4278.5 230.5 1973 8079.2 377.5 1245.6 90.3 2877.9 197.4 1949.2 131.9 3332.5 220.3 1974 6880.2 351.8 1592.4 128.2 2672.0 159.3 1864.5 131.2 4976.2 394.6 1975 7726.9 344.1 1643.9 109.0 2778.3 192.0 1664.8 148.1 5885.4 337.4 1976 7933.6 337.4 1244.8 85.7 2505.2 152.7 1547.5 134.0 4744.7 294.5 1977 7397.1 381.8 1299.0 126.4 2575.1 185.9 1285.8 87.9 4462.8 328.4 1978 7425.0 307.0 1558.0 92.2 3282.4 208.0 2174.2 219.1 4498.6 293.3 1979 7883.4 327.0 1757.9 121.0 3106.5 198.2 2071.7 198.5 4875.9 297.6 1980 7706.5 307.2 1392.9 98.8 3595.5 213.2 2049.9 140.7 4895.1 295.6 1981 6409.7 308.4 1395.4 120.0 2946.0 173.0 1910.5 141.7 3720.6 242.1 1982 6408.5 302.2 1633.8 126.2 2458.7 167.3 1535.7 140.2 3657.6 203.7 1983 6456.0 286.9 1519.2 144.3 2636.2 181.4 1875.0 148.0 3366.5 197.2 1984 5415.3 258.4 1515.0 125.0 3002.2 174.2 1408.2 91.5 3979.3 267.6 1985 4960.9 234.7 1303.0 98.2 2050.7 143.7 1475.4 100.3 3502.4 246.3 1986 6124.2 241.6 1547.1 107.5 1736.5 109.9 1674.9 136.1 4478.8 237.1 1987 5789.8 217.9 1305.6 97.1 2012.5 134.3 2006.2 180.4 3528.7 220.2 1988 6369.3 310.3 1349.9 121.1 2211.1 139.1 2060.8 188.3 4011.1 290.4 1989 5645.4 244.1 1414.6 106.6 1972.9 106.0 1841.7 166.4 3125.3 229.8 1990 5452.4 238.6 1672.1 135.8 1860.1 108.3 1789.5 172.7 2776.4 178.7 1991 5444.6 205.6 1583.7 111.8 2254.0 139.5 1557.8 111.3 3763.7 270.8 1992 5976.1 241.0 2032.8 143.4 2208.4 131.9 1773.1 123.7 4333.1 263.2 1993 5708.3 208.9 1755.2 107.9 2053.0 109.3 1694.5 112.7 3192.9 205.6 1994 6980.1 282.8 2318.3 145.2 2382.2 130.3 2108.4 152.2 4616.2 259.2 1995 8269.4 287.5 2835.7 187.5 2614.5 136.3 2300.6 140.3 5140.0 253.3 1996 7941.3 262.9 2984.0 152.5 2271.7 125.4 2499.5 153.4 6407.4 353.9 1997 9939.7 308.5 3897.2 264.9 3117.6 161.6 2506.6 142.5 6124.3 330.7 1998 9640.4 301.6 3742.2 205.6 2857.7 145.3 2087.3 138.9 6398.8 332.3 1999 10805.7 344.5 3235.5 163.8 2920.1 185.5 2631.0 174.6 7149.5 364.5 2000 9470.2 290.2 3158.4 200.7 2733.1 138.8 3193.5 200.1 7431.4 425.0 2001 7904.0 226.9 2679.2 136.1 2493.5 149.6 2508.7 156.4 5757.0 288.8 2002 7503.7 246.5 2235.4 135.4 2334.4 137.9 2333.5 143.8 4206.5 227.9 2003 7949.7 267.3 2549.0 169.9 2551.4 156.9 2678.5 199.7 5518.2 312.7 2004 7425.3 282.0 2589.6 165.6 1981.3 114.9 2460.8 145.2 4073.0 238.0 2005 6755.3 280.8 2179.1 131.0 2225.1 139.2 2156.9 125.8 4585.5 236.3 2006 7276.5 223.7 2824.7 174.2 2171.2 115.7 2587.2 155.3 5859.6 303.5 2007 8031.6 275.2 3354.9 206.2 2803.2 151.8 2910.9 198.5 6694.2 361.7
21

Appendix A (continued). Northern shoveler Northern pintail Redhead Canvasback Scaup Year N ES N ES N ES N ES N ES 1955 1642.8 218.7 9775.1 656.1 539.9 98.9 589.3 87.8 5620.1 582.1 1956 1781.4 196.4 10372.8 694.4 757.3 119.3 698.5 93.3 5994.1 434.0 1957 1476.1 181.8 6606.9 493.4 509.1 95.7 626.1 94.7 5766.9 411.7 1958 1383.8 185.1 6037.9 447.9 457.1 66.2 746.8 96.1 5350.4 355.1 1959 1577.6 301.1 5872.7 371.6 498.8 55.5 488.7 50.6 7037.6 492.3 1960 1824.5 130.1 5722.2 323.2 497.8 67.0 605.7 82.4 4868.6 362.5 1961 1383.0 166.5 4218.2 496.2 323.3 38.8 435.3 65.7 5380.0 442.2 1962 1269.0 113.9 3623.5 243.1 507.5 60.0 360.2 43.8 5286.1 426.4 1963 1398.4 143.8 3846.0 255.6 413.4 61.9 506.2 74.9 5438.4 357.9 1964 1718.3 240.3 3291.2 239.4 528.1 67.3 643.6 126.9 5131.8 386.1 1965 1423.7 114.1 3591.9 221.9 599.3 77.7 522.1 52.8 4640.0 411.2 1966 2147.0 163.9 4811.9 265.6 713.1 77.6 663.1 78.0 4439.2 356.2 1967 2314.7 154.6 5277.7 341.9 735.7 79.0 502.6 45.4 4927.7 456.1 1968 1684.5 176.8 3489.4 244.6 499.4 53.6 563.7 101.3 4412.7 351.8 1969 2156.8 117.2 5903.9 296.2 633.2 53.6 503.5 53.7 5139.8 378.5 1970 2230.4 117.4 6392.0 396.7 622.3 64.3 580.1 90.4 5662.5 391.4 1971 2011.4 122.7 5847.2 368.1 534.4 57.0 450.7 55.2 5143.3 333.8 1972 2466.5 182.8 6979.0 364.5 550.9 49.4 425.9 46.0 7997.0 718.0 1973 1619.0 112.2 4356.2 267.0 500.8 57.7 620.5 89.1 6257.4 523.1 1974 2011.3 129.9 6598.2 345.8 626.3 70.8 512.8 56.8 5780.5 409.8 1975 1980.8 106.7 5900.4 267.3 831.9 93.5 595.1 56.1 6460.0 486.0 1976 1748.1 106.9 5475.6 299.2 665.9 66.3 614.4 70.1 5818.7 348.7 1977 1451.8 82.1 3926.1 246.8 634.0 79.9 664.0 74.9 6260.2 362.8 1978 1975.3 115.6 5108.2 267.8 724.6 62.2 373.2 41.5 5984.4 403.0 1979 2406.5 135.6 5376.1 274.4 697.5 63.8 582.0 59.8 7657.9 548.6 1980 1908.2 119.9 4508.1 228.6 728.4 116.7 734.6 83.8 6381.7 421.2 1981 2333.6 177.4 3479.5 260.5 594.9 62.0 620.8 59.1 5990.9 414.2 1982 2147.6 121.7 3708.8 226.6 616.9 74.2 513.3 50.9 5532.0 380.9 1983 1875.7 105.3 3510.6 178.1 711.9 83.3 526.6 58.9 7173.8 494.9 1984 1618.2 91.9 2964.8 166.8 671.3 72.0 530.1 60.1 7024.3 484.7 1985 1702.1 125.7 2515.5 143.0 578.2 67.1 375.9 42.9 5098.0 333.1 1986 2128.2 112.0 2739.7 152.1 559.6 60.5 438.3 41.5 5235.3 355.5 1987 1950.2 118.4 2628.3 159.4 502.4 54.9 450.1 77.9 4862.7 303.8 1988 1680.9 210.4 2005.5 164.0 441.9 66.2 435.0 40.2 4671.4 309.5 1989 1538.3 95.9 2111.9 181.3 510.7 58.5 477.4 48.4 4342.1 291.3 1990 1759.3 118.6 2256.6 183.3 480.9 48.2 539.3 60.3 4293.1 264.9 1991 1716.2 104.6 1803.4 131.3 445.6 42.1 491.2 66.4 5254.9 364.9 1992 1954.4 132.1 2098.1 161.0 595.6 69.7 481.5 97.3 4639.2 291.9 1993 2046.5 114.3 2053.4 124.2 485.4 53.1 472.1 67.6 4080.1 249.4 1994 2912.0 141.4 2972.3 188.0 653.5 66.7 525.6 71.1 4529.0 253.6 1995 2854.9 150.3 2757.9 177.6 888.5 90.6 770.6 92.2 4446.4 277.6 1996 3449.0 165.7 2735.9 147.5 834.2 83.1 848.5 118.3 4217.4 234.5 1997 4120.4 194.0 3558.0 194.2 918.3 77.2 688.8 57.2 4112.3 224.2 1998 3183.2 156.5 2520.6 136.8 1005.1 122.9 685.9 63.8 3471.9 191.2 1999 3889.5 202.1 3057.9 230.5 973.4 69.5 716.0 79.1 4411.7 227.9 2000 3520.7 197.9 2907.6 170.5 926.3 78.1 706.8 81.0 4026.3 205.3 2001 3313.5 166.8 3296.0 266.6 712.0 70.2 579.8 52.7 3694.0 214.9 2002 2318.2 125.6 1789.7 125.2 564.8 69.0 486.6 43.8 3524.1 210.3 2003 3619.6 221.4 2558.2 174.8 636.8 56.6 557.6 48.0 3734.4 225.5 2004 2810.4 163.9 2184.6 155.2 605.3 51.5 617.2 64.6 3807.2 202.3 2005 3591.5 178.6 2560.5 146.8 592.3 51.7 520.6 52.9 3386.9 196.4 2006 3680.2 236.5 3386.4 198.7 916.3 86.1 691.0 69.6 3246.7 166.9 2007 4552.8 247.5 3335.3 160.4 1009.0 84.7 864.9 86.2 3452.2 195.3
22

Appendix B. Breeding population estimates and 90% confidence intervals or credibility intervals (CIs; in thousands) for the 10 most abundant species of ducks in the eastern survey area, 1990-2007 a. Mergansers b Mallard American black duck American wigeon Green-winged teal
Year N 90% CI N 90% CI N 90% CI N 90% CI N 90% CI
1990 272.3 (234.7, 309.9) 345.6 (220.1, 614.4) 430.1 (381.8, 487.3) 13.5 (4.3, 22.7) 230.1 (180.6, 300.5)
1991 392.2 (345.6, 438.8) 391.4 (251.3, 678.9) 423.5 (372.9, 485.9) 15.2 (11.1, 19.3) 219.1 (170.8, 289.4)
1992 303.2 (256.6, 349.8) 393.7 (249.9, 692.8) 407.8 (360.4, 465.0) 5.1 (1.5, 8.7) 210.7 (163.8, 278.1)
1993 254.7 (212.8, 296.6) 396.1 (252.1, 691.5) 406.1 (356.3, 465.0) 10.4 (4.9, 15.9) 190.4 (146.2, 252.7)
1994 333.4 (286.9, 379.9) 415.5 (263.9, 723.2) 374.3 (327.2, 429.9) 10.2 (4.1, 16.3) 200.3 (154.4, 267.6)
1995 304.8 (261.4, 348.2) 343.8 (216.8, 620.5) 426.4 (372.4, 490.1) 9.5 (0.5, 18.5) 203.1 (156.6, 272.0)
1996 271.6 (239.1, 304.1) 369.3 (233.6, 656.4) 497.0 (444.7, 559.4) 10.0 (6.0, 14.0) 265.9 (210.5, 345.5)
1997 334.0 (288.6, 379.4) 391.2 (247.2, 689.3) 453.8 (406.3, 509.4) 18.2 (11.2, 25.2) 208.4 (164.6, 271.6)
1998 223.1 (177.4, 268.8) 431.9 (277.9, 737.5) 485.4 (436.0, 543.5) 58.2 (54.0, 62.4) 199.0 (158.4, 257.8)
1999 313.4 (236.3, 390.5) 441.1 (284.4, 752.6) 535.4 (480.3, 600.2) 14.0 (11.3, 16.7) 231.5 (181.1, 303.7)
2000 346.7 (303.4, 390.0) 392.1 (253.3, 683.4) 506.3 (453.2, 567.3) 38.1 (27.3, 48.9) 262.3 (209.2, 336.1)
2001 294.7 (247.6, 341.8) 429.6 (279.6, 741.0) 472.6 (424.0, 530.5) 43.9 (37.6, 50.2) 215.8 (171.1, 278.6)
2002 449.4 (374.0, 524.8) 421.9 (274.1, 723.9) 525.4 (471.2, 588.6) 13.1 (6.6, 19.6) 253.9 (200.7, 331.1)
2003 391.1 (317.0, 465.2) 439.7 (283.0, 760.3) 474.5 (425.6, 531.7) 11.6 (3.5, 19.7) 243.2 (192.6, 316.9)
2004 404.3 (350.2, 458.4) 466.8 (304.1, 793.9) 488.8 (438.9, 548.2) 22.8 (13.7, 31.9) 277.9 (219.1, 363.8)
2005 365.5 (313.3, 417.7) 451.8 (288.7, 780.1) 471.2 (422.0, 529.0) 31.2 (26.5, 35.9) 226.0 (179.3, 292.5)
2006 315.5 (243.7, 387.3) 415.2 (269.8, 713.8) 492.6 (441.4, 551.9) 11.5 (3.8, 19.2) 229.0 (181.5, 296.9)
2007 394.4 (314.8, 474.0) 445.9 (286.8, 765.3) 539.1 (481.5, 609.0) 12.3 (2.6, 22.0) 251.3 (199.4, 324.4)
Scaup c Ring-necked duck Goldeneyes d Bufflehead Scoters e
Year N 90% CI N 90% CI N 90% CI N 90% CI N 90% CI
1990 49.8 (13.4, 86.2) 539.2 (423.8, 705.2) 283.1 (168.3, 397.9) 35.5 (24.5, 46.5) 99.5 (21.5, 177.5)
1991 37.6 (19.6, 55.6) 474.1 (374.6, 618.1) 292.6 (194.0, 391.2) 28.4 (17.8, 39.0) 89.8 (39.0, 140.6)
1992 36.7 (11.0, 62.4) 482.3 (381.5, 627.1) 294.1 (203.1, 385.1) 45.3 (23.0, 67.6) 85.2 (2.9, 167.5)
1993 10.6 (6.8, 14.4) 436.4 (343.5, 568.5) 300.9 (179.0, 422.8) 6.6 (3.3, 9.9) 104.4 (37.2, 171.6)
1994 36.7 (13.1, 60.3) 453.4 (354.4, 593.2) 229.5 (159.2, 299.8) 24.3 (11.1, 37.5) 162.2 (65.7, 258.7)
1995 14.2 (4.1, 24.3) 467.9 (365.8, 618.5) 115.6 (86.3, 144.9) 10.3 (5.4, 15.2) 25.9 (14.9, 36.9)
1996 20.4 (6.3, 34.5) 569.8 (453.3, 739.4) 263.2 (166.3, 360.1) 36.1 (25.1, 47.1) 31.6 (0.0, 68.0)
1997 37.5 (12.7, 62.3) 510.4 (406.8, 659.2) 248.9 (210.9, 286.9) 15.3 (1.0, 29.6) 52.5 (34.5, 70.5)
1998 12.3 (9.9, 14.7) 448.5 (356.2, 582.0) 176.7 (104.0, 249.4) 26.8 (26.4, 27.2) 58.9 (7.3, 110.5)
1999 21.2 (16.3, 26.1) 524.4 (419.1, 675.1) 246.7 (215.7, 277.7) 15.0 (10.8, 19.2) 24.2 (8.7, 39.7)
2000 40.1 (25.0, 55.2) 558.6 (445.8, 720.3) 291.0 (234.4, 347.6) 15.9 (3.2, 28.6) 51.7 (0.6, 102.8)
2001 108.2 (107.3, 109.1) 507.6 (403.6, 654.1) 309.2 (263.1, 355.3) 40.5 (37.6, 43.4) 57.0 (0.0, 118.1)
2002 71.5 (53.2, 89.8) 513.8 (406.4, 673.1) 258.1 (221.7, 294.5) 53.2 (38.0, 68.4) 202.1 (153.3, 250.9)
2003 39.3 (30.7, 47.9) 527.8 (421.5, 681.0) 319.3 (257.5, 381.1) 18.9 (13.1, 24.7) 73.3 (0.0, 198.7)
2004 21.7 (0.0, 56.0) 571.7 (454.1, 746.2) 320.0 (238.8, 401.2) 17.3 (9.7, 24.9) 103.3 (0.0, 325.3)
2005 25.0 (3.2, 46.8) 529.9 (424.3, 678.3) 233.7 (176.9, 290.5) 18.8 (4.8, 32.8) 74.8 (3.5, 146.1)
2006 30.0 (28.6, 31.4) 542.5 (432.3, 698.4) 214.6 (182.6, 246.6) 12.9 (8.4, 17.4) 78.7 (31.6, 125.8)
2007 25.0 (17.1, 32.9) 617.1 (491.2, 796.3) 317.6 (178.6, 456.6) 15.3 (4.8, 25.8) 126.3 (0.0, 311.6)
a Estimates for mallards, American black ducks, green-winged teal, and ring-necked duck from Bayesian hierarchical analysis using FWS and CWS data from strata 51, 52, 63,
64, 66-68, 70-72. All others were computed as variance-weighted means of FWS and CWS estimates for strata 51, 52, 63, 64, 66-68, 70-72. b Common, red-breasted, and hooded. c Greater and lesser. d Common and Barrow’s. e Black, white-winged, and surf.
23