trends in electronic cigarette use in england · trends in electronic cigarette use in england...
TRANSCRIPT
Trends in electronic cigarette use in
England
Robert West
Jamie Brown
Emma Beard
University College London
www.smokinginengland.info/latest-statistics
Updated 14th April 2015
www.smokinginengland.info/latest-statistics
Background
• Electronic cigarette use has become prevalent in
many countries
• In England, electronic cigarettes are currently
regulated as consumer products
• It is important to track use of electronic
cigarettes and assess how far they appear to be
promoting or detracting from reduction in
prevalence of cigarette smoking
2
www.smokinginengland.info/latest-statistics
Aims
• To track use of electronic cigarettes over time and assess how far
any increase is accompanied by changes in:
– use of other aids to cessation or smoking reduction
– key performance indicators for tobacco control
• smoking prevalence
• smoking cessation rates
• attempts to stop smoking
• success of attempts to stop smoking
• To assess prevalence of use of electronic cigarettes in people who
have never smoked regularly or stopped for more than a year
• To estimate changes in the total tobacco and nicotine market
3
www.smokinginengland.info/latest-statistics
Methods
4
• Monthly household surveys
• Each month involves a new representative
sample of ~1800 respondents; smokers ~450
• Data collected on electronic cigarettes since
second quarter 2011
• Fidler, et al., 2011. 'The smoking toolkit study': a
national study of smoking and smoking
cessation in England. BMC Public Health 11:479
• For more info see www.smokinginengland.info
www.smokinginengland.info/latest-statistics
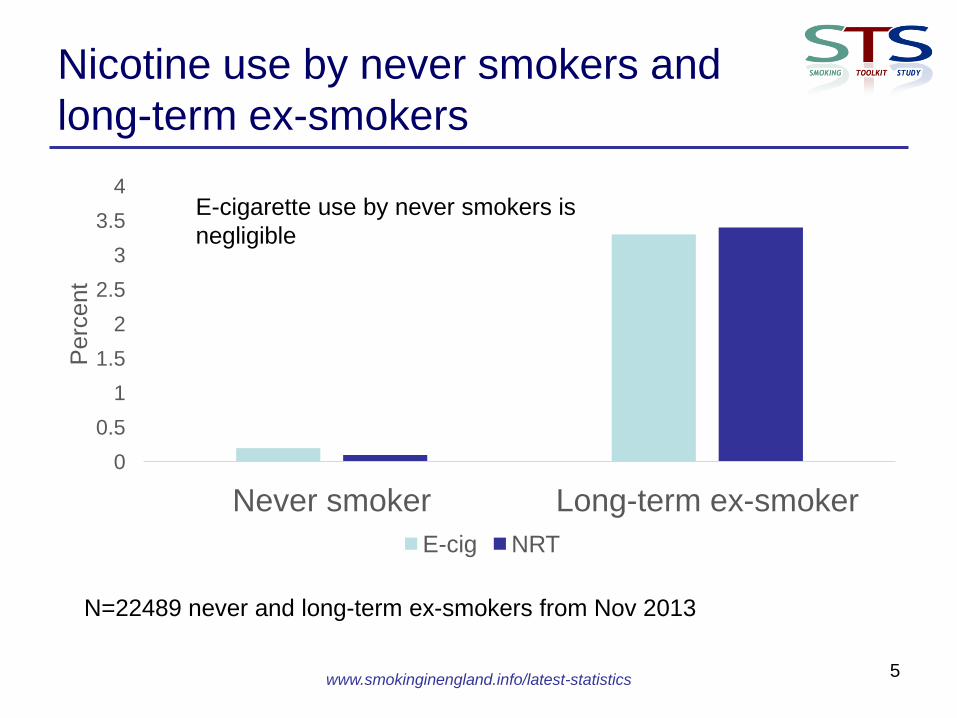
Nicotine use by never smokers and
long-term ex-smokers
0
0.5
1
1.5
2
2.5
3
3.5
4
Never smoker Long-term ex-smoker
Perc
ent
E-cig NRT
5
N=22489 never and long-term ex-smokers from Nov 2013
E-cigarette use by never smokers is
negligible
www.smokinginengland.info/latest-statistics
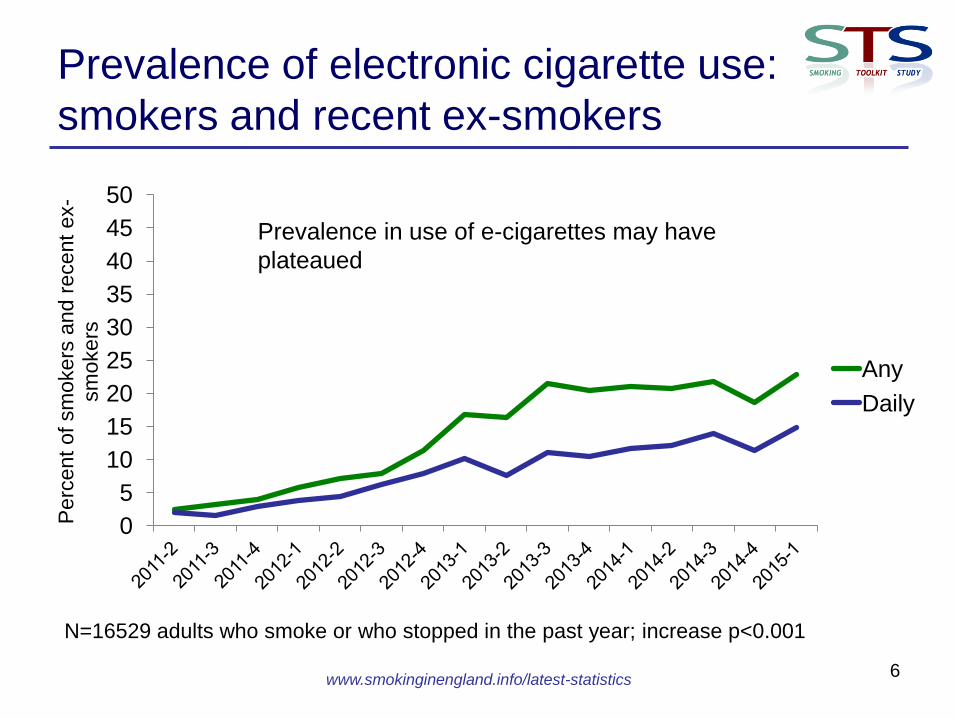
Prevalence of electronic cigarette use:
smokers and recent ex-smokers
6
0
5
10
15
20
25
30
35
40
45
50
Perc
ent
of sm
okers
and
recent
ex-
sm
okers
Any
Daily
N=16529 adults who smoke or who stopped in the past year; increase p<0.001
Prevalence in use of e-cigarettes may have
plateaued
www.smokinginengland.info/latest-statistics
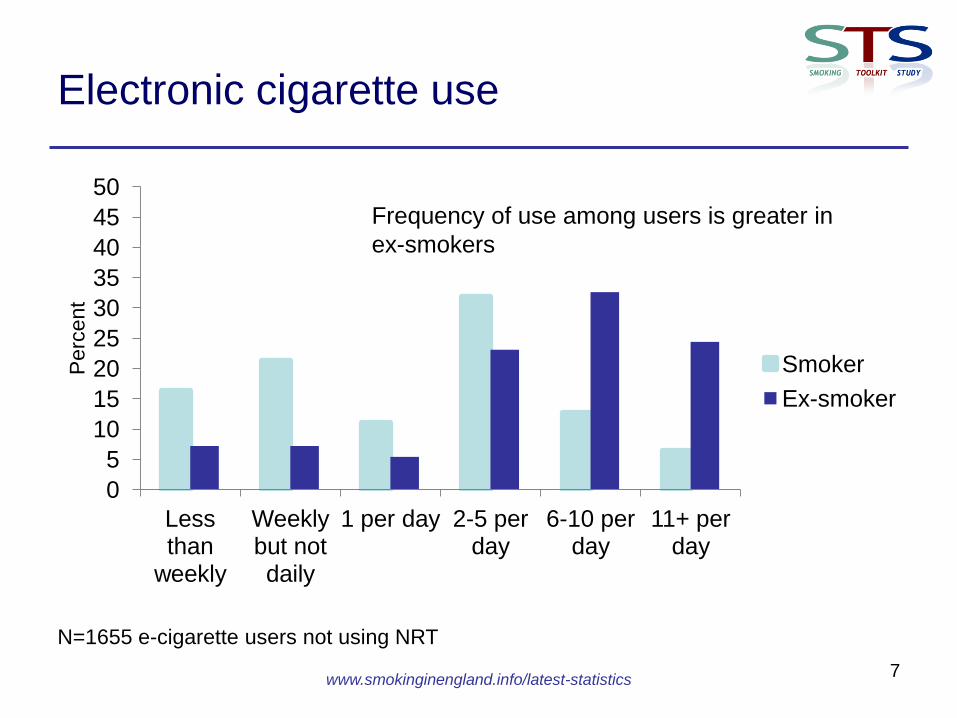
Electronic cigarette use
7
0
5
10
15
20
25
30
35
40
45
50
Less than
weekly
Weekly but not daily
1 per day 2-5 per day
6-10 per day
11+ per day
Perc
ent
Smoker
Ex-smoker
Frequency of use among users is greater in
ex-smokers
N=1655 e-cigarette users not using NRT
www.smokinginengland.info/latest-statistics
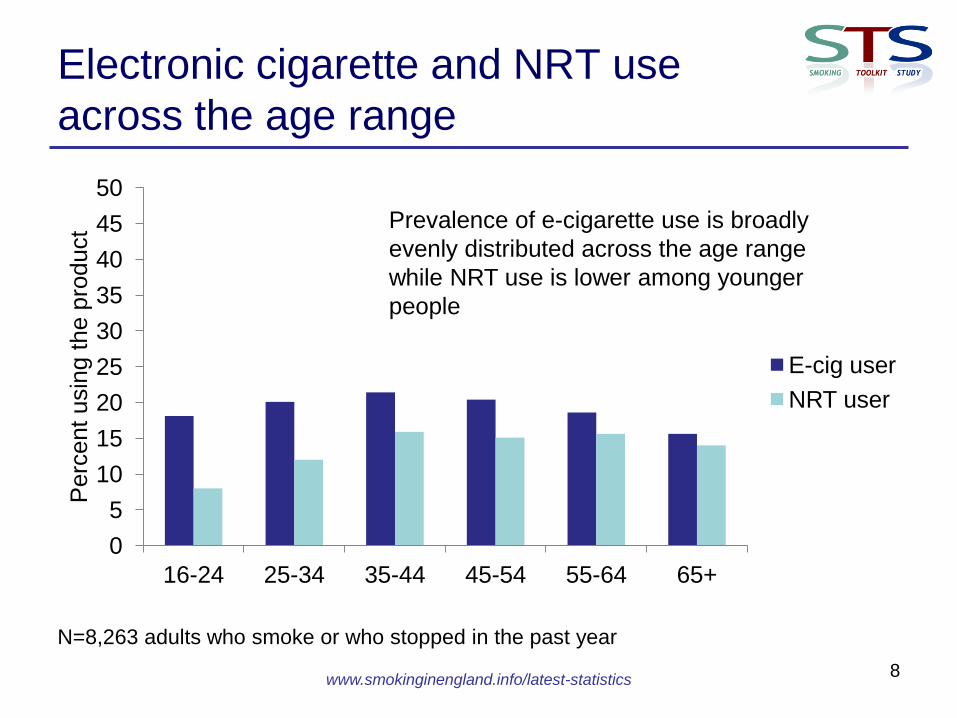
Electronic cigarette and NRT use
across the age range
8
0
5
10
15
20
25
30
35
40
45
50
16-24 25-34 35-44 45-54 55-64 65+
Perc
ent
usin
g t
he p
roduct
E-cig user
NRT user
N=8,263 adults who smoke or who stopped in the past year
Prevalence of e-cigarette use is broadly
evenly distributed across the age range
while NRT use is lower among younger
people
www.smokinginengland.info/latest-statistics
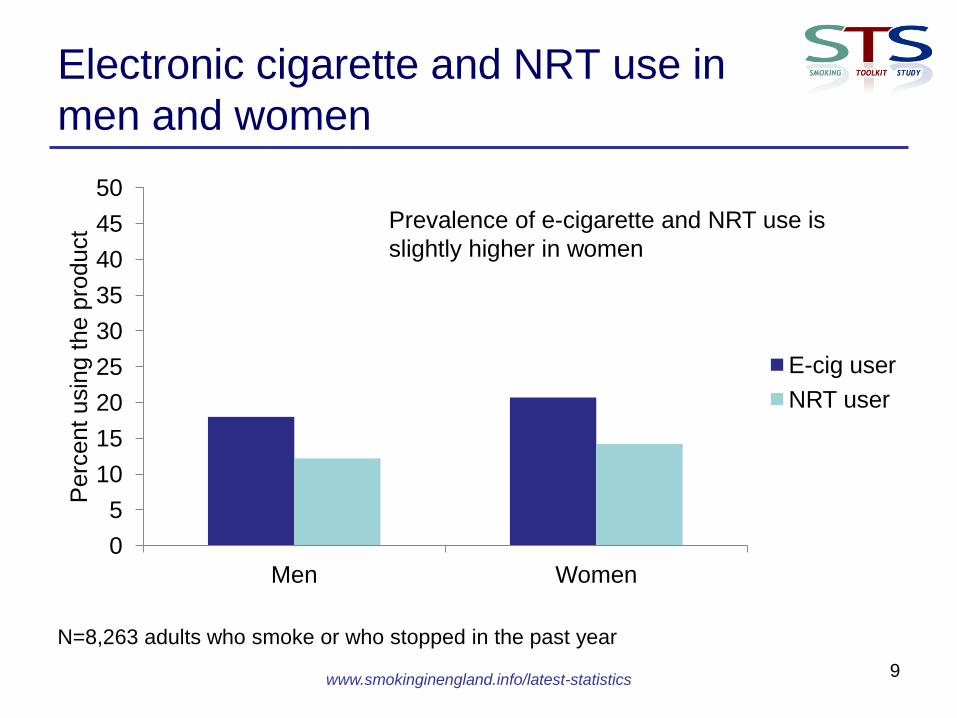
Electronic cigarette and NRT use in
men and women
9
0
5
10
15
20
25
30
35
40
45
50
Men Women
Perc
ent
usin
g t
he p
roduct
E-cig user
NRT user
N=8,263 adults who smoke or who stopped in the past year
Prevalence of e-cigarette and NRT use is
slightly higher in women
www.smokinginengland.info/latest-statistics
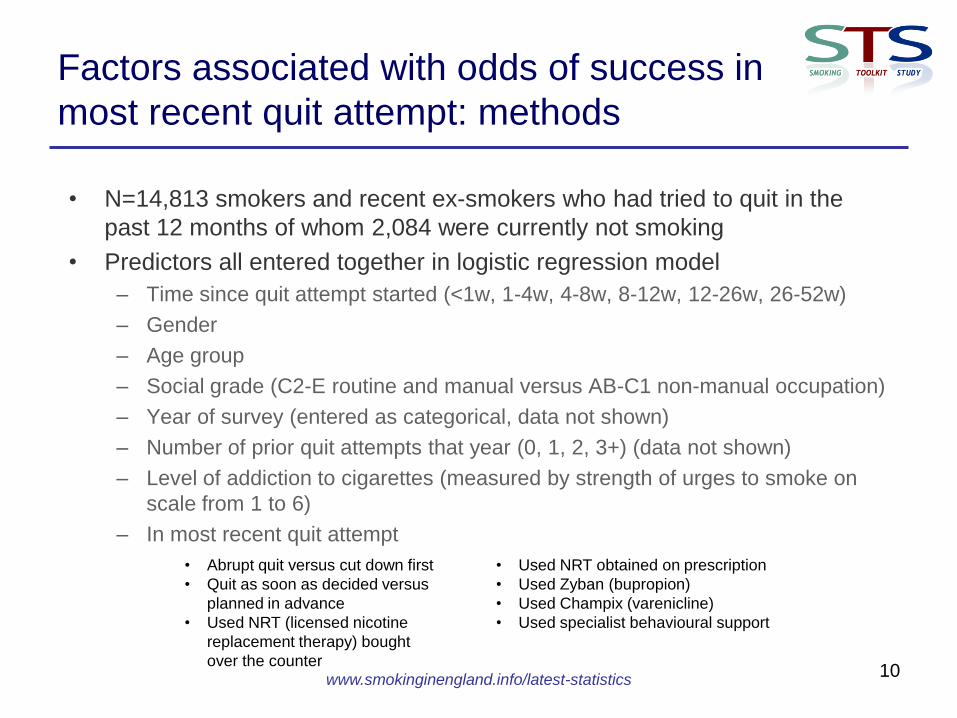
Factors associated with odds of success in
most recent quit attempt: methods
• N=14,813 smokers and recent ex-smokers who had tried to quit in the
past 12 months of whom 2,084 were currently not smoking
• Predictors all entered together in logistic regression model
– Time since quit attempt started (<1w, 1-4w, 4-8w, 8-12w, 12-26w, 26-52w)
– Gender
– Age group
– Social grade (C2-E routine and manual versus AB-C1 non-manual occupation)
– Year of survey (entered as categorical, data not shown)
– Number of prior quit attempts that year (0, 1, 2, 3+) (data not shown)
– Level of addiction to cigarettes (measured by strength of urges to smoke on
scale from 1 to 6)
– In most recent quit attempt
• Abrupt quit versus cut down first
• Quit as soon as decided versus
planned in advance
• Used NRT (licensed nicotine
replacement therapy) bought
over the counter
• Used NRT obtained on prescription
• Used Zyban (bupropion)
• Used Champix (varenicline)
• Used specialist behavioural support
10
www.smokinginengland.info/latest-statistics
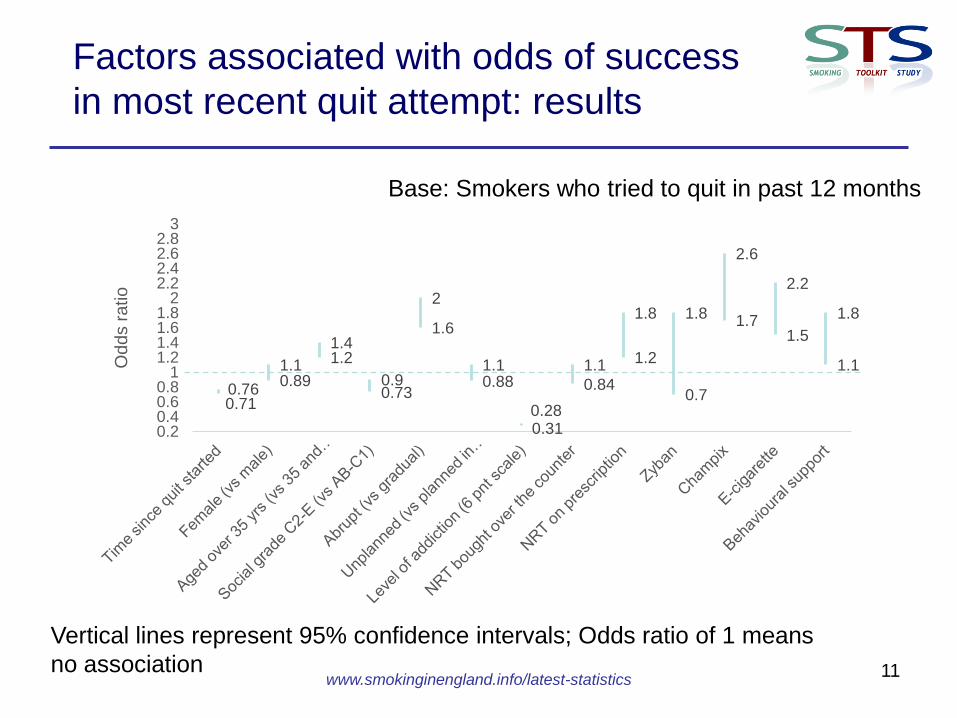
Factors associated with odds of success
in most recent quit attempt: results
0.76
1.1
1.4
0.9
2
1.1
0.31
1.1
1.8 1.8
2.6
2.2
1.8
0.71
0.89
1.2
0.73
1.6
0.88
0.28
0.84
1.2
0.7
1.7 1.5
1.1
0.2 0.4 0.6 0.8
1 1.2 1.4 1.6 1.8
2 2.2 2.4 2.6 2.8
3
Odd
s r
atio
Vertical lines represent 95% confidence intervals; Odds ratio of 1 means
no association
Base: Smokers who tried to quit in past 12 months
11
www.smokinginengland.info/latest-statistics
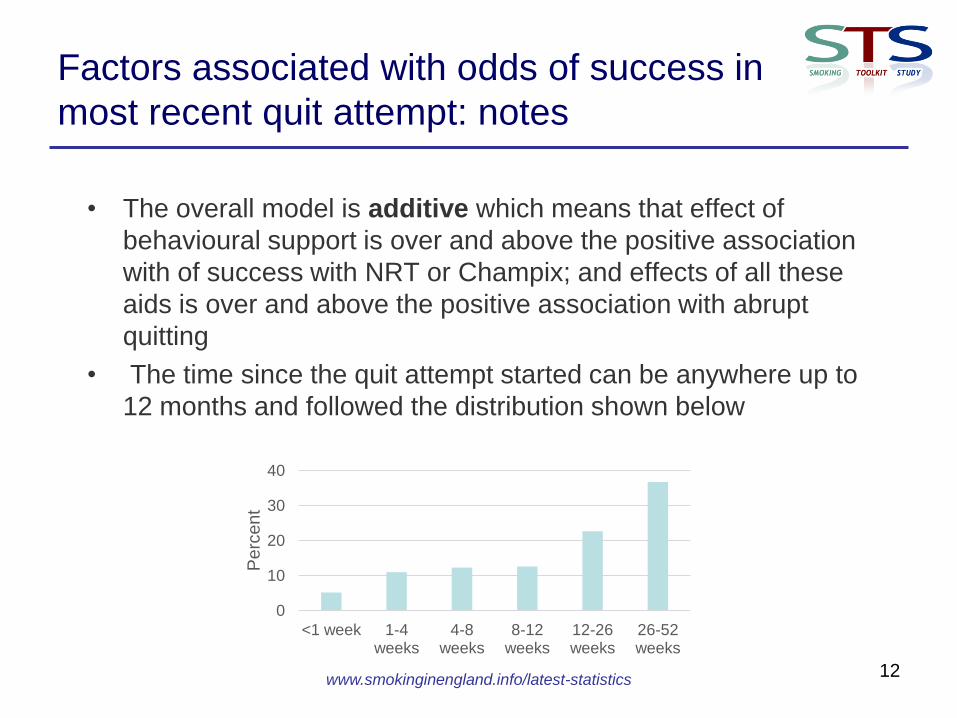
Factors associated with odds of success in
most recent quit attempt: notes
• The overall model is additive which means that effect of
behavioural support is over and above the positive association
with of success with NRT or Champix; and effects of all these
aids is over and above the positive association with abrupt
quitting
• The time since the quit attempt started can be anywhere up to
12 months and followed the distribution shown below
0
10
20
30
40
<1 week 1-4 weeks
4-8 weeks
8-12 weeks
12-26 weeks
26-52 weeks
Pe
rce
nt
12
www.smokinginengland.info/latest-statistics
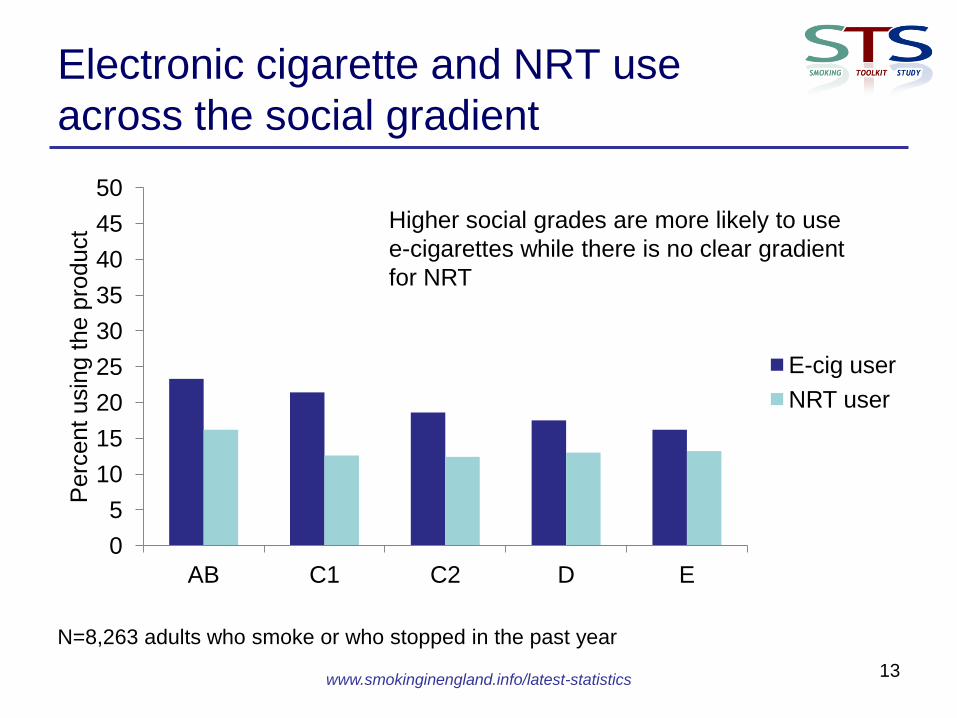
Electronic cigarette and NRT use
across the social gradient
13
0
5
10
15
20
25
30
35
40
45
50
AB C1 C2 D E
Perc
ent
usin
g t
he p
roduct
E-cig user
NRT user
N=8,263 adults who smoke or who stopped in the past year
Higher social grades are more likely to use
e-cigarettes while there is no clear gradient
for NRT
www.smokinginengland.info/latest-statistics
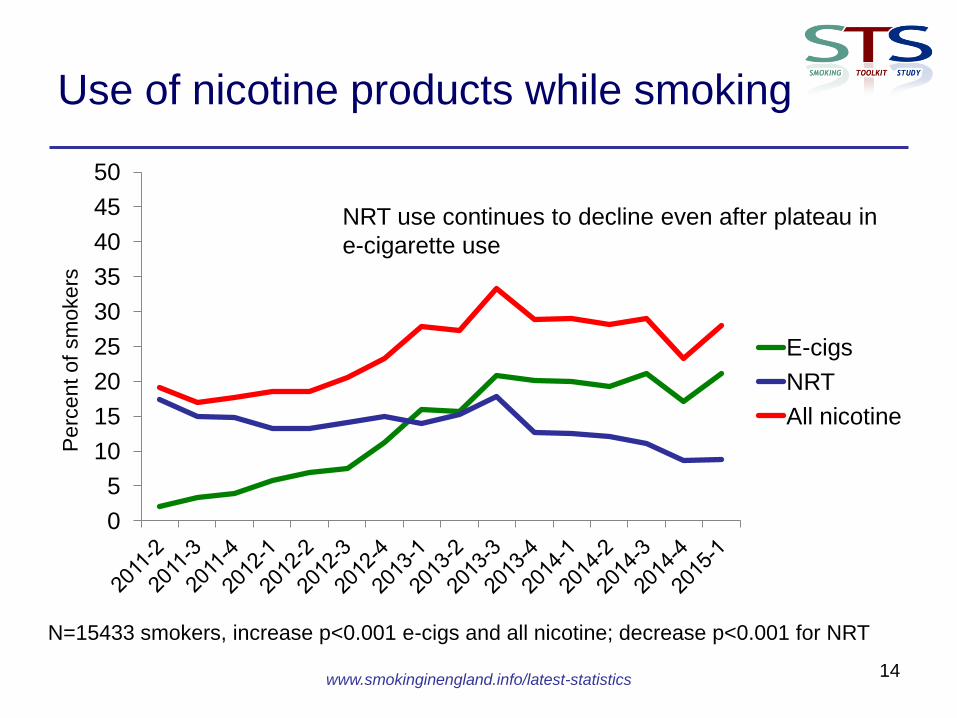
Use of nicotine products while smoking
14
0
5
10
15
20
25
30
35
40
45
50
Perc
en
t of
sm
okers
E-cigs
NRT
All nicotine
N=15433 smokers, increase p<0.001 e-cigs and all nicotine; decrease p<0.001 for NRT
NRT use continues to decline even after plateau in
e-cigarette use
www.smokinginengland.info/latest-statistics
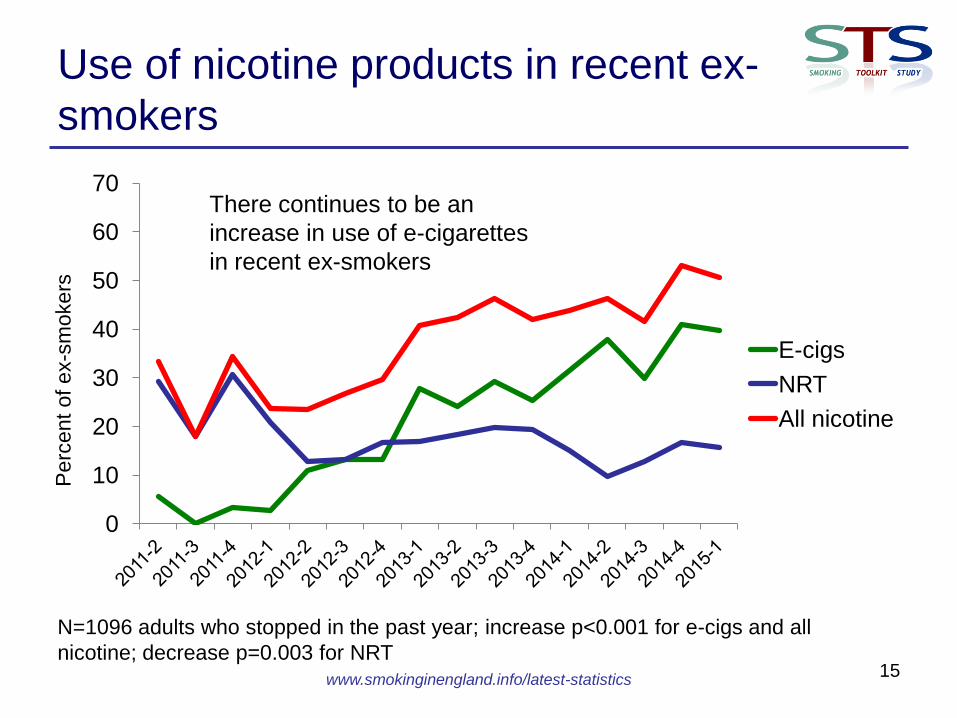
Use of nicotine products in recent ex-
smokers
15
0
10
20
30
40
50
60
70
Perc
ent
of
ex-s
mokers
E-cigs
NRT
All nicotine
N=1096 adults who stopped in the past year; increase p<0.001 for e-cigs and all
nicotine; decrease p=0.003 for NRT
There continues to be an
increase in use of e-cigarettes
in recent ex-smokers
www.smokinginengland.info/latest-statistics
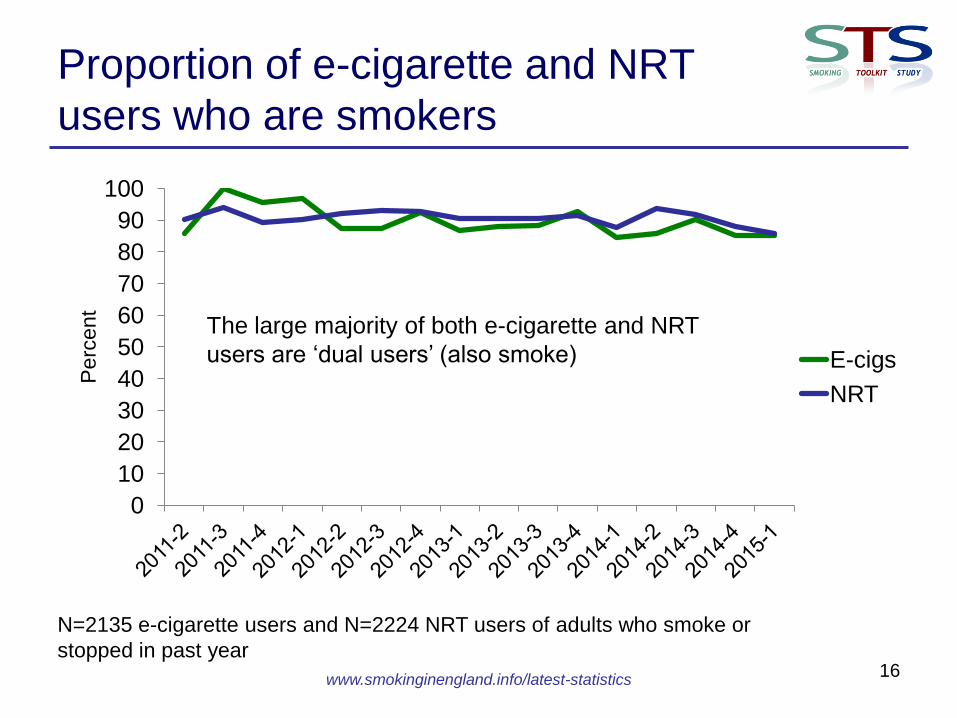
Proportion of e-cigarette and NRT
users who are smokers
16
0
10
20
30
40
50
60
70
80
90
100
Perc
ent
E-cigs
NRT
N=2135 e-cigarette users and N=2224 NRT users of adults who smoke or
stopped in past year
The large majority of both e-cigarette and NRT
users are ‘dual users’ (also smoke)
www.smokinginengland.info/latest-statistics
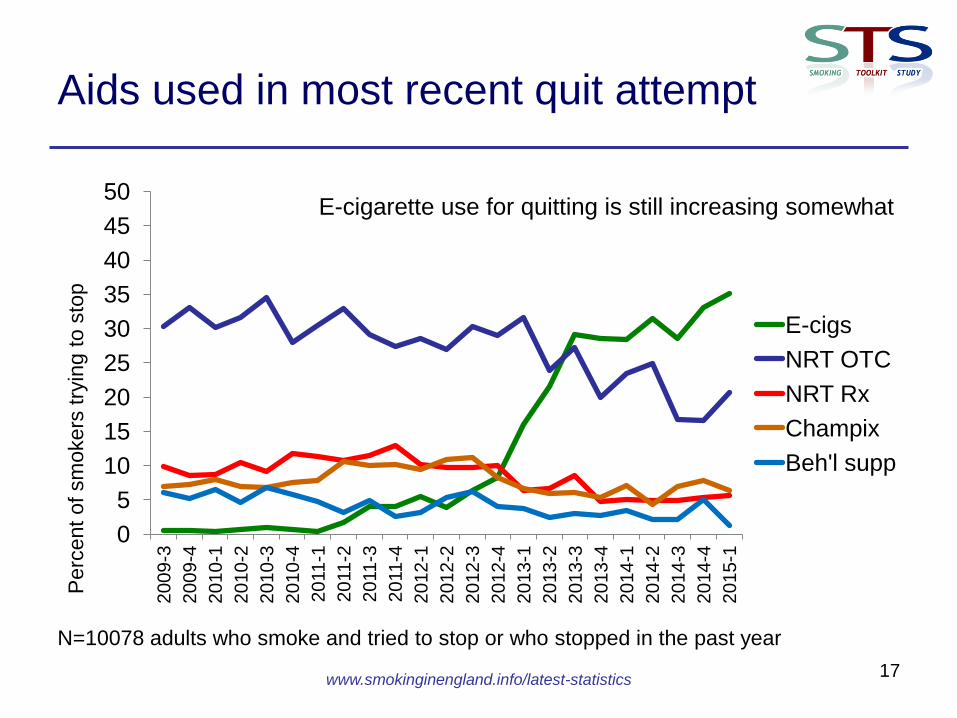
Aids used in most recent quit attempt
17
0
5
10
15
20
25
30
35
40
45
50
2009-3
2009-4
2010-1
2010-2
2010-3
2010-4
20
11-1
20
11-2
20
11-3
20
11-4
2012-1
2012-2
2012-3
2012-4
2013-1
2013-2
2013-3
2013-4
2014-1
2014-2
2014-3
2014-4
2015-1
Perc
ent
of sm
okers
try
ing t
o s
top
E-cigs
NRT OTC
NRT Rx
Champix
Beh'l supp
N=10078 adults who smoke and tried to stop or who stopped in the past year
E-cigarette use for quitting is still increasing somewhat
www.smokinginengland.info/latest-statistics
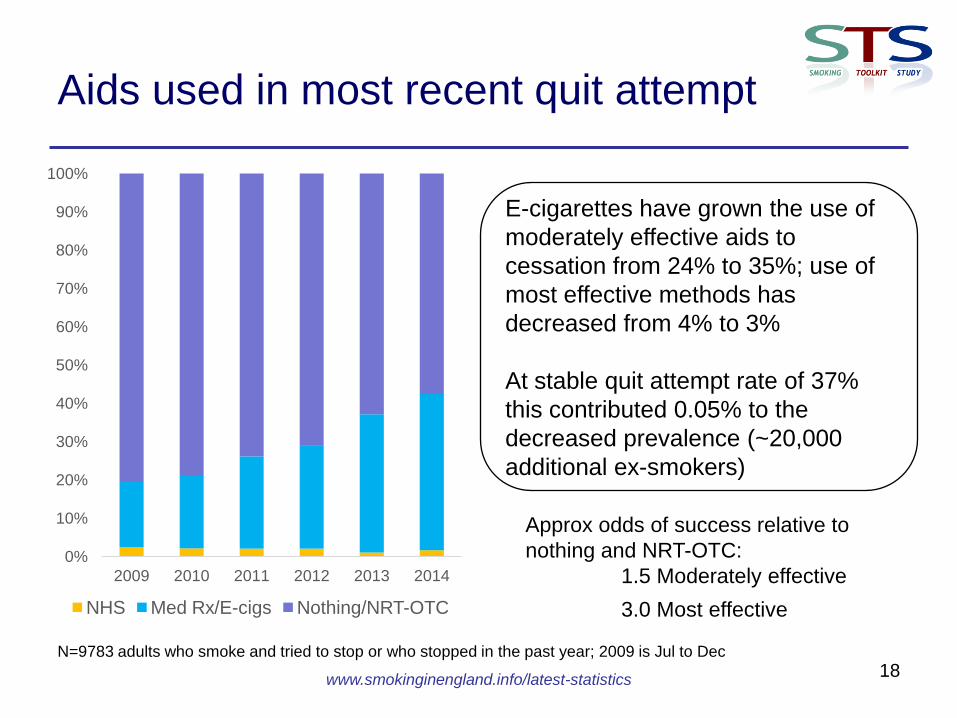
Aids used in most recent quit attempt
0%
10%
20%
30%
40%
50%
60%
70%
80%
90%
100%
2009 2010 2011 2012 2013 2014
NHS Med Rx/E-cigs Nothing/NRT-OTC
18 N=9783 adults who smoke and tried to stop or who stopped in the past year; 2009 is Jul to Dec
E-cigarettes have grown the use of
moderately effective aids to
cessation from 24% to 35%; use of
most effective methods has
decreased from 4% to 3%
At stable quit attempt rate of 37%
this contributed 0.05% to the
decreased prevalence (~20,000
additional ex-smokers)
Approx odds of success relative to
nothing and NRT-OTC:
1.5 Moderately effective
3.0 Most effective
www.smokinginengland.info/latest-statistics
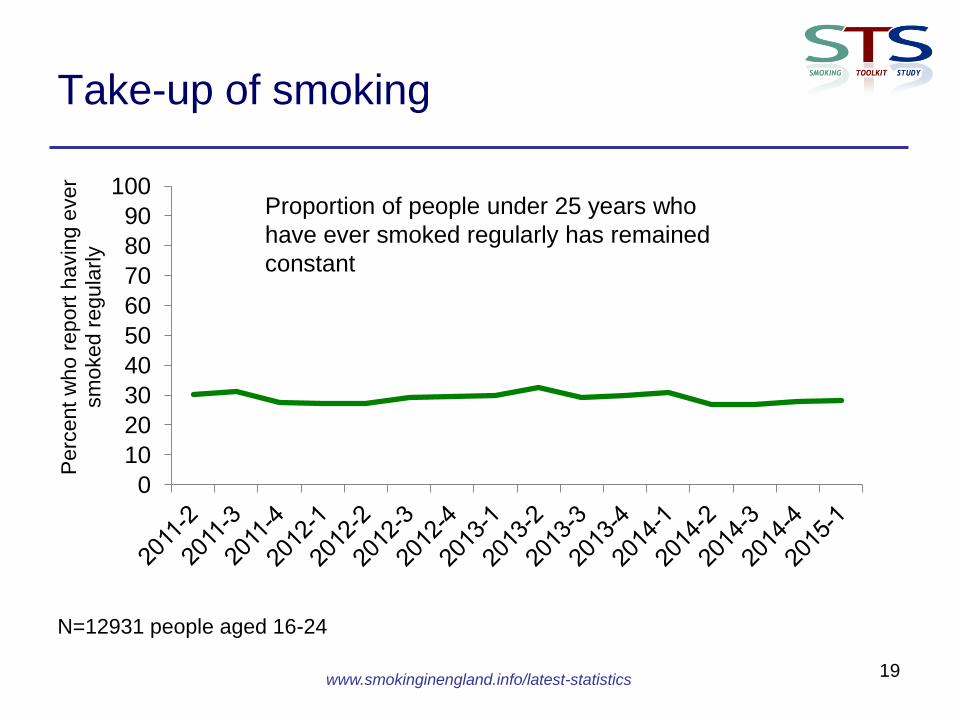
Take-up of smoking
19
0
10
20
30
40
50
60
70
80
90
100
Perc
ent
who r
eport
havin
g e
ver
sm
oked r
egula
rly
N=12931 people aged 16-24
Proportion of people under 25 years who
have ever smoked regularly has remained
constant
www.smokinginengland.info/latest-statistics
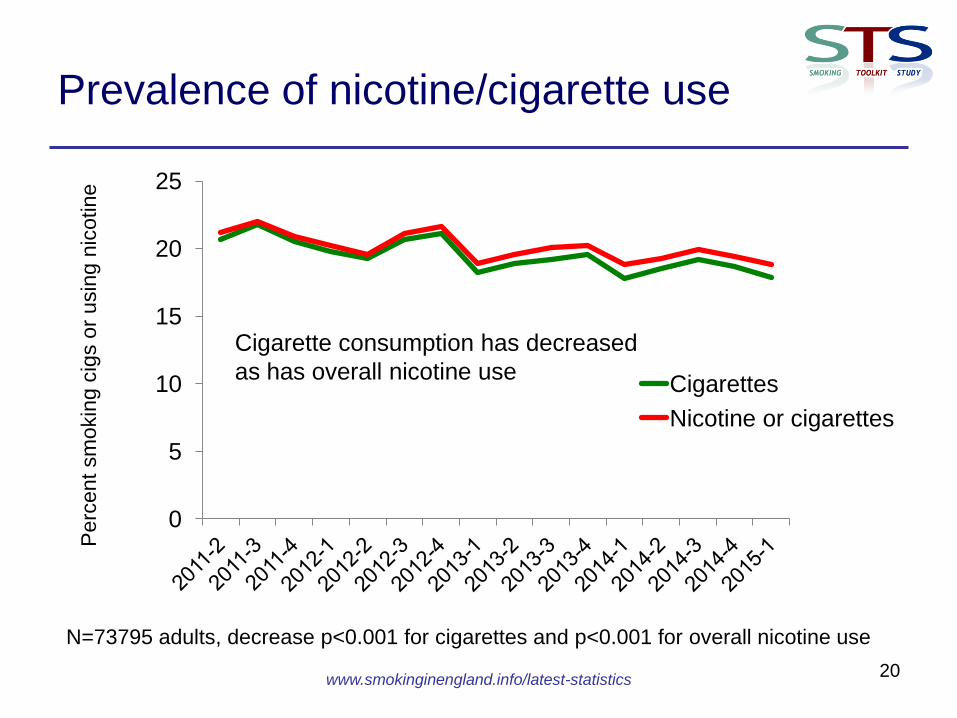
Prevalence of nicotine/cigarette use
20
0
5
10
15
20
25
Perc
ent
sm
okin
g c
igs o
r usin
g n
icotine
Cigarettes
Nicotine or cigarettes
N=73795 adults, decrease p<0.001 for cigarettes and p<0.001 for overall nicotine use
Cigarette consumption has decreased
as has overall nicotine use
www.smokinginengland.info/latest-statistics
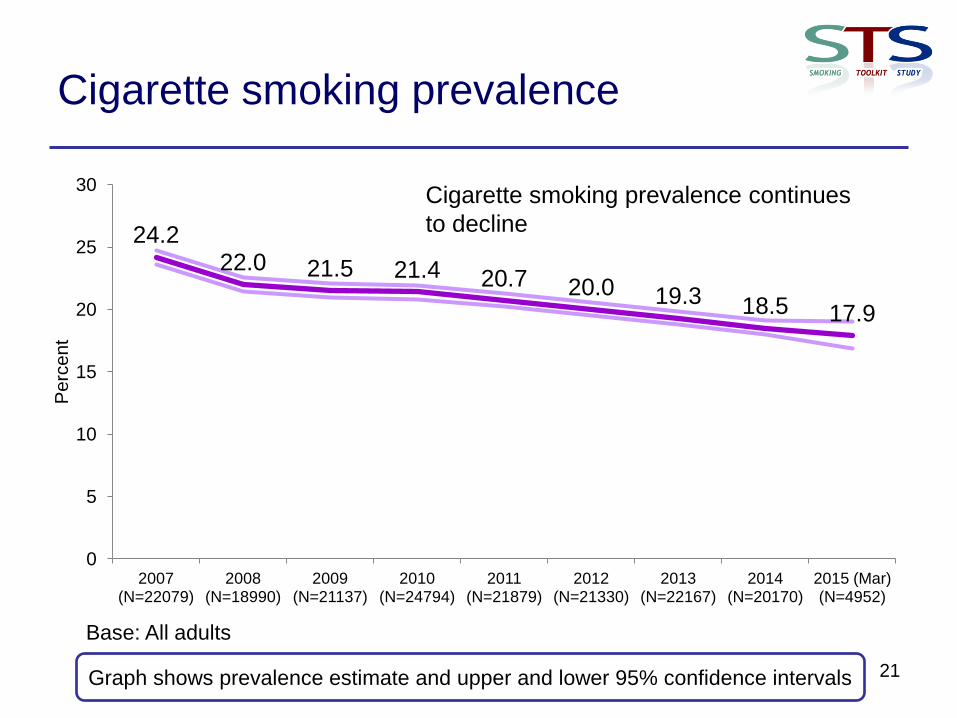
Cigarette smoking prevalence
24.2 22.0 21.5 21.4 20.7 20.0 19.3 18.5 17.9
0
5
10
15
20
25
30
2007 (N=22079)
2008 (N=18990)
2009 (N=21137)
2010 (N=24794)
2011 (N=21879)
2012 (N=21330)
2013 (N=22167)
2014 (N=20170)
2015 (Mar) (N=4952)
Pe
rce
nt
21 Graph shows prevalence estimate and upper and lower 95% confidence intervals
Base: All adults
Cigarette smoking prevalence continues
to decline
www.smokinginengland.info/latest-statistics
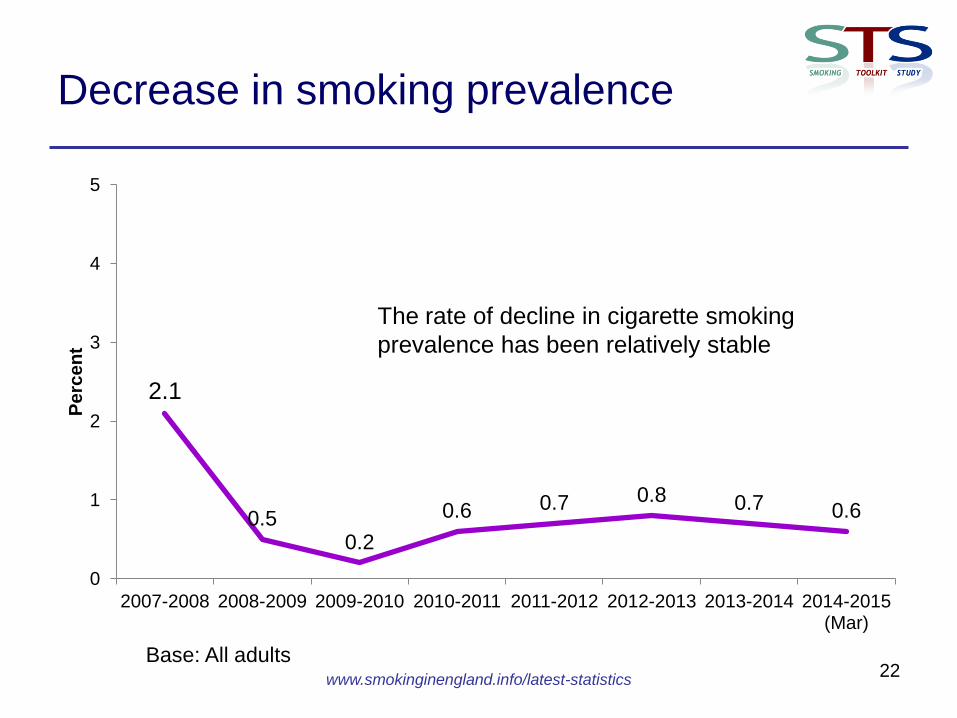
Decrease in smoking prevalence
2.1
0.5 0.2
0.6 0.7 0.8 0.7 0.6
0
1
2
3
4
5
2007-2008 2008-2009 2009-2010 2010-2011 2011-2012 2012-2013 2013-2014 2014-2015 (Mar)
Pe
rce
nt
22 Base: All adults
The rate of decline in cigarette smoking
prevalence has been relatively stable
www.smokinginengland.info/latest-statistics
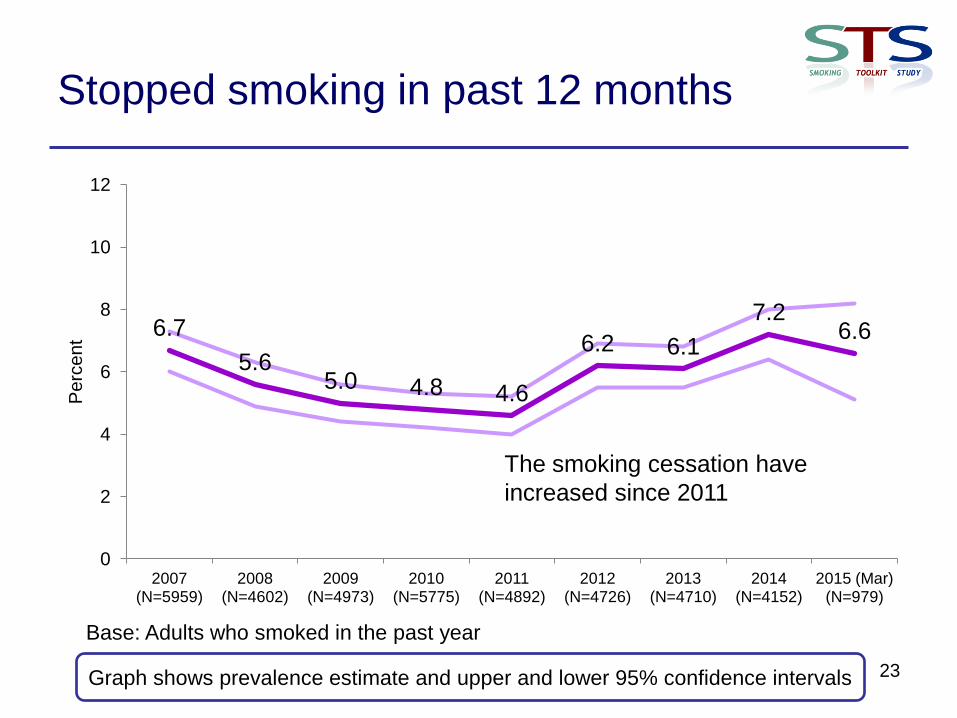
Stopped smoking in past 12 months
6.7
5.6 5.0 4.8 4.6
6.2 6.1
7.2 6.6
0
2
4
6
8
10
12
2007 (N=5959)
2008 (N=4602)
2009 (N=4973)
2010 (N=5775)
2011 (N=4892)
2012 (N=4726)
2013 (N=4710)
2014 (N=4152)
2015 (Mar) (N=979)
Pe
rce
nt
23 Graph shows prevalence estimate and upper and lower 95% confidence intervals
Base: Adults who smoked in the past year
The smoking cessation have
increased since 2011
www.smokinginengland.info/latest-statistics
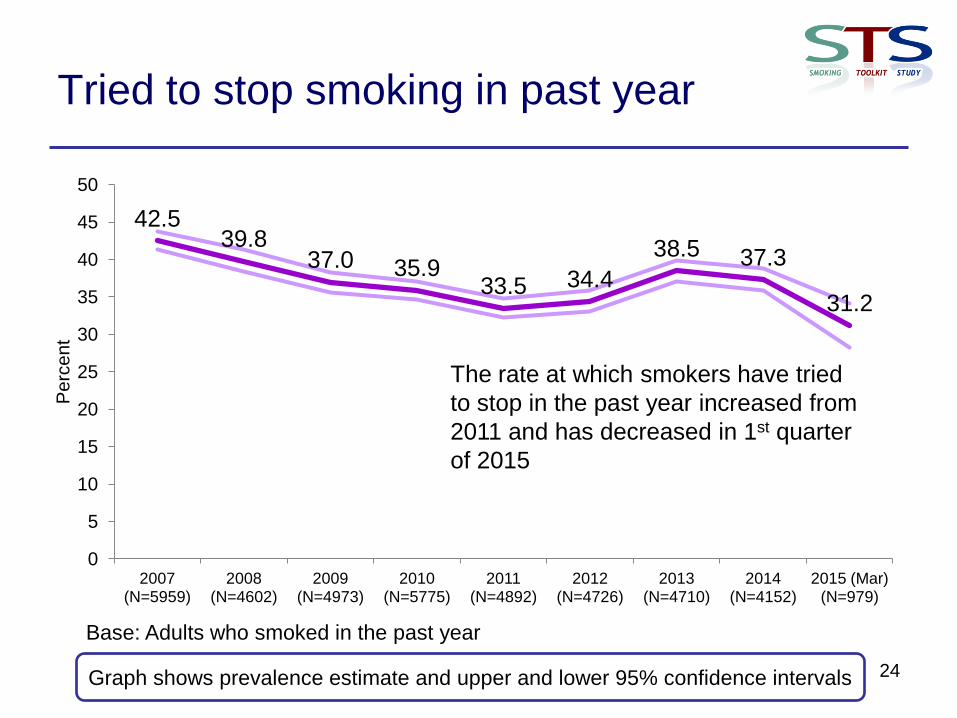
Tried to stop smoking in past year
42.5 39.8
37.0 35.9 33.5 34.4
38.5 37.3
31.2
0
5
10
15
20
25
30
35
40
45
50
2007 (N=5959)
2008 (N=4602)
2009 (N=4973)
2010 (N=5775)
2011 (N=4892)
2012 (N=4726)
2013 (N=4710)
2014 (N=4152)
2015 (Mar) (N=979)
Pe
rce
nt
24 Graph shows prevalence estimate and upper and lower 95% confidence intervals
Base: Adults who smoked in the past year
The rate at which smokers have tried
to stop in the past year increased from
2011 and has decreased in 1st quarter
of 2015
www.smokinginengland.info/latest-statistics
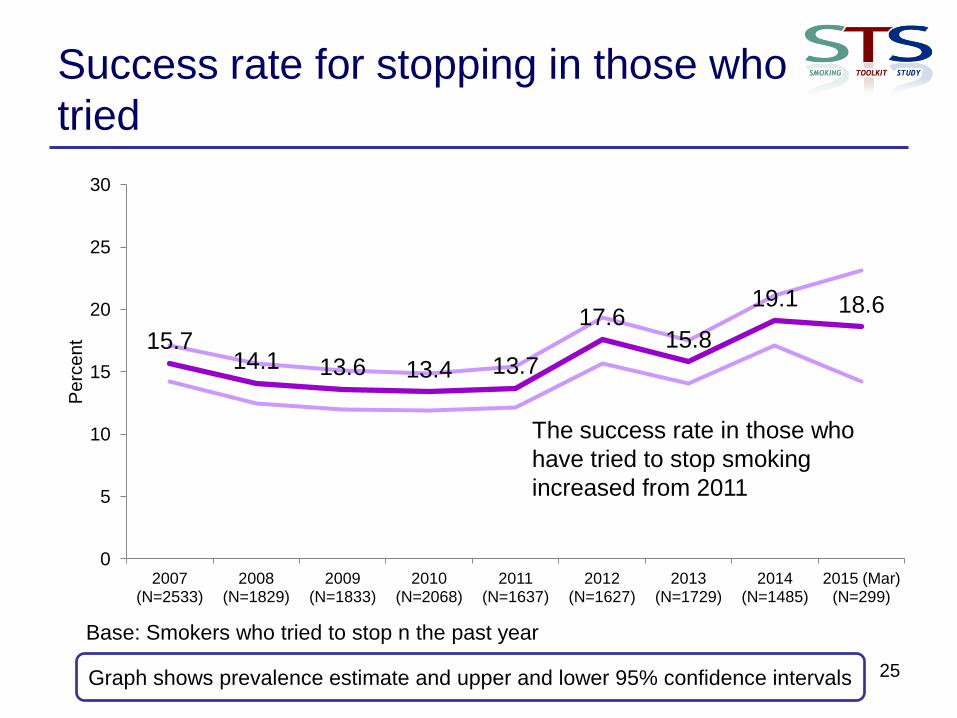
Success rate for stopping in those who
tried
15.7 14.1 13.6 13.4 13.7
17.6 15.8
19.1 18.6
0
5
10
15
20
25
30
2007 (N=2533)
2008 (N=1829)
2009 (N=1833)
2010 (N=2068)
2011 (N=1637)
2012 (N=1627)
2013 (N=1729)
2014 (N=1485)
2015 (Mar) (N=299)
Pe
rce
nt
25 Graph shows prevalence estimate and upper and lower 95% confidence intervals
Base: Smokers who tried to stop n the past year
The success rate in those who
have tried to stop smoking
increased from 2011
www.smokinginengland.info/latest-statistics
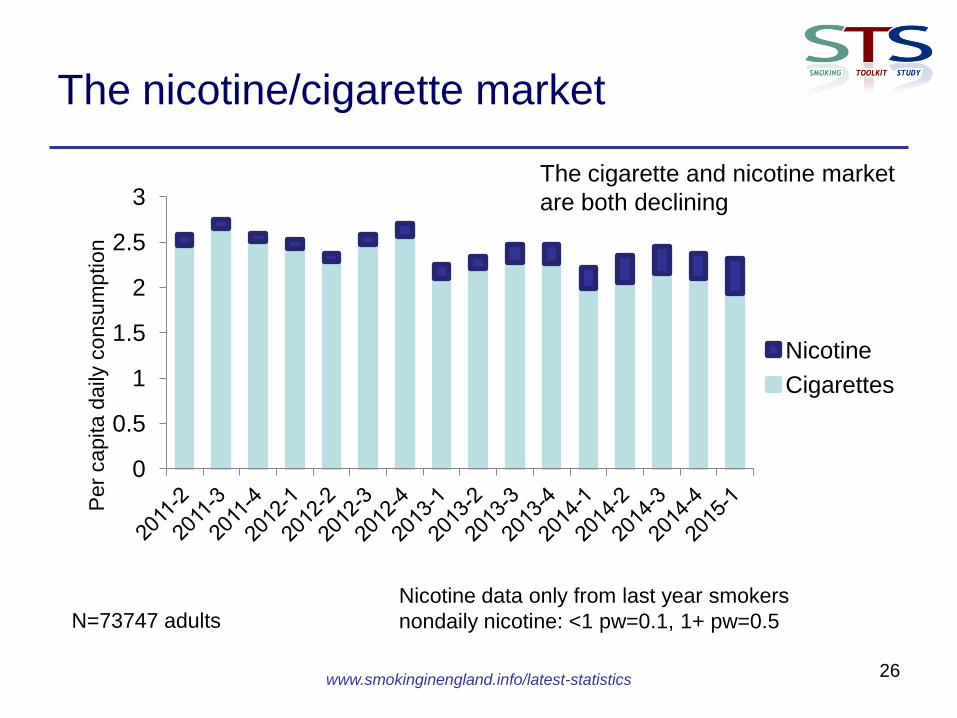
The nicotine/cigarette market
26
0
0.5
1
1.5
2
2.5
3
Per
capita d
aily
consum
ption
Nicotine
Cigarettes
N=73747 adults
Nicotine data only from last year smokers
nondaily nicotine: <1 pw=0.1, 1+ pw=0.5
The cigarette and nicotine market
are both declining
www.smokinginengland.info/latest-statistics
Conclusions
• Growth in e-cigarette use has slowed and contrary to earlier
indications appears fairly stable over the past 2 years
• Growth in electronic cigarette use has been accompanied by a
reduction, albeit smaller, in use of licensed nicotine products and
prescription medication but the trajectories are very different
suggesting no causal connection
• Rates of quitting smoking increased from 2011
• Use of e-cigarettes by never smokers remains very rare and similar
to use of licensed nicotine products
• E-cigarettes may have helped approximately 20,000 smokers to
stop in 2014 who would not have stopped otherwise
27