trends in retail prices of brand name prescription drugs
TRANSCRIPT
JUNE 2021
Rx Price Watch Report
AARP PUBLIC POLICY INSTITUTE
Stephen W. SchondelmeyerPRIME Institute, University of Minnesota
Leigh PurvisAARP Public Policy Institute
Trends in Retail Prices of Brand Name Prescription Drugs Widely Used by Older Americans, 2006 to 2020
AARP’s Public Policy Institute informs and stimulates public debate on the issues we face as we age. Through research, analysis, and dialogue with the nation’s leading experts, PPI promotes development of sound, creative policies to address our common need for economic security, health care, and quality of life.
The views expressed herein are for information, debate, and discussion, and do not necessarily represent official policies of AARP.

TRENDS IN RETAIL PRICES OF BRAND NAME PRESCRIPTION DRUGS USED BY OLDER AMERICANS, 2006 TO 2020 i
Table of Contents
EXECUTIVE SUMMARY ............................................................................................................................................. 1
INTRODUCTION .............................................................................................................................................................3
FINDINGS ...........................................................................................................................................................................5I. Brand Name Price Trends for Most Widely Used Prescription Drugs ............................................5II. Fifteen-Year Cumulative Price Changes at the Retail Level for Most Widely Used Brand
Name Prescription Drugs, 2006 to 2020 .................................................................................................7III. A Wide Range of Brand Name Drug Price Increases Occurred in 2020 ........................................8IV. Retail Price Changes for Most Widely Used Brand Name Prescription Drugs by
Manufacturer ................................................................................................................................................9V. Retail Price Changes for Most Widely Used Brand Name Prescription Drugs by Therapeutic
Class ...............................................................................................................................................................10
CONCLUDING OBSERVATIONS ..............................................................................................................................12
APPENDIX A. DETAILED METHODOLOGY AND DESCRIPTION OF RETAIL PRICE DATA ..... 13
APPENDIX B. AARP MARKET BASKET EFFECT OF BRAND NAME DRUGS FACING GENERIC COMPETITION ........................................................................................................................................21
FiguresFigure 1. Average Annual Brand Name Drug Prices Continue to Grow Faster than General
Inflation in 2020 ..........................................................................................................................................5
Figure 2. Rolling Average and Point-to-Point Changes in Retail Prices for Most Widely Used Brand Name Prescription Drugs Were Consistently above Inflation from 2006 to 2020 ........6
Figure 3. The Average Annual Cost of Brand Name Drugs Would Be Substantially Lower if Retail Price Changes Were Limited to General Inflation .................................................................7
Figure 4. Retail Prices Changed by Less than 5 percent in 2020 for the Vast Majority of Most Widely Used Brand Name Drugs ............................................................................................................8
Figure 5. Four Widely Used Brand Name Drugs Had One-Year Retail Price Increases of 8 percent or More in 2020 ............................................................................................................................................9
Figure 6. Retail Prices for Widely Used Brand Name Drug Products Increased by More than General Inflation for Majority of Manufacturers in 2020 ..............................................................10
Figure 7. All But Three Therapeutic Classes for Brand Name Drugs Had Retail Price Increases That Met or Exceeded the Rate of General Inflation in 2020 ........................................................ 11
Figure B-1. Annual Retail Price Trends for Chronic- and Acute-Use Brand Name Drugs with and without Generic Competition in 2020 ..................................................................................................21
Figure B-2. Retail Price Trends for Chronic- and Acute-Use Brand Name Drugs with and without Generic Competition, 2006 to 2020 ..................................................................................................... 22
ii TRENDS IN RETAIL PRICES OF BRAND NAME PRESCRIPTION DRUGS USED BY OLDER AMERICANS, 2006 TO 2020
TablesTable A-1. Average Annual Percent Change in Price for Hypothetical Prescription Drug A, 2020. ........18
Table A-2. Average Changes in Price and Cost of Therapy for 10 Hypothetical Prescription Drugs, 2020. ................................................................................................................................................18
Table A-3. Recalculating Weights When Prescription Drugs Drop Out of the Sample. ............................ 20

TRENDS IN RETAIL PRICES OF BRAND NAME PRESCRIPTION DRUGS USED BY OLDER AMERICANS, 2006 TO 2020 1
Executive Summary
Retail prices for widely used brand name prescription drugs increased substantially faster than general inflation in every year from 2006 to 2020. Between 2019 and 2020, retail prices for 260 brand name prescription drugs widely used by older Americans, including Medicare beneficiaries, increased by an average of 2.9 percent. In contrast, the general inflation rate was 1.3 percent over the same period. Brand name drug prices have routinely increased much faster than general inflation over the past 16 years—the entire period during which the AARP Public Policy Institute has been publishing this report series.
Increases in the retail price of brand name prescription drugs have a corresponding impact on the cost of therapy for the individual and for all other payers. In 2020, the average cost of therapy for a brand name prescription drug, based on the market basket in this study, was $6,600 per year. On average, older Americans take 4.7 prescription drugs every month. Consequently, an older adult who uses brand name prescription drugs is likely to have experienced an average annual retail cost of drug therapy of more than $31,000 in 2020. This amount exceeds the median annual income for individual Medicare beneficiaries of $29,650.
Notably, the average annual cost of drug therapy for one brand name drug used on a chronic basis would have been almost $3,700 lower in 2020 ($2,911 v. $6,604) had the drugs’ price changes been limited to the rate of general inflation between 2006 and 2020.
If brand name drug price inflation continues unabated, a growing number of older Americans will face drug costs that exceed their median annual income and will not be able to take their medications as needed. This ever-expanding affordability problem will lead to poorer health outcomes and higher healthcare costs in the future.
OVERVIEW OF FINDINGS• Between 2019 and 2020, retail prices for
260 widely used brand name prescription drugs increased by 2.9 percent, more than two times faster than general inflation (1.3 percent).
— Despite being more than twice as high as inflation, this was the slowest average annual price increase for widely used brand name prescription drugs since at least 2006.
• The average annual price increase for brand name prescription drugs widely used by older Americans has consistently slowed since 2014, which saw a double-digit percentage increase.
• The average annual cost for one brand name medication used on a chronic basis was over $6,600 in 2020, more than $1,500 higher than the average annual cost of therapy in 2015.
— For the average older American taking 4.7 prescription drugs per month, the annual cost of therapy would have been more than $31,000 for 2020—more than three and a half times the cost seen 15 years earlier.
• The average annual cost for one brand name medication used on a chronic basis would have been $2,911 in 2020—almost $3,700 lower—if the retail price changes for these products had been limited to general inflation between 2006 and 2020.
— For the average older American taking 4.7 prescription drugs per month, if drug prices had increased at the rate of general inflation, the annual cost of therapy that would have been more than $17,000 less than the actual annual cost of therapy experienced in 2020 ($13,682 v. $31,037).
• Between January 2006 and December 2020, retail prices for 65 chronic-use brand name drugs that had been on the market since the beginning of the study period increased cumulatively by an average of 276.8 percent.
2 TRENDS IN RETAIL PRICES OF BRAND NAME PRESCRIPTION DRUGS USED BY OLDER AMERICANS, 2006 TO 2020
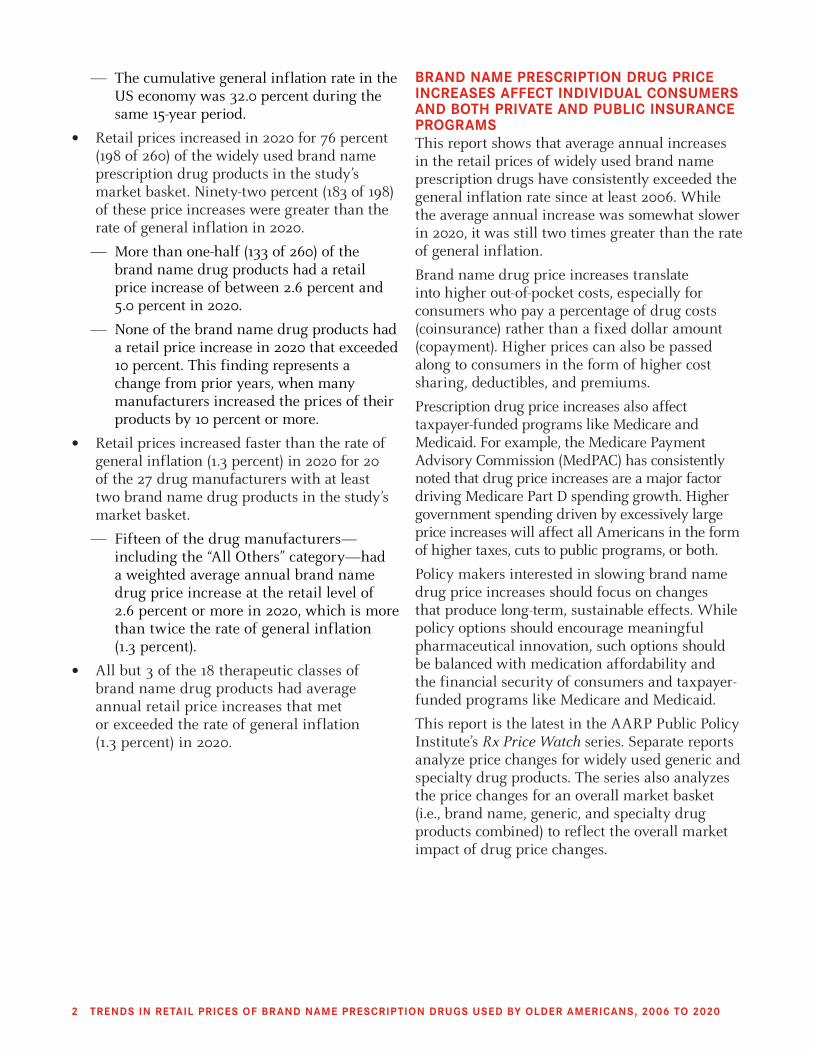
— The cumulative general inflation rate in the US economy was 32.0 percent during the same 15-year period.
• Retail prices increased in 2020 for 76 percent (198 of 260) of the widely used brand name prescription drug products in the study’s market basket. Ninety-two percent (183 of 198) of these price increases were greater than the rate of general inflation in 2020.
— More than one-half (133 of 260) of the brand name drug products had a retail price increase of between 2.6 percent and 5.0 percent in 2020.
— None of the brand name drug products had a retail price increase in 2020 that exceeded 10 percent. This finding represents a change from prior years, when many manufacturers increased the prices of their products by 10 percent or more.
• Retail prices increased faster than the rate of general inflation (1.3 percent) in 2020 for 20 of the 27 drug manufacturers with at least two brand name drug products in the study’s market basket.
— Fifteen of the drug manufacturers—including the “All Others” category—had a weighted average annual brand name drug price increase at the retail level of 2.6 percent or more in 2020, which is more than twice the rate of general inflation (1.3 percent).
• All but 3 of the 18 therapeutic classes of brand name drug products had average annual retail price increases that met or exceeded the rate of general inflation (1.3 percent) in 2020.
BRAND NAME PRESCRIPTION DRUG PRICE INCREASES AFFECT INDIVIDUAL CONSUMERS AND BOTH PRIVATE AND PUBLIC INSURANCE PROGRAMSThis report shows that average annual increases in the retail prices of widely used brand name prescription drugs have consistently exceeded the general inflation rate since at least 2006. While the average annual increase was somewhat slower in 2020, it was still two times greater than the rate of general inflation.
Brand name drug price increases translate into higher out-of-pocket costs, especially for consumers who pay a percentage of drug costs (coinsurance) rather than a fixed dollar amount (copayment). Higher prices can also be passed along to consumers in the form of higher cost sharing, deductibles, and premiums.
Prescription drug price increases also affect taxpayer-funded programs like Medicare and Medicaid. For example, the Medicare Payment Advisory Commission (MedPAC) has consistently noted that drug price increases are a major factor driving Medicare Part D spending growth. Higher government spending driven by excessively large price increases will affect all Americans in the form of higher taxes, cuts to public programs, or both.
Policy makers interested in slowing brand name drug price increases should focus on changes that produce long-term, sustainable effects. While policy options should encourage meaningful pharmaceutical innovation, such options should be balanced with medication affordability and the financial security of consumers and taxpayer-funded programs like Medicare and Medicaid.
This report is the latest in the AARP Public Policy Institute’s Rx Price Watch series. Separate reports analyze price changes for widely used generic and specialty drug products. The series also analyzes the price changes for an overall market basket (i.e., brand name, generic, and specialty drug products combined) to reflect the overall market impact of drug price changes.
TRENDS IN RETAIL PRICES OF BRAND NAME PRESCRIPTION DRUGS USED BY OLDER AMERICANS, 2006 TO 2020 3
Introduction
1 The AARP Public Policy Institute in its Rx Price Watch series provides reports with separate analyses of the price changes for three different segments of the pharmaceutical market: brand name, generic, and specialty drug products. These three market baskets are important because a different mix of drug manufacturers typically makes the drug products in each segment and each of these segments is subject to unique market dynamics, pricing, and related behaviors. In addition, the Rx Price Watch series also reports the price change for an overall market basket (i.e., brand name, generic, and specialty drug products combined) to reflect the overall market impact of drug price changes. Some critics have argued that the brand name price index report alone overstates the effect of drug price changes on the overall prescription drug market. Those critics argue that an overall measure should include the effect of generic prescription drug price competition and the impact of generic substitution. This is precisely why the AARP Rx Price Watch series of reports also provides an overall market basket (including brand name, generic, and specialty drug products) to examine the price change impact for the overall prescription drug market. While this overall perspective is useful for those interested in understanding the industrial economics of the entire prescription drug market, consumers have proved to be considerably more interested in the price trend for the specific products that they are taking as an individual rather than all drug products on the market. In addition, separate analyses of the different market segments (i.e., brand name, generic, and specialty drug products) is important because they represent unique and distinct segments in the prescription drug market, and they provide an indication of policy changes that may be warranted in the various market segments. Previous reports from this series are on the AARP website at http://www.aarp.org/health/medicare-insurance/info-04-2009/rx_watchdog.html and http://www.aarp.org/rxpricewatch.
2 The retail prices used in this report are derived from the IBM® MarketScan® Commercial Database and MarketScan® Medicare Supplemental Database (IBM® MarketScan® Research Databases). The prices reflect the total price for a specific prescription that a pharmacy benefit manager (PBM) bills to a specific health plan for consumers enrolled in employer-sponsored or government-sponsored (i.e., Medicare or Medicaid) health plans and not simply the out-of-pocket cost (such as the copay) that a consumer would pay at the pharmacy. These amounts may or may not reflect what the PBM paid the pharmacy or the usual and customary price that a pharmacy would charge a cash-pay consumer for the same prescription.
3 Medicare Payment Advisory Commission (MedPAC), July 2020 Data Book: Health Care Spending and the Medicare Program (Washington, DC: MedPAC, July 2020).
4 The median annual income for Medicare beneficiaries was $29,650 in 2019. See Wyatt Koma, Tricia Neuman, Gretchen Jacobson, and Karen Smith, Medicare Beneficiaries’ Financial Security before the Coronavirus Pandemic (Washington, DC: Kaiser Family Foundation, April 2020). This figure is considerably higher than the median annual income for Medicare beneficiaries reported in the 2019 American Community Survey ($22,500; unpublished analysis by the AARP Public Policy Institute).
AARP’s Public Policy Institute finds that average price increases at the retail level for brand name prescription drugs widely used by older Americans, including Medicare beneficiaries, far outstripped the price increases for other consumer goods and services between 2006 and 2020. Brand name drug prices have routinely increased much faster than general inflation over the past 15 years—the entire period since the beginning of our report series on prescription drug prices in 2004.1 During 2020, the average annual increase in prices2 at the retail level for 260 brand name prescription drugs widely used by older Americans was 2.9 percent—the continuation of a slowing trend that began in 2014. In contrast, the rate of general inflation in the US economy was less than one-half as much at 1.3 percent in 2020.
Increases in the retail price of brand name prescription drugs have a corresponding impact on the cost of drug therapy for individual consumers and for all types of payers. In 2020, the annual retail cost of drug therapy for a
brand name prescription drug, based on the market basket in this study, averaged $6,600 per year. Older Americans receive an average of 55.9 prescriptions every year—or 4.7 prescriptions per month.3 Consequently, older adults who use brand name prescription drugs are likely to have experienced an average annual retail cost of drug therapy totaling more than $31,000 in 2020. This annual retail cost of brand name prescription drugs exceeds the median annual income for a Medicare beneficiary ($29,650).4
Notably, the average annual cost of drug therapy for 1 brand name drug used on a chronic basis would have been almost $3,700 lower in 2020 (i.e., $2,911 v. $6,604) if the retail price changes had not substantially exceeded the rate of general inflation between 2006 and 2020. For the average older American taking 4.7 prescription drugs per month, this would translate into an annual cost of therapy of $13,682, which is more than $17,000 less than the actual average cost of therapy experienced in 2020 ($31,037).
4 TRENDS IN RETAIL PRICES OF BRAND NAME PRESCRIPTION DRUGS USED BY OLDER AMERICANS, 2006 TO 2020
Prescription drug price increases affect all types of payers, including individuals, employers, private insurers, and taxpayer-funded programs such as Medicare and Medicaid. For example, the Medicare Payment Advisory Commission (MedPAC) has consistently noted that drug price increases are a major factor driving Medicare Part D spending growth.5 These spending increases, driven by already high and continuingly growing drug prices, will affect all Americans in some way. Those with private health insurance will pay more in cost sharing and higher premiums for their health care coverage.6 In addition, increased government spending on prescription drugs will ultimately lead to higher taxes and/or cuts to public programs.
5 Medicare Payment Advisory Commission (MedPAC), June 2018 Report to the Congress: Medicare and the Health Care Delivery System (Washington, DC: MedPAC, June 2018); Medicare Payment Advisory Commission (MedPAC), March 2021 Report to the Congress: Medicare Payment Policy (Washington, DC: MedPAC, March 2021).
6 American Academy of Actuaries, Prescription Drug Spending in the U.S. Health Care System: An Actuarial Perspective (Washington, DC: American Academy of Actuaries, March 2018).
This report presents annual and 15-year cumulative price changes through the end of 2020. The first set of findings shows annual rates of change in retail prices for widely used brand name drugs from 2006 through 2020, using both rolling average and point-to-point methods (see Appendix A). The point-to-point method examines the distribution of price changes and differences in average percent changes of retail level prices for individual drug products, specific manufacturers, and specific therapeutic categories. The second set of findings summarizes the cumulative impact of retail level price changes for brand name drugs across the entire 15-year period from 2006 through 2020.

TRENDS IN RETAIL PRICES OF BRAND NAME PRESCRIPTION DRUGS USED BY OLDER AMERICANS, 2006 TO 2020 5
Findings
7 Some critics of the Rx Price Watch reports have suggested that this analysis should exclude brand name drug products in our market basket that subsequently face generic competition because they may be skewing the results upward. Appendix B provides an analysis of the chronic-use brand name drug products that face generic competition (62 drug products) and chronic-use brand name drug products that do not face generic competition (148 drug products). In 2020, the average annual price increase for the chronic-use brand name prescription drug products with generic competition was 2.1 percent while the average annual price increase for the brand name prescription drug products with no generic competition was 3.0 percent. This indicates that the inclusion of brand name drugs that face generic competition may instead skew our results downward (see Appendix B).
8 When measured as a 12-month rolling average and weighted by actual 2018 retail prescription sales to older Americans ages 50 and above, including Medicare beneficiaries.
I. BRAND NAME PRICE TRENDS FOR MOST WIDELY USED PRESCRIPTION DRUGSThe annual percent change in retail level prices for brand name prescription drugs has consistently increased faster than general inflation. • Retail prices for the 260 brand name
drug products7 most widely used by older Americans rose 2.9 percent in 2020 compared to their 2019 prices (Figure 1).8
• The average annual price increase in 2020 was more than twice the rate of general inflation (2.9 percent v. 1.3 percent, respectively).
— Despite being more than twice as high as inflation, this was the slowest average annual price increase for widely used brand name prescription drugs since at least 2006.
— Notably, this comparatively slow rate of increase occurred in the absence of meaningful legislative change, making it uncertain whether this trend will continue.
• The average annual price increase for these brand name prescription drug products has consistently slowed since 2014, which saw a double-digit percentage increase.
5.2% 4.9%6.4%
7.9%6.8%
7.5%8.8%
12.0%
13.8%12.3%
9.5%
7.7%6.9%
3.2% 2.9%3.2% 2.9%
3.8%
-0.3%
1.6%3.1%
2.1% 1.5% 1.6%0.1%
1.3%2.1% 2.4%
1.8% 1.3%
2006 2007 2008 2009 2010 2011 2012 2013 2014 2015 2016 2017 2018 2019 2020
Ave
rage
Ann
ual P
erce
ntag
e C
hang
e
Brand Name Drug Prices (260 top drug products)General Inflation (CPI-U)
Note: Calculations of the average annual brand name drug price change include the 260 drug products most widely used by older Americans (see Appendix A).
Prepared by the AARP Public Policy Institute and the PRIME Institute, University of Minnesota, based on data from IBM MarketScan® Research Databases and Medi-Span Price Rx Pro®.
FIGURE 1 Average Annual Brand Name Drug Prices Continue to Grow Faster than General Inflation in 2020
6 TRENDS IN RETAIL PRICES OF BRAND NAME PRESCRIPTION DRUGS USED BY OLDER AMERICANS, 2006 TO 2020
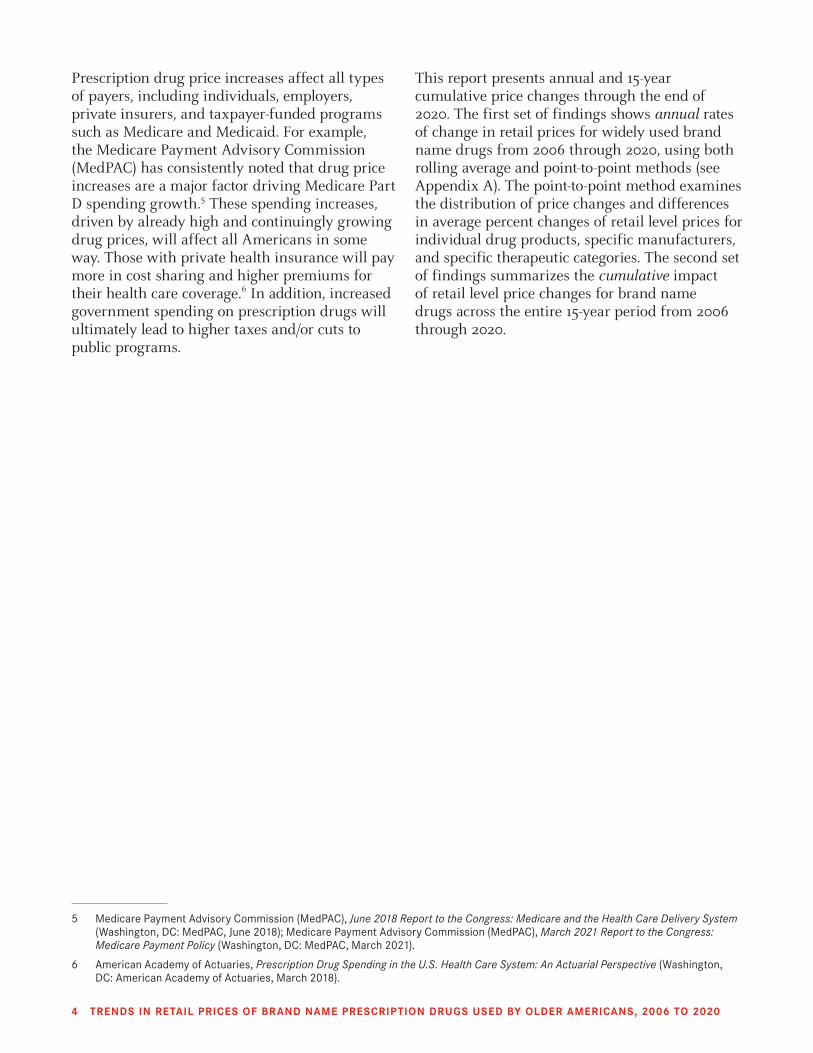
• Notably, brand name prescription drug price increases have continued to substantially exceed general inflation despite widespread public scrutiny and criticism of drug pricing practices.9
The price change for brand name drug products reported at the retail level in Figure 1 averages annual point-to-point price changes for each month in the preceding 12-month period (referred to as a rolling average change), smoothing over the entire year the annual change in brand name drug price that occurs for a single month (referred to as an annual point-to-point change).
Figure 2 shows the percent change in brand name drug prices for each month compared with the same month in the previous year. This trend is presented alongside the 12-month rolling average to allow more detailed examination of the rate
9 Michael Erman and Carl O’Donnell, “Exclusive: Drugmakers to Hike Prices for 2021 as Pandemic, Social Pressure Puts Revenues at Risk,” Reuters, December 31, 2020.
and timing of brand name drug price changes over the entire study period. This analysis reveals three broad trends that have been present since the implementation of Medicare Part D in 2006:
• The retail price of brand name drug products has steadily and often substantially exceeded general inflation for the entire period since 2006.
• Brand name drug price increases at the retail level have been consistently higher than the rate of general inflation.
• The gap between the rate of brand name drug price change and the rate of change in general inflation has fluctuated considerably between 2006 and 2020, ranging from a less than 2-fold difference in the early and latter parts of the study period to a nearly 100-fold difference in 2015.
-2%
0%
2%
4%
6%
8%
10%
12%
14%
16%
18%
Dec
-05
Apr
-06
Aug
-06
Dec
-06
Apr
-07
Aug
-07
Dec
-07
Apr
-08
Aug
-08
Dec
-08
Apr
-09
Aug
-09
Dec
-09
Apr
-10
Aug
-10
Dec
-10
Apr
-11
Aug
-11
Dec
-11
Apr
-12
Aug
-12
Dec
-12
Apr
-13
Aug
-13
Dec
-13
Apr
-14
Aug
-14
Dec
-14
Apr
-15
Aug
-15
Dec
-15
Apr
-16
Aug
-16
Dec
-16
Apr
-17
Aug
-17
Dec
-17
Apr
-18
Aug
-18
Dec
-18
Apr
-19
Aug
-19
Dec
-19
Apr
-20
Aug
-20
Dec
-20
egan
Ch
eagntecre
Palun
An
Annual Percent Price Change (weighted avg. for point-to-point from same month in previous year)Annual Percent Price Change (weighted avg. for 12-month rolling average)General Inflation (CPI-U)
Medicare Part DBecomes Available
Brand name drug manufacturers begin providing coverage gap discounts
Affordable Care Act passed
Note: Calculations of the average annual brand name drug price change include the 260 drug products most widely used by older Americans (see Appendix A).
Prepared by the AARP Public Policy Institute and the PRIME Institute, University of Minnesota, based on data from IBM MarketScan® Research Databases.
FIGURE 2 Rolling Average and Point-to-Point Changes in Retail Prices for Most Widely Used Brand Name Prescription Drugs Were Consistently above Inflation from 2006 to 2020
TRENDS IN RETAIL PRICES OF BRAND NAME PRESCRIPTION DRUGS USED BY OLDER AMERICANS, 2006 TO 2020 7
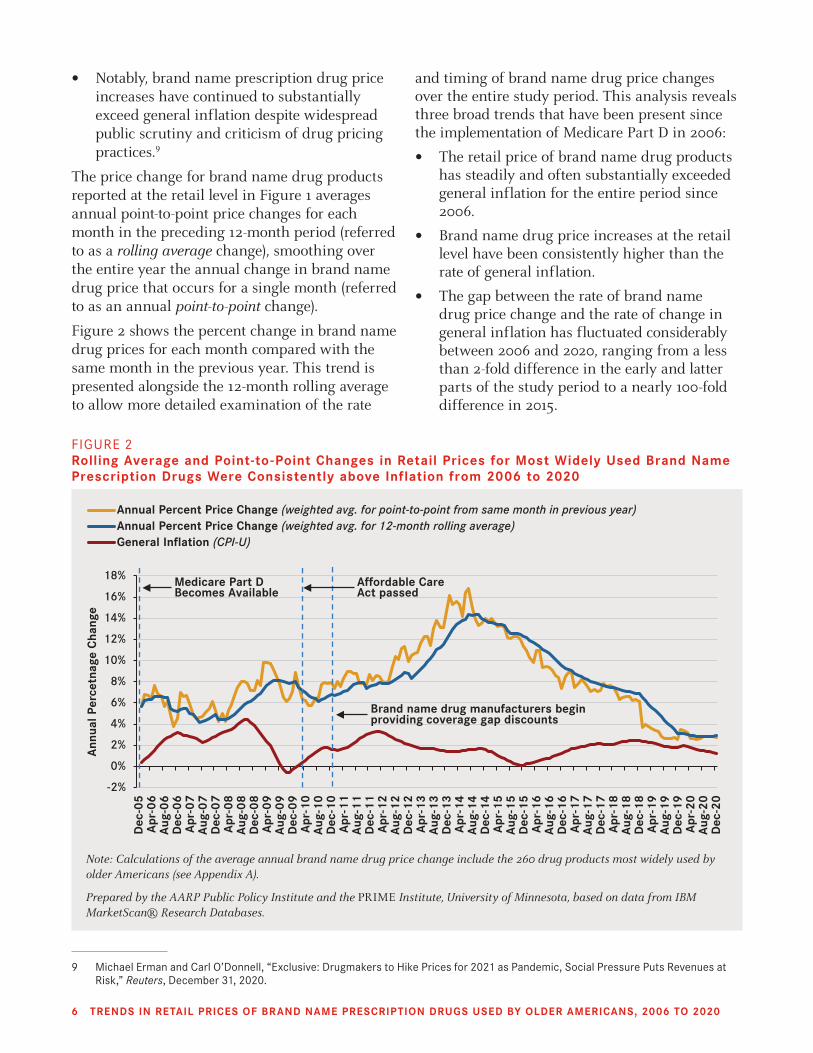
The cost of brand name drug therapy reached $6,600 per drug per year in 2020. Figure 3 presents the retail price for widely used brand name drugs indicated for treating chronic conditions when the price is expressed as an average annual cost of therapy per drug.
• The average cost of chronic therapy was $6,604 per drug per year for brand name prescriptions at the retail level in 2020.
— This average annual cost ($6,604) of brand name prescriptions was more than three and a half times higher than the average annual cost ($1,855) of the same drugs in 2006, the year Medicare implemented its Part D program.
Older Americans receive an average of 55.9 prescriptions per year—or 4.7 prescription drugs per month.10 If they used brand name drugs to treat their chronic conditions, they would have
10 MedPAC, July 2020 Data Book.
11 There is no clear rationale for prescription drug price increases given that launch prices ostensibly reflect the costs associated with developing the drug and future research costs. Aaron S. Kesselheim, Jerry Avorn, and Ameet Sarpatwari, “The High Cost of Prescription Drugs in the United States: Origins and Prospects for Reform,” Journal of the American Medical Association 316, no. 8 (2016): 858–71.
experienced an average annual retail cost for drug therapy of $31,037 for their medications in 2020.
Notably, the average annual cost of therapy per drug for these same brand name drug products would have been $2,911—almost $3,700 lower—in 2020 if the drugs’ retail price changes had not substantially exceeded the rate of general inflation between 2006 and 2020.11 For older Americans using brand name drugs to treat their chronic conditions, this would have amounted to a difference of $17,355 ($13,682 v. $31,037) in their average annual retail cost of therapy in 2020.
II. FIFTEEN-YEAR CUMULATIVE PRICE CHANGES AT THE RETAIL LEVEL FOR MOST WIDELY USED BRAND NAME PRESCRIPTION DRUGS, 2006 TO 2020This AARP report tracked brand name drug prices at the retail level for the 15-year period from December 31, 2005, to December 31, 2020.
$1,855 $1,961 $2,073 $2,263$2,604
$2,923$3,208
$3,733
$4,417
$5,089$5,506
$5,914$6,285 $6,426 $6,604
$1,667 $1,726 $1,658 $1,728 $1,939 $2,123 $2,189 $2,385$2,657 $2,896 $2,922 $2,949 $2,990 $2,966 $2,911
2006 2007 2008 2009 2010 2011 2012 2013 2014 2015 2016 2017 2018 2019 2020
Ann
ual R
etai
l Cos
t of
Thr
eapy
per
Dru
g
Cost of Therapy per Drug (Actual)Cost of Therapy per Drug (Price Growth Limited to General Inflation)
Note: Calculations of the average annual brand name drug price change include the 210 drug products most widely used by older Americans for chronic conditions (see Appendix A).
Prepared by the AARP Public Policy Institute and the PRIME Institute, University of Minnesota, based on data from IBM MarketScan® Research Databases.
FIGURE 3 The Average Annual Cost of Brand Name Drugs Would Be Substantially Lower if Retail Price Changes Were Limited to General Inflation
8 TRENDS IN RETAIL PRICES OF BRAND NAME PRESCRIPTION DRUGS USED BY OLDER AMERICANS, 2006 TO 2020
Thirty percent (78 of 260) of the widely used drugs in the original brand name market basket were on the market for the entire 15-year period (i.e., the end of 2005 through the end of 2020). Eighty-three percent (65 of 78) of those drug products treat chronic conditions and were used to analyze 15-year price trends among widely used brand name drug products.
Cumulatively, the average retail price for these 65 widely used brand name drug products increased 276.8 percent over 15 years, compared with a 32.0 percent increase for general inflation in the same period. This means that brand name drug prices went up more than 8.6 times the rate of general inflation during this 15-year period.12
Ninety-five percent (74 out of 78) of brand name drug products have more than doubled in price while being on the market for the entire 15-year study period.
The 15-year cumulative change in annual brand name drug cost of therapy is substantial.Of the brand name drug products in the AARP market basket that have been on the market since the end of 2005, 83 percent (65 of 78) treat chronic conditions.13 The remaining 13 drug products treat acute or intermittent conditions.
The average annual retail cost of drug therapy for brand name drug products used to treat chronic conditions was $6,446 in 2020, which is an increase of $4,749 over the 2006 annual cost of $1,697.
Seventy-four percent (48 of 65) of the brand name drugs used for chronic conditions that have been on the market since the end of 2005 had annual cost increases of more than $2,000 during the 15year period ending in 2020.
Patients with chronic conditions typically face part or all of the costs associated with their prescription drugs every year for the rest of their lives.
12 The average 15-year cumulative growth rate in retail prices for the 143 brand name drug products (both chronic and acute use) that were on the market for the entire 12 years was 302.5 percent, somewhat higher than the cumulative price increase of 276.8 percent seen after removal of drug products used for acute conditions. This difference is due to numerous acute-use drug products that experienced remarkably high retail price increases between December 2005 and December 2020 (see Appendix B).
13 The drug products in our study market basket were classified based on whether the primary indication for use was for a chronic condition or an acute (or intermittent) condition. Eighty-three percent (65) of the 78 market basket drug products that have been on the market for the 15-year period since the end of 2005 were determined to treat chronic conditions.
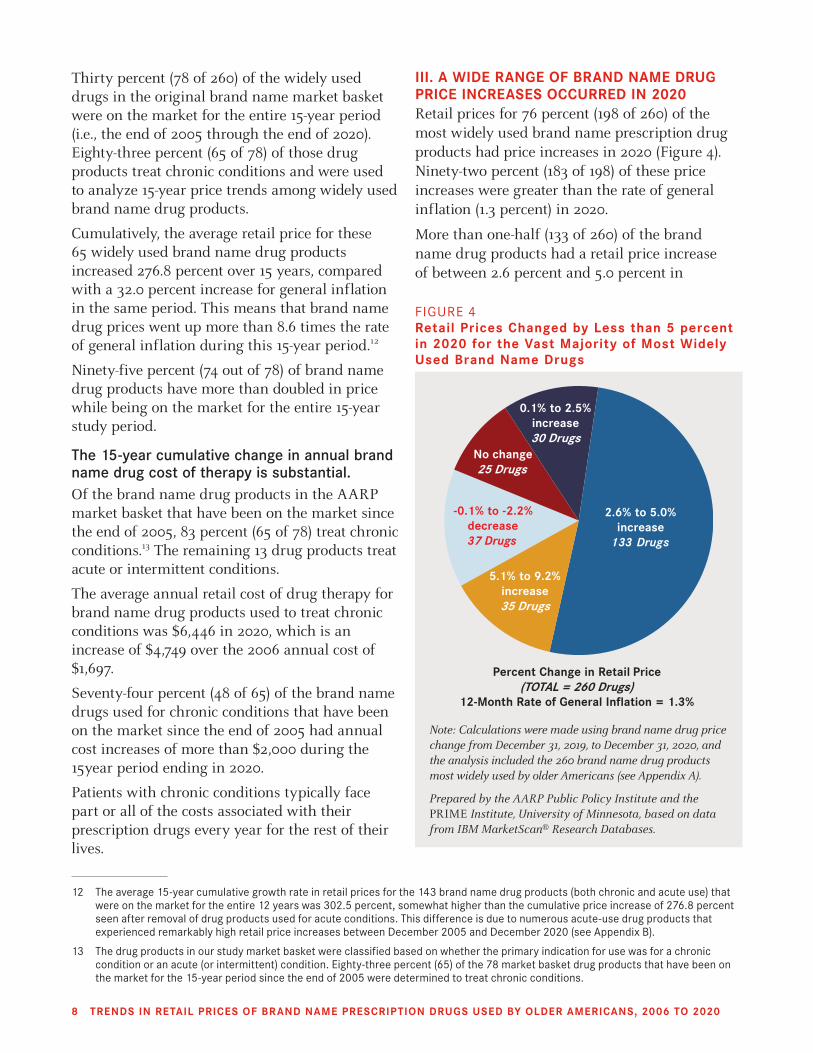
III. A WIDE RANGE OF BRAND NAME DRUG PRICE INCREASES OCCURRED IN 2020Retail prices for 76 percent (198 of 260) of the most widely used brand name prescription drug products had price increases in 2020 (Figure 4). Ninety-two percent (183 of 198) of these price increases were greater than the rate of general inflation (1.3 percent) in 2020.
More than one-half (133 of 260) of the brand name drug products had a retail price increase of between 2.6 percent and 5.0 percent in
-0.1% to -2.2% decrease37 Drugs
No change
0.1% to 2.5% increase30 Drugs
2.6% to 5.0% increase
133 Drugs
5.1% to 9.2% increase35 Drugs
Percent Change in Retail Price(TOTAL = 260 Drugs)
12-Month Rate of General Inflation = 1.3%
25 Drugs
Note: Calculations were made using brand name drug price change from December 31, 2019, to December 31, 2020, and the analysis included the 260 brand name drug products most widely used by older Americans (see Appendix A).
Prepared by the AARP Public Policy Institute and the PRIME Institute, University of Minnesota, based on data from IBM MarketScan® Research Databases.
FIGURE 4 Retail Prices Changed by Less than 5 percent in 2020 for the Vast Majority of Most Widely Used Brand Name Drugs
TRENDS IN RETAIL PRICES OF BRAND NAME PRESCRIPTION DRUGS USED BY OLDER AMERICANS, 2006 TO 2020 9
2020. Another 35 brand name drug products (13 percent) had annual retail price increases of more than 5.0 percent—or almost four times the rate of inflation—in 2020.
Notably, none of the brand name drug products had a retail price increase that exceeded 10 percent. This finding represents a change from prior years, when many manufacturers increased the prices of their products by 10 percent or more. It also coincides with the introduction of new federal and state legislation that would scrutinize or penalize drug companies that implement price increases that exceed specific thresholds.14
Thirty percent (79 of 260) of brand name drug products experienced a price change that did not exceed the corresponding rate of general inflation (1.3 percent) in 2020:
• Thirty-seven drugs experienced a price decrease of -0.1 percent to -2.2 percent.
• Twenty-five drugs did not experience a price change.
• Seventeen drugs experienced a price increase of 0.1 percent to 1.3 percent.
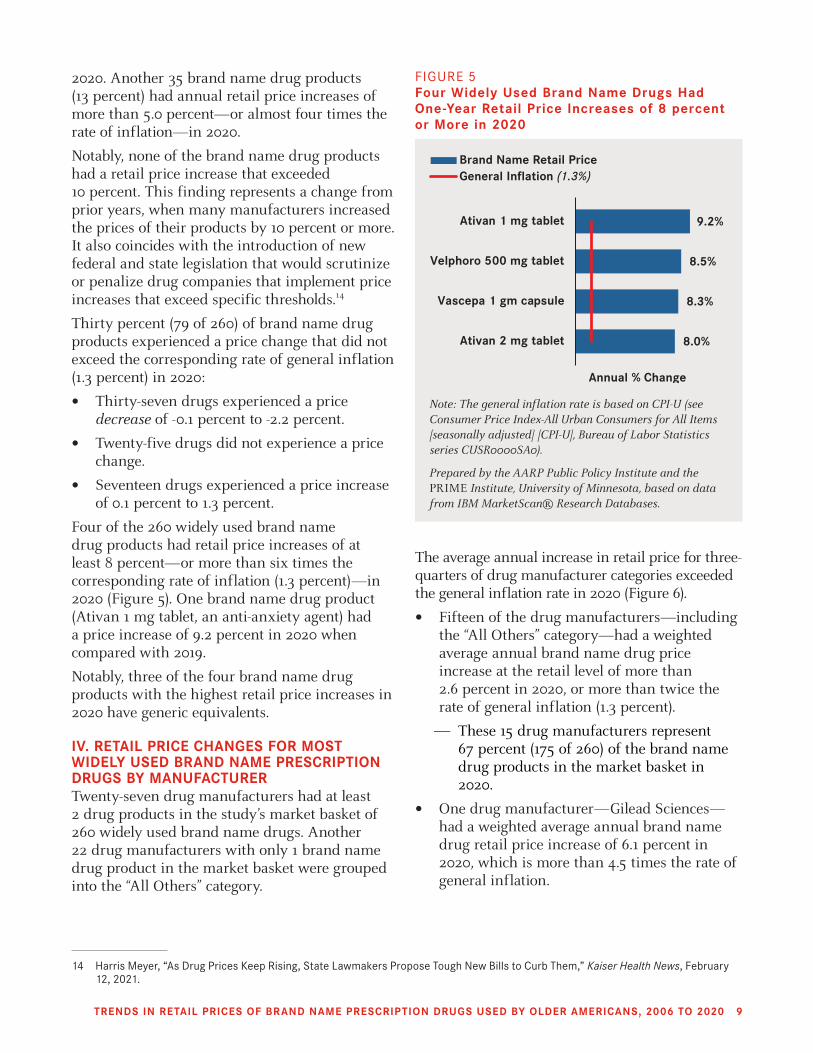
Four of the 260 widely used brand name drug products had retail price increases of at least 8 percent—or more than six times the corresponding rate of inflation (1.3 percent)—in 2020 (Figure 5). One brand name drug product (Ativan 1 mg tablet, an anti-anxiety agent) had a price increase of 9.2 percent in 2020 when compared with 2019.
Notably, three of the four brand name drug products with the highest retail price increases in 2020 have generic equivalents.
IV. RETAIL PRICE CHANGES FOR MOST WIDELY USED BRAND NAME PRESCRIPTION DRUGS BY MANUFACTURER Twenty-seven drug manufacturers had at least 2 drug products in the study’s market basket of 260 widely used brand name drugs. Another 22 drug manufacturers with only 1 brand name drug product in the market basket were grouped into the “All Others” category.
14 Harris Meyer, “As Drug Prices Keep Rising, State Lawmakers Propose Tough New Bills to Curb Them,” Kaiser Health News, February 12, 2021.
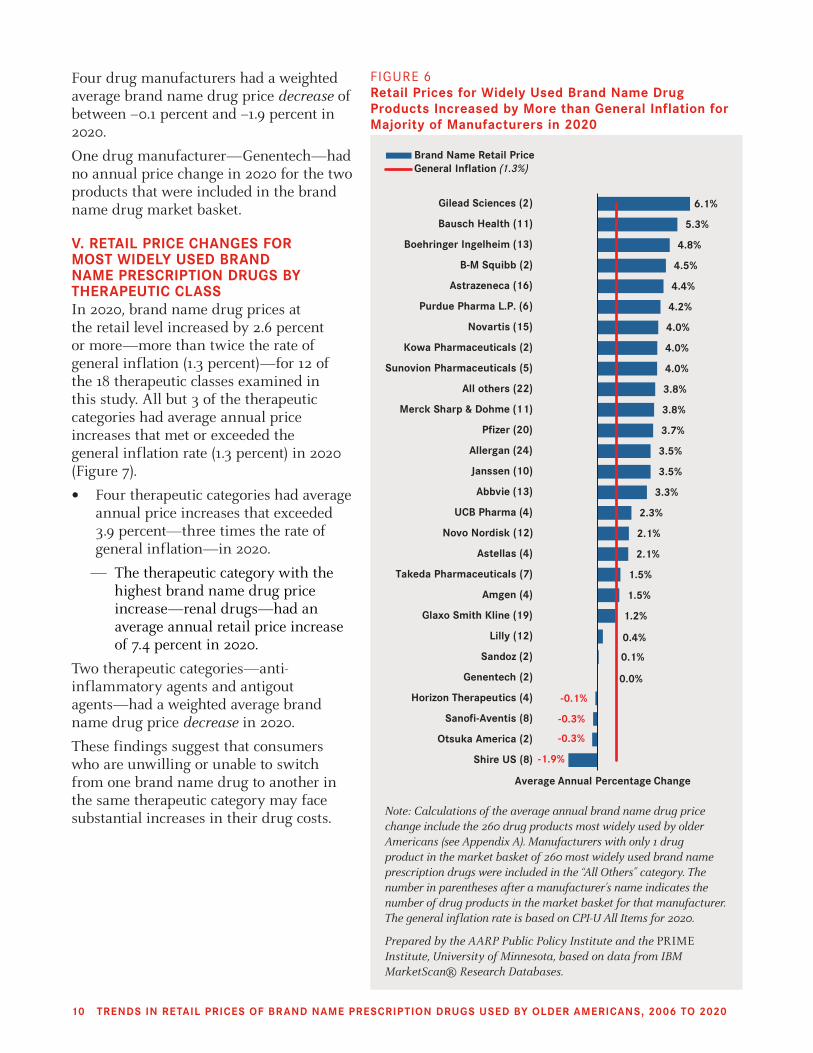
The average annual increase in retail price for three-quarters of drug manufacturer categories exceeded the general inflation rate in 2020 (Figure 6).
• Fifteen of the drug manufacturers—including the “All Others” category—had a weighted average annual brand name drug price increase at the retail level of more than 2.6 percent in 2020, or more than twice the rate of general inflation (1.3 percent).
— These 15 drug manufacturers represent 67 percent (175 of 260) of the brand name drug products in the market basket in 2020.
• One drug manufacturer—Gilead Sciences—had a weighted average annual brand name drug retail price increase of 6.1 percent in 2020, which is more than 4.5 times the rate of general inflation.
8.0%
8.3%
8.5%
9.2%
Ativan 2 mg tablet
Vascepa 1 gm capsule
Velphoro 500 mg tablet
Ativan 1 mg tablet
Annual % Change
Brand Name Retail PriceGeneral Inflation (1.3%)
Note: The general inflation rate is based on CPI-U (see Consumer Price Index-All Urban Consumers for All Items [seasonally adjusted] [CPI-U], Bureau of Labor Statistics series CUSR0000SA0).
Prepared by the AARP Public Policy Institute and the PRIME Institute, University of Minnesota, based on data from IBM MarketScan® Research Databases.
FIGURE 5 Four Widely Used Brand Name Drugs Had One-Year Retail Price Increases of 8 percent or More in 2020
10 TRENDS IN RETAIL PRICES OF BRAND NAME PRESCRIPTION DRUGS USED BY OLDER AMERICANS, 2006 TO 2020
Four drug manufacturers had a weighted average brand name drug price decrease of between –0.1 percent and –1.9 percent in 2020.
One drug manufacturer—Genentech—had no annual price change in 2020 for the two products that were included in the brand name drug market basket.
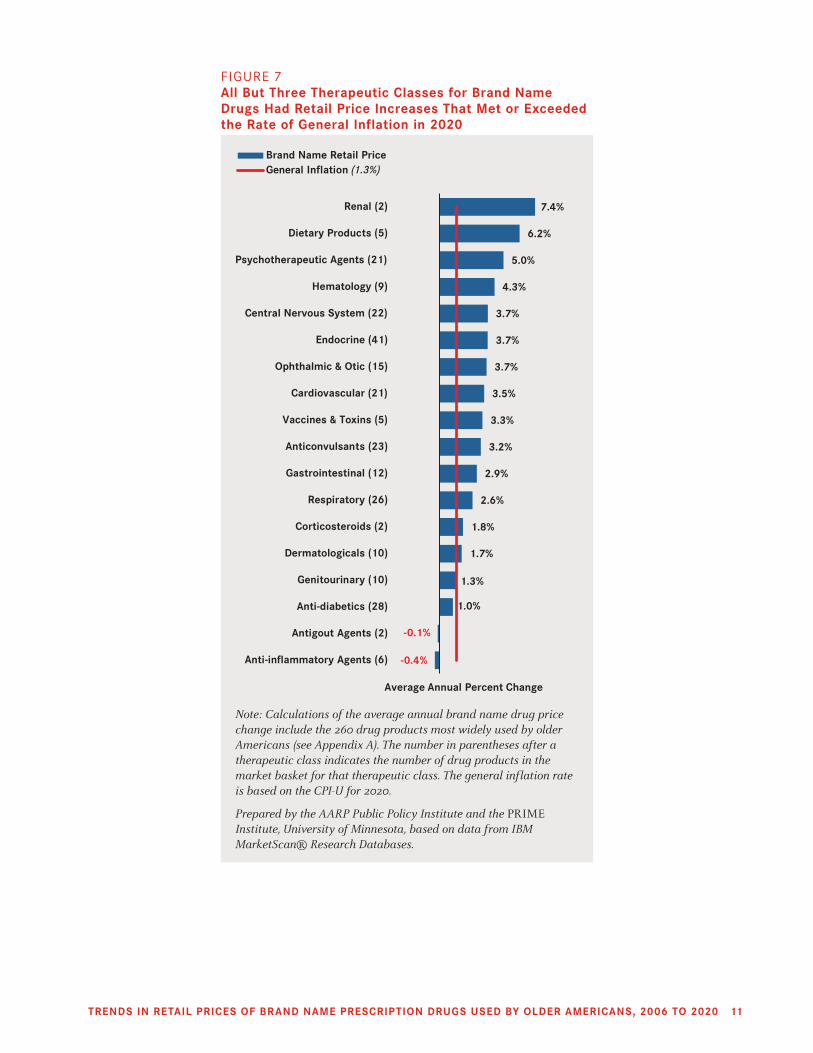
V. RETAIL PRICE CHANGES FOR MOST WIDELY USED BRAND NAME PRESCRIPTION DRUGS BY THERAPEUTIC CLASS In 2020, brand name drug prices at the retail level increased by 2.6 percent or more—more than twice the rate of general inflation (1.3 percent)—for 12 of the 18 therapeutic classes examined in this study. All but 3 of the therapeutic categories had average annual price increases that met or exceeded the general inflation rate (1.3 percent) in 2020 (Figure 7).
• Four therapeutic categories had average annual price increases that exceeded 3.9 percent—three times the rate of general inflation—in 2020.
— The therapeutic category with the highest brand name drug price increase—renal drugs—had an average annual retail price increase of 7.4 percent in 2020.
Two therapeutic categories—anti-inflammatory agents and antigout agents—had a weighted average brand name drug price decrease in 2020.
These findings suggest that consumers who are unwilling or unable to switch from one brand name drug to another in the same therapeutic category may face substantial increases in their drug costs.
-1.9%
-0.3%
-0.3%
-0.1%
0.0%
0.1%
0.4%
1.2%
1.5%
1.5%
2.1%
2.1%
2.3%
3.3%
3.5%
3.5%
3.7%
3.8%
3.8%
4.0%
4.0%
4.0%
4.2%
4.4%
4.5%
4.8%
5.3%
6.1%
Shire US (8)
Otsuka America (2)
Sanofi-Aventis (8)
Horizon Therapeutics (4)
Genentech (2)
Sandoz (2)
Lilly (12)
Glaxo Smith Kline (19)
Amgen (4)
Takeda Pharmaceuticals (7)
Astellas (4)
Novo Nordisk (12)
UCB Pharma (4)
Abbvie (13)
Janssen (10)
Allergan (24)
Pfizer (20)
Merck Sharp & Dohme (11)
All others (22)
Sunovion Pharmaceuticals (5)
Kowa Pharmaceuticals (2)
Novartis (15)
Purdue Pharma L.P. (6)
Astrazeneca (16)
B-M Squibb (2)
Boehringer Ingelheim (13)
Bausch Health (11)
Gilead Sciences (2)
Average Annual Percentage Change
Brand Name Retail PriceGeneral Inflation (1.3%)
Note: Calculations of the average annual brand name drug price change include the 260 drug products most widely used by older Americans (see Appendix A). Manufacturers with only 1 drug product in the market basket of 260 most widely used brand name prescription drugs were included in the “All Others” category. The number in parentheses after a manufacturer’s name indicates the number of drug products in the market basket for that manufacturer. The general inflation rate is based on CPI-U All Items for 2020.
Prepared by the AARP Public Policy Institute and the PRIME Institute, University of Minnesota, based on data from IBM MarketScan® Research Databases.
FIGURE 6 Retail Prices for Widely Used Brand Name Drug Products Increased by More than General Inflation for Majority of Manufacturers in 2020
TRENDS IN RETAIL PRICES OF BRAND NAME PRESCRIPTION DRUGS USED BY OLDER AMERICANS, 2006 TO 2020 11
-0.4%
-0.1%
1.0%
1.3%
1.7%
1.8%
2.6%
2.9%
3.2%
3.3%
3.5%
3.7%
3.7%
3.7%
4.3%
5.0%
6.2%
7.4%
Anti-inflammatory Agents (6)
Antigout Agents (2)
Anti-diabetics (28)
Genitourinary (10)
Dermatologicals (10)
Corticosteroids (2)
Respiratory (26)
Gastrointestinal (12)
Anticonvulsants (23)
Vaccines & Toxins (5)
Cardiovascular (21)
Ophthalmic & Otic (15)
Endocrine (41)
Central Nervous System (22)
Hematology (9)
Psychotherapeutic Agents (21)
Dietary Products (5)
Renal (2)
Average Annual Percent Change
Brand Name Retail PriceGeneral Inflation (1.3%)
Note: Calculations of the average annual brand name drug price change include the 260 drug products most widely used by older Americans (see Appendix A). The number in parentheses after a therapeutic class indicates the number of drug products in the market basket for that therapeutic class. The general inflation rate is based on the CPI-U for 2020.
Prepared by the AARP Public Policy Institute and the PRIME Institute, University of Minnesota, based on data from IBM MarketScan® Research Databases.
FIGURE 7 All But Three Therapeutic Classes for Brand Name Drugs Had Retail Price Increases That Met or Exceeded the Rate of General Inflation in 2020
12 TRENDS IN RETAIL PRICES OF BRAND NAME PRESCRIPTION DRUGS USED BY OLDER AMERICANS, 2006 TO 2020
Concluding Observations
15 American Academy of Actuaries, Prescription Drug Spending.
16 Joohyun Park and Kevin A. Look, “Part D Coverage Gap Reform: Trends in Drug Use and Expenditures,” American Journal of Managed Care 26, no. 8 (2020): 349–356.
17 Rachelle L. Cutler, Fernando Fernandez-Llimos, Michael Frommer, Charlie Benrimoj, and Victoria Garcia-Cardenas, “Economic Impact of Medication Non-Adherence by Disease Groups: A Systematic Review,” BMJ Open 8, no. 1 (2018): E016982.
Retail prices increased in 2020 for brand name prescription drugs used by older Americans. The average annual increase was more than twice the corresponding rate of general inflation (2.9 percent compared with 1.3 percent).
Average annual brand name drug price increases have gradually slowed over the past several years after reaching a peak level of 13.8 percent in 2014. Nevertheless, brand name drug price increases continue to greatly exceed price increases for other goods and services. Such pricing behavior is not sustainable.
The average annual cost of drug therapy for each brand name prescription used by older Americans was $6,604 in 2020. For the average older American who uses 4.7 prescription drugs, that leads to an annual drug therapy cost of approximately $31,037. The annual drug therapy cost for older Americans exceeds the median annual income of Medicare beneficiaries ($29,650). Drug therapy is not affordable when its cost exceeds the patient’s entire annual income.
Notably, the average annual cost of drug therapy for each brand name prescription would have been almost $3,700 lower in 2020 ($2,911 v. $6,604) had retail price changes not exceeded the rate of general inflation.
Brand name drug prices at the retail level have a direct impact on the costs borne by individual consumers and by all other payer types. Brand name drug price increases often result in higher out-of-pocket costs for beneficiaries at the pharmacy, especially for those who pay a percentage of drug costs rather than a fixed copayment. Higher brand name drug prices may also be passed along to consumers in the form of higher premiums, deductibles, and other forms of cost sharing.15
If brand name drug prices and related price increases continue unabated, the cost of drugs will prompt increasing numbers of older Americans to stop taking necessary medications due to affordability concerns.16 Continued excessive brand name drug price increases will also lead to increased cost sharing and premiums, which could ultimately make health care coverage unaffordable and lead to poorer health outcomes and higher health care costs in the future.17 In addition, increased government spending on prescription drugs will ultimately lead to higher taxes and/or cuts to public programs.
Policy makers who are interested in long-term, meaningful changes in brand name drug prices must pursue options that go beyond voluntary and temporary pledges from drug manufacturers. Our data show that the voluntary pricing practices of drug companies have led to price trends that consistently exceed the corresponding rate of general inflation. Current market forces do not adequately protect against excessive brand name drug prices and price increases, and the resulting growth in pharmaceutical expenditures is not sustainable. While policy options should encourage meaningful pharmaceutical innovation, such options should be balanced with the impact that drug prices and expenditures have on the affordability of medications for consumers and other payers.
Current pricing practices for brand name pharmaceuticals are a threat to the health and financial security of individual consumers and to taxpayer-funded programs like Medicare and Medicaid. Brand name prescription drugs can provide substantial health benefits including improved health outcomes; however, these benefits are available only to those who can afford to use them.

TRENDS IN RETAIL PRICES OF BRAND NAME PRESCRIPTION DRUGS USED BY OLDER AMERICANS, 2006 TO 2020 13
Appendix A. Detailed Methodology and Description of Retail Price Data
18 Medi-Span is a private organization that collects price and other clinical and drug-related data directly from drug manufacturers and wholesalers. Price-Chek PC (now Price Rx Pro®) is a product of Medi-Span (Indianapolis, Indiana), a division of Wolters Kluwer Health Inc., and uses data from Medi-Span’s Master Drug Database (MDDB®). See http://www.medispan.com.
19 The retail prices used in this report series reflect the total price for a specific prescription that a PBM bills to a specific health plan for consumers enrolled in employer-sponsored or government-sponsored (i.e., Medicare or Medicaid) health plans and not simply the out-of-pocket cost (such as the copay) that a consumer would pay at the pharmacy. These amounts may or may not reflect what the PBM paid the pharmacy or the usual and customary price that a pharmacy would charge a cash-pay consumer for the same prescription.
20 The Truven Health MarketScan® Research Databases (now the IBM® MarketScan® Research Databases), a family of databases, contain individual-level health care claims, lab test results, and hospital discharge information from large employers, managed care organizations, hospitals, Medicare, and Medicaid programs. IBM Watson Health constructs the MarketScan® Research Databases by collecting data from employers, health plans, and state Medicaid agencies and placing them into databases. See IBM Watson Health, “White Paper: IBM® MarketScan® Databases for Health Services Researchers,” White Paper, Somers, NY, April 2019.
This appendix describes in detail how brand name, generic, and specialty drugs are defined in this study; how the study identified the market basket (i.e., sample) of drugs; how it measured prices; and how it calculated weighted average price changes. In addition, the appendix describes methods and assumptions used to determine prices and price changes by drug manufacturer and by therapeutic category.
OVERVIEWAARP’s Public Policy Institute has been publishing a series of reports that track price changes for the prescription drug products most widely used by older Americans, with annual and quarterly results reaching as far back as 2000. Since 2008, these reports have focused on price changes for three market baskets—brand, generic, and specialty drugs. In addition, a combined market basket (i.e., brand, generic, and specialty) has been added to the series, which is useful to view the price change trend across all types of outpatient prescription drugs in the US market. While this overall perspective is useful for those interested in understanding the industrial economics of the entire prescription drug market, consumers have proved to be considerably more interested in the price trend for the specific products that they are taking as individuals rather than all drug products on the market.
The AARP Public Policy Institute and the University of Minnesota’s PRIME Institute originally collaborated to report an index of manufacturers’ drug price changes based on the Wholesale Acquisition Cost (WAC) from the Medi-Span Price-Chek PC database.18 In 2009, AARP and the PRIME Institute created an additional drug price index based on actual retail prices19 from the Truven Health MarketScan® Commercial Database and MarketScan® Medicare Supplemental Database (MarketScan® Research Databases).20 Thus, the report series uses the same market basket of brand name prescription drugs widely used by older Americans to examine both manufacturer-level prices and retail-level prices in the market. The addition of retail-level prices allows the AARP Public Policy Institute to assess what prices payers (i.e., insurers, consumers, or government programs) are paying and whether rebates and other types of discounts have been passed along to payers and their covered members.
Recently, the AARP Public Policy Institute and the University of Minnesota’s PRIME Institute collaborated to develop a new market basket of widely used prescription drugs based on 2018 data provided by the IBM® MarketScan® Research Databases and a large Medicare Part D plan provider. UnitedHealthcare provides Medicare Part D coverage and is the organization that insures the AARP Medicare Rx plans. This Medicare Part D plan provider supplied data for all prescriptions provided to
14 TRENDS IN RETAIL PRICES OF BRAND NAME PRESCRIPTION DRUGS USED BY OLDER AMERICANS, 2006 TO 2020
its Medicare Part D enrollees in 2018. This Rx Price Watch report used the 2018 market basket.21 As in the past, the series will include separate data sets, analyses, and reports for brand name, generic, and specialty drugs, as well as the overall combined market basket.
DEFINING BRAND, GENERIC, AND SPECIALTY PHARMACEUTICALSA brand name drug is defined as a product marketed by the original holder of a new drug application (NDA, or related licensees) or a biological license application (BLA; or related licensees) for a given drug entity. A generic drug is defined as any drug product marketed by an entity other than the NDA or BLA holder or the related licensees.
The market conditions and pricing behavior for brand name and generic drugs are quite different. For example, brand name drugs have a monopoly based on patents and other forms of exclusivity for a number of years after market entry,22 and they do not experience typical price competition from therapeutically equivalent (i.e., AB-rated generic equivalents) drug products that can be routinely and directly substituted at the pharmacy level. On the other hand, generic drug products typically face price competition from the time the generic first enters the market, when there are two or more therapeutically equivalent drug products (as evaluated by the Food and Drug Administration [FDA] and reported in the Orange Book), including the brand name product. However, certain generic drugs—that is, those for which the generic manufacturer files a paragraph IV certification of patent non-infringement—may receive 180 days of exclusivity as the sole generic after this first generic drug product is approved. In cases in which there is only one generic drug product on the market, the level of economic competition may be somewhat limited until other economically independent generic marketers enter the market.
Specialty pharmaceuticals are drugs that treat complex, chronic conditions and that often require special administration, handling, and care management. Specialty drugs have been the fastest-growing group of new drug products over the past decade. This important group of drugs and biologicals is not precisely defined, but it includes products based on one or more of the following: (1) how they are made, (2) how they are approved by the FDA, (3) conditions they treat, (4) how they are used or administered, (5) their cost, and (6) other special features. The operational definition of specialty drugs for this study is further described in a later section on the methodology.
CREATING THE MARKET BASKET OF DRUGSThe AARP Public Policy Institute has been reporting prescription drug product price changes since 2004. The original reports were based on a market basket of retail and mail-order prescriptions provided to about 2 million people ages 50 and older who used the AARP Pharmacy Service in 2003. Following the implementation of the Medicare Part D program, we chose to develop a new market basket of drugs using 2006 data provided by UnitedHealthcare (formerly called PacifiCare), which is also the organization that insures the AARP Medicare Part D plans.
Subsequently, we updated the AARP market baskets again using 2011 data provided by Truven Health MarketScan® Research Databases (now IBM® MarketScan® Research Databases) and the same Medicare Part D plan provider that was used for the 2006 market basket. We weighted the data from the Medicare Part D plan provider by Part D enrollment and the data from the IBM MarketScan® Research Databases by the 50-plus population less Part D enrollment, based on data from the Centers for Medicare and Medicaid Services and the US Census. We then merged the weighted data to develop
21 The US Food & Drug Administration approved 53 new drugs and biological products in 2020. These products are not included in our current market basket but will be included in future market baskets if they meet our inclusion criteria. “Advancing Health Through Innovation: New Drug Therapy Approvals 2020,” US Food & Drug Administration, accessed April 20, 2021. https://www.fda.gov/drugs/development-approval-process-drugs/new-drugs-fda-cders-new-molecular-entities-and-new-therapeutic-biological-products.
22 Market exclusivity periods for new brand name drugs range from 13 to 17 years. See Benjamin N. Rome, ChangWon C. Lee, and Aaron S. Kesselheim, “Market Exclusivity Length for Drugs with New Generic or Biosimilar Competition, 2012–2018,” Clinical Pharmacology & Therapeutics 109, no. 2 (2020): 367–71.
TRENDS IN RETAIL PRICES OF BRAND NAME PRESCRIPTION DRUGS USED BY OLDER AMERICANS, 2006 TO 2020 15
and rank a weighted master list by prescription volume and sales at the National Drug Code (NDC) level for the new AARP market baskets.
This process was repeated using 2014 and 2018 data provided by the same data sources. The 2018 market basket is the basis of this report and subsequent Rx Price Watch reports.
Our selection of the market basket of drugs to track in the price index was a multistep process. First, prescriptions covered and adjudicated by the commercial entities included in the merged data set were grouped by NDC number. The NDC is a number that refers to a specific drug product presentation with a unique combination of active chemical ingredient, strength, dosage form, package type and size, and manufacturer (e.g., Eliquis [apixaban] 5 mg, tablet, bottle of 60, Bristol Myers Squibb). As a result, some drug entities (i.e., molecules) could appear more than once among the widely used drug products (e.g., when there are different strengths, such as Eliquis 2.5 mg). For each NDC, we calculated total sales revenue from adjudicated prescription claims, including the patient cost-sharing amount, as well as the total prescriptions dispensed, the total units supplied, and the total days of therapy provided during 2018.
The next step involved merging the use and expenditure data from the IBM® MarketScan® Research Databases and the Medicare Part D plan provider by NDC code and then linking the data with descriptive information from Medi-Span’s Price Rx Pro® drug database,23 using the NDC number as the key linking variable. The descriptive data from Price Rx Pro® included drug product information such as brand name, generic name, manufacturer, patent status, package size, route of administration, usual dose, therapeutic category, usual duration, and each price history.
All NDCs were classified by the patent status of the drug product presentation—that is, patented brand name (i.e., brand single source [SS]), off-patent brand name (i.e., brand multiple source [BMS] or innovator multiple source [IMS]), and off-patent generic (i.e., generic multiple source [GMS] or non-innovator multiple source [NMS]). We then grouped all NDC numbers by the Generic Product Indicator (GPI) code into GPI-patent status groups using the GPI code from Price Rx Pro®. The GPI combines drug products into a common group when they have the same active ingredients, dosage form, and strength—a single GPI includes the NDCs for any package type and size and from all manufacturers. When patent status is combined with the GPI categories, each GPI will typically be either a single source GPI (GPI-brand single source) or a multiple source GPI with both a GPI-brand multiple source group and a GPI-generic multiple source group.
The next step involved summing the total expenditures, number of prescriptions dispensed, and days of therapy provided across all NDCs within each GPI-patent status group. The NDCs within each GPI-patent status group were then rank ordered based on total annual expenditure for each NDC. The designated “representative NDC” was the NDC that had the highest level of expenditure within each GPI-patent status group. If the NDC with the greatest expenditure level was inactive, then the NDC with the next highest level of expenditure became the representative NDC.
This analysis excluded less than 0.5 percent of the expenditures and the prescriptions because they were for nondrug items. These nondrug items included devices, medical and diabetic supplies, syringes, compounding service fees, and other professional services. After exclusion of nondrug items, the 2018 data set contained 33,550 NDCs grouped into 5,872 GPI-patent status categories.
We then coded all GPIs to distinguish the specialty prescription drugs from other regular, or traditional, prescription drugs. The definition of specialty prescription drugs used here is a prescription drug that is (1) administered by injection, such as intravenous, intramuscular, sub-cutaneous, or other injection site (not including insulin); (2) a drug product approved by the FDA through a BLA (biological license application); (3) any drug product that has a total average prescription cost greater than $1,500 per prescription; or (4) any drug product that has a total average cost greater than $50 per day of therapy. The drug products that
23 Price Rx Pro® is a product of Medi-Span (Indianapolis, IN), a division of Wolters Kluwer Health, Inc., and is based on data from Medi-Span’s MDDB®.
16 TRENDS IN RETAIL PRICES OF BRAND NAME PRESCRIPTION DRUGS USED BY OLDER AMERICANS, 2006 TO 2020
met this definition were considered “specialty drugs” and all other prescription drugs were considered “regular,” “traditional,” or “nonspecialty” drugs. Throughout this report, references to the market basket of drugs refer to the regular (nonspecialty) drugs unless otherwise indicated. Only specialty drugs provided through a Medicare Part D program or under a prescription drug benefit program are included. The specialty drugs provided under Medicare Part B, or under a commercial health plan and administered in a clinic or physician’s office and billed as a medical claim, are not included in this data set or this analysis.
All NDCs were classified by the patent status of the drug product presentation—that is, patented brand name (or SS), off-patent brand name (or IMS), or off-patent generic (NMS). We classified both the regular and the specialty drug data sets by patent status.
We sorted the list of all GPI-patent status groups in the merged data set for 2018 by three criteria: (1) total prescription expenditures, (2) number of prescriptions dispensed, and (3) days of therapy provided. The top 500 GPI-patent status categories were identified for each of these three criteria. Because some GPI-patent status groups appeared in more than one of these top 500 lists, the combined list of all GPI-patent status groups totaled 950. There were 260 brand name GPI-patent status groups (i.e., both brand single source and brand multiple source) and 505 generic GPI-patent status groups. Also, 185 GPI-patent status groups in this combined top 500 list were classified as specialty drugs.
The three market baskets (brand name, generic, and specialty drugs) combined accounted for 85.7 percent of all prescription drug expenditures and 43.3 percent of all prescriptions dispensed to those over age 50 in 2018.
MONITORING RETAIL DRUG PRICESThe original Rx Watchdog reports were based on market baskets of drugs constructed using data from a Medicare Part D plan provider for 2006 and manufacturer drug price changes measured using WAC data from the Medi-Span Price-Chek PC database. The AARP Public Policy Institute and the University of Minnesota’s PRIME Institute collaborated to develop a new retail drug price index known as the Rx Price Watch reports, based on retail-level prescription prices from the Truven Health MarketScan® Research Databases (now IBM® MarketScan® Research Databases). This retail price index allows the AARP Public Policy Institute to assess retail prices actually paid by consumers or insurers and to determine whether the rebates and discounts sometimes given to payers are being passed along to consumers.
Retail Data DescriptionThe IBM® MarketScan® Research Databases consists of three core claims databases, a hospital discharge database and an electronic medical record database, as well as several linked databases, data sets and files that combine claims data with other patient and employee data at the patient level.24 The warehouse features an opportunity sample from multiple sources (e.g., employers, states, health plans), more than 32 billion service records, and over 200 million covered individuals.25 The data used in the Rx Price Watch analyses are drawn from the IBM® MarketScan® Commercial Claims and Encounters Database (Commercial Database) and the IBM® MarketScan® Supplemental and Coordination of Benefits Database (Medicare Supplemental Database).
The IBM® MarketScan® Commercial Database consists of employer- and health plan-sourced data containing medical and drug data for several million individuals annually. It encompasses employees, their spouses, and dependents covered by employer-sponsored private health insurance. Health care for these individuals is available under a variety of fee-for-service (FFS), fully capitated, and partially capitated health plans. These include preferred provider organizations (PPOs) and exclusive provider organizations (EPOs), point of service (POS) plans, indemnity plans, health maintenance organizations (HMOs), and consumer-directed health plans.26
24 IBM Watson Health, “White Paper.”
25 IBM Watson Health, “White Paper.”
26 IBM Watson Health, “White Paper.”
TRENDS IN RETAIL PRICES OF BRAND NAME PRESCRIPTION DRUGS USED BY OLDER AMERICANS, 2006 TO 2020 17
The IBM® MarketScan® Medicare Supplemental Database is composed of data from retirees with Medicare supplemental insurance sponsored by employers or unions. In 2020, one million Medicare beneficiaries received their drug benefits through a retiree coverage plan.27 The IBM® MarketScan® Medicare Supplemental Database includes the Medicare-covered portion of payment, the employer-paid portion, and any patient out-of-pocket expenses. The database provides detailed cost and use data for health care services performed in both inpatient and outpatient settings.
The retail price data drawn from the IBM® MarketScan® Commercial Database and IBM® MarketScan® Medicare Supplemental Database had to meet several conditions in order to be included in the analysis:1. Claimant must be age 50 or older.2. Claim must have a value of greater than zero in the following fields:
a. Total payment amounta. Metric quantityb. Ingredient costc. Days’ supplyd. Average wholesale price
3. Payment amount cannot be less than 100 percent of the ingredient cost. 4. Claim must come from a noncapitated health plan.
IBM® Watson Health then combined the two databases and provided the AARP Public Policy Institute with data sets that included the monthly median (as well as the 25th and 75th percentile) retail price from January 2005 through December 2020 for all of the drug products in the Rx Price Watch market baskets. We then compiled the monthly median retail prices in spreadsheets designed to track price changes for each of the drug products in the AARP market baskets.
CALCULATING ANNUAL PRICE CHANGES FOR EACH DRUGThis Rx Price Watch report calculates average retail price changes for drug products in the following ways:
• The annual point-to-point percent change in retail price is the percent change in price for a given month compared with the same month in the previous year (e.g., January 2020 v. January 2019, February 2020 v. February 2019).
• The 12-month rolling average percent change in retail price is the average of the point-to-point changes over the preceding 12 months. For example, the average annual retail price changes for 2020 refer to the average of the annual point-to-point price changes for each of the 12 months from January 2020 through December 2020 compared with the same months in 2019.
We calculated average annual price changes for each drug product for each month and year that the drug was on the market from 2006 to 2020. The first step was to calculate the annual point-to-point percent change for each month by comparing the price in a specific month with the same month in the previous year (e.g., January 2020 v. January 2019, February 2020 v. February 2019). The next step was to calculate the average of these annual point-to-point changes for the 12 months in each calendar year. For example, average annual price changes for 2020 refer to the average of the annual point-to-point price for each of the 12 months in 2020. This 12-month rolling average tends to be a more conservative estimate of price changes than the point-to-point method (i.e., a simple percentage change for a single month from the same month in the previous year), and it accounts for seasonal variations in drug manufacturers’ pricing policies.
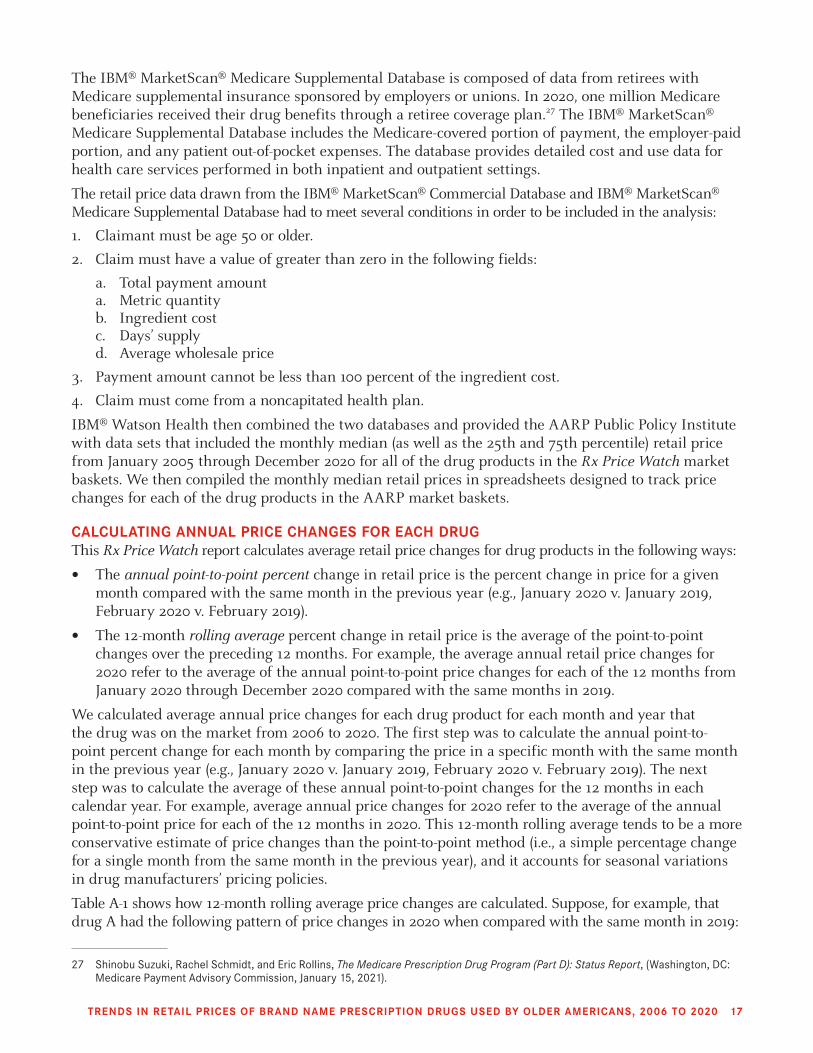
Table A-1 shows how 12-month rolling average price changes are calculated. Suppose, for example, that drug A had the following pattern of price changes in 2020 when compared with the same month in 2019:
27 Shinobu Suzuki, Rachel Schmidt, and Eric Rollins, The Medicare Prescription Drug Program (Part D): Status Report, (Washington, DC: Medicare Payment Advisory Commission, January 15, 2021).
18 TRENDS IN RETAIL PRICES OF BRAND NAME PRESCRIPTION DRUGS USED BY OLDER AMERICANS, 2006 TO 2020
In this example, the retail price of drug A was 2 percent higher than the price for the same months in the previous year, for the period from January through April 2020. A price hike in May increased the percentage difference to 3 percent for each of the subsequent months in 2020. The 12-month average of these price differences is
(2.0 + 2.0 + 2.0 + 2.0 + 3.0 + 3.0 + 3.0 + 3.0 + 3.0 + 3.0 + 3.0 + 3.0)/12, or 2.67 percent.28
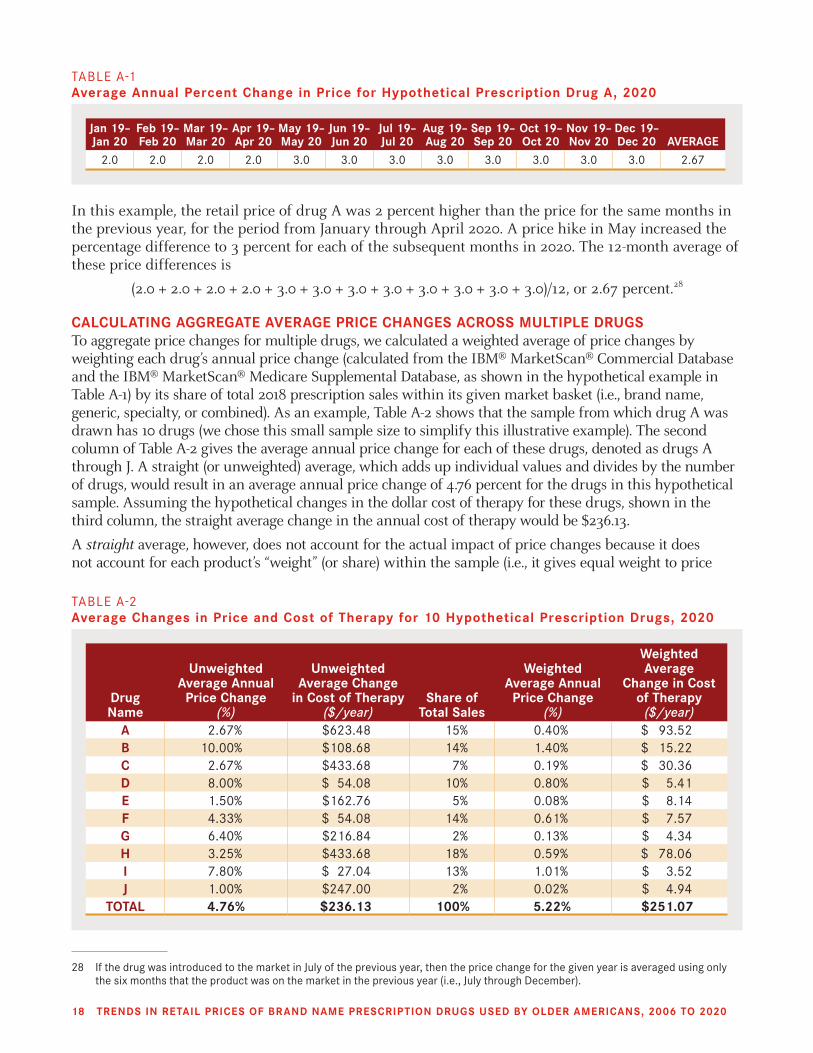
CALCULATING AGGREGATE AVERAGE PRICE CHANGES ACROSS MULTIPLE DRUGSTo aggregate price changes for multiple drugs, we calculated a weighted average of price changes by weighting each drug’s annual price change (calculated from the IBM® MarketScan® Commercial Database and the IBM® MarketScan® Medicare Supplemental Database, as shown in the hypothetical example in Table A-1) by its share of total 2018 prescription sales within its given market basket (i.e., brand name, generic, specialty, or combined). As an example, Table A-2 shows that the sample from which drug A was drawn has 10 drugs (we chose this small sample size to simplify this illustrative example). The second column of Table A-2 gives the average annual price change for each of these drugs, denoted as drugs A through J. A straight (or unweighted) average, which adds up individual values and divides by the number of drugs, would result in an average annual price change of 4.76 percent for the drugs in this hypothetical sample. Assuming the hypothetical changes in the dollar cost of therapy for these drugs, shown in the third column, the straight average change in the annual cost of therapy would be $236.13.
A straight average, however, does not account for the actual impact of price changes because it does not account for each product’s “weight” (or share) within the sample (i.e., it gives equal weight to price
28 If the drug was introduced to the market in July of the previous year, then the price change for the given year is averaged using only the six months that the product was on the market in the previous year (i.e., July through December).
Drug Name
Unweighted Average Annual Price Change
(%)
Unweighted Average Change
in Cost of Therapy ($/year)
Share of Total Sales
Weighted Average Annual Price Change
(%)
Weighted Average
Change in Cost of Therapy ($/year)
A 2.67% $623.48 15% 0.40% $ 93.52B 10.00% $108.68 14% 1.40% $ 15.22C 2.67% $433.68 7% 0.19% $ 30.36D 8.00% $ 54.08 10% 0.80% $ 5.41E 1.50% $162.76 5% 0.08% $ 8.14F 4.33% $ 54.08 14% 0.61% $ 7.57G 6.40% $216.84 2% 0.13% $ 4.34H 3.25% $433.68 18% 0.59% $ 78.06I 7.80% $ 27.04 13% 1.01% $ 3.52J 1.00% $247.00 2% 0.02% $ 4.94
TOTAL 4.76% $236.13 100% 5.22% $251.07
TABLE A-2 Average Changes in Price and Cost of Therapy for 10 Hypothetical Prescription Drugs, 2020
Jan 19–Jan 20
Feb 19–Feb 20
Mar 19–Mar 20
Apr 19–Apr 20
May 19–May 20
Jun 19–Jun 20
Jul 19–Jul 20
Aug 19–Aug 20
Sep 19–Sep 20
Oct 19–Oct 20
Nov 19–Nov 20
Dec 19–Dec 20 AVERAGE
2.0 2.0 2.0 2.0 3.0 3.0 3.0 3.0 3.0 3.0 3.0 3.0 2.67
TABLE A-1 Average Annual Percent Change in Price for Hypothetical Prescription Drug A, 2020
TRENDS IN RETAIL PRICES OF BRAND NAME PRESCRIPTION DRUGS USED BY OLDER AMERICANS, 2006 TO 2020 19
changes of both commonly used drugs and drugs that are used less frequently). As a result, it does not accurately capture the average impact of price changes in the marketplace. In Table A-2, drugs with low price increases in percentage terms (drugs E and J) account for a small share (7 percent) of total 2018 sales for the specific group of drugs analyzed. By contrast, drugs with the highest percentage changes (drugs B, D, and I) account for a much larger share (37 percent) of sales. To reflect the relative importance of each drug’s price change in the market basket of products, we weighted each annual price change by the drug’s share of total 2018 sales. In this simple example, the weighted average price increase in 2020 is the sum of
(Unweighted average price change for drug A × drug A’s share of total sales) + (Unweighted average price change for drug B × drug B’s share of total sales) + (Unweighted average price change for drug C × drug C’s share of total sales) +
… + (Unweighted average price change for drug J × drug J’s share of total sales), or
(2.67 × 0.15) + (10.0 × 0.14) + (2.67 × 0.07) + … + (1.0 × 0.02).
The results of this calculation are in the fifth column of Table A-2, which shows that the weighted annual average price change for the drugs is 5.22 percent, or approximately one-half a percentage point higher than the unweighted average of 4.76 percent. The weighted dollar change in the annual cost of therapy would be $251.07, compared with the unweighted average dollar change of $236.13.
CALCULATING AVERAGE PRICE CHANGES ACROSS MULTIPLE DRUGS FOR YEARS BEFORE 2018The process for aggregating price changes for multiple drugs pre-2018 is similar to that for 2018. Average price changes for 2006 through 2017 were derived by first calculating the rolling average annual price change for each drug (as shown in Table A-1), then weighting each drug’s price change by its share of total sales in the sample. The weights used for all years in this study are from 2018 sales from the Medicare Part D plans of a Medicare Part D plan provider, including the AARP plans, as well as from the IBM® MarketScan® Commercial Database, and the IBM® MarketScan® Medicare Supplemental Database. The 2018 weights keep the market basket constant over time so that the change in prices would be a function of price changes alone and not a function of changes in market basket utilization or mix.
However, some drugs that were in the 2018 sample were not on the market in all earlier years. We dropped these drug products from the analysis in the month before they entered the market and for all previous months, and recalculated the weights of the products present in the market prior to 2018 to reflect their relative share of the total sales as adjusted to reflect only drugs on the market during that period.
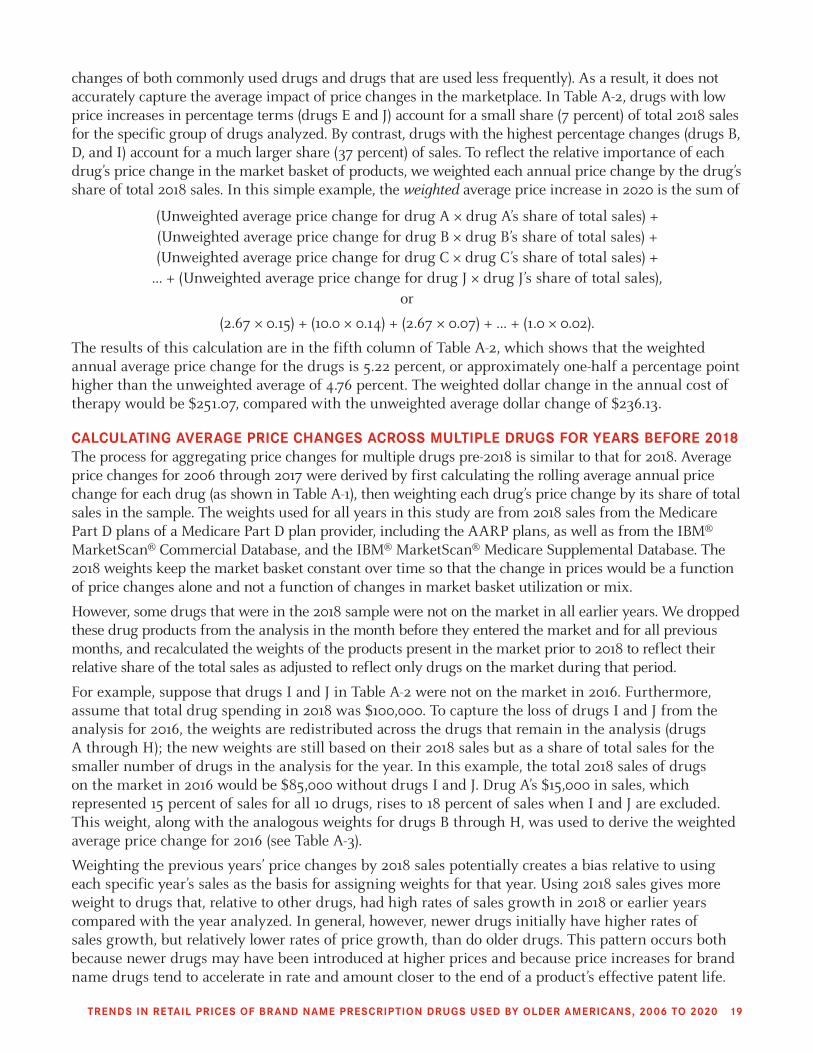
For example, suppose that drugs I and J in Table A-2 were not on the market in 2016. Furthermore, assume that total drug spending in 2018 was $100,000. To capture the loss of drugs I and J from the analysis for 2016, the weights are redistributed across the drugs that remain in the analysis (drugs A through H); the new weights are still based on their 2018 sales but as a share of total sales for the smaller number of drugs in the analysis for the year. In this example, the total 2018 sales of drugs on the market in 2016 would be $85,000 without drugs I and J. Drug A’s $15,000 in sales, which represented 15 percent of sales for all 10 drugs, rises to 18 percent of sales when I and J are excluded. This weight, along with the analogous weights for drugs B through H, was used to derive the weighted average price change for 2016 (see Table A-3).
Weighting the previous years’ price changes by 2018 sales potentially creates a bias relative to using each specific year’s sales as the basis for assigning weights for that year. Using 2018 sales gives more weight to drugs that, relative to other drugs, had high rates of sales growth in 2018 or earlier years compared with the year analyzed. In general, however, newer drugs initially have higher rates of sales growth, but relatively lower rates of price growth, than do older drugs. This pattern occurs both because newer drugs may have been introduced at higher prices and because price increases for brand name drugs tend to accelerate in rate and amount closer to the end of a product’s effective patent life.
20 TRENDS IN RETAIL PRICES OF BRAND NAME PRESCRIPTION DRUGS USED BY OLDER AMERICANS, 2006 TO 2020
CALCULATING ANNUAL COST OF THERAPY FOR A DRUG PRODUCTTo assess the impact of price changes on dollars spent, we calculated an annual cost of therapy for each drug product. This annual cost of therapy analysis excludes drug products in the market basket that are used primarily for treatment of acute conditions or that are typically taken for a limited period of time. The amount of a drug that an average adult would take on a daily basis was determined using the “usual daily dose” reported in the Medi-Span Price Rx Pro® database. When this information was not available from Medi-Span, we used dosing information in the FDA-approved labeling for the drug product. The weighted average annual cost of therapy was also calculated using the 2018 sales volumes to weight the annual cost of each drug product to produce the aggregate annual cost of therapy across all drug products in the study’s market basket.
DEFINING MANUFACTURERWe defined a drug manufacturer as the firm marketing the drug product under its corporate name in 2018. If a listed manufacturer is a division of another firm, we defined its drugs as marketed by the parent firm. This includes cases in which the firm marketing a drug product may have changed over time due to mergers and acquisitions, divestitures of specific drug products, or for other reasons. The analysis of drug manufacturers reported separately on manufacturers with at least two drug products (at the NDC level) among the most widely used drugs.
DEFINING THERAPEUTIC CATEGORYDrug products can be classified by the therapeutic purpose for which they are used. If a drug has multiple uses, the most common indication typically becomes the classifier. To group drug products in this study into similar therapeutic categories, we used Medi-Span’s therapeutic coding scheme, known as the GPI code.
The therapeutic categories used in this study use an intermediate GPI-level code that specifies the groupings of similar chemical entities, such as “Proton Pump Inhibitors.” A brand name therapeutic category may include drug products that are brand single source or brand multiple source.
Drug Name
2018 Weights 2016 Weights
Share of 2018 Sales
Dollar Value of 2018 Sales
2018 Dollar Sales of Drugs on Market
in 2016
2018 Share of Drugs on Market
in 2016A 15% $ 15,000 $15,000 18%B 14% $ 14,000 $14,000 16%C 7% $ 7,000 $ 7,000 8%D 10% $ 10,000 $10,000 12%E 5% $ 5,000 $ 5,000 6%F 14% $ 14,000 $14,000 16%G 2% $ 2,000 $ 2,000 2%H 18% $ 18,000 $18,000 21%I 13% $ 13,000 − −J 2% $ 2,000 − −
TOTAL 100% $100,000 $85,000 100%
TABLE A-3 Recalculating Weights When Prescription Drugs Drop Out of the Sample
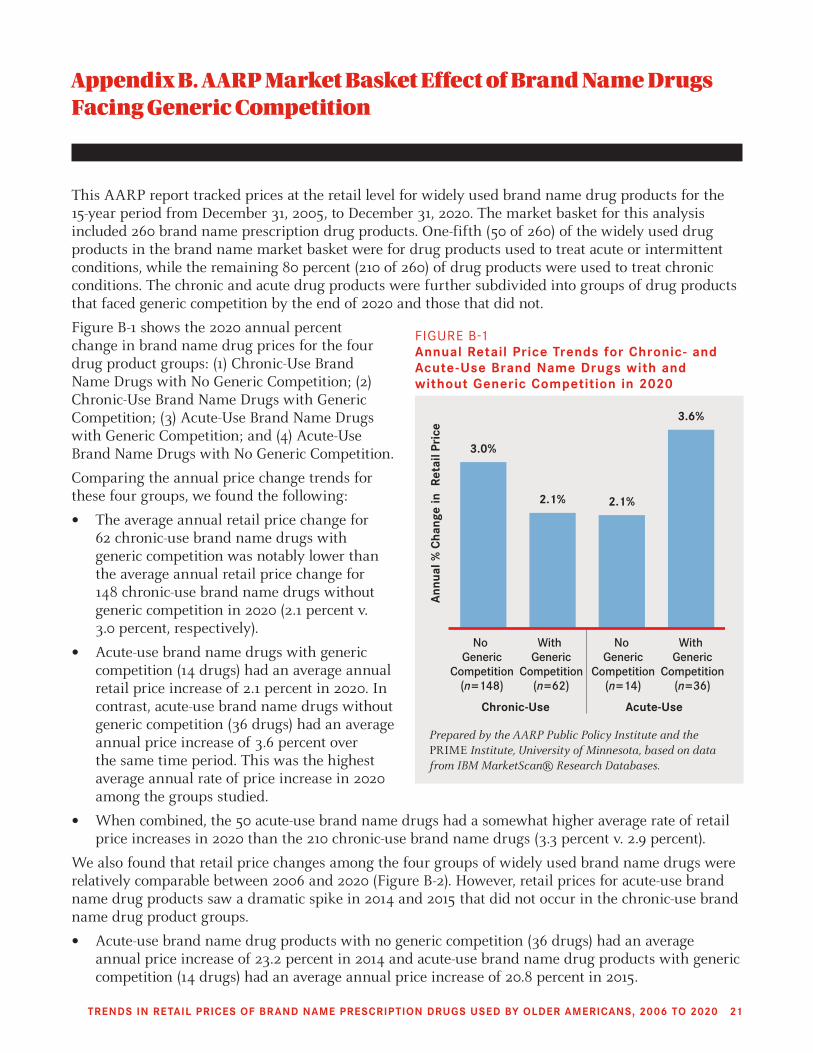
TRENDS IN RETAIL PRICES OF BRAND NAME PRESCRIPTION DRUGS USED BY OLDER AMERICANS, 2006 TO 2020 21
Appendix B. AARP Market Basket Effect of Brand Name Drugs Facing Generic Competition
This AARP report tracked prices at the retail level for widely used brand name drug products for the 15-year period from December 31, 2005, to December 31, 2020. The market basket for this analysis included 260 brand name prescription drug products. One-fifth (50 of 260) of the widely used drug products in the brand name market basket were for drug products used to treat acute or intermittent conditions, while the remaining 80 percent (210 of 260) of drug products were used to treat chronic conditions. The chronic and acute drug products were further subdivided into groups of drug products that faced generic competition by the end of 2020 and those that did not.
Figure B-1 shows the 2020 annual percent change in brand name drug prices for the four drug product groups: (1) Chronic-Use Brand Name Drugs with No Generic Competition; (2) Chronic-Use Brand Name Drugs with Generic Competition; (3) Acute-Use Brand Name Drugs with Generic Competition; and (4) Acute-Use Brand Name Drugs with No Generic Competition.
Comparing the annual price change trends for these four groups, we found the following:
• The average annual retail price change for 62 chronic-use brand name drugs with generic competition was notably lower than the average annual retail price change for 148 chronic-use brand name drugs without generic competition in 2020 (2.1 percent v. 3.0 percent, respectively).
• Acute-use brand name drugs with generic competition (14 drugs) had an average annual retail price increase of 2.1 percent in 2020. In contrast, acute-use brand name drugs without generic competition (36 drugs) had an average annual price increase of 3.6 percent over the same time period. This was the highest average annual rate of price increase in 2020 among the groups studied.
• When combined, the 50 acute-use brand name drugs had a somewhat higher average rate of retail price increases in 2020 than the 210 chronic-use brand name drugs (3.3 percent v. 2.9 percent).
We also found that retail price changes among the four groups of widely used brand name drugs were relatively comparable between 2006 and 2020 (Figure B-2). However, retail prices for acute-use brand name drug products saw a dramatic spike in 2014 and 2015 that did not occur in the chronic-use brand name drug product groups.
• Acute-use brand name drug products with no generic competition (36 drugs) had an average annual price increase of 23.2 percent in 2014 and acute-use brand name drug products with generic competition (14 drugs) had an average annual price increase of 20.8 percent in 2015.
3.0%
2.1% 2.1%
3.6%
Chronic-Use
No Generic
Competition(n=148)
Acute-Use
Ann
ual %
Cha
nge
in R
etai
l Pri
ce
With Generic
Competition(n=62)
No Generic
Competition(n=14)
With Generic
Competition(n=36)
Prepared by the AARP Public Policy Institute and the PRIME Institute, University of Minnesota, based on data from IBM MarketScan® Research Databases.
FIGURE B-1 Annual Retail Price Trends for Chronic- and Acute-Use Brand Name Drugs with and without Generic Competition in 2020
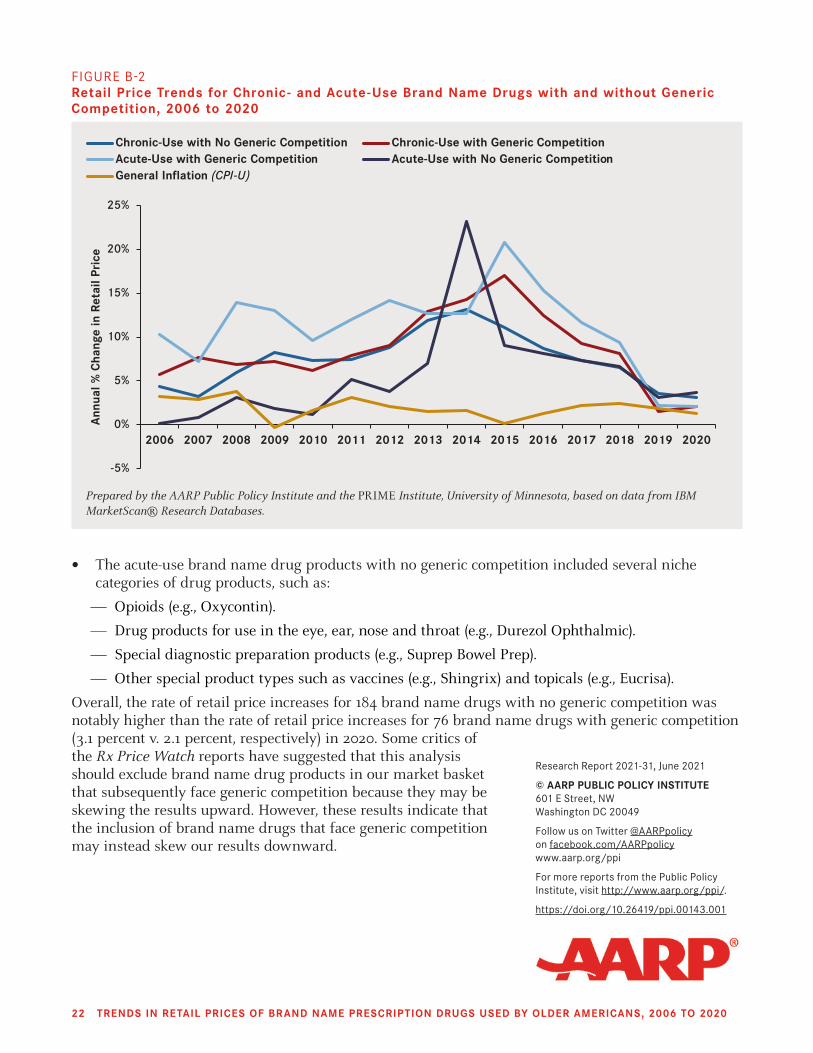
• The acute-use brand name drug products with no generic competition included several niche categories of drug products, such as:
— Opioids (e.g., Oxycontin).
— Drug products for use in the eye, ear, nose and throat (e.g., Durezol Ophthalmic).
— Special diagnostic preparation products (e.g., Suprep Bowel Prep).
— Other special product types such as vaccines (e.g., Shingrix) and topicals (e.g., Eucrisa).
Overall, the rate of retail price increases for 184 brand name drugs with no generic competition was notably higher than the rate of retail price increases for 76 brand name drugs with generic competition (3.1 percent v. 2.1 percent, respectively) in 2020. Some critics of the Rx Price Watch reports have suggested that this analysis should exclude brand name drug products in our market basket that subsequently face generic competition because they may be skewing the results upward. However, these results indicate that the inclusion of brand name drugs that face generic competition may instead skew our results downward.
22 TRENDS IN RETAIL PRICES OF BRAND NAME PRESCRIPTION DRUGS USED BY OLDER AMERICANS, 2006 TO 2020
Research Report 2021-31, June 2021
© AARP PUBLIC POLICY INSTITUTE601 E Street, NWWashington DC 20049
Follow us on Twitter @AARPpolicyon facebook.com/AARPpolicywww.aarp.org/ppi
For more reports from the Public Policy Institute, visit http://www.aarp.org/ppi/.
https://doi.org/10.26419/ppi.00143.001
-5%
0%
5%
10%
15%
20%
25%
2006 2007 2008 2009 2010 2011 2012 2013 2014 2015 2016 2017 2018 2019 2020
ecirP laite
Rn iegan
Ch
%
alunA
n
Chronic-Use with No Generic Competition Chronic-Use with Generic CompetitionAcute-Use with Generic Competition Acute-Use with No Generic CompetitionGeneral Inflation (CPI-U)
Prepared by the AARP Public Policy Institute and the PRIME Institute, University of Minnesota, based on data from IBM MarketScan® Research Databases.
FIGURE B-2 Retail Price Trends for Chronic- and Acute-Use Brand Name Drugs with and without Generic Competition, 2006 to 2020