trends in the international hospitality industry - hvs · pdf filetrends in the international...
TRANSCRIPT

- 1 -
Trends in the International Hospitality Industry
Steve Rushmore, MAI, FRICSPresident and Founder [email protected]

- 2 -
Worldwide – Annual Percent Change in Value Per Room: 2001 to 2014
-40%
-30%
-20%
-10%
0%
10%
20%
30%
40%
50%
60%
2001 2002 2003 2004 2005 2006 2007 2008 2009 2010 2011 2012 2013 2014
India
United States
Asia
Europe
Source: HVS

- 3 -
Real GDP Growth Forecastby Region
Source: Consensus Economics
*
* Central & South America

- 4 -
Recent Global Hotel Events
• Recession• Declining hotel demand• Falling occupancies• Declining room rates• Loss of RevPAR• Erosion of hotel values• Mortgage defaults• Lack of new financing
• Minimal new hotel supply• Recovery will be rapid and
strong• Huge buying opportunity
The Bad News The Good News
- 5 -
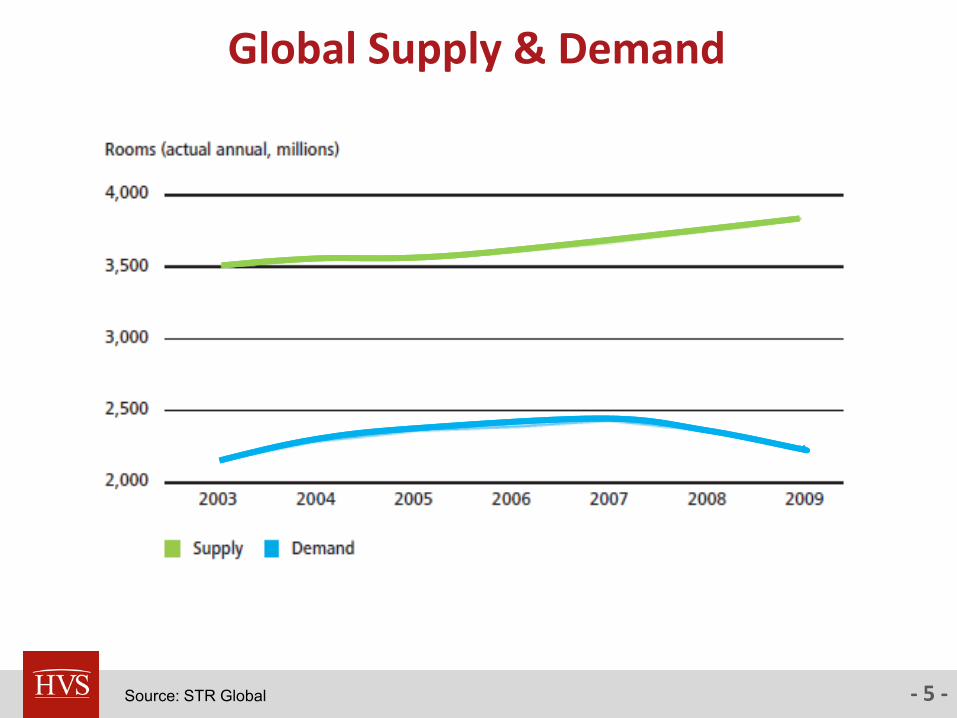
Global Supply & Demand
Source: STR Global

- 6 -
International Arrivals
by Country of Destination (million)
0
10
20
30
40
50
60
70
80
2005 2006 2007 2008 2009
France
United States
Spain
China
Italy
United Kingdom
Turkey
Germany
Malaysia
Brazil
Source: WTO
- 7 -
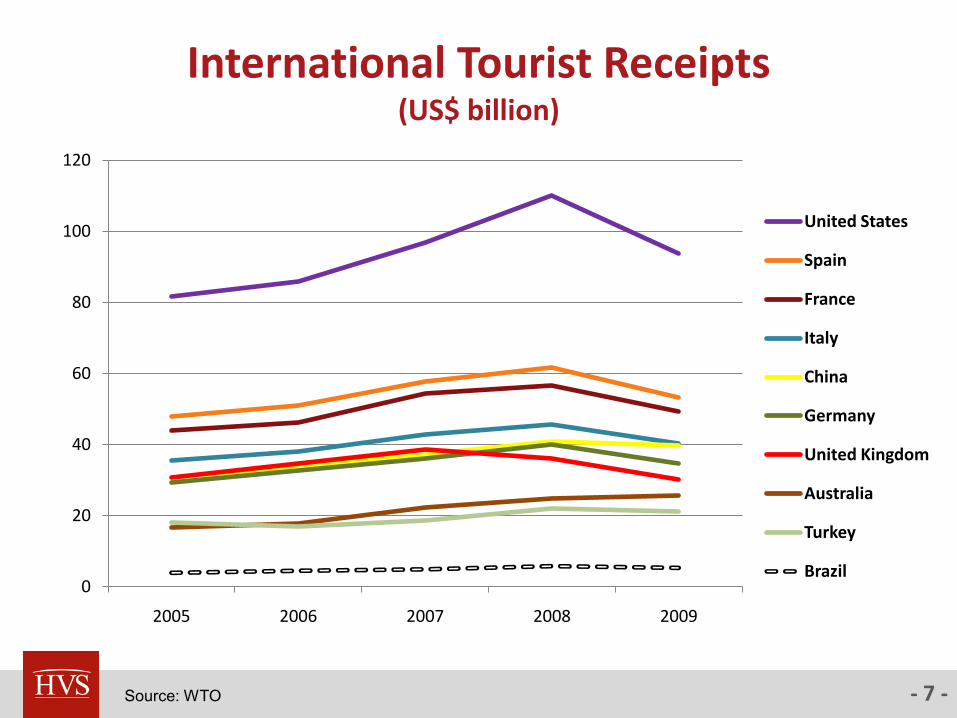
International Tourist Receipts(US$ billion)
Source: WTO
0
20
40
60
80
100
120
2005 2006 2007 2008 2009
United States
Spain
France
Italy
China
Germany
United Kingdom
Australia
Turkey
Brazil
- 8 -
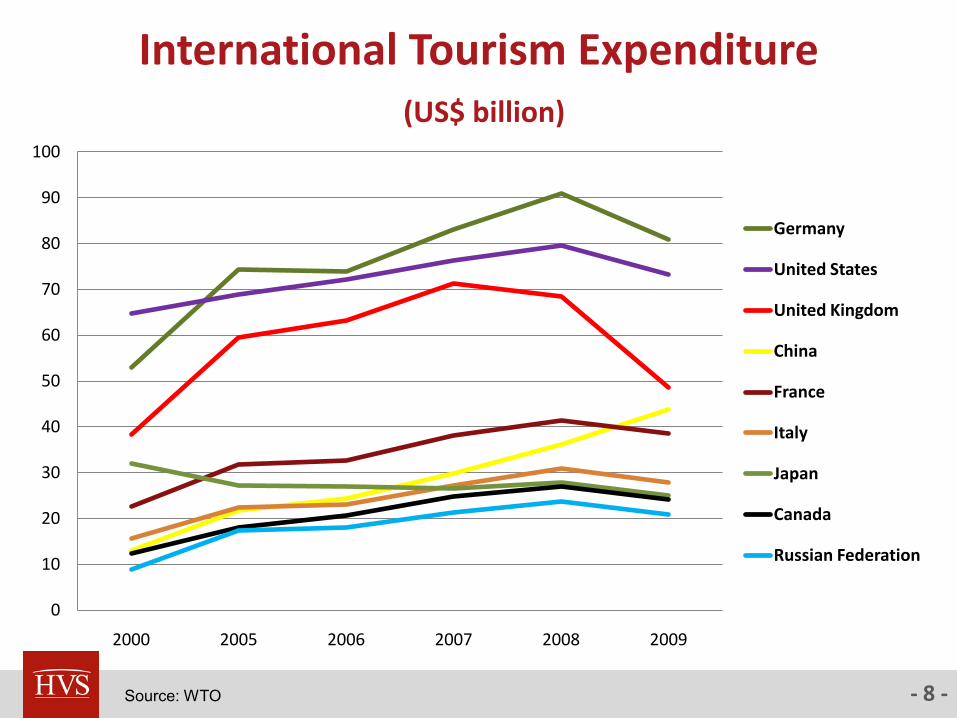
International Tourism Expenditure(US$ billion)
0
10
20
30
40
50
60
70
80
90
100
2000 2005 2006 2007 2008 2009
Germany
United States
United Kingdom
China
France
Italy
Japan
Canada
Russian Federation
Source: WTO

- 9 -
Short-Term Trends
Source: STR Global
-10%
-5%
0%
5%
10%
15%
20%
25%
Asia Pacific North America
South America
Europe Middle East
Northern Africa
Southern Africa
YTD June 2010 % Change
Occ ADR RevPAR

- 10 -
U.S. Market Demand vs. GDP
-6%
-4%
-2%
0%
2%
4%
6%
8%
10%
1970 1977 1984 1991 1998 2005
Pe
rce
nt C
han
ge
Demand vs. GDP (1970 – 2010)
Demand % Change GDP % Change
Source: HVS and STR

- 11 -
-15%
-10%
-5%
0%
5%
10%
15%
20%
19
70
19
72
19
74
19
76
19
78
19
80
19
82
19
84
19
86
19
88
19
90
19
92
19
94
19
96
19
98
20
00
20
02
20
04
20
06
20
08
Per
cen
tage
Ch
ange
Year
Percent Change of Supply, Demand & Occupancy 1970-2008
Supply Demand
Source: HVS and STR

- 12 -
-10%
-5%
0%
5%
10%
15%
20%
19
70
19
72
19
74
19
76
19
78
19
80
19
82
19
84
19
86
19
88
19
90
19
92
19
94
19
96
19
98
20
00
20
02
20
04
20
06
20
08
Percent Change of Rate, CPI, & Occupancy 1970 - 2008
Rate CPI
Historical Change of Rate, CPI, & Occupancy

- 13 -
Year OccupancyPercent Change
Average Rate
Percent Change RevPAR
Percent Change
2008 60.0% -4.5% $107.08 2.8% $64.28 -1.9%2009 54.8% -8.8% $97.68 -8.8% $53.49 -16.8%2010F 57.7% 5.3% $96.70 -1.0% $55.80 4.3%2011F 59.1% 2.5% $101.05 4.5% $59.76 7.1%2012F 60.9% 3.0% $106.11 5.0% $64.62 8.1%2013F 62.1% 2.0% $111.94 5.5% $69.51 7.6%2014F 62.7% 1.0% $117.54 5.0% $73.71 6.0%2015F 62.7% 0.0% $121.07 3.0% $75.92 3.0%
Source: HVS and STR
Projected RevPAR

- 14 -
1999 2000
Value Per Room $61,000 $69,000
Percent Change 1.7% 13.1%
2001 2002 2003
$52,000 $52,000 $51,000
-24.6% 0.0% -1.9%
2004
$65,000
27.5%
2005 2006
Value Per Room $82,000 $100,000
Percent Change 26.2% 22.0%
2007 2008 2009 2010
$95,000 $81,000 $56,000 $65,000
-4.7% -14.6% -31.3% 17.2%
2011 2012 2013 2014 2015
Value Per Room $83,000 $105,000 $126,000 $137,000 $142,000
Percent Change 27.0% 27.3% 19.6% 8.7% 3.5%
Source: HVS
Value Trend For A Typical U.S. Hotel

- 15 -
Recovery: From Low Point to 2015 ($ Per Room)
Rank
1 New York $401,000
2 Miami $178,000
3 San Francisco $164,000
4 Oahu $160,000
5 Las Vegas $152,000
6 New Orleans $146,000
7 Boston $137,000
8 Fort Lauderdale $133,000
9 Los Angeles $122,000
10 Chicago $117,000
Rank
43 St. Louis $46,000
44 Albuquerque $45,000
45 Milwaukee $45,000
46 Cleveland $44,000
47 Memphis $44,000
48 Richmond $44,000
49 Dallas $42,000
50 Kansas City $38,000
51 Cincinnati $35,000
52 Detroit $33,000
30 United States $86,000
Source: HVS

- 16 -
Recovery: From Low Point to 2015 (Percentage)
Rank
1 Las Vegas 434%
2 Tampa 364%
3 Norfolk 294%
4 Tucson 280%
5 Sacramento 273%
6 Phoenix 215%
7 New Orleans 209%
8 New York 205%
9 Oakland 176%
10 Detroit 165%
Rank
43 Oahu 68%
44 Houston 66%
45 Salt Lake City 65%
46 Dallas 65%
47 Portland 64%
48 Denver 60%
49 Pittsburgh 58%
50 Anaheim 53%
51 Austin 51%
52 Washington DC 41%
20 United States 156%
Source: HVS

- 17 -
Top Value-Per-Room Cities
2015
San Francisco
$597,000New York
$397,000
Oahu $397,000
Washington DC $341,000
Miami $338,000
Boston $328,000
San Diego $256,000
Los Angeles $251,000
Seattle $225,000
Fort Lauderdale $217,000
2009
Washington DC
$265,000Oahu
$237,000
San Francisco $233,000
New York $196,000
Boston $191,000
Miami $160,000
San Diego $146,000
Los Angeles $129,000
Austin $125,000
Seattle $119,000
Source: HVS

- 18 -
Europe – Annual Percent Change in Value Per Room: 2006 to 2010
Source: HVS
2006 2007 2008 2009 2010
Paris 9% 6% -6% -4% 6%
London 12% 6% -23% 1% 10%
Rome 8% -4% -18% -10% 2%
Moscow 21% 14% -10% -30% 0%
Madrid 13% 2% -17% -18% -5%
Athens 3% 5% -3% -14% -8%
Berlin 5% -1% 0% -1% 7%
Brussels 8% 6% 2% -12% 0%
Dublin 6% -2% -19% -20% -10%
Frankfurt 6% -6% -8% 0% 5%
Europe Average 9% 3% -11% -13% 2%

- 19 -
Asia – Annual Percent Change in Value Per Room: 2006 to 2010
Source: HVS
2006 2007 2008 2009 2010
Tokyo 12% 9% -14% -10% 0%
Hong Kong 14% 11% -12% -8% 5%
Singapore 30% 25% -13% -9% 0%
Shanghai 25% 26% -10% -10% 10%
Seoul 12% 5% -18% 2% 0%
Beijing 24% 29% -13% -11% 0%
Bangkok 1% 10% -20% -8% -2%
Asia Average 15% 14% -14% -8% 2%
- 20 -
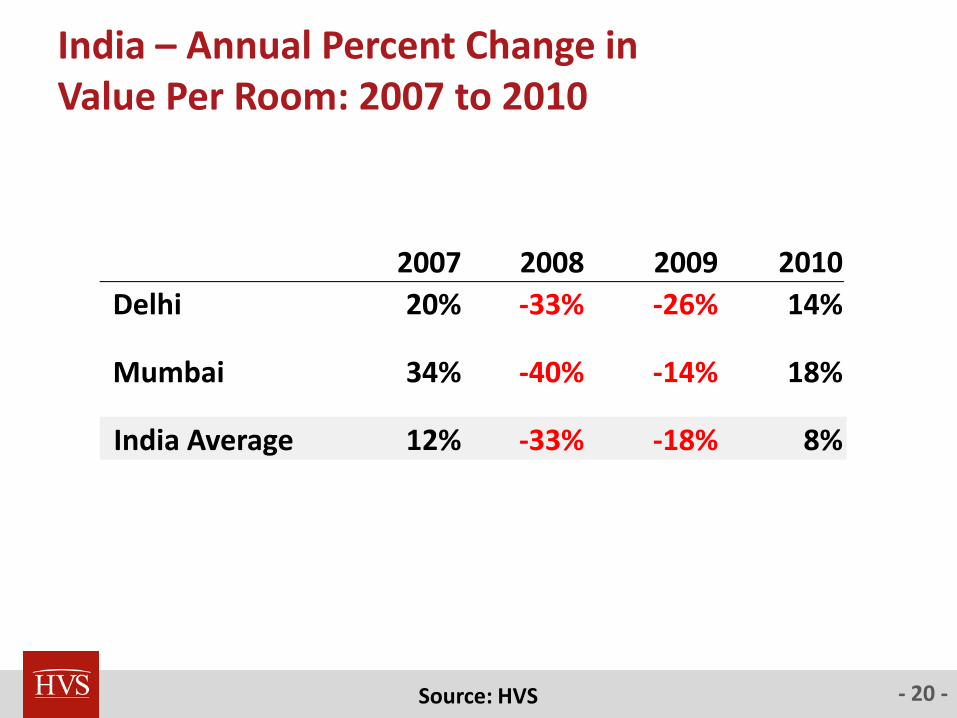
India – Annual Percent Change inValue Per Room: 2007 to 2010
Source: HVS
2007 2008 2009 2010
Delhi 20% -33% -26% 14%
Mumbai 34% -40% -14% 18%
India Average 12% -33% -18% 8%

- 21 -
Worldwide – Annual Percent Change in Value Per Room: 2000 to 2010
2000 2001 2002 2003 2004 2005 2006 2007 2008 2009 2010
United States - -25% 0% -2% 28% 26% 22% -5% -15% -31% 17%
Europe - -2% -2% -10% 2% 4% 9% 3% -11% -13% 2%
Asia - -4% 5% -4% 6% 7% 15% 14% -14% -8% 2%
India - -31% 11% 35% 49% 35% 28% 12% -33% -18% 8%
Source: HVS

- 22 -
Rushmore’s Observations
The global hotel industry bottomed out in 2009 and a recovery is under way.
Obtaining hotel financing will be a challenge for the next 2 to 4 years.
Supply growth will be constrained by the lack of financing.
Existing hotels will experience a significant increase in value through 2014.
Prepare for the Chinese and Indian tourists and business travelers to start dominating the travel market during this decade.
Look for ways to attract these new travelers to your market.

- 23 -
HVI Value: United States (Volatility Index 0%) Compared to CPI, S&P 500, & Dow Jones
$0
$50,000
$100,000
$150,000
$200,000
$250,000
United States
CPI
S&P 500
Dow Jones
Source: HVS

- 24 -
HVI Value: New York (Volatility Index 131%) Compared to CPI, S&P 500, & Dow Jones
$0
$50,000
$100,000
$150,000
$200,000
$250,000
$300,000
$350,000
$400,000
New York
CPI
S&P 500
Dow Jones
Source: HVS

- 25 -
HVI Value: Miami (Volatility Index 82%) Compared to CPI, S&P 500, & Dow Jones
$0
$50,000
$100,000
$150,000
$200,000
$250,000
Miami
CPI
S&P 500
Dow Jones
Source: HVS

- 26 -
HVS Franchise Fee Analysis Guide- Mid-Rate
Brand
Total Initial
Fee
Total Royalty
Fee
Total Reservation
Fee
Total Marketing
Fee
Total
Frequent
Traveler Fee
Total Misc.
Fee
Total Ten-Year
Fee
Total Ten-
Year
Fee/Rooms
Percent of
Total Rooms
Revenue
Best Western 70,000 953,233 54,718 209,927 154,586 0 1,442,464 7,212 2.9%
Comfort Inn/Suites 100,000 2,770,479 582,656 1,887,849 140,533 142,066 5,623,583 28,118 11.5%
Country Inn/Suites 100,000 2,206,576 675,938 1,225,876 126,480 590,801 4,925,670 24,628 10.0%
Fairfield Inn/Suites 80,000 2,206,576 983,161 1,225,876 98,373 339,881 4,933,867 24,669 10.1%
Hampton Inn/Suites 95,000 2,451,752 0 1,961,401 137,722 424,396 5,070,271 25,351 10.3%
Holiday Inn 100,000 2,451,752 504,001 1,225,876 135,506 655,437 5,072,572 25,363 10.3%
Holiday Inn Express 100,000 2,942,102 504,001 1,471,051 135,506 643,051 5,795,711 28,979 11.8%
Howard Johnson 71,000 1,961,401 1,782,568 980,701 140,533 191,432 5,127,635 25,638 10.5%
La Quinta Inn & Suites 105,000 2,157,541 980,701 1,225,876 140,533 13,470 4,623,121 23,116 9.4%
Quality Inn/Suites 60,000 2,280,129 582,656 1,887,849 140,533 142,066 5,093,232 25,466 10.4%
Ramada 71,000 1,961,401 1,537,392 1,225,876 140,533 236,438 5,172,641 25,863 10.5%

- 27 -
HVS Franchise Fee Analysis Guide- First-Class
Brand
Total Initial
Fee
Total Royalty
Fee
Total Reservation
Fee
Total Marketing
Fee
Total
Frequent
Traveler Fee
Total Misc.
Fee
Total Ten-Year
Fee
Total Ten-
Year
Fee/Rooms
Percent of
Total Rooms
Revenue
aloft $127,500 $5,562,411 $1,391,730 $4,045,390 $380,282 $795,406 $12,302,719 $41,009 12.2%
Courtyard 120,000 5,562,411 1,697,843 2,022,695 208,691 430,160 10,041,801 33,473 9.9%
Crowne Plaza 150,000 5,056,738 758,750 3,157,852 443,571 1,083,385 10,650,296 35,501 10.5%
Doubletree Hotels 90,000 5,056,738 0 4,045,390 394,195 1,836,809 11,423,132 38,077 11.3%
Embassy Suites 90,000 4,753,333 0 4,045,390 394,195 578,649 9,861,567 32,872 9.8%
Four Points 127,500 5,562,411 2,557,793 1,264,184 380,282 1,176,862 11,069,033 36,897 10.9%
Hilton 92,500 6,877,163 0 4,045,390 435,933 1,255,164 12,706,151 42,354 12.6%
Hilton Garden Inn 127,500 5,056,738 0 4,348,794 435,933 526,535 10,495,500 34,985 10.4%
Hotel Indigo 150,000 5,056,738 756,001 3,539,716 443,571 1,170,811 11,116,837 37,056 11.0%
Hyatt Place 120,000 4,753,333 531,950 3,539,716 371,007 240,216 9,556,223 31,854 9.4%
Leading Hotels of the World 142,500 1,470,243 5,067,500 0 0 0 6,680,242 22,267 6.6%
Marriott 90,000 7,888,511 2,268,832 1,011,348 347,904 697,961 12,304,555 41,015 12.2%
Preferred Hotels and Resorts 25,000 687,833 1,146,388 229,278 0 137,567 2,226,065 11,130 2.2%
Radisson 160,000 5,056,738 2,117,195 2,022,695 556,510 506,260 10,419,398 34,731 10.3%
Renaissance 60,000 5,056,738 2,270,035 1,517,021 347,904 697,961 9,949,658 33,166 9.8%
Sheraton 115,000 7,281,702 2,557,793 1,011,348 380,282 1,522,774 12,868,899 42,896 12.7%
Westin 115,000 8,899,858 2,557,793 2,022,695 380,282 1,220,381 15,196,009 50,653 15.0%
Wyndham / Wyndham Garden 90,000 5,056,738 2,554,368 3,034,043 463,759 741,570 11,940,476 39,802 11.8%

- 28 -
Where to Download the HVS Franchise Fee Guidewww.hvs.com

- 29 -
Search Library- “Franchise”

- 30 -
Select One of Several Articles from HVS

- 31 -
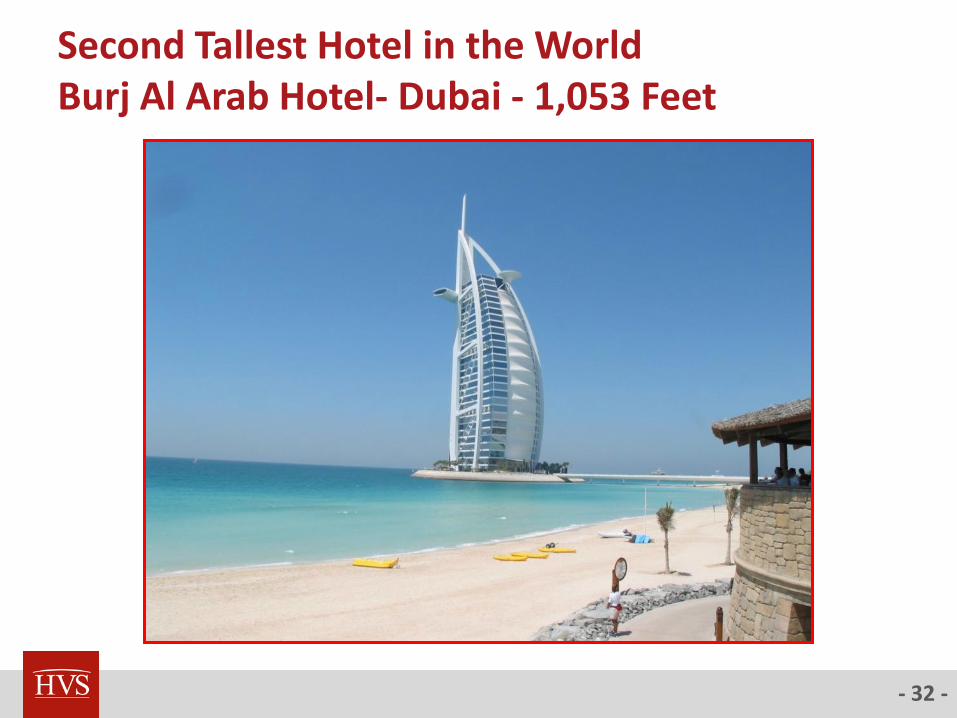
Unique Hotels of the World
- 32 -
Second Tallest Hotel in the WorldBurj Al Arab Hotel- Dubai - 1,053 Feet

- 33 -

- 34 -

- 35 -
- 36 -

- 37 -

- 38 -

- 39 -

- 40 -

- 41 -
- 42 -

- 43 -

- 44 -

- 45 -
- 46 -

- 47 -
Hotel Trivia

- 48 -

- 49 -


- 52 -

- 53 -

- 54 -

- 55 -

- 56 -
Thank You