trends, rhythms and events in plio-pleistocene african climate
TRANSCRIPT

lable at ScienceDirect
Quaternary Science Reviews 28 (2009) 399–411
Contents lists avai
Quaternary Science Reviews
journal homepage: www.elsevier .com/locate/quascirev
Trends, rhythms and events in Plio-Pleistocene African climate
Martin H. Trauth a,*, Juan C. Larrasoana b, Manfred Mudelsee c
a Institut fur Geowissenschaften, Universitat Potsdam, Karl-Liebknecht-Str. 24, 14476 Potsdam, Germanyb Institute of Earth Sciences Jaume Almera, CSIC, Sole i Sabaris s/n, Barcelona 08028, Spainc Climate Risk Analysis, Schneiderberg 26, 30167 Hannover, Germany
a r t i c l e i n f o
Article history:Received 18 July 2008Received in revised form21 October 2008Accepted 10 November 2008
* Corresponding author. Tel.: þ49 331 977 5810; faE-mail address: [email protected] (M.H.
0277-3791/$ – see front matter � 2008 Elsevier Ltd.doi:10.1016/j.quascirev.2008.11.003
a b s t r a c t
We analyzed published records of terrigenous dust flux from marine sediments off subtropical WestAfrica, the eastern Mediterranean Sea, and the Arabian Sea, and lake records from East Africa usingstatistical methods to detect trends, rhythms and events in Plio-Pleistocene African climate. The criticalreassessment of the environmental significance of dust flux and lake records removes the apparentinconsistencies between marine vs. terrestrial records of African climate variability. Based on theseresults, major steps in mammalian and hominin evolution occurred during episodes of a wetter, buthighly variable climate largely controlled by orbitally induced insolation changes in the low latitudes.
� 2008 Elsevier Ltd. All rights reserved.
1. Introduction
Comparisons of marine and terrestrial paleoclimate archiveshave resulted in contrasting views on high- vs. low-latitude forcingof East Africa’s climate and its role in mammalian and homininevolution (deMenocal, 1995, 2004; Trauth et al., 2005, 2007; Maslinand Christensen, 2007). Marine records of Saharan dust suggestthat major events in mammalian and hominin evolution weremediated by shifts towards more arid and variable conditionsduring the onset and amplification of high-latitude glacial cycles at2.8 (�0.2) Ma, 1.7 (�0.1) Ma, and 1.0 (�0.2) Ma, which weresuperimposed on a regime of subdued moisture availability(deMenocal, 1995, 2004). On the contrary, the chronology of Plio-Pleistocene lake-level variations in East Africa suggest that theseand other periods were characterized by the occurrence of large,but fluctuating lakes indicating consistency in wetter and moreseasonal conditions (Trauth et al., 2005, 2007). According to thisconcept, mammalian and hominin species seem to differentiallyoriginate and go extinct during periods of extreme climate vari-ability on high moisture levels controlled largely by low-latitudesolar heating, rather than by high-latitude ice volume variations(Trauth et al., 2007).
Crucial to any discussion of contrasting views of climate changesand its role in evolution is the correct assessment and unambiguousinterpretation of paleoclimatic data contained in marine vs.terrestrial archives. To date, marine dust records are the only typeof record that enable the study of Plio-Pleistocene African climate ata large range of timescales (106–103 years) (Tiedemann et al., 1994;
x: þ49 331 977 5700.Trauth).
All rights reserved.
deMenocal, 1995, 2004; Larrasoana et al., 2003). However, theevidence for a link between Saharo-Arabian dust deposition andchanges of the mammalian and hominin habitats in Sub-SaharanAfrica has not yet been substantiated. Unlike marine paleoclimaterecords, terrestrial records provide a more pristine view of envi-ronmental changes in East Africa, but fluctuating sedimentationrates combined with large dating errors in short and discontinuousrecords often hamper the correlation of environmental changesthrough time and space (Trauth et al., 2005, 2007).
Since long-term trends, shifts in the variability and abrupttransitions in African climates may have provided a catalyst forevolutionary changes, we statistically evaluate the significance oftrends, rhythms and events in records of Plio-Pleistocene envi-ronmental changes. We analyzed three representative long marinedust flux records off subtropical West Africa, the eastern Mediter-ranean Sea, and the Arabian Sea and one representative record ofglobal ice volume changes. Subsequently, we compared the resultsof our analysis with terrestrial records of Plio-Pleistocene Africanclimate. The results of this analysis help better understand theprocesses changing the habitat of mammals and hominins andtherefore provide a new basis for the discussion of climate–evolution linkages.
2. Proxy records for Plio-Pleistocene African climate
In this study, we analyzed three published records of terrige-nous dust flux from marine sediments from the Arabian Sea(deMenocal et al., 1991; deMenocal, 1995, 2004), the easternMediterranean Sea (Larrasoana et al., 2003) and off subtropicalWest Africa (Tiedemann et al., 1994) using statistical methods to
M.H. Trauth et al. / Quaternary Science Reviews 28 (2009) 399–411400
detect trends, rhythms and events in Plio-Pleistocene Africanclimate.
The Arabian Sea dust record (deMenocal et al., 1991; deMenocal,1995, 2004) is based on continuous whole-core measurements ofmagnetic susceptibility of sediments from ODP Sites 721 and 722,which were drilled near the crest of the Owen Ridge (Figs. 1 and 3).Magnetic susceptibility was converted to terrigenous dustpercentages using a regression model calculated from a suite ofmagnetic and terrigenous percent measurements on selectedsamples. The dust record is expressed by flux of aeolian dust(g cm�2 kyr�1), and is considered here back to 5 Ma. Age control forthis record was provided by an oxygen-isotope stratigraphy back to1.004 Ma (Clemens and Prell, 1991), four biostratigraphic agecontrol points at 1.110, 1.570, 1.900 and 3.540 Ma and theMatuyama/Gauss magnetic reversal at 88.3 m composite coredepth corresponding to 2.470 Ma using the chronology of Berggrenet al. (1985). The transport of dust into Site 721/722 (deMenocalet al., 1991; deMenocal, 1995, 2004) mainly occurs during borealsummer, when the NW blowing Shamal winds lift up dust from theArabian peninsula and transports it into the Arabian Sea over theSW Asian monsoon (deMenocal, 1995; Clemens, 1998; Prosperoet al., 2002), which might also transport dust from the Horn ofAfrica (Fig. 1). During boreal winter, the monsoonal circulation isreversed, so the NE Asian monsoon transports moisture from theArabian Sea into the Horn of Africa resulting in negligible dusttransport (Clemens, 1998).
The eastern Mediterranean dust record (Larrasoana et al., 2003)is based on continuous whole-core measurements of an artificiallyinduced magnetic remanence (labelled IRM@AF) of sediments fromODP Site 967, which was drilled in the northern slope of the Era-tosthenes Seamount (Figs. 1 and 4). The artificial remanence is anisothermal remanent magnetization (IRM) applied at 0.9 T that waslater demagnetized using an alternating magnetic field, and reflectsvariations in the amount of hematite delivered as a constituent ofaeolian dust. Here, we have converted IRM@AF intensities intohematite contents assuming that the IRM of hematite acquired at0.9 T is of w0.1 Am2/kg (Dunlop and Ozdemir, 1997). We have thenconverted hematite contents into dust contents considering atypical hematite concentration in eastern Mediterranean dust of6.5% in weight (Tomadini et al., 1984). The dust record extends backto 3 Ma, and is expressed by the flux of aeolian dust (g cm�2 kyr�1).The age model for this record is that of Kroon et al. (1998), and wasdeveloped by tuning the characteristic sapropel pattern to an orbitalprecession target curve. The age model is further constrained bynannofossil datums (Staerker, 1998) and by oxygen-isotope data forthe last million years, where the sapropel pattern is not as distinc-tive as before 1 Ma (Larrasoana et al., 2003). Transport of dust intothe eastern Mediterranean Sea mainly occurs in late winter andspring, in connection with the activity of Mediterranean depres-sions (Dayan et al., 1991; Goudie and Middleton, 2001) (Fig. 1). Thedust is transported northward from the northeastern Sahara at theeastern side of these so-called Sharav cyclones, while cold, high-latitude air invades the Mediterranean basin at the western side ofthe fronts (Dayan et al., 1991). Throughout the rest of the year,predominant NNE-blowing winds (Haboob) transport dust from thenortheastern Sahara into the central areas of the Sahara.
The subtropical West African dust record (Tiedemann et al.,1994) is based on the non-carbonate fraction of sediments fromODP Site 659, which was drilled on top of the Cape Verde Plateau(Figs. 1 and 5). The non-carbonate fraction is interpreted to repre-sent terrigenous dust supply because the concentration of biogenicopal, organic carbon, volcanic glass and other terrigenous compo-nents related with fluvial and turbiditic activity is considerednegligible. The dust record is expressed by flux of aeolian dust(g cm�2 kyr�1), and has an astronomically calibrated isotope time-scale back to 5 Ma that has been fined-tuned to the precessional
cycle (Tiedemann et al., 1994). This chronology has been readjustedby Clemens (1999), who identified several hiatuses in variousdepths of the sediment cores. The most significant differencebetween the original and revised age models is the addition ofa 41 kyr core break at ca 3.9 Ma (Clemens, 1999) that does affect theanalysis presented here. All other readjustments are in the order ofone precessional cycle or less and therefore not relevant to thisstudy. The transport of dust to Site 659 (Tiedemann et al., 1994) isgoverned by seasonal variations. During boreal summer, insolationmaxima over northern Africa lead to the formation of convectivesystems at around 18�N latitude (Fig. 1, upper panel) (Tetzlaff andPeters, 1988; Gasse, 2000). These low-pressure systems result fromthe low-level convergence of the moist SW monsoons and the dryNE trades, and are responsible for rainfall in the Sahel area (i.e.,between the Saharan desert and the subtropical savannah).Convergence along these convective systems also result in themobilization of dust and its injection into mid-tropospheric(2–5 km) levels, where it is transported westward into the tropicalAtlantic by the Saharan Air Layer (SAL) (Tetzlaff and Peters, 1988;Tiedemann et al., 1994; deMenocal, 1995; Goudie and Middleton,2001; Prospero et al., 2002). Dust uptake occurs along an E–Woriented band, which is located between 14�N and 25�N latitude,that extends from the Atlantic coast to the Chad basin and widenstowards the Atlantic Ocean (Goudie and Middleton, 2001; Prosperoet al., 2002). Trade winds, which undercut the SAL (Tetzlaff andPeters, 1988), also transport dust during the summer from theMauritanian and the Western Saharan coast into the tropicalAtlantic (Goudie and Middleton, 2001; Prospero et al., 2002).During boreal winter, the low-pressure systems migrate southwardfollowing increased sensible heating over subtropical southernAfrica (Gasse, 2000) (Fig. 1, lower panel). Transport of dust into thetropical Atlantic is then restricted to the action of the trade winds(deMenocal, 1995). Dust produced in the Chad basin during thewinter is transported into the equatorial Atlantic by the Harmattan(Goudie and Middleton, 2001; Prospero et al., 2002).
3. Paleoclimatic significance of the dust flux records
Dust production is related to a number of variables, among thembeing the most important the availability of fine-grained sedi-ments, which fuels formation of small (<10 mm) dust particles, andrainfall, which enables the growth of vegetation that stabilizessurface sediments against deflation (Middleton, 1985; Prosperoet al., 2002). Based on an exhaustive examination of global dust-source areas derived from Total Ozone Mapping Spectrometer(TOMS) analyses, Prospero et al. (2002) have demonstrated thatmost of the major dust producing areas around the globe arelocated in topographic lows that are characterized by (1) an arid orhyperarid climate (<200–250 mm annual rainfall) that results inthe absence of the vegetation cover, (2) the presence of ephemeralstreams that transport sediments from surrounding reliefs toterminal alluvial fans, playas and saline lakes, and (3) the evidencefor recent pluvial activity, which is manifested by the presence offluvial, alluvial, deltaic and lacustrine sediments. This paradoxicallink between present-day aridity, ephemeral fluvial activity anda past pluvial history with the production of dust suggest that dustis not so much an indicator of aridity as it is of a recent transitionfrom a relatively wet to an arid or hyperarid climate (Goudie andMiddleton, 2001; Prospero et al., 2002).
The Holocene represents the last wet-arid transition in theSaharan desert, therefore it can provide the clues to evaluate thepaleoclimatic significance of sedimentary dust records in peri-Saharan ocean basins during the Plio-Pleistocene. Widespreadgeological, paleoclimatic, paleontologic, palynological and archae-ological evidence scattered throughout the whole Saharan desertdemonstrates that during the early-middle Holocene period

0°
10°
20°
30°
40°N0°10°20°W 10° 20° 30° 40° 50° 60°E
Site659
Site 967
Site721/722
3
12
21
12
3
21
21
0
0
1212
1212
3
L
HH H
LL
L
21
2
Sit
3
21
12
L
H
L
JJA
Surface winds (<2 km) High winds (2-6 km)
Monsoons
Trades*
Sharav**Saharan
AirLayer* Shamal***
low-pressureLH high-pressure
Meteorology
Harmattan*
Biogeography
desert & semidesertsavannahtropical rainforestmontane12 AAI
0°
10°
20°
30°
40°N
0°10°20°W 10° 20° 30° 40° 50° 60°E
Site659
Site 967
Site721/722
EARS
EARS
mediterranean
L
H
LL
L
H
L LL
DJF
L
L
3
12
21
1221
21
0
0
1212
1212
3
3
Fig. 1. Map with the location of the three studied ODP sites 659 (Tiedemann et al., 1994), 721/722 (deMenocal, 1995, 2004) and 967 (Larrasoana et al., 2003), which showsvegetation zones (after White, 1983) and the general pattern of summer (June/July/August, upper Panel) and winter (December/January/February, lower Panel) wind and pressuresystems (after Tetzlaff and Peters, 1988; Dayan et al., 1991; Tiedemann et al., 1994; deMenocal, 1995, 2004; Clemens, 1998; Gasse, 2000; Goudie and Middleton, 2001; Prospero et al.,2002) over North Africa and the Arabian peninsula. Wind systems transporting dust over the Atlantic Ocean, the Mediterranean Sea, and the Arabian Sea are marked by *, ** and ***,respectively. Height of dust-carrying winds refers to the sea surface over which the blow. Annual aerosol index (AAI) contours delineating main dust-source areas are after Goudieand Middleton (2001). Red dots mark the location of Plio-Pleistocene lake basins in the East African Rift System (EARS) studied by Trauth et al. (2005, 2007).
M.H. Trauth et al. / Quaternary Science Reviews 28 (2009) 399–411 401
(ca 10–6 kyr BP), the present-day largest hyperarid desert on earthwas dominated by savannah landscapes that extended as far northand east as to the Libyan desert (eastern Libya and western Egypt)(Jolly et al., 1998). Pollen, faunal and archaeological data indicatethat the entire Sahara was then covered by sparsely woodedgrasslands and was inhabited by savannah to semi-desert dwellers,including humans (Nicoll, 2004; Kuper and Kropelin, 2006).Moreover, the Sahara hosted fluvial networks and wetland areas, insome cases as large as present-day east African lakes at that time(Schuster et al., 2005; Armitage et al., 2007). This ‘‘greening of theSahara’’ has been linked to an intensification of the West African
monsoon, whose summer front shifted w800 km northward due topositive vegetation-albedo feedbacks, in response to a maximum inboreal summer insolation, and hence in sensible heating, over theSahara at that time (Brovkin et al., 1998; Jolly et al., 1998; Gasse,2000). From w7 kyr BP onwards, decreased boreal summer inso-lation lead to the weakening of the monsoon and the southwardretreat of its summer front, which conditioned the return ofhyperarid desert conditions to the Sahara (Brovkin et al., 1998;deMenocal et al., 2000; Gasse, 2000).
The ‘‘green Sahara’’ scenario explains the dust minimumobserved for the early-middle Holocene in the tropical Atlantic

M.H. Trauth et al. / Quaternary Science Reviews 28 (2009) 399–411402
region where ODP Site 659 is located (w22�N) (deMenocal et al.,2000; Adkins et al., 2006). As the summer convective systems andthe SAL increasingly shifted northwards over the course of theearly-middle Holocene, they mobilized dust in desert areas locatedahead of the also northward migrating desert-savannah boundary,until it eventually reached its maximum northward position atw25�N (Gasse, 2000). This interpretation explains the paradoxicalmaximum in dust contents in marine records from the NorthCanary basin (w32�N) during the early-middle Holocene (Morenoet al., 2001; Bozzano et al., 2002; Kuhlmann et al., 2004), despitethe simultaneous ‘‘green Sahara’’ scenario evidenced by paleo-climate and climate modeling data. The southward shift of thesummer monsoon front after w7 kyr BP, followed by a migrationof the desert-savannah boundary at w5 kyr BP (deMenocal et al.,2000; Liu et al., 2007), results in different scenarios for productionand transport of dust depending on latitudinal position. In thetropical Atlantic region where ODP Site 659 is located (w22�N),dust flux experiences a marked increase at that time (deMenocalet al., 2000; Adkins et al., 2006). This increase is conditioned bythe presence of early-middle Holocene fluvial and lacustrinesediments in the present-day Sahel, which fuels the production oflarge amounts of dust that are easily deflated, uplifted and trans-ported into the tropical Atlantic by the convective systems and theSAL. In the North Canary basin, however, decreased dust contents(Moreno et al., 2001; Bozzano et al., 2002) attests to the southwardshift of the convective systems and the SAL, which cannot transportdust into the open ocean despite of the availability of early-middleHolocene fluvial and lacustrine sediments and prevailing hyperaridconditions in the Sahara at w25�N. This situation described forthe early-middle Holocene also explains variations in dust contentsback in time. Thus, ‘‘yellow Sahara’’ periods driven by minima inboreal summer insolation result in systematic highest dustcontents in the tropical Atlantic (ODP Site 659, Tiedemann et al.,1994), but coincide systematically with lowest dust contents in theNorth Canary Basin (Moreno et al., 2001; Bozzano et al., 2002;Kuhlmann et al., 2004) in response to the southward migration ofthe summer convective systems and the SAL.
The interpretation of the Arabian Sea dust records might bemore complicated than those from the Atlantic Ocean because(1) the Arabian Sea receives dust mainly from the ArabianPeninsula (Prospero et al., 2002), but might also receive dustfrom the Horn of Africa (Jung et al., 2004), (2) the Arabian Sea isunder the influence of both the East African and the SW Asianmonsoons, which might respond differently to insolation forcing(Weldeab et al., 2007), and (3) in contrast to the West Africanmonsoon, the geographical extent of changes in vegetation coverthroughout the putative dust sources, and therefore its influenceon dust production is not well constrained. In any case, theproduction of dust in the different source areas and its transportinto the Arabian Sea are both linked to monsoon dynamics, andseparating the contribution of these two effects from dust fluxrecords might be very complex. Interpretation of eastern Medi-terranean dust records is simpler because, in contrast to theAtlantic Ocean and Arabian Sea, the mechanisms that control thetransport of dust and those that modulate dust production aregenetically unrelated. Thus, the activity of Mediterraneandepressions, which transport dust from the northeastern Saharain late winter and spring, is independent from West Africanmonsoon dynamics, which modulates dust production within theSahara through the ‘‘greening of the Sahara’’ mechanism. For thisreason, ODP Site 967 shows a marked decrease in dust fluxduring the early-middle Holocene in response to damped dustproduction in the northeastern Sahara under a ‘‘green Sahara’’scenario (Larrasoana et al., 2003), despite of a simultaneousincrease in activity of the Mediterranean depressions (Duplessyet al., 2005).
4. Statistical methods to detect trends, rhythms and events
The statistical analysis of dust records provides a fundamentalsource of information about the trends, rhythms and events inPlio-Pleistocene African climate change. We analyzed the threerepresentative long dust records from the eastern subtropicalAtlantic Ocean, eastern Mediterranean Sea and Arabian Sea forsignificant trends in central tendency and dispersion, significantorbital cycles, and the transitions in the eccentricity, obliquityand precession frequency bands. The identical suite of algo-rithms is used to analyze the ODP 659 benthic oxygen-isotoperecord.
The long-term trends in paleoclimate time series are usuallymapped using a classical linear regression analysis. Classicalregression, however, is based on the assumption of a normaldistribution in the deviations of the observed values from theregression line. If the distribution of errors is asymmetric or proneto outliers, model assumptions are invalidated, and parameterestimates, confidence intervals, and other computed statisticsbecome unreliable. Robust regression as an alternative to classicalregression implements a robust fitting method that is less sensitivethan ordinary least squares to large changes in small parts of thedata (Holland and Welsch, 1977). We also applied a new para-metric, nonlinear regression technique called ‘‘breakfit regression’’to quantify trends that allow for change points (Mudelsee, inpreparation). The ‘‘break model’’ is a continuous, but not neces-sarily differentiable function consisting of two linear parts that arejoined at time t2. The break model can be fitted to data usinga weighted least-squares criterion combined with a brute-forcesearch for t2. A similar model (‘ramp’), consisting of three parts, hasbeen previously introduced (Mudelsee, 2000). The statisticaluncertainties of the break model parameters, in particular of t2,were determined using 400 block bootstrap simulations (Kunsch,1989). The block bootstrap preserves distributional shape andserial dependence over the length of a block. Higher autocorrela-tion in the time series requires to use a larger block length (Carl-stein, 1986). For details on bootstrap resampling in regressionproblems and numerical techniques, see Mudelsee (2000). All t2estimates are given with standard error; note that the standarderrors are 1.4826 times MAD, where MAD is the median of absolutedistances to the median. That is, this standard error is a robustversion of the standard deviation.
A number of methods are available to detect more abruptchanges in paleoclimate records in the time domain, e.g. the rampfitmethod (Mudelsee and Stattegger, 1997; Mudelsee, 2000) and in thefrequency domain, e.g., evolutionary Blackman-Tukey power-spectrum and Wavelet powerspectrum (e.g., Lau and Weng, 1995;Mackenzie et al., 2001). In most cases, trends and events in the timeand frequency domain are detected by computing the statisticalparameters of the data (e.g., measures of central tendency anddispersion) contained in a sliding window of length L. The precisionof these parameters depends on the length of the window, i.e., anaccurate value for the mean and the variance is obtained if L is large.On the other hand, a larger window reduces the accuracy of theestimate for a change in these parameters. This problem is oftendescribed as Grenander’s uncertainty principle of statistics(Grenander, 1958). Performing a statistical test to assess thedifference in the central tendency and dispersion of the data con-tained in a paired sliding window, however, partly overcomes thisproblem if only the knowledge of the location of a sharp transitionin statistical parameters is required.
The classic t- and F-test statistic are often used to comparemeans and variances of two sets of measurements and couldtherefore be used to detect shifts in the location and dispersionbetween two sliding windows. These two tests, however, make thebasic assumption that these samples were collected from

2 x 15 kyrPaired Window Size 2 x 30 kyr
2 x 50 kyr
Lo
g(p
)D
ust F
lu
x
40
-50
-25
0
0
20
2 x 15 kyrPaired Window Size 2 x 30 kyr
2 x 50 kyr
0 50 100 150 200 250 300 350 400 450 500Age
Lo
g(p
)
-80
-20
0
Synthetic Dust Flux
Running Mann-Withney Test
Running Ansari-Bradley Test
A
B
C
Fig. 2. Running Mann–Whitney and Ansari–Bradley tests of synthetic dust flux record. (A) Log-normal distributed noise. After 250 kyr the mean and variance of the data shiftstowards a lower value. (B) Result of a running Mann–Whitney test for three different lengths of the paired sliding windows (150, 250 and 500 data points, equivalent to 15, 25 and50 kyr). The length of the window clearly influences the amplitude and width of the maxima of the parameter, whereas the location of the transition in the means is well defined.(C) Result of a running Ansari–Bradley test for three different lengths of the paired sliding windows (150, 250 and 500 data points, equivalent to 15, 25 and 50 kyr). The length of thewindow clearly influences the amplitude and width of the maxima of the parameter, whereas the location of the transition in the dispersion is well defined.
M.H. Trauth et al. / Quaternary Science Reviews 28 (2009) 399–411 403
a Gaussian distribution. At least the dust records, however, clearlyshow a significant positive skewness since they have a lower limitof zero and a large dispersion. The non-parametric Mann–Whitneyand Ansari–Bradley tests, however, provide a more elegant solutionto the problem independent from the distribution that is beingused. The Mann–Whitney U-test (also called the Wilcoxon or Mann–Whitney–Wilcoxon test; Mann and Whitney, 1947; Lepage, 1971)performs a two-sided rank sum test of the null hypothesis that twosamples come from identical continuous distributions with equalmedians, against the alternative that they do not have equalmedians. The Ansari–Bradley test performs a two-sided test thattwo independent samples come from the same distribution, againstthe alternative that they come from distributions that have thesame median and shape but different dispersions (Ansari andBradley, 1960; Lepage, 1971).
We first demonstrate the performance of the running Mann–Whitney and Ansari–Bradley test on two synthetic dust recordswith significant shifts in the measures of central tendency (mean,median, and mode) and dispersion (range, variance, and quantiles)in the middle of the time series (Fig. 2). The time axis runs from0.1 to 500 kyr with 0.1 kyr intervals. At 250 kyr the mean of thelog-normal distributed data shifts from initially 1.0 to a value of 1.3and the variance changes from 0.5 to 1.3 (Fig. 2, Panel A). Theresult of a running Mann–Whitney test for three different lengthsof the paired sliding windows (150, 250 and 500 data points,equivalent to 15, 25 and 50 kyr) reveals that the length of thewindow influences the amplitude and width of the maxima of thetest parameter, whereas the location of the transition in the meansis well defined (Fig. 2, Panel B). Fig. 2, Panel C shows the result ofa running Ansari–Bradley test for three different lengths of thepaired sliding windows (150, 250 and 500 data points, equivalentto 15, 25 and 50 kyr). The length of the window clearly influencesthe amplitude and width of the maxima of the test parameter,whereas the location of the transition in the dispersion is welldefined.
5. Results
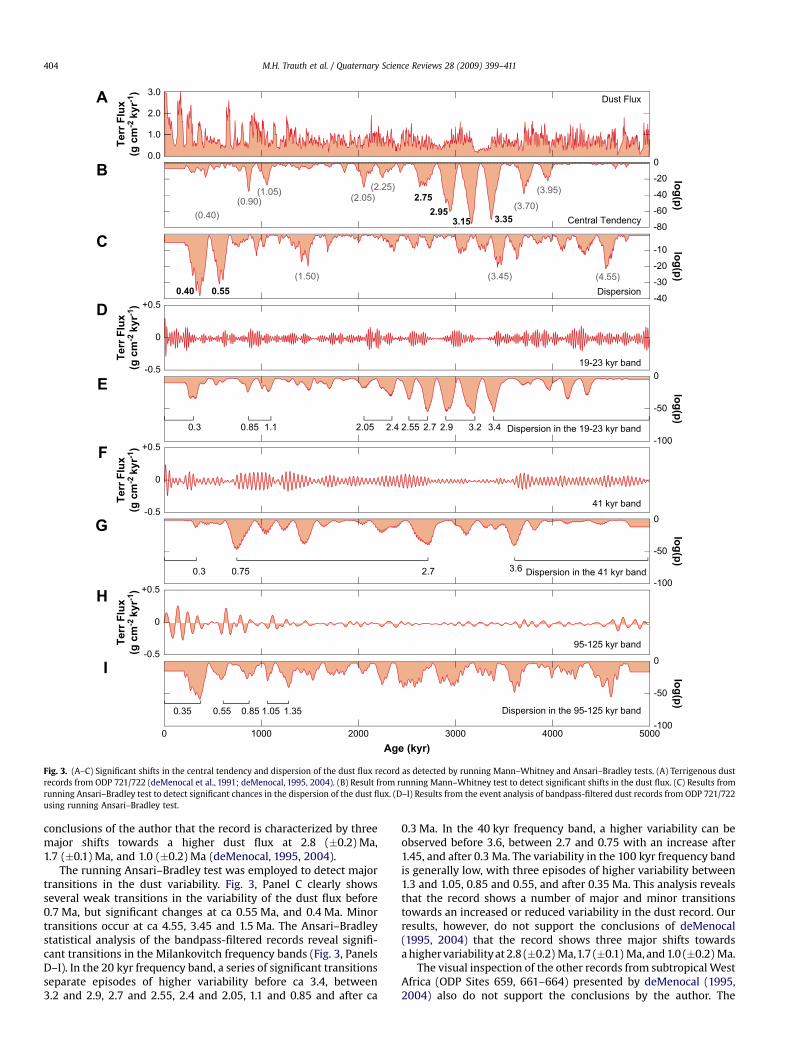
We apply the running Mann–Whitney and Ansari–Bradley teststo some of the established records of environmental change. First, weanalyze the terrigenous dust flux (in g cm�2 kyr�1) of ODP Site721/722 from the Arabian Sea available for download from theauthor’s webpage (deMenocal et al., 1991; deMenocal, 1995, 2004)(Fig. 3). The astronomically tuned record contains 2958 data points,the time axis runs from 6.35 to 5414.40 kyr, therefore the averagespacing of subsequent data points is ca 1.83 kyr. The dust recordshows a very weak, but significant linear trend ofþ3.6�10�5 g cm�2 kyr�2, assuming that the time axis runs from pastto present. The absolute increase of the dust flux values amounts to0.17 g cm�2 kyr�1 or 21% of the range of detrended data during thepast five million years. However, most of this increase is attributed tohigh dust values occurring during the last two million years of therecord. Breakfit regression detects a change point in the dust recordat 1.86� 0.44 Ma (robust 1-sigma error) indicating a strongerincrease in the dust flux values after this event.
We resample the data set upon an evenly spaced time axisrunning from 8 to 5000 kyr in 2 kyr intervals using a linear inter-polation technique. The running Mann–Whitney and Ansari–Bradley tests are computed for two adjacent sliding windows of thesize L¼ 100 data points equivalent to 200 kyr each (Fig. 3, Panel B).The plot of the Mann–Whitney test statistic clearly marks the mostsignificant transitions in the original data (Fig. 3, Panels A and B).The most significant changes in the record occur at 3.35 and3.15 Ma marking the onset and termination of a period of signifi-cantly reduced dust flux. A less pronounced, but also significantepisode of reduced dust flux occurs between 2.95 and ca 2.75 Ma,also marked in the running Mann–Whitney test. The record showsa number of less pronounced transitions, e.g., at ca 3.95, 3.70, 2.25,2.05, 1.05, 0.90 and 0.40 Ma. This analysis reveals that the recordshows a number of major and minor transitions towards a higher orlower dust flux. Our results, however, do not support the
3.0
2.0
1.0
0.00
-20
-40
-60
-80
-10
-20
-30
-40
Terr F
lu
x
(g
cm
-2 kyr-1)
+0.5
0
-0.5
Terr F
lu
x
(g
cm
-2 kyr-1)
+0.5
0
-0.5
Terr F
lu
x
(g
cm
-2 k
yr-1)
+0.5
0
-0.5
Terr F
lu
x
(g
cm
-2 k
yr-1)
lo
g(p
)lo
g(p
)
0
-50
-100
lo
g(p
)
0
-50
-100
lo
g(p
)
0
-50
-100
lo
g(p
)
0 1000 2000 3000 4000 5000Age (kyr)
Dust Flux
Central Tendency
Dispersion
19-23 kyr band
Dispersion in the 19-23 kyr band
95-125 kyr band
Dispersion in the 95-125 kyr band
41 kyr band
Dispersion in the 41 kyr band
3.35
(3.95)
(3.70)(2.05)
(2.25)
(4.55)(3.45)(1.50)
(1.05)(0.90)
(0.40)3.15
2.95
0.3 0.85 1.1 2.05 2.4 2.55 2.7 2.9 3.2 3.4
2.75
0.550.40
3.62.70.750.3
0.35 1.05 1.350.55 0.85
A
D
E
F
G
H
I
B
C
Fig. 3. (A–C) Significant shifts in the central tendency and dispersion of the dust flux record as detected by running Mann–Whitney and Ansari–Bradley tests. (A) Terrigenous dustrecords from ODP 721/722 (deMenocal et al., 1991; deMenocal, 1995, 2004). (B) Result from running Mann–Whitney test to detect significant shifts in the dust flux. (C) Results fromrunning Ansari–Bradley test to detect significant chances in the dispersion of the dust flux. (D–I) Results from the event analysis of bandpass-filtered dust records from ODP 721/722using running Ansari–Bradley test.
M.H. Trauth et al. / Quaternary Science Reviews 28 (2009) 399–411404
conclusions of the author that the record is characterized by threemajor shifts towards a higher dust flux at 2.8 (�0.2) Ma,1.7 (�0.1) Ma, and 1.0 (�0.2) Ma (deMenocal, 1995, 2004).
The running Ansari–Bradley test was employed to detect majortransitions in the dust variability. Fig. 3, Panel C clearly showsseveral weak transitions in the variability of the dust flux before0.7 Ma, but significant changes at ca 0.55 Ma, and 0.4 Ma. Minortransitions occur at ca 4.55, 3.45 and 1.5 Ma. The Ansari–Bradleystatistical analysis of the bandpass-filtered records reveal signifi-cant transitions in the Milankovitch frequency bands (Fig. 3, PanelsD–I). In the 20 kyr frequency band, a series of significant transitionsseparate episodes of higher variability before ca 3.4, between3.2 and 2.9, 2.7 and 2.55, 2.4 and 2.05, 1.1 and 0.85 and after ca
0.3 Ma. In the 40 kyr frequency band, a higher variability can beobserved before 3.6, between 2.7 and 0.75 with an increase after1.45, and after 0.3 Ma. The variability in the 100 kyr frequency bandis generally low, with three episodes of higher variability between1.3 and 1.05, 0.85 and 0.55, and after 0.35 Ma. This analysis revealsthat the record shows a number of major and minor transitionstowards an increased or reduced variability in the dust record. Ourresults, however, do not support the conclusions of deMenocal(1995, 2004) that the record shows three major shifts towardsa higher variability at 2.8 (�0.2) Ma,1.7 (�0.1) Ma, and 1.0 (�0.2) Ma.
The visual inspection of the other records from subtropical WestAfrica (ODP Sites 659, 661–664) presented by deMenocal (1995,2004) also do not support the conclusions by the author. The

M.H. Trauth et al. / Quaternary Science Reviews 28 (2009) 399–411 405
records of Sites 659 and 661, similar to 721/722 only show a veryweak positive trend towards higher values during the last 4.5 Ma.These records do not show any significant transitions in themeasures of central tendency or dispersion. The record of Site 664shows a relatively abrupt transition towards higher values at ca3.2 Ma, whereas a similar transition occurs at ca 2.85 Ma in therecord of Site 664. The author does not explain the difference of0.35 Ma in the timing of this transition, and why these transitionsdo not occur in the other records. The record of Site 664 also showsa transition at ca 1.2 Ma, which is not obvious in any other record. Inan earlier publication on these records, deMenocal et al. (1991)proposed a shift in the mode of dust deposition at 2.4 Ma. Theauthors present four powerspectra integrating over the 0.1–1.0 Ma,1.0–1.6 Ma, 1.6–2.5 Ma, and 2.5–3.2 Ma intervals. According to thispublication, the record varies almost purely at 23–19 kyr period-icities between 3.2 and 2.4 Ma. A strong precession cycle isobserved also after 2.4 Ma, but there is a significant increase in thevariability at the 41 kyr periodicity after 2.4 Ma. The graphs pre-sented by the authors do not show this shift in the 41 kyr frequencyband. Instead, the amplitude of the precessional cycle relative tothe obliquity cycle decreases with time, with a return of a slightlystronger precessional cycle in the 0–1.0 Ma interval, but notreaching the amplitude of the obliquity cycle. Our results accordingto the more detailed running Ansari–Bradley test analysis does notsupport this interpretation of the ODP 721/722 record.
Next, we apply the same approach to analyze the Eastern Medi-terranean dust record from ODP 967 published by Larrasoana et al.(2003). This tuned record contains 8417 dust flux data between268.9 kyr and 3028.0 kyr in 359.8� 313.4 yr intervals. The dustrecord shows significant linear trend of þ3.6�10�5 g cm�2 kyr�2.The absolute increase of the dust flux values amounts to0.17 g cm�2 kyr�1 or 24% of the range of detrended data during thepast three million years. Breakfit regression detects a change point inthe dust record at 1.44� 0.20 Ma (robust 1-sigma error) indicatinga stronger increase in the dust flux values after this event.
We interpolate this data set upon an evenly spaced time axisrunning from 8 to 3000 kyr in 2 kyr intervals using a linear inter-polation technique. We also apply the running Mann–Whitney andAnsari–Bradley tests to the full record and also to the 20, 40 and100 kyr frequency bands (Fig. 4, Panels Bþ C). The Mann–Whitneytest reveals a number of significant transitions, e.g., near 2.55, 2.35,2.20, 1.95, 1.70, 1.30, 1.1, 0.95, 0.7 and 0.45 Ma, among many others(Fig. 4, Panel B). The transition at 2.55 Ma terminates a longerperiod of reduced dust flux values, whereas the transitions at 1.9and 1.7 Ma bracket a second episode of lower dust values. Also, ataround 1.0 Ma, a period of reduced dust flux is observed, followedby a strong increase in the dust values at ca 0.95 Ma. After ca0.2 Ma, the dust values are significantly increased. The variability ofthe dust flux data shows a step-wise increase at ca 0.9 and at ca0.2 Ma (Fig. 4, Panel C). In the 20 kyr frequency band, higheramplitudes can be observed before 2.6, between 2.25 and 1.9, 1.5and 1.4, 1.2 and 0.5 (in particular between 0.95 and 0.8 Ma), andafter 0.35 Ma (Fig. 4, Panels D–I). The 40 kyr frequency band showshigher amplitudes between 2.9 and 2.0, 1.7 and 1.0, 0.8 and 0.6 andafter 0.4 Ma. The amplitude of the 100 kyr cycle is generally verylow. Episodes of larger amplitudes occur between 1.9 and 1.7, 1.25and 0.8, and after 0.6 Ma.
The next example under investigation is the ODP 659 dustrecord off West Africa published by Tiedemann et al. (1994). Thedust flux record is tuned to the precessional cycle and contains1236 data points between 1.96 and 5231.81 kyr in 4.22� 2.92 kyrintervals. The dust record shows a very weak, but significant lineartrend of þ10.0�10�5 g cm�2 kyr�2. The absolute increase of thedust flux values amounts to 0.51 g cm�2 kyr�1 or 18% of the range ofdetrended data during the past five million years. Breakfit regres-sion detects a change point in the dust record at 1.62� 0.82 Ma
(robust 1-sigma error) indicating a stronger increase in the dustflux values after this event.
We again interpolated the record upon an evenly spaced timeaxis running from 8 to 5000 kyr in 2 kyr intervals knowing that wethen increase the number of data points by a factor of two.However, this is the best solution between significantly reducingthe resolution of the ODP 967 record and increasing the resolutionof this record. The running Mann–Whitney test of a paired 200 kyrsliding window reveals a number of significant transitions, inparticular at 4.4 Ma, among many others (Fig. 5, Panel B). Therunning Ansari–Bradley test also shows numerous transitions inthe variability of the record, for instance a transition from higher tolower variability at ca 3.7 Ma after, a gradual increase of the vari-ability until 3.0 Ma, a return to lower values after 3.0 Ma and againhigher values after 2.8 Ma (Fig. 5, Panel C). A significant shifttowards higher values can also be observed after 1.5 Ma.
The running Ansari–Bradley test indicates that the amplitude ofthe 41 kyr cycle indeed increases after ca 3 Ma. The true transitionon 0.1 Ma timescales is at ca 2.8/2.7 Ma, besides a short interval ofa reduced obliquity cycle also between 2.2 and 1.4 Ma, according tothe results from the running Ansari–Bradley test. Again looking athalf-million year timescales, the 19 and 23 kyr cycle indeedswitches towards reduced amplitudes at ca 1.5 Ma (Fig. 5, Panels D–I). More precisely, the most significant transitions occur at 2.3 Matowards higher values with a return to lower amplitudes after2.0 Ma. A second interval of reduced amplitudes occurs between ca0.8 and 0.3 Ma. The 100 kyr frequency band shows sharp transi-tions near 3.2 and 3.0 marking an interval of higher amplitudes, anda shift towards higher values at ca 1.6 Ma. In summary, the statis-tical analysis performed here validates the interpretations by Tie-demann et al. (1994), which marked the observed transitions ontimescales of half million years.
Our final example is the ODP 659 benthic oxygen-isotope recordalso published by Tiedemann et al. (1994). The isotope record usingthe author’s age model shows a significant linear trend ofþ2.6�10�4
& kyr�1. The absolute increase of the isotope valuesamounts to 1.34& or 51% of the range of detrended data during thepast five million years. The isotope data are interpolated upon thesame time axis as before. The running Mann–Whitney test revealsa number of significant transitions, in particular near 4.0, 3.0, 1.7and 1.0 Ma (Fig. 6, Panel B). The running Ansari–Bradley test alsoshows numerous transitions in the variability of the record, forinstance a transition towards higher values near 4.15, 3.3, 2.3, 1.5and 0.5 Ma (Fig. 6, Panel C). The 20 kyr frequency band shows anincrease in the amplitudes at ca 1.9 Ma, the 40 kyr frequency bandgets more important after ca 3.0 Ma, whereas the 100 kyr cycles areimportant after ca 1.3 Ma (Fig. 6, Panels D–I).
6. Discussion
Our statistical analysis illustrates the similarities and differencesin records of Plio-Pleistocene environmental changes acrossdifferent timescales (Fig. 7). On timescales of 106 years, the dustflux records from the Arabian Sea (deMenocal, 1995, 2004), theeastern Mediterranean Sea (Larrasoana et al., 2003) and theAtlantic Ocean (Tiedemann et al., 1994) show an increase of 21, 24and 18% of the range of the detrended records, respectively. Thistrend is comparable between the three records, but is much lowerthan the 51% increase observed in the benthic isotope record fromODP Site 659. In the 106 year frequency band, however, the breakfitregression results indicate that a trend towards higher dust fluxvalues starts (within the error bars) at ca 1.4–1.9 Ma in the threerecords, which then culminate with significantly higher dust fluxesfrom 1 Ma onwards (Fig. 7). This apparent increase in Africanaridity at ca 1.5 Ma and its culmination by 1 Ma matches theprogressive vegetation shift from C3 (wtrees and shrubs) to C4

10.80.60.40.2
00
-20
-40
-60-80
-10
-20
-30-40
Terr F
lu
x
(g
cm
-2 kyr-1)
+0.5
0
-0.5
Terr F
lu
x
(g
cm
-2 kyr-1)
+0.5
0
-0.5
Terr F
lu
x
(g
cm
-2 k
yr-1)
+0.25
0
-0.25
Terr F
lu
x
(g
cm
-2 k
yr-1)
lo
g(p
)lo
g(p
)
0
-50
-100
lo
g(p
)
0
-50
-100
lo
g(p
)
0
-50
-100
lo
g(p
)
0 1000 2000 3000 4000 5000Age (kyr)
Dust Flux
Central Tendency
Dispersion
19-23 kyr band
Dispersion in the 19-23 kyr band
95-125 kyr band
Dispersion in the 95-125 kyr band
41 kyr band
Dispersion in the 41 kyr band
2.6
0.45 0.71.1
0.95
1.3 1.7
1.95
2.22.35 2.55
1.9 2.250.50.35 1.2 1.4 1.5
1.0 1.70.80.6
1.91.70.6 1.250.8
0.4 2.0 2.9
0.90.2
A
B
C
D
E
F
G
H
I
Fig. 4. (A–C) Significant shifts in the central tendency and dispersion of the dust flux record as detected by running Mann–Whitney and Ansari–Bradley tests. (A) Terrigenous dustrecords from ODP 967 (Larrasoana et al., 2003). (B) Result from running Mann–Whitney test to detect significant shifts in the dust flux. (C) Results from running Ansari–Bradley testto detect significant chances in the dispersion of the dust flux. (D–I) Results from the event analysis of bandpass-filtered dust records from ODP 967 using running Ansari–Bradleytest.
M.H. Trauth et al. / Quaternary Science Reviews 28 (2009) 399–411406
(wtropical grasses) plants between ca 1.5 and 0.7 Ma as derivedfrom stable carbon isotope records (Segalen et al., 2007). Asopposed to the dust flux, oxygen-isotope values progressivelyincrease over the full length of the record, which is marked bysignificant transitions in the mean and variance at the intensifica-tion of the Northern Hemisphere Glaciation (3.5–2.5 Ma, INHG)(Berger and Jansen, 1994; Mudelsee and Raymo, 2005) and theMid-Pleistocene Transition (MPT, 1.0–0.7 Ma) (Mudelsee andSchulz, 1997; Mudelsee and Stattegger, 1997; Haug and Tiedemann,1998; Zachos et al., 2001). This observation contradicts thehypothesis of a gradual increase in African aridity developed afterthe INHG (deMenocal, 2004) and suggests that African aridity
responded to large ice caps only after a threshold ice volume thatwas attained during the MPT.
The examination of the shorter (104 year) frequency bandreveals that precessional (19–23 kyr) and obliquity (41 kyr) forcingis continuous through most of the three dust records (Fig. 1). Thew100 kyr eccentricity band is continuously expressed throughmost of the ODP Site 659 record, but is evident in sites 721/722 and967 only after w0.8 Ma and w1.2 Ma, respectively. These resultscontradict previous interpretations proposing step-like increases inthe amplitude of obliquity modulation of dust fluxes at 2.8(�0.2) Ma and 1.7 (�0.1) Ma, and also discard a common pattern ofsignificant eccentricity modulation of dust fluxes only after 1.0

Dispersion in the 19-23 kyr band
Dispersion in the 41 kyr band
3.0
2.0
1.0
0.0 0
-20
-40
-60-80
-10
-20
-30-40
Te
rr F
lu
x
(g
c
m-2 k
yr-1)
Te
rr F
lu
x
(g
c
m-2 k
yr-1)
Terr F
lu
x
(g
cm
-2 kyr-1)
Terr F
lu
x
(g
cm
-2 kyr-1)
+0.5
0
-0.5
+0.5
0
-0.5
+0.5
0
-0.5
lo
g(p
)lo
g(p
)
0
-50
-100
lo
g(p
)lo
g(p
)
0
-50
-100
lo
g(p
)
0 1000 2000 3000 4000 5000Age (kyr)
Dust Flux
Central Tendency
Dispersion
19-23 kyr band
95-125 kyr band
Dispersion in the 95-125 kyr band
41 kyr band
4.44.24.03.83.53.33.02.92.72.252.11.71.50.60.5 4.6
3.7
4.03.33.5
ca. 1.0ca. 0.6
2.8 3.01.6 ca. 2.3
2.752.24.6
3.0 3.2ca. 1.6
1.4
2.050.4 2.4
A
B
C
D
E
F
G
H
I
Fig. 5. (A–C) Significant shifts in the central tendency and dispersion of the dust flux record as detected by running Mann–Whitney and Ansari–Bradley tests. (A) Terrigenous dustrecords from ODP 659 (Tiedemann et al., 1994). (B) Result from running Mann–Whitney test to detect significant shifts in the dust flux. (C) Results from running Ansari–Bradley testto detect significant chances in the dispersion of the dust flux. (D–I) Results from the event analysis of bandpass-filtered dust records from ODP 659 using running Ansari–Bradleytest.
M.H. Trauth et al. / Quaternary Science Reviews 28 (2009) 399–411 407
(�0.2) Ma (deMenocal, 1995, 2004). Instead, break regressionclearly indicates breakpoints in the slopes of the dust recordsbetween 1.4 and 1.9 Ma and hence after the intensification of theWalker circulation (Ravelo et al., 2004). Running Mann–Whitneyand Ansari–Bradley tests detected numerous minor transitions inthe amplitude and periodicity of dust flux variability in all dustrecords. As opposed to these results, the applications of thesestatistical techniques to the ODP Site 659 benthic oxygen-isotoperecord manifest the established shifts in the isotope values coin-ciding with the intensification of high-latitude glacial cycles atca. 3.0 (near the INGP) and 1.0 Ma (near the MPT) (Tiedemann et al.,1994).
One of the most remarkable, yet unexplained, differencesbetween the three dust flux records is that the three sites responddifferently to eccentricity (95–125 kyr or w100 kyr and 400 kyrcyclicities) (Fig. 7) (Larrasoana et al., 2003). Highest dust fluxescorrespond to w100- and 400 kyr eccentricity minima in theeastern Mediterranean but to w100- and 400 kyr eccentricitymaxima in the Atlantic Ocean and the Arabian Sea. Interpreting thisfinding demands an appropriated understanding on the paleo-environmental significance of dust flux records, which is deter-mined by a complex interaction between the mechanismscontrolling the dust production in the source areas and its trans-portation to the studied sites (Rea, 1994) (Fig. 7). Dust production in

5.0
4.0
3.0
2.0
1.00-20
-40
-60-80
-10
-20
-30-40
δδ18O
(‰
vs. P
DB
)
δ18O
(‰
vs. P
DB
)
δ18O
(‰
vs. P
DB
)
δ18O
(‰
vs. P
DB
)
+0.5
0
-0.5
+0.5
0
-0.5
+0.5
0
-0.5
lo
g(p
)lo
g(p
)
0
-50
-100
lo
g(p
)
0
-50
-100
lo
g(p
)
0
-50
-100
lo
g(p
)
0 1000 2000 3000 4000 5000Age (kyr)
Isotopes
Central Tendency
Dispersion
19-23 kyr band
Dispersion in the 19-23 kyr band
95-125 kyr band
Dispersion in the 95-125 kyr band
41 kyr band
Dispersion in the 41 kyr band
ca. 1.9
ca. 3.0
ca. 3.0ca. 1.7ca. 1.0ca. 4.0
4.153.32.31.50.5
ca. 1.3
A
B
C
D
E
F
G
H
I
Fig. 6. (A–C) Significant shifts in the mean and variance in the benthic oxygen-isotope record as detected by running Mann–Whitney and Ansari–Bradley tests. (A) Terrigenous dustrecords from ODP 659 (Tiedemann et al., 1994). (B) Result from running Mann–Whitney test to detect significant shifts in the dust flux. (C) Results from running Ansari–Bradley testto detect significant chances in the variance of the dust flux. (D–I) Results from the event analysis of bandpass-filtered benthic oxygen-isotope records from ODP 659 using runningAnsari–Bradley test.
M.H. Trauth et al. / Quaternary Science Reviews 28 (2009) 399–411408
the Saharo-Arabian desert belt (SADB) is suppressed duringprecession minima, when maxima in solar radiation over the SADBdrive the ‘‘greening of the Sahara’’ in response to an intensificationand maximum northward penetration of the African summermonsoon (Brovkin et al., 1998; deMenocal et al., 2000; Gasse,2000). Simultaneously, monsoonal wind circulation is enhanceddue to increased ocean-continent pressure gradients (Kutzbach andStreet-Perrott, 1985). Due to the modulation of precession byeccentricity, the amplitude of insolation peaks during eccentricityminima is lowest and, as a result, the intensity and northwardpenetration of the summer monsoon front is severely diminished(Kutzbach and Street-Perrott, 1985; Gasse, 2000; Berger et al.,2006). Under these conditions, the insolation-driven ‘‘greening of
the Sahara’’ is inactive for long (w100 and 400 kyr) periods of time,which results in high dust production in the SADB under arid tohyperarid conditions. Saharan dust is transported into the easternMediterranean Sea by winter–spring depressions, whose activity isindependent of monsoon dynamics, and into the Atlantic andIndian oceans by summer monsoon-related winds. High dustproduction during w100 and 400 kyr eccentricity minima isreflected in relative dust flux maxima at ODP Site 967. Simulta-neous low dust fluxes recorded at sites 659 and 721/722 likelyrespond to a weakened monsoon circulation, and a concomitantdecrease in dust transport, despite of increased dust productionthroughout the SADB. During periods of eccentricity maxima(highest amplitude of insolation maxima), recurrent ‘‘green Sahara’’

Breakpoint
Breakpoint
Breakpoint
0 1000
ODP721 Dust Flux
ODP967 Dust Flux
ODP659 Dust Flux
ODP659 Oxygen Isotopes
Orbital Forcing
2000 3000 4000 5000
0.4
0.2
0.3
0.5
0.7
0.6
0.1
0.0
1.5
0.5
0.0
1.0
2.0
2.5
3.0
2.0
4.0
3.5
2.5
2.0
1.0
1.5
2.5
3.0
0.5
0.0
Age (kyr)
δ18O
(‰
vs. P
DB
)
0.04
0.00
0.02
0.06
Eccen
tricity
Du
st F
lu
x (g
m
-2 kyr-1)
Du
st F
lu
x (g
m
-2 kyr-1)
Du
st F
lu
x (g
m
-2 kyr-1)
Episodes of large, but fluctuating lakes in East Africa
? ?
Higher/lower dust flux values
Higher/lower global ice volume
100 kyr41 kyr
19-23 kyr
95-12541 kyr
19-23
95-125 kyr41 kyr
19-23 kyr
95-125 kyr41 kyr19-23 kyr
Fig. 7. Trends, rhythms and events in Plio-Pleistocene African climate based on the results of the statistical analysis. Whereas the dust flux records of ODP sites 659 (Tiedemann et al.,1994) and 721/722 (deMenocal, 1995, 2004) are overprinted by dust transport mechanism effects, the Site 967 dust flux record (Larrasoana et al., 2003) is the only long marine recordthat provides a pristine view on wet/arid cycles in the Saharo-Arabian desert belt (SADB) in response to monsoon dynamics. The Site 967 dust flux correlates with Plio-Pleistocenehumidity changes as recorded by East African rift lakes (Trauth et al., 2005, 2007). All records are presented as the original data series published by deMenocal et al. (1991), Tiedemannet al. (1994), deMenocal (1995, 2004) and Larrasoana et al. (2003) and a lowpass (>350 kyr) filtered version of these data to elucidate the relation between dust flux variations and thelong-term (400 kyr) component of the eccentricity cycle (Laskar et al., 2004). Breakfit regression indicates significant breakpoints t2 in the trends in the dust values at 1.86� 0.44 Ma(ODP 721/722 dust flux record), 1.44� 0.20 Ma (ODP 967 dust flux record) and 1.62� 0.82 Ma (ODP 659 dust flux record). All dust records show an increase in the trends and agree intheir change point time within the error bars. The ODP 659 oxygen-isotope record is characterized by multiple breakpoints and was therefore described by a polynomial of third degree.Running Mann–Whitney and Ansari–Bradley tests detected numerous minor transitions in the amplitude and periodicity of dust flux variability in all dust records.
M.H. Trauth et al. / Quaternary Science Reviews 28 (2009) 399–411 409

M.H. Trauth et al. / Quaternary Science Reviews 28 (2009) 399–411410
periods might result in an overall decrease in dust flux over theeastern Mediterranean Sea, but might result in a relative increase indust flux over the Atlantic and Arabian Sea in response to enhancedmonsoonal wind circulation. This interpretation implies that thedust flux records from sites 659 and 721/722 are overprinted bytransport mechanism effects related to monsoon dynamics, as theyare also affected by transport effects linked with glacial–interglacialclimate variability (deMenocal, 2004). The Site 967 dust flux recordmight be also overprinted by transport mechanism effects duringthe last 1 Myr, when a significant increase in the amplitude of sub-Milankovitch variability is observed in parallel with the onset oflarge northern hemisphere ice sheets (Larrasoana et al., 2003). Inany case, it appears that the Site 967 dust flux record is significantlyless affected by transport mechanism effects, which are restrictedto glacial–interglacial effects in the last 1 Ma. We therefore inter-pret that the Site 967 dust flux record provides a more pristine viewon wet/arid cycles in the SADB in response to monsoon dynamics.This view is supported by in-phase expansions and retractions ofthe SADB derived from pollen results from marine sedimentslocated off northwest Africa (Hooghiemstra et al., 2006).
The critical reassessment of the environmental significance ofdust flux records proposed here removes the major inconsistenciesfaced when contrasting marine vs. terrestrial records of Africanclimate variability. Eccentricity minima lead to lowest-amplitudeinsolation peaks and weakened monsoon dynamics at the preces-sional timescale. This is manifested in East Africa by long-term(w100 and 400 kyr) periods with lowest (or even dried out) lakelevels (Trauth et al., 2005, 2007), and by pervasive desert conditionsin the SADB (Larrasoana et al., 2003). To the contrary, eccentricitymaxima lead to highest-amplitude insolation cycles with alter-nating strongest and weakest monsoons with precessional cyclic-ities. Eccentricity maxima are evidenced in the SADB by long-term(w100 and 400 kyr) periods where desert and ‘‘green Sahara’’conditions alternate at precessional cycles (Larrasoana et al., 2003),and in East Africa by long-term (100 and 400 kyr) periods wherelake levels oscillate with largest (up to 280 m; Trauth et al., 2005,2007) amplitudes at precession/half-precessional cycles (Trauthet al., 2003; Berger et al., 2006; Maslin and Christensen, 2007).Modulation of precession by eccentricity is evident in the dust fluxrecords back to 5 Ma (Fig. 7), which reinforces the idea that themodulation of precession by eccentricity exerts a major control onthe hydrological cycle in tropical Africa (Gasse, 2000; Trauth et al.,2003; Berger et al., 2006) and demonstrates that large-amplitudevariations in tropical African climate are unrelated to the onset andamplification of high-latitude glacial cycles as previously suggested(deMenocal, 1995, 2004).
Our results provide a new basis for discussing the role ofclimate variability in human evolution, because they give novelinsights into the underlying mechanism controlling tropicalAfrican climate and its impact on the extent and dynamics ofhabitats suitable for hominin occupation. Thus, our results indicatethat the key junctures in hominin evolution are not linked withshifts towards more arid and variable conditions during the onsetand amplification of high-latitude glacial cycles as typicallyproposed (deMenocal, 1995, 2004), but rather to periods ofextreme climate variability on high moisture levels controlledlargely by low-latitude solar heating (Trauth et al., 2007). Thus, theearliest members of the genus Homo and Paranthropus at ca 2.5–2.6 Ma, and the emergence of the Oldowan lithic complex at aboutthe same time (see deMenocal, 2004; Trauth et al., 2007 andreferences therein) are centered around the 400 kyr eccentricitymaxima at 2.6 Ma. The emergence of Homo ergaster and its out ofAfrica migration into Asia at ca 1.8–1.9 Ma, and the earliestoccurrences of Acheulian technology at ca 1.7 Ma (deMenocal,2004; Trauth et al., 2007), are also centered at a 400 kyr eccen-tricity maxima at 1.8 Ma. Finally, the extinction of the genus
Paranthropus and of the species H. ergaster at ca 1.0–1.1 Ma(deMenocal, 2004; Trauth et al., 2007), also coincides with a400 kyr eccentricity maxima at 1 Ma. This systematic link betweenextinction/speciation events, out of Africa range expansions, anddevelopment of new lithic technologies with eccentricity maximapoints to the insolation-driven monsoon as the putative climatemechanism, if any, driving hominin evolution in tropical Africa.Thus, we propose that precessionally driven formation of largelakes in East Africa and simultaneous ‘‘green Sahara’’ periodsmight have favored hominin range expansions within and out oftropical Africa, and might also have provided protein-rich foodessential to the evolution of hominin brains. Similarly, preces-sionally driven expansion of desert conditions in the SADB andsimultaneous drying of East African lakes might have conditionedhominin range contractions. This might have resulted in isolatedpopulations surviving in ecological refugia across tropical Africa,such as remaining wetland systems or mountain areas. Eccen-tricity-paced alternation between these precessionally drivenscenarios might have pushed individual hominin populations,though natural selection, either to extinction or to reproductiveisolation and speciation, and might have ultimately controlled thesuccess or decline of their lithic technologies.
More archaeological, paleoanthropological and paleoenvir-onmental records from all tropical African locations where homi-nins lived are necessary to confirm our proposed concept of a majorrole of eccentricity cycles driving hominin evolution via theirmodulation of precession. If so, monsoon dynamics will beconfirmed as the underlying mechanism driving environmentalstress and hominin evolution in tropical Africa since at least theearly Pliocene (Trauth et al., 2007), therefore giving support for thevariability selection hypothesis of Potts (1998).
7. Conclusions
The robust statistical analysis presented here, aimed at detect-ing trends, rhythms and events in representative dust flux recordsfrom the subtropical Atlantic, the eastern Mediterranean Sea, andthe Arabian Sea, sheds light on the significance of patterns oftropical African climate variability proposed in the literature. Ourresults demonstrate that neither the proposed gradual increase inAfrican aridity developed after the INHG at 3 Ma, nor the 100 kyrmodulation of dust fluxes only after 1.0 (�0.2) Ma, nor the step-likeincreases in the amplitude of obliquity modulation of dust fluxesat 2.8 (�0.2) Ma and 1.7 (�0.1) Ma, are statistically tenable.A comprehensive interpretation of the dust flux records in terms oflandscape variability in the Saharo-Arabia desert, together withtheir comparison with lake, pollen and isotopic records of Africanclimate variability, indicate that the hydrological cycle in tropicalAfrica is mainly controlled by low-latitude heating via its impact onmonsoon dynamics. An examination of the fossil record indicatesthat the key junctures in hominin evolution reported nowadays at2.6, 1.8 and 1 Ma coincide with 400 kyr eccentricity maxima, whichsuggests that periods with enhanced speciation and extinctionevents coincided with periods of maximum climate variability onhigh moisture levels.
Acknowledgements
This project was funded by two grants to M.T. by the GermanResearch Foundation (DFG). J.C.L. benefits from a Ramon y Cajalcontract (MEC). We thank the Government of Kenya (ResearchPermits MOST 13/001/30C 59/10, 59/18 and 59/22) and theUniversity of Nairobi for research permits and support. We thankL. Dupont, C. Feibel, N. Marwan, M. Maslin, E. Odada, D. Olago, R.Potts, F. Schrenk, R. Tiedemann, M. Winklhofer, R. Zahn and the
M.H. Trauth et al. / Quaternary Science Reviews 28 (2009) 399–411 411
participants of the EAGLE 2008 workshop at the University ofPotsdam for inspiring discussions.
References
Adkins, J., deMenocal, P.B., Eshel, G., 2006. The ‘‘African humid period’’ and therecord of marine upwelling from excess Th-230 in Ocean Drilling Program Hole658C. Paleoceanography 22 Art. No. PA1206.
Ansari, A.R., Bradley, R.A., 1960. Rank-sum tests for dispersions. Annals of Mathe-matical Statistics 31, 1174–1189.
Armitage, S.J., Drake, N.A., Stokes, S., El-Hawat, A., Salem, M., White, K., Turner, P.,McLaren, S.J., 2007. Multiple phases of north African humidity recorded inlacustrine sediments from the Fazzan basin, Ligyan Sahara. QuaternaryGeochronology 2, 181–186.
Berger, A., Loutre, M.F., Melice, J.L., 2006. Equatorial insolation: from precessionharmonics to eccentricity frequencies. Climate of the Past 2, 131–136.
Berger, W.H., Jansen, E., 1994. Mid-Pleistocene climate shift: the Nansen connection.Geophysical Monograph 85, 295–311.
Berggren, W.A., Kent, D.V., Flynn, J.J., Van Couvering, J.A., 1985. Cenozoic geochro-nology. GSA Bulletin 97, 1407–1418.
Bozzano, G., Kuhlmann, H., Alonso, B., 2002. Storminess control over African dustinput to the Moroccan Atlantic margin (NW Africa) at the time of maximaboreal summer insolation: a record of the last 220 kyr. Palaeogeography,Palaeoclimatology, Palaeoecology 183, 155–168.
Brovkin, V., Claussen, M., Petoukhov, V., Ganopolski, A., 1998. On the stability of theatmosphere-vegetation system in the Sahara/Sahel region. Journal ofGeophysical Research – Atmospheres 103, 31613–31624.
Carlstein, E., 1986. The use of subseries values for estimating the variance of a generalstatistic from a stationary sequence. The Annals of Statistics 14, 1171–1179.
Clemens, S.C., 1998. Dust response to seasonal atmospheric forcing: proxy evalua-tion and calibration. Paleoceanography 13, 471–490.
Clemens, S.C., 1999. An astronomical tuning strategy for Pliocene sections: impli-cations for global-scale correlation and phase relationships. PhilosophicalTransactions of the Royal Society of London A 357, 1949–1973.
Clemens, S.C., Prell, W.L., 1991. One million year record of summer monsoon windsand continental aridity from the Owen Ridge (Site 722), northwest Arabian Sea.Proceedings of the ODP Scientific Results 177, 365–388.
Dayan, U., Heffter, J., Miller, J., Gutman, G., 1991. Dust intrusions into the Mediter-ranean basin. Journal of Applied Meteorology 30, 1185–1199.
deMenocal, P., 1995. Plio-Pleistocene African Climate. Science 270, 53–59.deMenocal, P., Bloemendal, J., King, J., 1991. A rock-magnetic record of monsoonal
dust deposition to the Arabian Sea: evidence for a shift in the mode ofdeposition at 2.4 Ma. Proceedings of the ODP Scientific Results 177, 389–407.
deMenocal, P., Ortiz, J., Guilderson, T., Adkins, J., Sarnthein, M., Baker, L.,Yarusinsky, M., 2000. Abrupt onset and termination of the African humidperiod: rapid climate responses to gradual insolation forcing. QuaternaryScience Reviews 19, 347–361.
deMenocal, P.B., 2004. African climate change and faunal evolution during thePliocene–Pleistocene. Earth and Planetary Science Letters 220, 3–24.
Dunlop, D.J., Ozdemir, O., 1997. Rock Magnetism: Fundamentals and Frontiers.Cambridge University Press, Cambridge.
Duplessy, J.C., Cortijo, E., Kallel, N., 2005. Marine records of Holocene climaticvariations. Comptes Rendus Geosciences 337, 87–95.
Gasse, F., 2000. Hydrological changes in the African tropics since the Last GlacialMaximum. Quaternary Science Reviews 19, 189–211.
Goudie, A.S., Middleton, N.J., 2001. Saharan dust storms: nature and consequences.Earth-Science Reviews 56, 179–204.
Grenander, U., 1958. Bandwidth and variance in estimation of the spectrum. Journalof the Royal Statistical Society Series B 20, 152–157.
Haug, G.H., Tiedemann, R., 1998. Effect of the formation of the Isthmus of Panamaon Atlantic Ocean thermohaline circulation. Nature 393, 673–676.
Holland, P.W., Welsch, R.E., 1977. Robust regression using iteratively reweightedleast-squares.
Hooghiemstra, H., Lezine, A.M., Leroy, S.A.G., Dupont, L., Marret, F., 2006. LateQuaternary palynology in marine sediments: a synthesis of the understandingof pollen distribution patterns in the NW African setting. Quaternary Interna-tional 148, 29–44.
Jolly, D., Harrison, S.P., Damnati, B., Bonnefille, R., 1998. Simulated climate andbiomes of Africa during the late Quaternary: comparison with pollen and lakedata. Quaternary Science Reviews 17, 629–657.
Jung, S.J.A., Davies, G.R., Ganssen, G.M., Kroon, D., 2004. Stepwise Holocene aridi-fication in NE Africa deduced from dust-borne radiogenic isotope records. Earthand Planetary Science Letters 221, 27–37.
Kroon, D., Alexander, I., Little, M., Lourens, L.J., Matthewson, A., Robertson, A.H.F.,Sakamoto, T., 1998. Oxygen isotope and sapropel stratigraphy in the EasternMediterranean during the last 3.2 million years. Proceedings of the ODPScientific Results 160, 181–190.
Kuhlmann, H., Freudenthal, T., Helmke, P., Meggers, H., 2004. Reconstruction of localpaleoceanography off NW Africa during the last 40,000 years: influence of localand regional factors on sediment accumulation. Marine Geology 207, 209–224.
Kunsch, H.R., 1989. The jackknife and the bootstrap for general stationary obser-vations. The Annals of Statistics 17, 1217–1241.
Kuper, R., Kropelin, S., 2006. Climate-controlled Holocene occupation in the Sahara:motor of Africa’s evolution. Science 313, 803–807.
Kutzbach, J.E., Street-Perrott, F.A., 1985. Milkankovitch forcing of fluctuations in thelevel of tropical lakes from 18 to 0 kyr BP. Nature 317, 130–134.
Laskar, J., Gastineau, M., Joutel, F., Robutel, P., Levrard, B., Correia, A., 2004. A longterm numerical solution for the insolation quantities of Earth. Astronomy andAstrophysics 428, 261–285.
Larrasoana, J.C., Roberts, A.P., Rohling, E.J., Winklhofer, M., Wehausen, R., 2003.Three million years of monsoon variability over the northern Sahara. ClimateDynamics 21, 689–698.
Lau, K.M., Weng, H., 1995. Climate signal detection using wavelet transform: how tomake a time series sing. Bulletin of the American Meteorological Society 76,2391–2402.
Lepage, Y., 1971. A combination of Wilcoxon’s and Ansari–Bradley’s statistics. Bio-metrika 58, 213–271.
Liu, Z., Wang, Y., Gallimore, R., Gasse, F., Johnson, T., deMenocal, P., Adkins, J.,Notaro, M., Prentice, I.C., Kutzbach, J., Jacob, R., Behling, P., Wang, L., Ong, E.,2007. Simulating the transient evolution and abrupt change over NorthernAfrica atmosphere–ocean–terrestrial ecosystem in the Holocene. QuaternaryScience Reviews 26, 1818–1837.
Mackenzie, D., Daubechies, I., Kleppner, D., Mallat, S., Meyer, Y., Ruskai, M.B.,Weiss, G., 2001. Wavelets: Seeing the Forest and the Trees. Beyond Discovery.National Academy of Sciences.
Mann, H.B., Whitney, D.R., 1947. On a test of whether one of two random variables isstochastically larger than the other. Annals of Mathematical Statistics 18, 50–60.
Maslin, M.A., Christensen, B., 2007. Tectonics, orbital forcing, global climate change,and human evolution in Africa: introduction to the African paleoclimate specialvolume. Journal of Human Evolution 53, 443–464.
Middleton, N.J., 1985. Effect of drought on dust production in the Sahel. Nature 316,431–434.
Moreno, A., Targarona, J., Henderiks, J., Canals, M., Freudenthal, T., Meggers, H.,2001. Orbital forcing of dust supply to the North Canary Basin over the last250 kyrs. Quaternary Science Reviews 20, 1327–1339.
Mudelsee, M., 2000. Ramp function regression: a tool for quantifying climatetransitions. Computers and Geosciences 26, 293–307.
Mudelsee, M., Raymo, M.E., 2005. Slow dynamics of the Northern Hemisphereglaciation. Paleoceanography 20, PA4022.
Mudelsee, M., Schulz, M., 1997. The Mid-Pleistocene climate transition: onset of100 ka cycle lags ice volume build-up by 280 ka. Earth and Planetary ScienceLetters 151, 117–123.
Mudelsee, M., Stattegger, M., 1997. Exploring the structure of the mid-Pleistocenerevolution with advanced methods of time-series analysis. International Journalof Earth Sciences 86, 499–511.
Mudelsee, M., in preparation, Climate Time Series Analysis: Classical Statistical andBootstrap Methods, Springer Verlag.
Nicoll, K., 2004. Recent environmental change and prehistoric human activity inEgypt and Northern Sudan. Quaternary Science Reviews 23, 561–580.
Potts, R., 1998. Environmental hypotheses of hominin evolution. Yearbook ofPhysical Anthropology 41, 93–136.
Prospero, J.M., Ginoux, P., Torres, O., Nicholson, S.E., Gill, T.E., 2002. Environmentalcharacterization of global sources of atmospheric soil dust identified with theNimbus 7 Total Ozone Mapping Spectrometer (TOMS) absorbing aerosolproduct. Reviews of Geophysics 40 Art. No. 1002.
Ravelo, C., Andreasen, D., Olivarez, A., Lyle, M., Wara, M., 2004. The Role of tropicaland extratropical processes on Northern Hemisphere Glaciation. Nature 429,263–267.
Rea, D.K., 1994. The paleoclimatic record provided by eolian deposition in the deep-sea – the geologic history of wind. Reviews of Geophysics 32, 159–195.
Schuster, M., Roquin, C., Duringer, P., Brunet, M., Caugy, M., Fontugne, M.,Mackaye, H.T., Vignaud, P., Ghienne, J.F., 2005. Holocene lake Mega-Chadpalaeoshorelines from space. Quaternary Science Reviews 24, 1821–1827.
Segalen, L., Lee-Thorp, J.A., Cerling, T., 2007. Timing of C4 grass expansion acrosssub-Saharan Africa. Journal of Human Evolution 53, 549–559.
Staerker, T.S., 1998. Quantitative calcareous nannofossil biostratigraphy of Plioceneand Pleistocene sediments from the Eratosthenes Seamount region in theeastern Mediterranean. Proceedings of the ODP Scientific Results 160, 83–98.
Tetzlaff, G., Peters, M., 1988. A composite study of early summer squall lines and theirenvironment over west Africa. Meteorology and Atmospheric Physics 38,153–163.
Tiedemann, R., Sarnthein, M., Shackleton, N.J., 1994. Astronomical timescale for thePliocene Atlantic d18O and dust flux records of Ocean Drilling Program site 659.Paleoceanography 9, 619–638.
Tomadini, L., Lenaz, R., Landuzzi, V., Mazzucotelli, A., Vannucci, R., 1984. Wind-blown dust over the central Mediterranean. Oceanologica Acta 7, 13–23.
Trauth, M.H., Deino, A.L., Bergner, A.G.N., Strecker, M.R., 2003. East African climatechange and orbital forcing during the last 175 kyr BP. Earth and PlanetaryScience Letters 206, 297–313.
Trauth, M.H., Maslin, M.A., Deino, A., Bergner, A.G.N., Duhnforth, M., Strecker, M.R.,2007. High- and low-latitude forcing of Plio-Pleistocene East African climateand human evolution. Journal of Human Evolution 53, 475–486.
Trauth, M.H., Maslin, M.A., Deino, A., Strecker, M.R., 2005. Late Cenozoic moisturehistory of East Africa. Science 309, 2051–2053.
Weldeab, S., Lea, D.W., Schneider, R.R., Andersen, N., 2007. 155,000 years of WestAfrican monsoon and ocean thermal evolution. Science 316, 1303–1307.
White, F., 1983. Vegetation of Africa – A Descriptive Memoir to Accompany theUNESCO/AETFAT/UNSO Vegetation Map of Africa. U.N. Educational, Scientificand Cultural Organization, Paris.
Zachos, J., Pagani, M., Sloan, L., Thomas, E., Billups, K., 2001. Trends, rhythms, andaberrations in global climate 65 Ma to present. Science 292, 686–693.