trent tubing hc 5.26.06 release - agency for toxic ... · health consultation trent tube industrial...
TRANSCRIPT
Health Consultation
TRENT TUBE INDUSTRIAL FACILITY
EAST TROY, WALWORTH COUNTY, WISCONSIN
EPA FACILITY ID: WID980570055
MAY 31, 2006
U.S. DEPARTMENT OF HEALTH AND HUMAN SERVICES Public Health Service
Agency for Toxic Substances and Disease Registry Division of Health Assessment and Consultation
Atlanta, Georgia 30333
Health Consultation: A Note of Explanation
An ATSDR health consultation is a verbal or written response from ATSDR to a specific request for information about health risks related to a specific site, a chemical release, or the presence of hazardous material. In order to prevent or mitigate exposures, a consultation may lead to specific actions, such as restricting use of or replacing water supplies; intensifying environmental sampling; restricting site access; or removing the contaminated material.
In addition, consultations may recommend additional public health actions, such as conducting health surveillance activities to evaluate exposure or trends in adverse health outcomes; conducting biological indicators of exposure studies to assess exposure; and providing health education for health care providers and community members. This concludes the health consultation process for this site, unless additional information is obtained by ATSDR which, in the Agency’s opinion, indicates a need to revise or append the conclusions previously issued.
You May Contact ATSDR TOLL FREE at 1-888-42ATSDR
or Visit our Home Page at: http://www.atsdr.cdc.gov

HEALTH CONSULTATION
TRENT TUBE INDUSTRIAL FACILITY
EAST TROY, WALWORTH COUNTY, WISCONSIN
EPA FACILITY ID: WID980570055
Prepared By:
Wisconsin Department of Health and Family Services Under a Cooperative Agreement with the
U.S. Department of Health and Human Services Agency for Toxic Substances and Disease Registry
Summary The Wisconsin Department of Health and Family Services (DHFS) evaluated the results of a computer model used by the Department of Natural Resources (WDNR) to predict the dispersion and concentration of trichloroethylene (TCE), emitted by the Trent Tube facility, into the surrounding community of East Troy, Walworth County. Based on the modeled predictions of trichloroethylene (TCE) dispersion from the factory, most East Troy residents have a small exposure to TCE that exceeds EPA comparison values for chronic exposure. Field testing of air in East Troy near Trent Tube supports the prediction that downwind exposure to TCE occurs. However, sampling was limited to grab air samples at 3 locations on one day. Although the air dispersion modeling indicates that persons may be exposed to elevated TCE emissions, the limited real-time sampling leads DHFS to classify TCE air emissions from Trent Tube as an indeterminate public health hazard. More sampling is needed to estimate the community’s exposure to TCE at locations close to the factory. However, DHFS supports Trent Tube’s initiative to take steps to reduce TCE emissions as part of prudent public health practice.
Background and Statement of Issues
Purpose. A computer model employed by the Wisconsin Department of Natural Resources (WDNR) as part of a state-wide surveillance project predicted that TCE emissions from the Trent Tube metal working facility in East Troy, Walworth County would result in elevated air concentrations of trichloroethylene (TCE) in the surrounding community. The Wisconsin Department of Health and Family Services (DHFS) was asked by the WDNR to comment on the public health implications of TCE emissions from Trent Tube.
Statement of issues. The air dispersion model predicts TCE concentrations in the community based on an inventory of chemicals used by Trent Tube, but there has been little effort to directly measure TCE concentrations in air to verify exposure to East Troy residents. Although risks to the community can be calculated based upon the air dispersion model, there are limitations to both modeling and to direct sampling as methods to estimate risk. Health concerns in East Troy are discussed here with these limitations in mind. The important questions identified in this public health consultation are:
• What are the public health implications of the exposures predicted by the emissions model?
• Is the air modeling and sampling performed to date adequate to make public health recommendations?
• Are there other important pathways to TCE exposure from Trent Tube? • What should be done to protect the health of the citizens of East Troy?
Background and Data Summary.
The use and dispersal of TCE at Trent Tube. Trent Tube manufactures stainless steel tubing at the Plant #3 (2015 Energy Drive, East Troy, WI 53120) in northeastern
1
Walworth County. The tubes are used in the dairy and food industry, marine applications, and other specialty uses. TCE is used during certain manufacturing steps to achieve the smooth, clean surfaces required for the inner surfaces of the tubes.
TCE is used in two processes at the facility that are subject to, and currently meet, state and federal regulations. TCE is contained in a “doping agent” used to draw the stainless steel tubes to a desired thickness and diameter. The doping process, which is vented by stack S30, is estimated to be responsible for about 25% of the total annual TCE emissions. The doping process is subject to the Wisconsin Air Toxics Rule (NR 445, Wis. Admin. Code). The second TCE source is a 4 feet by 55 feet vapor degreasing tank used to remove the doping agent and clean the tubes. The vapor degreaser is subject to a federal Maximum Achievable Control Technology (MACT) standard for halogenated solvent degreasers.
The emission of TCE from Trent Tube complies with the conditions of the WDNR permit for this facility. According to air emission reports submitted to the WDNR in 2003, Trent Tube in 2003 emitted 111.4 tons of trichloroethylene to air. The doping process in 2003 reported actual emissions of 58,992 pounds of TCE (from stack S30). The vapor degreaser in 2003 reported actual emissions of 163,730 pounds of TCE from stack S14. From a volume perspective, the total TCE lost, based on a density of 1.46 g/ml, is equivalent to approximately 50 gallons per day. Although the amount of TCE emitted by Trent Tube complies with the regulatory conditions of their permit, recent air dispersion modeling predicts exposures to the surrounding community. This health consultation interprets that exposure to determine whether a hazard to the community exists.
Use of a computer model to predict air exposures in southeast Wisconsin. DHFS’ first knowledge of the Trent Tube facility came as a result of a state-wide surveillance program to track and assess links between health problems and environmental contaminants. The surveillance program is part of the DHFS Environmental Public Health Tracking program, funded by the U.S. Centers for Disease Control and Prevention. Included in the surveillance program is a collaboration with WDNR to predict the cancer risk from mixtures of air pollutants at locations throughout the state, using the Regional Air Impact Modeling Initiative, or RAIMI mathematical model. The RAIMI model, developed by the U.S. EPA Region 6, was designed to estimate population exposures to a number of different air contaminants in order to estimate relationships between disease and air pollution. RAIMI is a modification of the widely used Industrial Source Complex Short Term model (ISCST3). These air dispersion models use weather data and stack emissions data to predict ambient concentrations of pollutants. Characterizations of risk to the public are determined secondarily as a function of exposure. In the WDNR (2005; appendix II) assessment reviewed here, cancer risk is characterized by multiplying modeled predictions of pollutant air concentrations by a unit risk factor of 2 x 10⁻⁶. The unit risk factors used in the WDNR (2005) risk assessment were obtained from the U. S. Environmental Protection Agency (EPA IRIS 2005). Although reference is made to the WDNR risk characterization throughout this health consultation, DHFS relies on additional information about the surrounding community to estimate possible health hazards. This might include additional environmental data, identification of sensitive populations, existing health
2
data, and knowledge of behaviors that make people more or less prone to exposure. It bears clarification that air dispersion modeling primarily predicts air concentrations, but that using exposure assumptions (such as inhalation volume) and calculated risk factors, corresponding risk predictions can be incorporated secondarily into the model. When reference is made here to predicted risk from air dispersion modeling, this actually means calculated risk, using unit risk factors, from modeled air concentrations of TCE.
Early in 2005, the WDNR tested the latest RAIMI model on air toxics throughout Wisconsin. The model identified Trent Tube as a large source of trichloroethylene into surrounding neighborhoods in East Troy (WDNR 2005). More detailed air dispersion modeling was done to refine estimates of the air concentrations in the area around Trent Tube in East Troy (WDNR 2005).
DHFS site visit and ambient air monitoring. DHFS visited East Troy on October 11, 2005. Accompanied by remediation project managers from WDNR and Trent Tube, the DHFS team toured the former Trent Tube Plant 1 remediation site and the currently operating Plant 3 facility. The purpose of the visit was to better understand the industrial process and the accompanying pollution issues. DFHS also toured the surrounding community to choose air sampling sites and to identify potentially sensitive populations.
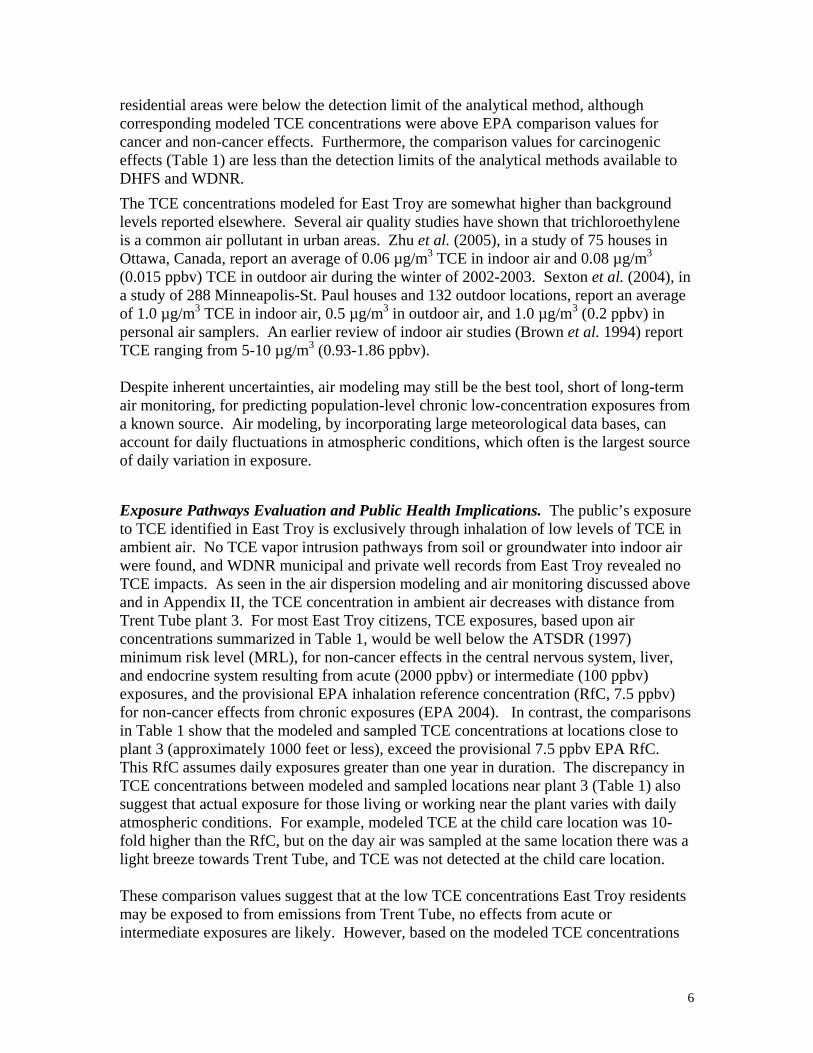
Three air monitoring locations were chosen (Figure 1, Table 1). Two locations were chosen downwind of Trent Tube plant 3 (winds were easterly, approximately 10 miles per hour, temperature approximately 60 F). The Young Street location was approximately 1300 feet west of Trent Tube. Twenty-eleven (2011) Young St. is within an industrial park, and was the closest publicly accessible downwind location on that day. Twenty-one eighty eight (2188) Church St. was in the nearest downwind residential neighborhood, approximately 4300 feet west south west of Trent Tube. The child care center was approximately 830 feet north of Trent Tube. All distances were estimated using neighborhood-level internet-based map services.
At each location, a 6 liter evacuated SUMMA canister was opened to obtain an air sample for submission to the Wisconsin State Laboratory of Hygiene (WSLH; Table 1). In addition, a portable gas chromatograph (GC) calibrated against a 10.7 parts per million TCE standard was used to monitor air at the same locations. At 2011 Young Street, the only location where sampled TCE concentrations were quantified, the portable GC produced TCE readings roughly twice those of the corresponding SUMMA samples (Table 1). This discrepancy may be due to time-dependent degradation of TCE or to the extra handling required of the SUMMA samples. However, the SUMMA samples are considered more reliable since the portable GC method does not have the standardized level of quality control provided by the WSLH analysis. The measured (SUMMA and portable GC) TCE concentrations reported in Table 1 are compared to TCE concentrations predicted from the air dispersion model at corresponding locations. The actual air concentration sampled (SUMMA) near Trent Tube on October 11, 2005 (Table 1) was 33.3 parts per billion air volume (ppbv, equal to 178 µg/m3). The comparable portable GC measurement was 78 ppbv (417 µg/m3) and the modeled TCE concentration at that location was 93 ppbv (497 µg/m3). At other
3

residential locations, the portable GC used by DHFS detected trace TCE in air, but the corresponding analyses from SUMMA can samples did not detect quantifiable TCE. Table 1 also includes predicted TCE concentrations at what WDNR (2005) identifies as the nearest residence, roughly 1400 northeast of Trent Tube. DHFS did not sample air at that location.
Figure 1. East Troy, Wisconsin, near Trent Tube Plant 3, showing locations of
Trent Tube p
g
par g lot
October 11, 2005 air sampling locations.
lant 3
2011 Youn St.
2188 Church St.
Child Care kin
Map reference: Wisconsin Department of Natural Resources Webview (http://maps.dnr.state.wi.us/imf/dnrimf.jsp?site=webview)
Not listed in Table 1 are the composite predicted TCE concentrations presented in the map included in Appendix II. According to the predictions of the air dispersion model (WDNR 2005), maximum TCE concentrations near plant 3 (200-300 yards) could reach 31 parts per billion, air volume (ppbv), or 177µg/m3, with corresponding residential concentrations being 2.4 ppbv (13 µg/m3).
Description of affected population. As of the census of 2000 (U.S. Dept. Commerce), there are 3,564 people, 1,350 households, and 984 families residing in the village. The population density is 987/mi². There are 1,396 housing units at an average density of 386/mi². There are 1,350 households out of which 37.6% have children under the age of 18 living with them. 9.8% have someone living alone who is 65 years of age or older. The average household size is 2.60 and the average family size is 3.07. The median age is
4

35 years. The DHFS October 11, 2005 site visit and review of aerial photos of East Troy show that Trent Tube Plant 1 is located on the eastern edge of the community, with the closest residences being about 500 yards northwest of the plant. There are no nearby population centers east or south of the plant. Land use in other directions consists of industrial park, interstate highway, and agriculture. Commercial development about 300 yards north of the plant includes restaurants and a child care center.
Table 1 . Comparison of Air Dispersion Model predictions for trichloroethylene (TCE) near Trent Tube Inc, East Troy, WI. With TCE detected in air Oct. 11, 2005
Trichloroethylene concentration, using various estimates (ppbv)
Comparison value, ppbv
Location/approx. distance from Trent Tube plant 3 (see Figure 1)
Air Model, 24 hour
Maximum1
Air Model, May 11,
2005 Estimate2
SUMMA samples3
(n=1)
Portable GC3
(n=1)
Carcinogenic effects: 2011 Young St./1300 feet
93 50 33 78 0.0003 ppbv (1.6 ng/m3), ref: EPA RIII risk-based
Child care parking lot/830feet
75 50 < trace concentration table.
Non-cancer effects: 7.5 ppbv (40 µg/m3)
2188 Church 19 25 < trace ref: EPA draft risk St./4300 feet Nearest residence/1400 feet
37 50 Not sampled
Not sampled
assessment for TCE.
Intermediate MRL (ATSDR):100 ppbv 2000 ppbv ATSDR acute MRL.
ppbv: parts per billion, air volume ATSDR: Federal Agency for Toxic Substances and Disease Registry.<: below limit of detection,1Estimated from WDNR (2005) Air dispersion model, 24 hour maximum concentration map.2 Estimated from WDNR (2005) Air dispersion model, TCE concentration map from example May 11 2005 meteorlogical conditions. 3October 11, 2005 samples.
Discussion
Environmental Data. This consultation was initiated by WDNR’s request that DHFS evaluate modeled TCE air dispersion and risk predictions performed by that agency. The measurements performed by DHFS were designed both to provide a field test of the WDNR modeling and to test methods and equipment to be used should further field tests be needed. Only at the closest sampling location (2001 Young St.) were modeled and actual measurements found to be similar. The comparisons have limited validity because the modeled predictions and the field measurements are from two different single days having different emission and meteorological conditions. Field samples analyzed from
5
residential areas were below the detection limit of the analytical method, although corresponding modeled TCE concentrations were above EPA comparison values for cancer and non-cancer effects. Furthermore, the comparison values for carcinogenic effects (Table 1) are less than the detection limits of the analytical methods available to DHFS and WDNR. The TCE concentrations modeled for East Troy are somewhat higher than background levels reported elsewhere. Several air quality studies have shown that trichloroethylene is a common air pollutant in urban areas. Zhu et al. (2005), in a study of 75 houses in Ottawa, Canada, report an average of 0.06 µg/m3 TCE in indoor air and 0.08 µg/m3
(0.015 ppbv) TCE in outdoor air during the winter of 2002-2003. Sexton et al. (2004), in a study of 288 Minneapolis-St. Paul houses and 132 outdoor locations, report an average of 1.0 µg/m3 TCE in indoor air, 0.5 µg/m3 in outdoor air, and 1.0 µg/m3 (0.2 ppbv) in personal air samplers. An earlier review of indoor air studies (Brown et al. 1994) report TCE ranging from 5-10 µg/m3 (0.93-1.86 ppbv).
Despite inherent uncertainties, air modeling may still be the best tool, short of long-term air monitoring, for predicting population-level chronic low-concentration exposures from a known source. Air modeling, by incorporating large meteorological data bases, can account for daily fluctuations in atmospheric conditions, which often is the largest source of daily variation in exposure.
Exposure Pathways Evaluation and Public Health Implications. The public’s exposure to TCE identified in East Troy is exclusively through inhalation of low levels of TCE in ambient air. No TCE vapor intrusion pathways from soil or groundwater into indoor air were found, and WDNR municipal and private well records from East Troy revealed no TCE impacts. As seen in the air dispersion modeling and air monitoring discussed above and in Appendix II, the TCE concentration in ambient air decreases with distance from Trent Tube plant 3. For most East Troy citizens, TCE exposures, based upon air concentrations summarized in Table 1, would be well below the ATSDR (1997) minimum risk level (MRL), for non-cancer effects in the central nervous system, liver, and endocrine system resulting from acute (2000 ppbv) or intermediate (100 ppbv) exposures, and the provisional EPA inhalation reference concentration (RfC, 7.5 ppbv) for non-cancer effects from chronic exposures (EPA 2004). In contrast, the comparisons in Table 1 show that the modeled and sampled TCE concentrations at locations close to plant 3 (approximately 1000 feet or less), exceed the provisional 7.5 ppbv EPA RfC. This RfC assumes daily exposures greater than one year in duration. The discrepancy in TCE concentrations between modeled and sampled locations near plant 3 (Table 1) also suggest that actual exposure for those living or working near the plant varies with daily atmospheric conditions. For example, modeled TCE at the child care location was 10fold higher than the RfC, but on the day air was sampled at the same location there was a light breeze towards Trent Tube, and TCE was not detected at the child care location.
These comparison values suggest that at the low TCE concentrations East Troy residents may be exposed to from emissions from Trent Tube, no effects from acute or intermediate exposures are likely. However, based on the modeled TCE concentrations
6
predicted for East Troy (Table 1), DHFS cannot exclude health effects from exposure to TCE that would likely result from long-term, low-level exposures. The EPA Region III risk-based concentration value (RBC) for carcinogenic effects due to chronic exposure to TCE is 0.0003 ppbv. This low TCE concentration is less than the modeled TCE concentration over most of East Troy, and as discussed above, is less than the background levels of TCE found in many urban areas. Due to the modeled presence of TCE in East Troy at levels that imply a chronic exposure, DHFS anticipates concerns from the public regarding their risk. These are discussed in the following Toxicology and Health Outcome sections.
Toxicology of TCE. TCE is one of a family of haloethenes that are metabolized by the oxidizing enzyme CYP2E1 to form haloethoxides. These unstable molecules affect cells of the liver, kidney, and immune system. People may be exposed to TCE through inhalation, as well as through drinking water, in food, or by direct contact. The federal Agency for Toxic Substances and Disease Registry (ATSDR) has prepared a scientific review of TCE as part of their series of Toxicological Profiles (ATSDR 1997). The Toxicological Profile contains a Public Health Statement that summarizes the findings of the profile for a general audience. Portions of the Public Health Statement are included in Appendix I. The extended inhalation of concentrated TCE causes narcosis (TCE was formerly used as a surgical anesthetic), leading to unconsciousness and eventually death. In occupations where TCE is used under conditions where its odor is noticeable, people breathing TCE may have headaches or dizziness. Some people have reported damage to facial nerves. Repeated skin contact with TCE can cause dermatitis. At greater levels of exposure, other effects have been reported, including liver and kidney damage and changes in heart beat. At the modeled outdoor TCE levels reported here, narcosis and other acute effects are not expected. The expected health effect is damage to cells in which the enzyme-catalyzed activation of TCE occurs. At the low exposure levels predicted in East Troy, people usually recover spontaneously from chemical insults from TCE. In rare instances, such insults result in the transformation of a cell and the development of a tumor.
TCE is listed as a probable human carcinogen (liver, kidney, lympho-hemopoetic cancers) by the U.S.EPA (currently under review). The International Agency for Research on Cancer (IARC) also has declared that trichloroethylene is probably carcinogenic to humans, based on limited evidence in humans and sufficient evidence in animals. Trichloroethylene is listed as a reasonably anticipated human carcinogen in the 11th Report on Carcinogens by the National Toxicology Program (NTP 2005). For shorter term exposures, ATSDR lists 100 ppbv (537 µg/m3) as an intermediate Minimal Risk Level (MRL) for TCE in air, and 1992 ppbv (10,697 µg/m3) as an acute MRL.
Health outcome data review. A risk factor of 2 x 10⁻⁶ (Appendix II) applied to the TCE concentrations estimated by the air dispersion model predicts a low increased risk of cancer from TCE exposure for people living in the vicinity of the Trent Tube factory. The increased cancer risk to the surrounding population, calculated from the model, is too small to detect, compared to the rest of Wisconsin, given uncertainties in the dispersion
7

model, the small size of the population affected, the movement of people to and from the exposure area, and the effect of occupational exposure.
Cancer rates in the Trent Tube area were examined in several ways. Cancer data is normally collected only by zip code; the zip code 53120 encompasses East Troy, but some surrounding population is included for which no exposure to emissions from Trent Tube is expected. The rates of leukemia, lymphoma, kidney cancer, and liver cancer (the cancers thought to be increased by inhaled TCE) were compared first to the overall rates in the State of Wisconsin. Comparisons were then made between zip code 53120 and zip codes that are demographically similar to 53120 (Table 2). These zip codes correspond to the cities of Verona (Dane Co.), Cross Plains (Dane Co.), and Waterford (Waukesha Co.).
Table 2. Characteristics of 53120 and comparison zip codes
Zip Largest 2000 % Median Median % Median % Median Code city Pop Rural Income Age Below House- Rental Year
Poverty hold Houses House Size Built
53120 East Troy 8738 40.2 55657 38 2.8 2.8 18.7 1973 53528 Cross 5030 38.1 59688 36.7 2.8 2.8 26.7 1977
Plains 53593 Verona 12939 47.0 69745 37.5 2.8 2.9 19.7 1981 53185 Waterford 17145 26.2 64828 36.7 2.9 3.0 16.3 1978
The three comparison zip codes were chosen using 2000 census data. All zip codes in Wisconsin are stratified by percent below poverty line, percent rural, and median age. The selected counties were within 0.1% of the of the percent below the poverty line, within 15% of the percent rural and non-farm rural, within 2 years of median age, and within $15,000 of median income. Census data by zip code were only available for the year 2000; the farther away in time from 2000, the less accurate the estimate of total population and characteristic of the zip codes. The years 1997-2002 were used for comparison as these years, close to 2000, would reflect the census data from 2000 more accurately. As of the writing of this health consultation, cancer data is not yet available after 2002.
Overall, this review of cancer data found that the rates of lymphoma, leukemia, liver cancer, and kidney cancer in East Troy are statistically the same as three similar communities and the rest of the state. The SIR compares the rate of incident cases between two populations. For the years 1997-2002, the SIR for the East Troy zip code versus the rest of Wisconsin is 0.92 (95 % CI 0.61, 1.35), and versus the comparison zip codes it is 0.96 (95% CI 0.63, 1.40). While this analysis has substantial limitations, gross deviations in the rate of these cancers from state and comparison zip code are not seen.
8
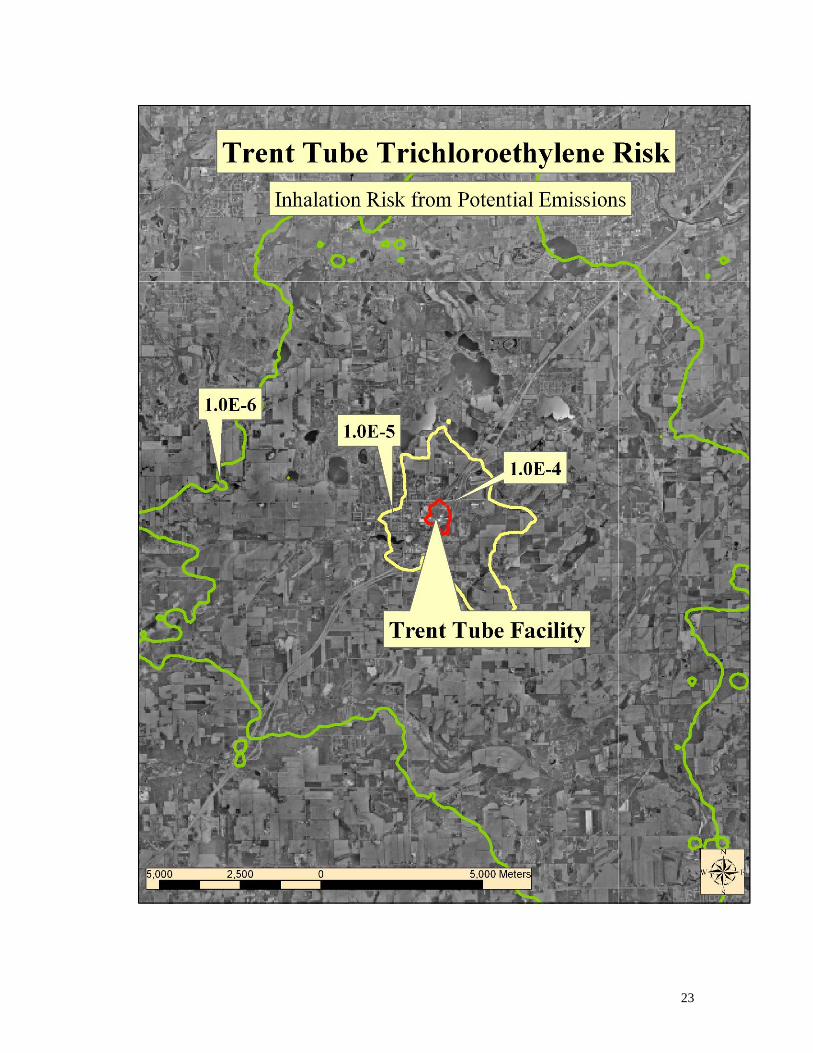
Public health implications of the TCE modeled in air around East Troy. Risk estimates derived by WDNR from the air dispersion modeling predict an increased probability of cancer in the community from TCE exposure. The predicted risk is low, ranging from one additional case per 100,000 people for most of the community, to one additional case per 10,000 people for areas very close to Trent Tube (WDNR 2005; Appendix II).
Using a cancer risk factor of 2 x 10⁻⁶, WDNR (2005) used the modeled predictions of TCE concentrations to secondarily calculate cancer risk from inhaled TCE exposure to the surrounding population in East Troy. The WDNR calculations superimpose a risk of 1 x 10⁻⁵ (1 in 100,000) to much of the community of East Troy (Appendix II). This low level of increased risk means, as discussed in the health outcome data review, that there was no statistically detectable difference in the rates of cancers associated with inhalation of TCE (kidney cancer, liver cancer, leukemia and lymphoma) between East Troy and demographically similar areas elsewhere in the state.
10The modeled risk assessment is based upon an EPA (EPA IRIS 2005) risk factor of 2 x
-6 additional cases of cancer per µg/m3 of TCE exposure over 70 years. Currently, the U.S. EPA carcinogenicity assessment for TCE has been withdrawn for further review. Cancer slope factors currently under proposal (EPA 2004, see Table 1) will likely be more stringent than those published previously, suggesting that the prediction of risk from exposure to TCE around East Troy may be underestimated. Any predictions of risk based upon modeled exposures must acknowledge sources of uncertainty in those predictions. Several sources of uncertainty are noted in the WDNR (2005) air dispersion modeling of TCE from Trent Tube. These include assumptions about “typical” humans, including individual physiology, health, and behavior, and the extrapolation of human health risks from animal studies. In the case of the air dispersion model, predictions of risk are based upon predictions of lifetime exposure. Lifetime exposure and risk varies with individual behavior such as healthy lifestyle, duration of residence, location and type of work environment. All of these are large sources of uncertainty when predicting risk in populations. Predictions of health risks from exposure to TCE are further complicated by uncertainty about the toxicity of low-level, long term TCE exposure to humans. Although the U.S. EPA considers TCE is a probable human carcinogen based on animal studies, the Agency for Toxic Substances and Disease Registry does not currently publish health-based table values for cancer or non-cancer effects resulting from chronic exposure. Similarly, the U.S. EPA has no current health guidelines for chronic exposure to TCE, although chronic exposure concentrations proposed in an EPA Draft Risk Assessment are 0.0003 ppbv (1.6 ng/m3) for carcinogenic effects and 7.5 ppbv (40 ug/m3) for non-cancer effects (EPA 2004) and are reported by EPA Region III.
Reducing TCE exposures in East Troy. DHFS supports Trent Tube’s initiative to take steps to reduce TCE emissions as part of prudent public health practice. Since Trent Tube is in compliance with the conditions of their air emissions permit, the technical improvements needed to reduce emissions under the current permit would be done voluntarily. The WDNR and U.S. EPA are currently negotiating such a voluntary reduction in TCE emissions with Trent Tube. Future air modeling and sampling in East Troy should address the effectiveness of efforts to reduce TCE emissions. In the short
9

term, the public may have questions and concerns regarding TCE exposure. Although this report attempts to anticipate questions from the public, the stakeholders addressing this issue should also develop plans to publicly communicate the issue of TCE exposure to the community.
Environmental fate of TCE. About half of the TCE released to air is broken down within a week to form dichloroacetylene and phosgene (ATSDR 1997), chemicals known to be harmful to people. TCE will break down after evaporating from surface water, but is released more slowly from soil or groundwater and resides longer in those environments. TCE can be found in some foods, but is not known to accumulate in fish or humans.
Other environmental sources of TCE. TCE may enter the home through pathways other than a single industrial point source (ATSDR 1997). Most people can begin to smell TCE in air when there are around 100 parts of trichloroethylene per million parts of air (ppm). The ATSDR acute Minimal Risk Level for TCE in air is 2 ppm, suggesting that an unhealthy concentration of TCE in indoor air may not have a noticeable odor. TCE can sometimes be found in indoor air as a result of using household products that contain TCE. These include some formulations of typewriter correction fluid, glues and adhesives, paint removers, carpet cleaning fluid, paints, and metal cleaners.
Another source of TCE in indoor air is contaminated tap water. In some cases TCE is found in drinking water at concentrations that are acceptable for drinking. However, showers and similar uses may allow TCE to volatilize from the water and accumulate indoors. TCE may also enter homes through the house foundation when the chemical is released into soil from area industries and then travels as a gas through soil or groundwater. This vapor intrusion pathway is a common problem near industries that use TCE and other solvents and may be the result of solvent disposal practices that were considered acceptable in earlier decades but that we now understand to cause environmental problems. TCE and other solvents in soil and groundwater around Trent Tube plant 3 and the former plant 1 site are currently being treated under WDNR regulations. In the case of Trent Tube in East Troy, there was no indication that nearby residences were affected. DHFS was able to rule out significant TCE migration into the closest residences, which were located at least 600 feet upstream, hydrogeologically, from the TCE source area.
Child Health Considerations TCE is expected to be more toxic to children and adolescents than to adults due to both higher rates of metabolism and higher respiratory rates. The metabolic products of TCE have toxic effects on the individual. Individuals with higher metabolic and respiration rates, such as children and adolescents, are expected to have higher rates of exposure than adults to TCE. A child care facility near Trent Tube was identified as a location where children might have higher than background exposures to TCE. Additional information is needed to evaluate the public health implications of this exposure. The additional information needed is better determination of TCE concentrations within the building and the amount of time that people spend in and around the building. The concentrations
10
predicted by the air dispersion model would be a concern for long-term, full-time exposures which may or may not be the case at this location. More detailed field sampling is needed to estimate TCE exposure to children at this location.
Conclusions Based on the location of Trent Tube, the population density of East Troy, limited air sampling in the community, and the modeled predictions of TCE dispersion, emissions to air from Trent Tube Plant 3 appear to expose the community to low concentrations of TCE. There are uncertainties inherent in air modeling and in directly measuring the low concentrations of TCE under consideration. There is also an absence of identified health effects in the community. From these observations, DHFS concludes that:
• Inhalation of TCE in air near Trent Tube in East Troy is an indeterminate public health hazard. This means that more information is needed to determine if there are health implications for people near Trent Tube.
• There is no public health hazard to the citizens of East Troy from TCE in soil and groundwater, as there is no evidence that anyone is being exposed to TCE in these parts of the local environment.
Recommendations • DHFS recommends additional air sampling near Trent Tube, particularly at the
child care facility. • DHFS supports Trent Tube’s initiative to take steps to reduce TCE emissions as
part of prudent public health practice. • Health and environmental agencies should develop an integrated plan to
communicate the environmental health implications of air quality studies in East Troy to that community.
• DHFS recommends air sampling and air modeling in East Troy to evaluate the effectiveness of efforts to reduce TCE emissions from Trent Tube.
Public Health Action Plan Trent Tube is voluntarily pursuing means to reduce TCE releases into air from their facility. Negotiation among Trent Tube and state environmental and health agencies is at the planning stage, and has included discussion of both engineered solutions and options for public funding to upgrade plant 3. DHFS, in cooperation with WDNR and U.S. EPA, will continue their support of these voluntary efforts, with monitoring environmental health needs in the community, and with communicating air quality and environmental health issues to the citizens of East Troy. The reduction of TCE emissions by Trent Tube is the action having the key public health benefit. DHFS will evaluate the effectiveness of efforts to reduce TCE emissions primarily through future air dispersion modeling (in cooperation with WDNR), as well as with air sampling where needed.
11

Report Author Robert Thiboldeaux, Ph.D. Arthur Wendel, M.D., MPH Bureau of Environmental and Occupational Health Wisconsin Department of Health and Family Services
References
ATSDR. 1997. Toxicological Profile for Trichloroethylene. Atlanta, GA: US Department of Health and Human Services, Public Health Service, Agency for Toxic Substances and Disease Registry. Web: http://www.atsdr.cdc.gov/toxprofiles/tp19.html
Brown SK, Sim MR, Abramson MJ, Gary CN. 1994. Concentrations of volatile organic compounds in indoor air- a review. Indoor Air 4: 123-134.
Census Bureau. 2000. U.S. Dept. Commerce. Internet: http://www.census.gov/census2000/states/wi.html
EPA. 2004. Trichloroethylene Health Risk Assessment: Synthesis and Characterization (External Review Draft). U. S. Environmental Protection Agency, National Center for Environmental Assessment. Internet: http://cfpub.epa.gov/ncea/cfm/recordisplay.cfm?deid=23249
EPA IRIS. 2005. Internet: http://www.epa.gov/ttn/atw/toxsource/table1.pdf
NTP 2005. National Toxicology Program, 11th Report on Carcinogens. Internet: http://ntp.niehs.nih.gov/ntp/roc/eleventh/profiles/s180tce.pdf
Sexton K, Adgate JL, Ramachandran G, Pratt GC Mongin SJ, Stock TH Morandi MT. 2004. Comparison of personal, indoor, and outdoor exposures to hazardous air pollutants in three urban communities. Env. Sci. Technol. 38: 423-430.
WDNR. 2005. Inhalation risk screen and hazardous air pollutant (HAP) assessment for Trent Tube (Walworth County). Wisconsin Department of Natural Resources, internal correspondence from Gail Good to Jeff Myers. May 17, 2005. File ref: 4530. FID: 265006170.
12
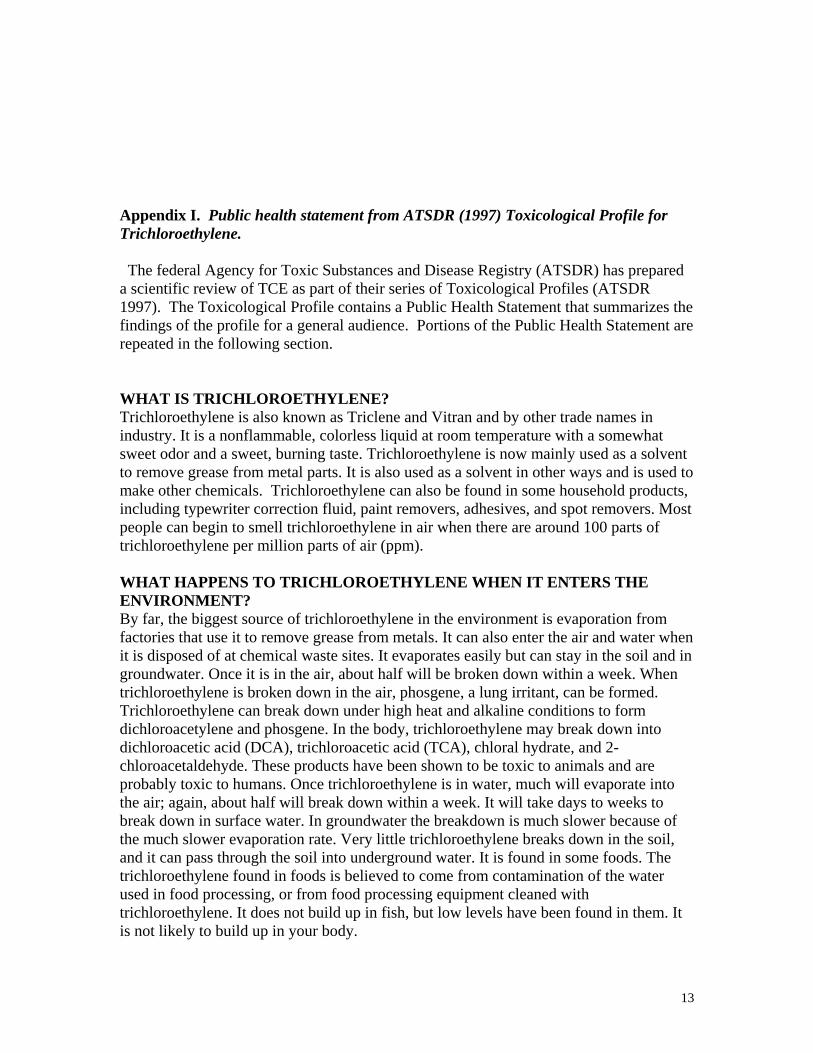
Appendix I. Public health statement from ATSDR (1997) Toxicological Profile for Trichloroethylene.
The federal Agency for Toxic Substances and Disease Registry (ATSDR) has prepared a scientific review of TCE as part of their series of Toxicological Profiles (ATSDR 1997). The Toxicological Profile contains a Public Health Statement that summarizes the findings of the profile for a general audience. Portions of the Public Health Statement are repeated in the following section.
WHAT IS TRICHLOROETHYLENE? Trichloroethylene is also known as Triclene and Vitran and by other trade names in industry. It is a nonflammable, colorless liquid at room temperature with a somewhat sweet odor and a sweet, burning taste. Trichloroethylene is now mainly used as a solvent to remove grease from metal parts. It is also used as a solvent in other ways and is used to make other chemicals. Trichloroethylene can also be found in some household products, including typewriter correction fluid, paint removers, adhesives, and spot removers. Most people can begin to smell trichloroethylene in air when there are around 100 parts of trichloroethylene per million parts of air (ppm).
WHAT HAPPENS TO TRICHLOROETHYLENE WHEN IT ENTERS THE ENVIRONMENT? By far, the biggest source of trichloroethylene in the environment is evaporation from factories that use it to remove grease from metals. It can also enter the air and water when it is disposed of at chemical waste sites. It evaporates easily but can stay in the soil and in groundwater. Once it is in the air, about half will be broken down within a week. When trichloroethylene is broken down in the air, phosgene, a lung irritant, can be formed. Trichloroethylene can break down under high heat and alkaline conditions to form dichloroacetylene and phosgene. In the body, trichloroethylene may break down into dichloroacetic acid (DCA), trichloroacetic acid (TCA), chloral hydrate, and 2chloroacetaldehyde. These products have been shown to be toxic to animals and are probably toxic to humans. Once trichloroethylene is in water, much will evaporate into the air; again, about half will break down within a week. It will take days to weeks to break down in surface water. In groundwater the breakdown is much slower because of the much slower evaporation rate. Very little trichloroethylene breaks down in the soil, and it can pass through the soil into underground water. It is found in some foods. The trichloroethylene found in foods is believed to come from contamination of the water used in food processing, or from food processing equipment cleaned with trichloroethylene. It does not build up in fish, but low levels have been found in them. It is not likely to build up in your body.
13
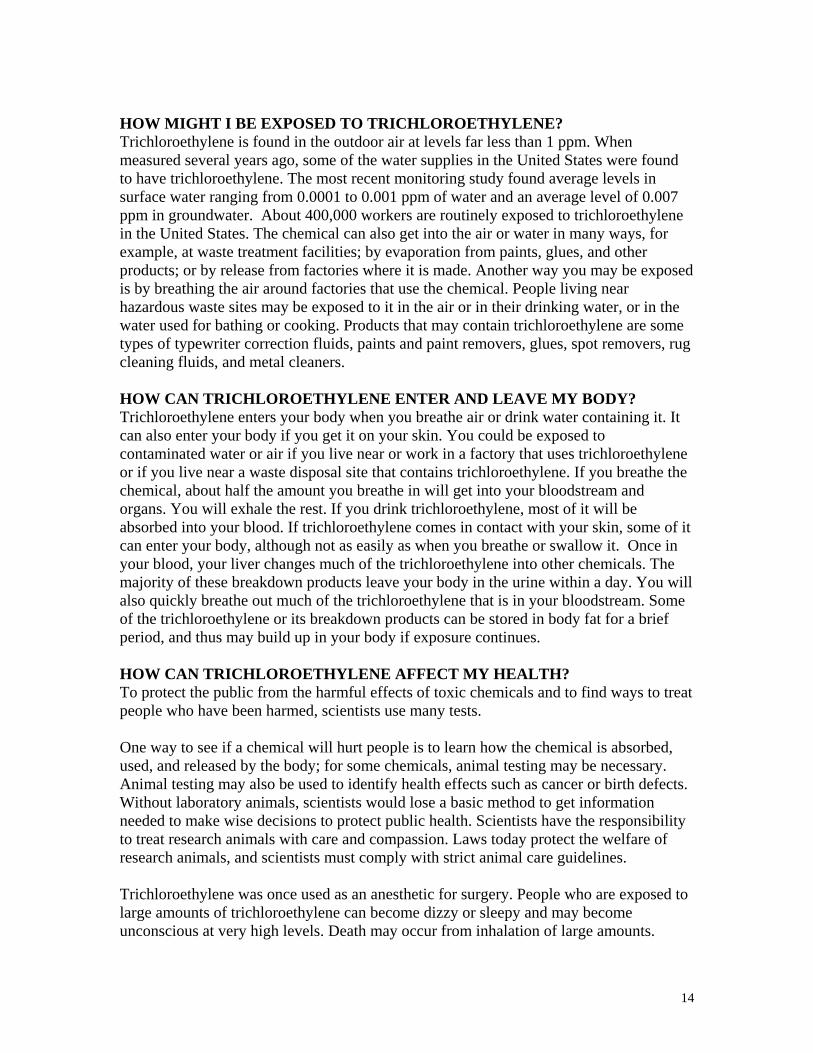
HOW MIGHT I BE EXPOSED TO TRICHLOROETHYLENE? Trichloroethylene is found in the outdoor air at levels far less than 1 ppm. When measured several years ago, some of the water supplies in the United States were found to have trichloroethylene. The most recent monitoring study found average levels in surface water ranging from 0.0001 to 0.001 ppm of water and an average level of 0.007 ppm in groundwater. About 400,000 workers are routinely exposed to trichloroethylene in the United States. The chemical can also get into the air or water in many ways, for example, at waste treatment facilities; by evaporation from paints, glues, and other products; or by release from factories where it is made. Another way you may be exposed is by breathing the air around factories that use the chemical. People living near hazardous waste sites may be exposed to it in the air or in their drinking water, or in the water used for bathing or cooking. Products that may contain trichloroethylene are some types of typewriter correction fluids, paints and paint removers, glues, spot removers, rug cleaning fluids, and metal cleaners.
HOW CAN TRICHLOROETHYLENE ENTER AND LEAVE MY BODY? Trichloroethylene enters your body when you breathe air or drink water containing it. It can also enter your body if you get it on your skin. You could be exposed to contaminated water or air if you live near or work in a factory that uses trichloroethylene or if you live near a waste disposal site that contains trichloroethylene. If you breathe the chemical, about half the amount you breathe in will get into your bloodstream and organs. You will exhale the rest. If you drink trichloroethylene, most of it will be absorbed into your blood. If trichloroethylene comes in contact with your skin, some of it can enter your body, although not as easily as when you breathe or swallow it. Once in your blood, your liver changes much of the trichloroethylene into other chemicals. The majority of these breakdown products leave your body in the urine within a day. You will also quickly breathe out much of the trichloroethylene that is in your bloodstream. Some of the trichloroethylene or its breakdown products can be stored in body fat for a brief period, and thus may build up in your body if exposure continues.
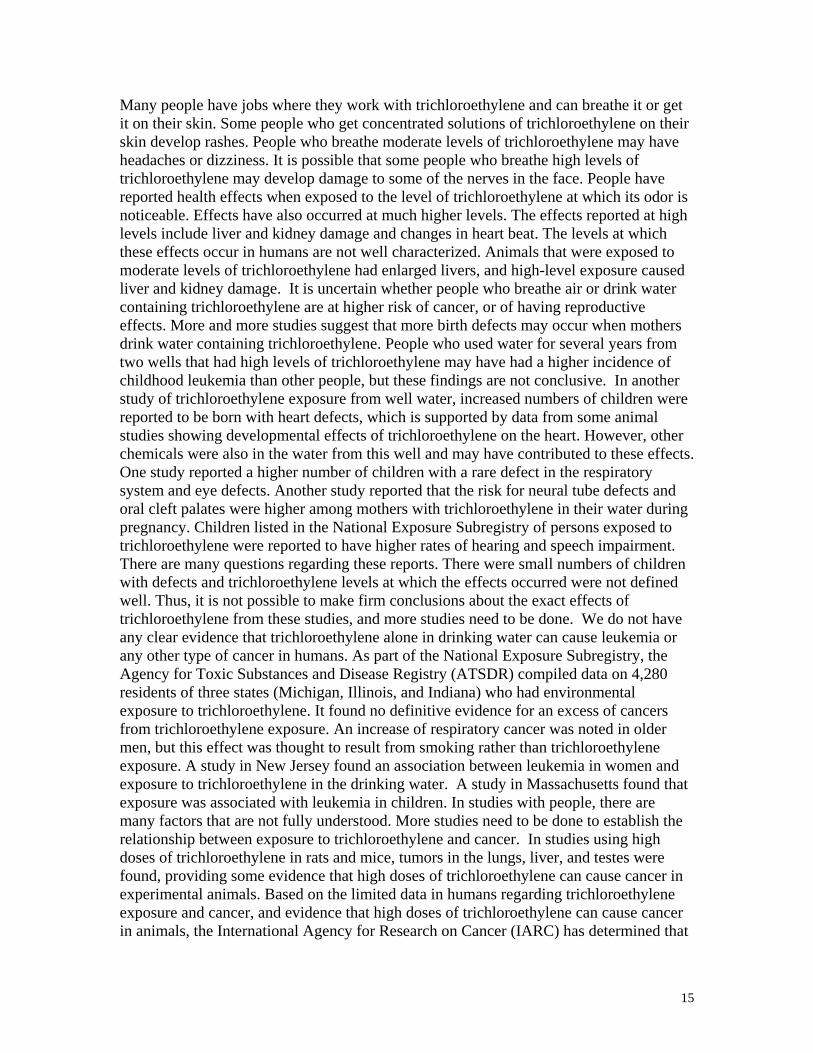
HOW CAN TRICHLOROETHYLENE AFFECT MY HEALTH? To protect the public from the harmful effects of toxic chemicals and to find ways to treat people who have been harmed, scientists use many tests.
One way to see if a chemical will hurt people is to learn how the chemical is absorbed, used, and released by the body; for some chemicals, animal testing may be necessary. Animal testing may also be used to identify health effects such as cancer or birth defects. Without laboratory animals, scientists would lose a basic method to get information needed to make wise decisions to protect public health. Scientists have the responsibility to treat research animals with care and compassion. Laws today protect the welfare of research animals, and scientists must comply with strict animal care guidelines.
Trichloroethylene was once used as an anesthetic for surgery. People who are exposed to large amounts of trichloroethylene can become dizzy or sleepy and may become unconscious at very high levels. Death may occur from inhalation of large amounts.
14
Many people have jobs where they work with trichloroethylene and can breathe it or get it on their skin. Some people who get concentrated solutions of trichloroethylene on their skin develop rashes. People who breathe moderate levels of trichloroethylene may have headaches or dizziness. It is possible that some people who breathe high levels of trichloroethylene may develop damage to some of the nerves in the face. People have reported health effects when exposed to the level of trichloroethylene at which its odor is noticeable. Effects have also occurred at much higher levels. The effects reported at high levels include liver and kidney damage and changes in heart beat. The levels at which these effects occur in humans are not well characterized. Animals that were exposed to moderate levels of trichloroethylene had enlarged livers, and high-level exposure caused liver and kidney damage. It is uncertain whether people who breathe air or drink water containing trichloroethylene are at higher risk of cancer, or of having reproductive effects. More and more studies suggest that more birth defects may occur when mothers drink water containing trichloroethylene. People who used water for several years from two wells that had high levels of trichloroethylene may have had a higher incidence of childhood leukemia than other people, but these findings are not conclusive. In another study of trichloroethylene exposure from well water, increased numbers of children were reported to be born with heart defects, which is supported by data from some animal studies showing developmental effects of trichloroethylene on the heart. However, other chemicals were also in the water from this well and may have contributed to these effects. One study reported a higher number of children with a rare defect in the respiratory system and eye defects. Another study reported that the risk for neural tube defects and oral cleft palates were higher among mothers with trichloroethylene in their water during pregnancy. Children listed in the National Exposure Subregistry of persons exposed to trichloroethylene were reported to have higher rates of hearing and speech impairment. There are many questions regarding these reports. There were small numbers of children with defects and trichloroethylene levels at which the effects occurred were not defined well. Thus, it is not possible to make firm conclusions about the exact effects of trichloroethylene from these studies, and more studies need to be done. We do not have any clear evidence that trichloroethylene alone in drinking water can cause leukemia or any other type of cancer in humans. As part of the National Exposure Subregistry, the Agency for Toxic Substances and Disease Registry (ATSDR) compiled data on 4,280 residents of three states (Michigan, Illinois, and Indiana) who had environmental exposure to trichloroethylene. It found no definitive evidence for an excess of cancers from trichloroethylene exposure. An increase of respiratory cancer was noted in older men, but this effect was thought to result from smoking rather than trichloroethylene exposure. A study in New Jersey found an association between leukemia in women and exposure to trichloroethylene in the drinking water. A study in Massachusetts found that exposure was associated with leukemia in children. In studies with people, there are many factors that are not fully understood. More studies need to be done to establish the relationship between exposure to trichloroethylene and cancer. In studies using high doses of trichloroethylene in rats and mice, tumors in the lungs, liver, and testes were found, providing some evidence that high doses of trichloroethylene can cause cancer in experimental animals. Based on the limited data in humans regarding trichloroethylene exposure and cancer, and evidence that high doses of trichloroethylene can cause cancer in animals, the International Agency for Research on Cancer (IARC) has determined that
15

trichloroethylene is probably carcinogenic to humans. Trichloroethylene has been nominated for listing in the National Toxicology Program (NTP) 9th Report on Carcinogens. Evaluation of this substance by the NTP review committee is ongoing.
16
Appendix II: WDNR Trent Tube Air Dispersion Model
State of WisconsinState of WisconsinCORRESPONDENCE/MEMORANDUMCORRESPONDENCE/MEMORANDUM
DATE: May 17, 2005 FILE REF: 4530 FID: 265006170
TO: Jeff Myers – AM/7
FROM: Gail Good – AM/7
SUBJECT: Inhalation Risk Screening and Hazardous Air Pollutant (HAP) Assessment for Trent Tube (Walworth County)
A. Summary
The upper bound inhalation cancer risk from hazardous air pollutant emissions was determined for Trent Tube in East Troy (Walworth County), Wisconsin. The maximum theoretical emissions (MTE) of 578.4 tons of trichloroethylene per year results in a maximum off-property inhalation risk of 8.9e-4 or about nine in ten thousand. This result assumes that 60% of the emissions from S14 (degreaser) are fugitive and 20% of the emissions from S30 (doping process) are fugitive, similar to what is reported in the emissions inventory. Using the MTE rates and the fugitive assumptions, the inhalation risk at a known residence is 5.9e-5 or about six in one hundred thousand. The nearest residence is located northeast of the facility. The only route of exposure considered was inhalation and the modeled hours of operation were 24 hours per day, 365 days per year (8,760 hours).
The 2003 actual emissions of 111.4 tons of trichloroethylene per year results in an off-property inhalation risk of 3.5e-4 or about four in ten thousand, assuming the same fugitive distribution as the MTE analysis. The inhalation risk at a known residence was 2.7e-5 or about three in one hundred thousand. The analysis of the actual emissions was expanded to consider different percentages of fugitive emissions and all results are presented in the tables found in Section D of this document. The only route of exposure considered was inhalation and the modeled hours of operation were 24 hours per day, 365 days per year (8,760 hours).
In addition, the HAPs at the facility were modeled and compared to the appropriate standards as outlined in NR445.
B. Facility Description and Background
Trent Tube manufactures stainless steel tubing at two adjacent facilities in East Troy, Wisconsin. Tubing at the plant is manufactured from a variety of stainless steel alloys. Wastewater treatment for both facilities is provided on-site.
C. Modeling Analysis
17
♦ The emission parameters used in this analysis were provided by Jeff Myers of the Wisconsin Department of Natural Resources and Sharon Myers of Triad Engineering. The parameters were further checked using the AEI. Building dimensions were determined using the Building Profile Input Program (BPIP) with measurements taken on plot plans provided by the facility as part of a permit application. Please refer to the source tables.
♦ Five years (1975-1979) of preprocessed meteorological data was used in this analysis. The surface data was collected in Madison and the upper air meteorological data originated in Green Bay.
♦ The Industrial Source Complex Short Term 3 (ISCST3) model was also used in the analysis. The model used rural dispersion coefficients with the regulatory default options. These allow for calm wind correction, buoyancy induced dispersion, and building downwash.
♦ The receptors used in this analysis consisted of a rectangular grid with varying resolution (depending on distance from the facility), extending 20 kilometers from the facility. Terrain was considered in this analysis.
D. Emissions Data and Summary of Risk
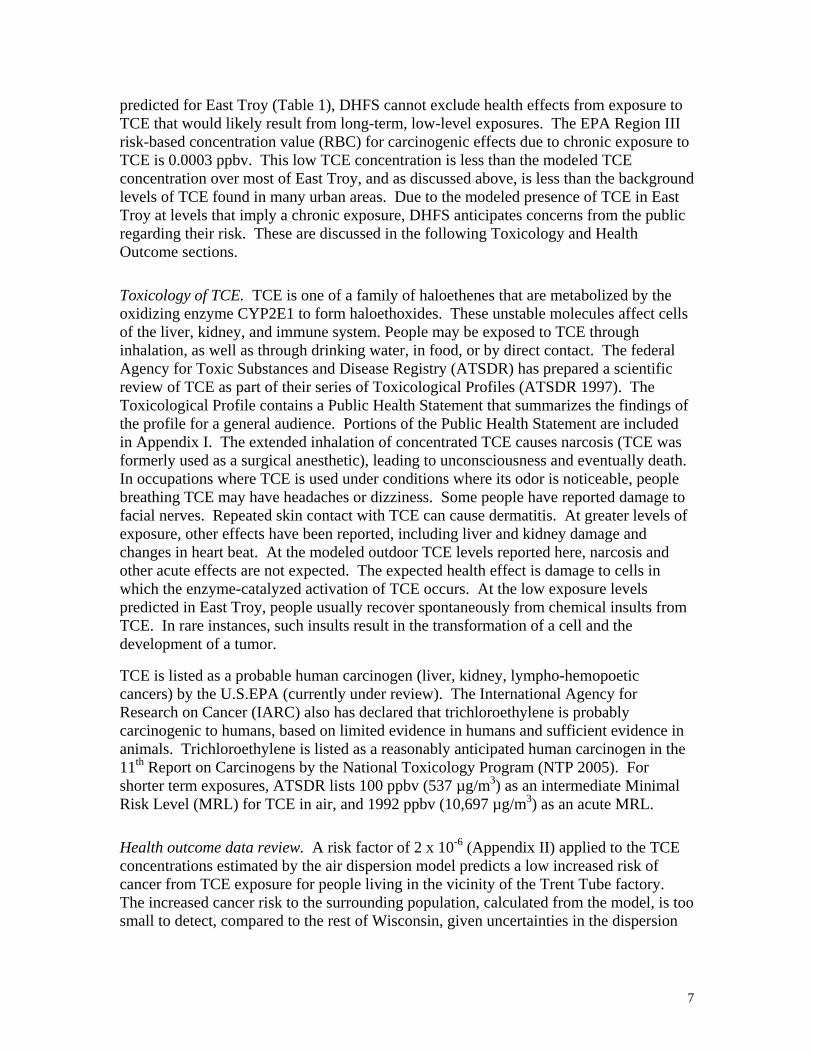
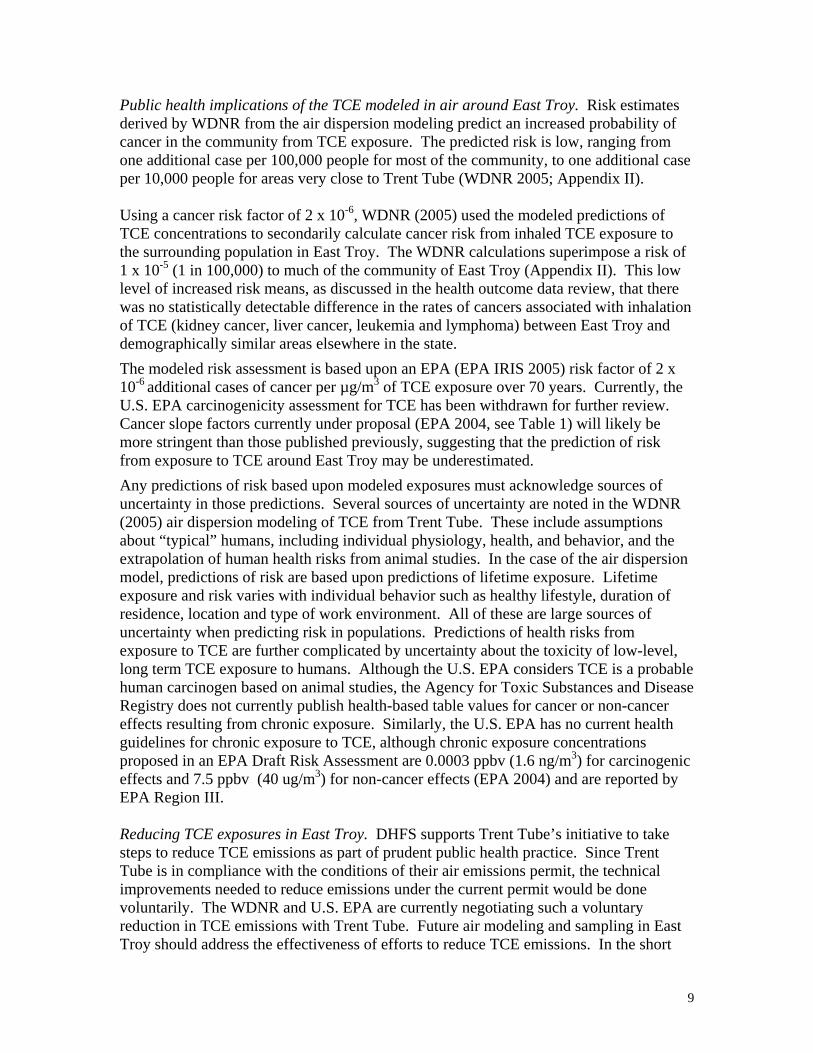
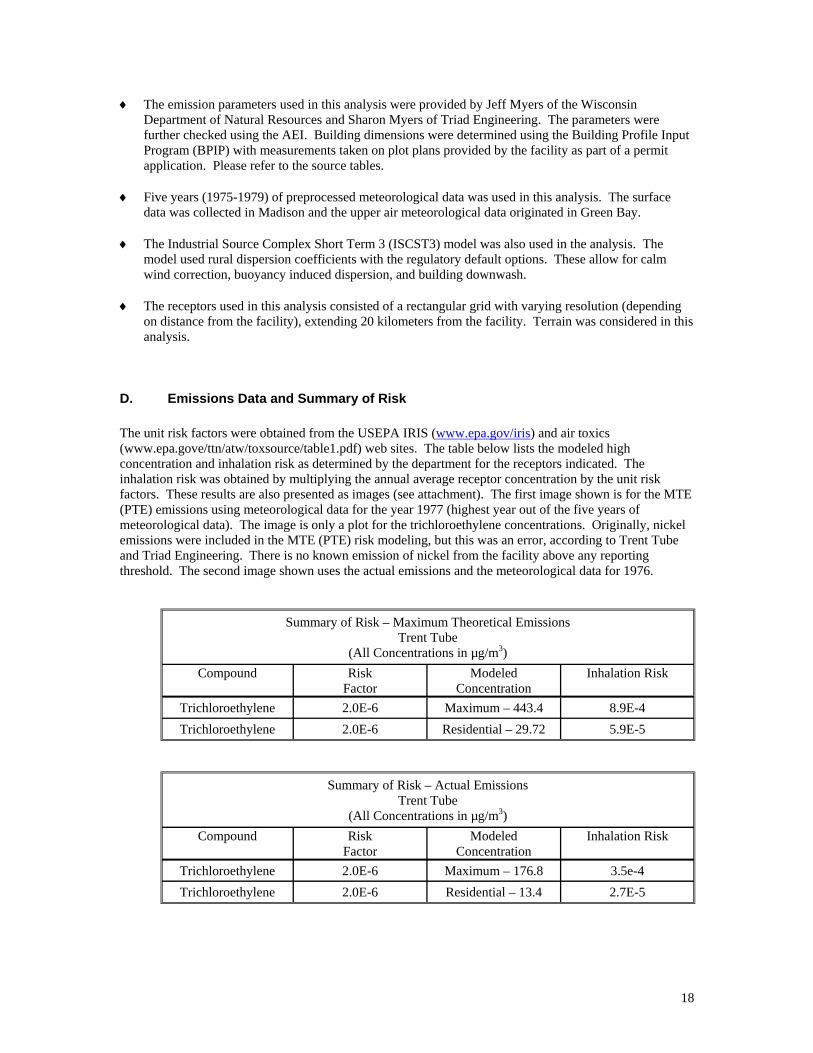
The unit risk factors were obtained from the USEPA IRIS (www.epa.gov/iris) and air toxics (www.epa.gove/ttn/atw/toxsource/table1.pdf) web sites. The table below lists the modeled high concentration and inhalation risk as determined by the department for the receptors indicated. The inhalation risk was obtained by multiplying the annual average receptor concentration by the unit risk factors. These results are also presented as images (see attachment). The first image shown is for the MTE (PTE) emissions using meteorological data for the year 1977 (highest year out of the five years of meteorological data). The image is only a plot for the trichloroethylene concentrations. Originally, nickel emissions were included in the MTE (PTE) risk modeling, but this was an error, according to Trent Tube and Triad Engineering. There is no known emission of nickel from the facility above any reporting threshold. The second image shown uses the actual emissions and the meteorological data for 1976.
Summary of Risk – Maximum Theoretical Emissions Trent Tube
(All Concentrations in µg/m3) Compound Risk
Factor Modeled
Concentration Inhalation Risk
Trichloroethylene 2.0E-6 Maximum – 443.4 8.9E-4 Trichloroethylene 2.0E-6 Residential – 29.72 5.9E-5
Summary of Risk – Actual Emissions Trent Tube
(All Concentrations in µg/m3) Compound Risk
Factor Modeled
Concentration Inhalation Risk
Trichloroethylene 2.0E-6 Maximum – 176.8 3.5e-4 Trichloroethylene 2.0E-6 Residential – 13.4 2.7E-5
18

Summary of Risk Sensitivity Analysis for Fugitive Emissions – Actual Emissions Trent Tube
(All Concentrations in µg/m3) Compound Risk
Factor Modeled
Concentration Inhalation Risk
Trichloroethylene* (S14 50/50; S30 10/90) 2.0E-6 Maximum – 165.4 3.3e-4
Trichloroethylene* (S14 60/40; S30 20/80) 2.0E-6 Maximum – 176.8 3.5e-4
Trichloroethylene* (S14 70/30; S30 30/70) 2.0E-6 Maximum – 191.4 3.8e-4
*The values in parentheses are the percentage of fugitive vs. non-fugitive emissions as used in the modeling to identify a range of risk.
E. Toxicological Assumptions
Health and Environmental Analyses require the use of assumptions to predict the impacts of any proposed action. It is therefore important to include the assumptions used in the analysis.
1. For cancer risk analysis, the assumptions used are that a person weighing 70 kilograms lives at the point of maximum impact for 70 years and breathes 20 m3 of air per day. When human data on carcinogenicity of a chemical are available, those data are preferred. However, those data often have to be extrapolated from occupational, or other higher exposure levels, to lower exposure levels and additional assumptions must be made. Another assumption is that when human data is unavailable, animal data for carcinogens can be extrapolated to humans and that the higher doses used in animal studies can be extrapolated to lower doses that are typical of human exposures. In addition, it is assumed that cancer is a non-threshold process, and even a very small amount of a cancer agent has some level of risk associated with it (i.e. even if one molecule of the chemical is present, there is some risk, however small it may be).
2. The risk estimated in this analysis represents the highest likely (or 95% upper bound) risk under the assumed conditions. The actual risk (using the assumptions) could be lower and even approach zero, but because the way the mathematical models work, there is no way of telling what the actual risk is. It can only be stated that the "true risk" is between zero and the upper bound value estimated in the mathematical model.
3. This analysis did not consider other chemicals and other routes of exposure. Depending on what other chemicals are involved and what the exposure scenarios are, actual total risk could be different.
4. The estimation of emissions from a facility and the modeling of ambient air impacts also have assumptions that must be considered in determining the likelihood that the risks represent actual risks.
5. There may be other chemicals of concern that were not addressed or of which we do not currently know. For this analysis, other contaminants contained in Table 3 of NR 445, Wisconsin
19

Administrative Code, were excluded if their emissions were estimated to be below the de minimis emission rates in NR 445.
6. Non-cancer risks were not addressed in this analysis.
7. Environmental risks were not addressed in this analysis.
8. Background levels and multiple sources of the pollutants were not addressed.
9. All risks were considered to be additive.
F. HAP Analysis Results
Modeling Analysis Results - MTE (All Concentrations in :g/m3)
Trichloroethylene – 24 hour
Hydrogen flouride – 1 hour
Nitric acid – 24 hour
Impact 4132.8 108.0 47.8 AAC 6449.0 246.0 124.0 % AAC 64.1 43.9 38.5
Modeling Analysis Results - MTE (All Concentrations in :g/m3)
Sulfuric acid – 24 hour Toluene – 24 hour Toluene - Annual
Impact 14.0 671.8 76.0 AAC 24.0 4522.0 400.0 % AAC 58.3 14.9 19.0
Modeling Analysis Results - MTE (All Concentrations in :g/m3)
Chromium (Metal) – 24 hour Copper – 24 hour
Impact 4.58 0.09 AAC 12.0 24.0 % AAC 38.2 0.4
20

Modeling Analysis Results – Actual Emissions (All Concentrations in :g/m3)
Trichloroethylene – 24 hour
Hydrogen flouride – 1 hour
Nitric acid – 24 hour Toluene – 24 hour Toluene - Annual
Impact 1618.4 69.1 22.8 92.2 10.4 AAC 6449.0 246.0 124.0 4522.0 400.0 % AAC 25.1 28.1 18.4 2.0 2.6
G. Emission Rates and Source Parameters
Trent Tube – East Troy Emission Rates - MTE
SOURCE SOURCE Trichloroethylene Hydrogen Nitric Acid Sulfuric Acid ID TYPE (#/HR) Fluoride (#/HR) (#/HR) (#/HR)
S14 Point 45 - - -S16 Point - 1.29 1.79 -S17 Point - 5.87 2.32 3.10 S30 Point 87.05 - - -S35 Point - - - -S43 Point - - - -S58 Point - 0.03 - -
Trent Tube – East Troy Emission Rates - MTE
SOURCE SOURCE Toluene Chromium Nickel Copper ID TYPE (#/HR) (#/HR) (#/HR) (#/HR)
S14 Point - - -S16 Point - - - -S17 Point - - - -S30 Point 9.33 - - -S35 Point - 0.034 0.02 0.00066
21
S43 Point - 0.134 0.08 0.0026 S58 Point - - - -
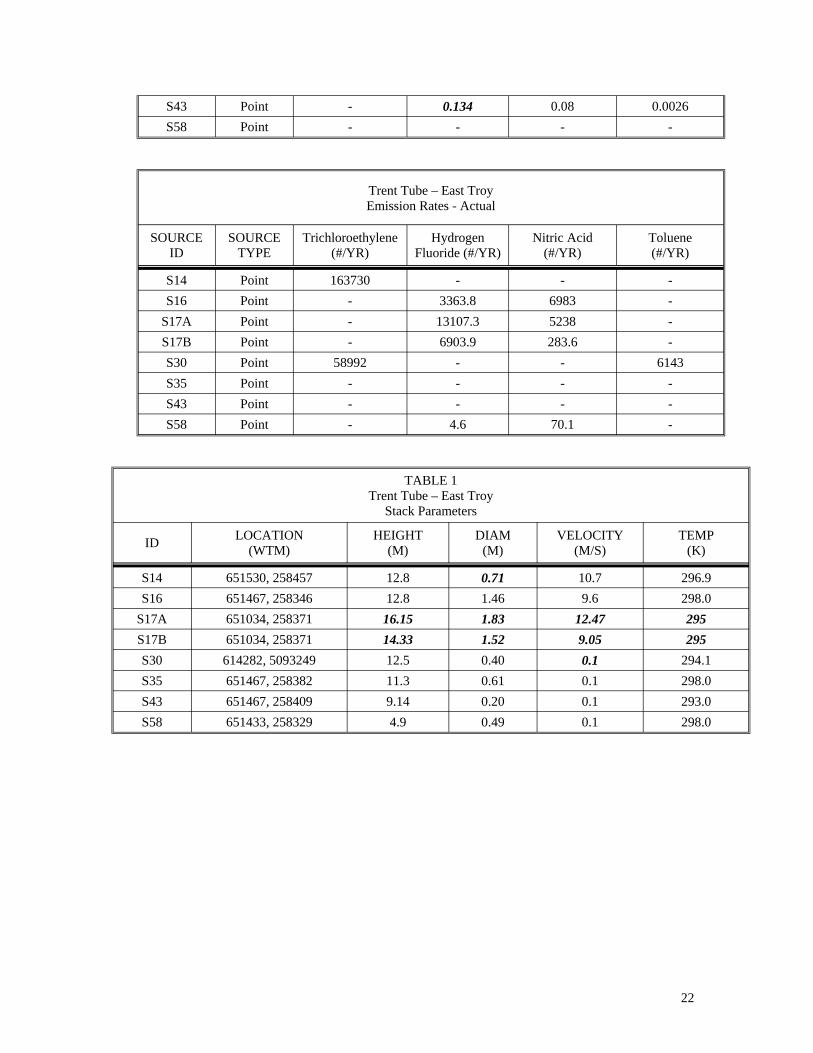
Trent Tube – East Troy Emission Rates - Actual
SOURCE SOURCE Trichloroethylene Hydrogen Nitric Acid Toluene ID TYPE (#/YR) Fluoride (#/YR) (#/YR) (#/YR)
S14 Point 163730 - - -S16 Point - 3363.8 6983 -
S17A Point - 13107.3 5238 -S17B Point - 6903.9 283.6 -S30 Point 58992 - - 6143 S35 Point - - - -S43 Point - - - -S58 Point - 4.6 70.1 -
TABLE 1 Trent Tube – East Troy
Stack Parameters
ID LOCATION (WTM)
HEIGHT (M)
DIAM (M)
VELOCITY (M/S)
TEMP (K)
S14 651530, 258457 12.8 0.71 10.7 296.9 S16 651467, 258346 12.8 1.46 9.6 298.0
S17A 651034, 258371 16.15 1.83 12.47 295 S17B 651034, 258371 14.33 1.52 9.05 295 S30 614282, 5093249 12.5 0.40 0.1 294.1 S35 651467, 258382 11.3 0.61 0.1 298.0 S43 651467, 258409 9.14 0.20 0.1 293.0 S58 651433, 258329 4.9 0.49 0.1 298.0
22
23

24
