trial burn report for co boiler no. 2 final report · pdf file ·...
TRANSCRIPT

Prepared for: Shell Oil Products U.S., Inc. Shell Martinez Refinery 3485 Pacheco Boulevard Martinez, CA 94553
Trial Burn Report for CO Boiler No. 2 Final Report
ENSR Corporation September 2006; Rev. 1 November 2006 Document No.: 05975-140-640

Prepared for: Shell Oil Products U.S., Inc. Shell Martinez Refinery 3485 Pacheco Boulevard Martinez, CA 94553
Trial Burn Report for CO Boiler No. 2 Final Report
_________________________________ Prepared By: Douglas R. Roeck
_________________________________ Reviewed By: Michael Dudasko
ENSR Corporation September 2006; Rev. 1 November 2006 Document No.: 05975-140-640

Contents
1.0 Trial Burn Emissions Summary........................................................................................................... 1-1
2.0 Introduction ............................................................................................................................................ 2-1 2.1 Project Background and Schedule ................................................................................................. 2-1 2.2 Project Scope and Test Requirements........................................................................................... 2-1 2.3 Report Organization ........................................................................................................................ 2-1
3.0 Process Operating Conditions and Compliance Strategy............................................................... 3-1 3.1 Overview of Test Conditions ........................................................................................................... 3-1 3.2 Facility Monitoring Data................................................................................................................... 3-1 3.3 Data-in-lieu-of Testing..................................................................................................................... 3-2 3.4 Anticipated Permit Conditions......................................................................................................... 3-2
4.0 Sampling and Analytical Program Overview ..................................................................................... 4-1 4.1 Waste Feed Stream ........................................................................................................................ 4-1 4.2 Spiking Material ............................................................................................................................... 4-1 4.3 Stack Gas ........................................................................................................................................ 4-1
4.3.1 Carbon Dioxide, Carbon Monoxide, Oxygen and Total Hydrocarbons ........................... 4-2 4.3.2 Particulate Matter............................................................................................................... 4-2 4.3.3 Particulate Matter, Hydrogen Chloride, Chlorine and Ammonia...................................... 4-2 4.3.4 Carbonyl Compounds........................................................................................................ 4-2 4.3.5 Metals................................................................................................................................. 4-2 4.3.6 Hexavalent Chromium....................................................................................................... 4-3 4.3.7 PCDDs/PCDFs and PAHs ................................................................................................ 4-3 4.3.8 Target Semivolatile Organics ............................................................................................ 4-3 4.3.9 Target Volatile Organics and POHC DRE........................................................................ 4-3
5.0 Trial Burn Test Results ......................................................................................................................... 5-1 5.1 Waste Feed Stream ........................................................................................................................ 5-1 5.2 Spiking Material ............................................................................................................................... 5-1 5.3 Stack Gas Measurements – Condition 1........................................................................................ 5-1
5.3.1 Oxygen, Carbon Dioxide and Total Hydrocarbons........................................................... 5-1 5.3.2 Particulate Matter............................................................................................................... 5-1
5.4 Stack Gas Measurements – Condition 2........................................................................................ 5-2 5.4.1 Oxygen, Carbon Dioxide and Total Hydrocarbons........................................................... 5-2 5.4.2 Particulate Matter............................................................................................................... 5-2 5.4.3 Hydrogen Chloride, Chlorine and Ammonia ..................................................................... 5-2
i September 2006 J:\PROJECTS\05975_Shell\140\Trial Burn\Trial Burn
Report\Shell Martinez TB Report R1_11_06.doc

5.4.4 Carbonyl Compounds........................................................................................................ 5-2 5.4.5 Metals................................................................................................................................. 5-2 5.4.6 Hexavalent Chromium....................................................................................................... 5-3 5.4.7 PCDDs/PCDFs and PAHs ................................................................................................ 5-3 5.4.8 Target Semivolatile Organics ............................................................................................ 5-3 5.4.9 Target Volatile Organics.................................................................................................... 5-3
5.5 Stack Gas Measurements – Condition 3........................................................................................ 5-4 5.5.1 Oxygen, Carbon Dioxide and Total Hydrocarbons........................................................... 5-4 5.5.2 POHC DRE........................................................................................................................ 5-4
6.0 Quality Assurance / Quality Control (QA/QC).................................................................................... 6-1 6.1 Sample Collection QA/QC .............................................................................................................. 6-1
6.1.1 Waste Feed Stream........................................................................................................... 6-1 6.1.2 Stack Gas........................................................................................................................... 6-1
6.2 Laboratory Analysis QA/QC............................................................................................................ 6-2 6.2.1 Waste Feed Stream – Physical Parameter Analyses ...................................................... 6-2 6.2.2 Waste Feed Stream – Organic Analyses ......................................................................... 6-3 6.2.3 Waste Feed Stream – Metals Analyses............................................................................ 6-3 6.2.4 Stack Gas Analyses .......................................................................................................... 6-4
List of Appendices Appendix A Facility Process Monitoring Data
Appendix B Field Sampling Report: The Avogadro Group, LLC
Appendix C POHC Spiking Report: Triad Chemicals, LLC
Appendix D Field Sampling Documentation (ENSR)
Appendix E Analytical Data Reports
ii September 2006 J:\PROJECTS\05975_Shell\140\Trial Burn\Trial Burn
Report\Shell Martinez TB Report R1_11_06.doc

List of Tables
Table 1-1 Trial Burn Emissions Summary for Currently Regulated Constituents ......................................... 1-2 Table 1-2 Trial Burn Emissions Compared to Future MACT Standards ....................................................... 1-3 Table 2-1 Trial Burn Sample Train Run Times............................................................................................... 2-3 Table 2-2 Overall Trial Burn Run Times Associated with Process Data Collection and MCB Spiking ........ 2-4 Table 3-1 Process Operating Data Summary – Test Condition 1 ................................................................. 3-3 Table 3-2 Process Operating Data Summary – Test Condition 2 ................................................................. 3-4 Table 3-3 Process Operating Data Summary – Test Condition 3 ................................................................. 3-5 Table 3-4 Anticipated Permit Conditions ........................................................................................................ 3-6 Table 5-1 Waste Stream Analytical Results for Physical Parameters........................................................... 5-5 Table 5-2 Waste Stream Analytical Results for Target Metals (Condition 1)................................................ 5-6 Table 5-3 Waste Stream Analytical Results for Target Metals (Condition 2)................................................ 5-7 Table 5-4 Waste Stream Analytical Results for Target Metals (Condition 3)................................................ 5-8 Table 5-5 Sampling Parameters and Emission Results for PM (Condition 1) .............................................. 5-9 Table 5-6 Sampling Parameters and Emission Results for PM, HCl, Cl2 and NH3 (Condition 2) .............. 5-10 Table 5-7 Sampling Parameters and Emission Results for Carbonyl Compounds (Condition 2) .............. 5-11 Table 5-8 Sampling Parameters and Emission Results for Target Metals (Condition 2) ........................... 5-12 Table 5-9 Sampling Parameters and Emission Results for Hexavalent Chromium (Condition 2) ............. 5-16 Table 5-10 Sampling Parameters and Emission Results for PCDDs/PCDFs – TEQ Basis (Condition 2) 5-17 Table 5-11 Sampling Parameters and Emission Results for PAHs (Condition 2) ...................................... 5-18 Table 5-12 Sampling Parameters and Emission Results for Semivolatile Organics (Condition 2) ............ 5-19 Table 5-13 VOST Sampling Parameters (Condition 2)................................................................................ 5-21 Table 5-14 Emission Results for Target Volatile Organics (Condition 2) .................................................... 5-22 Table 5-15 VOST Sampling Parameters (Condition 3)................................................................................ 5-24 Table 5-16 DRE Calculations for Monochlorobenzene (Condition 3) ......................................................... 5-25 Table 6-1 Overall QC Summary for Waste Feed Stream Physical Parameter Analyses............................. 6-2 Table 6-2 Overall QC Summary for Waste Feed Stream Organic Analyses ................................................ 6-3 Table 6-3 Overall QC Summary for Waste Feed Stream Metals Analyses .................................................. 6-4 Table 6-4 Overall QC Summary for HCl, Cl2 and NH3 in Stack Gas Samples.............................................. 6-5 Table 6-5 Overall QC Summary for Aldehydes in Stack Gas Samples ........................................................ 6-5 Table 6-6 Overall QC Summary for Metals in Stack Gas Samples............................................................... 6-6 Table 6-7 Overall QC Summary for Hexavalent Chromium in Stack Gas Samples..................................... 6-7 Table 6-8 Overall QC Summary for PCDDs/PCDFs in Stack Gas Samples ................................................ 6-8 Table 6-9 Overall QC Summary for PAHs in Stack Gas Samples ................................................................ 6-9 Table 6-10 Overall QC Summary for SVOCs in Stack Gas Samples ......................................................... 6-10
iii September 2006 J:\PROJECTS\05975_Shell\140\Trial Burn\Trial Burn
Report\Shell Martinez TB Report R1_11_06.doc

Table 6-11 Overall QC Summary for Volatile Organics in Stack Gas Samples.......................................... 6-11
List of Figures
No figures provided in this report.
iv September 2006 J:\PROJECTS\05975_Shell\140\Trial Burn\Trial Burn
Report\Shell Martinez TB Report R1_11_06.doc

1
LIST OF ACRONYMS / DEFINITIONS
Acronym Definition acfm Actual cubic feet per minute AS Alternate (Recovery) Standard ASTM American Society for Testing and Materials BAAQMD Bay Area Air Quality Management District CARB California Air Resources Board CEMS Continuous Emissions Monitoring System CFR Code of Federal Regulations Cl2 Chlorine gas CO Carbon Monoxide CO2 Carbon Dioxide COC Chain of Custody CVAAS Cold Vapor Atomic Absorption Spectroscopy DAS Data Acquisition System DI Deionized (water) DNPH Dinitrophenylhydrazine DOT Department of Transportation (U.S.) DRE Destruction and Removal Efficiency dscfm Dry standard cubic feet per minute dscm Dry standard cubic meters DTSC Department of Toxic Substances Control (California) EPA Environmental Protection Agency (U.S.) ESP Electrostatic Precipitator g/hr Grams per hour GC Gas Chromatography GC / MS Gas Chromatography / Mass Spectrometry GRAV Gravimetric gr/dscf Grains per dry standard cubic foot HCl Hydrogen Chloride HPLC High Performance Liquid Chromatography HRA Hourly Rolling Average HRGC / HRMS High Resolution Gas Chromatography / High Resolution Mass Spectrometry
ICP / MS Inductively Coupled Plasma / Mass Spectrometry INST Instantaneous IS Internal Standard lb/hr Pounds per hour LCS / LCSD Laboratory Control Sample / Laboratory Control Sample Duplicate Lpm Liters per Minute
September 2006 J:\PROJECTS\05975_Shell\140\Trial Burn\Trial Burn Report\Shell Martinez TB Report R1_11_06.doc
2
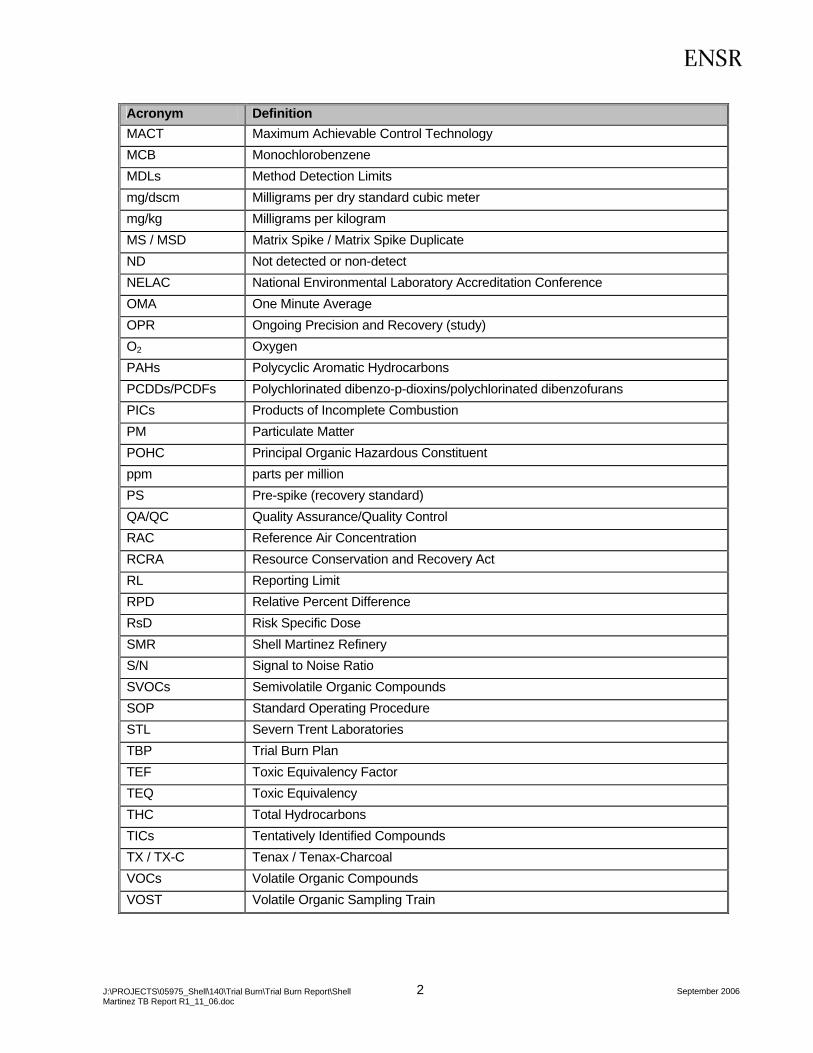
Acronym Definition MACT Maximum Achievable Control Technology MCB Monochlorobenzene MDLs Method Detection Limits mg/dscm Milligrams per dry standard cubic meter mg/kg Milligrams per kilogram MS / MSD Matrix Spike / Matrix Spike Duplicate ND Not detected or non-detect NELAC National Environmental Laboratory Accreditation Conference OMA One Minute Average OPR Ongoing Precision and Recovery (study) O2 Oxygen PAHs Polycyclic Aromatic Hydrocarbons PCDDs/PCDFs Polychlorinated dibenzo-p-dioxins/polychlorinated dibenzofurans PICs Products of Incomplete Combustion PM Particulate Matter POHC Principal Organic Hazardous Constituent ppm parts per million PS Pre-spike (recovery standard) QA/QC Quality Assurance/Quality Control RAC Reference Air Concentration RCRA Resource Conservation and Recovery Act RL Reporting Limit RPD Relative Percent Difference RsD Risk Specific Dose SMR Shell Martinez Refinery S/N Signal to Noise Ratio SVOCs Semivolatile Organic Compounds SOP Standard Operating Procedure STL Severn Trent Laboratories TBP Trial Burn Plan TEF Toxic Equivalency Factor TEQ Toxic Equivalency THC Total Hydrocarbons TICs Tentatively Identified Compounds TX / TX-C Tenax / Tenax-Charcoal VOCs Volatile Organic Compounds VOST Volatile Organic Sampling Train
September 2006 J:\PROJECTS\05975_Shell\140\Trial Burn\Trial Burn Report\Shell Martinez TB Report R1_11_06.doc

1-1
1.0 Trial Burn Emissions Summary
The Shell Martinez Refinery (SMR) in Martinez, CA conducted RCRA Trial Burn testing on one of its carbon monoxide (CO) boilers during the weeks of June 5 and June 12, 2006. Trial burn testing was performed on CO Boiler No. 2 (COB-2) in response to requests from the California Department of Toxic Substances Control (DTSC) and the Bay Area Air Quality Management District (BAAQMD). The test was conducted in accordance with an approved Trial Burn Plan (TBP) and under full oversight of the DTSC. Test parameters included both regulated emissions and/or performance standards called out in the facility’s RCRA permit as well as non-regulated parameters of interest to a multipathway human health risk assessment. Further details on the overall scope and objectives for the trial burn are provided later in Section 2.2.
An overall summary of emission results and/or performance criteria for currently regulated parameters is provided in Table 1-1. In addition, a comparison is provided in Table 1-2 of applicable emission data to the MACT standards that will affect the Martinez refinery in the future and will be under the jurisdiction of BAAQMD.
It is noted that the DRE test conducted during Test Condition 3 did not achieve the minimum required performance standard of 99.99% destruction / removal efficiency. The causes for this are currently under investigation and a retest will be performed as soon as practicable. An addendum to this report will be issued following the completion of a successful retest. All other test parameters for the trial burn complied with both current permit limits and future MACT standards.
September 2006 J:\PROJECTS\05975_Shell\140\Trial Burn\Trial Burn Report\Shell Martinez TB Report R1_11_06.doc
Rev. 1; November 2006

1-2
Table 1-1 Trial Burn Emissions Summary for Currently Regulated Constituents
CurrentEmission Parameter and Test PermitSampling Method Units Average (a) LimitPOHC DRE (Method 0030) --Monochlorobenzene % 99.9638 > 99.99PM / HCl / Cl2 (Method 0050) --
Particulate Matter @ 7% O2 gr/dscf 0.0046 0.08
Hydrogen Chloride g/sec 0.065 18.3
Chlorine g/sec 0.015 1.05Metals (Method 29) --Antimony g/sec < 3.11E-06 7.60E-02Arsenic g/sec 2.07E-05 6.77E-05Barium g/sec 2.30E-05 6.00E-01Beryllium g/sec < 6.65E-06 6.77E-05Cadmium g/sec 4.45E-06 4.60E-04Chromium g/sec 4.43E-05 6.00E-04Lead g/sec 3.43E-05 7.40E-02Mercury g/sec 1.61E-04 5.60E-02Silver g/sec 7.89E-05 5.10E-01Thallium g/sec < 6.65E-06 7.60E-02Facility CEMS --
Carbon Monoxide ppm 13.4 100(a) DRE data are reported for Condition 3; all other results are from Condition 2.C:\PROJECTS\ShellCA\Trial Burn Mgmt\Reporting\[TB Emissions Summary.xls]MACT Comparison
September 2006 J:\PROJECTS\05975_Shell\140\Trial Burn\Trial Burn Report\Shell Martinez TB Report R1_11_06.doc

1-3
Table 1-2 Trial Burn Emissions Compared to Future MACT Standards
FutureTest MACT
Emission Parameter Units Average (a) Limit (b)
Destruction and Removal EfficiencyMonochlorobenzene % 99.9638 > 99.99PCDDs/PCDFsToxic Equivalents (TEQs) ng/m³ 1.3E-05 0.40Particulate Matter and Halides --Particulate Matter gr/dscf 0.0046 0.035
Hydrogen Chloride & Chlorine ppm 0.83 31Metals --
Mercury µg/m³ 2.92 19Cadmium, Lead & Selenium µg/m³ 40.3 150Arsenic, Beryllium, Chromium,Antimony, Cobalt, Manganese & Nickel µg/m³ 4.59 370Facility CEMS --
Carbon Monoxide @ 7% O2 ppm 13.4 100
(a) DRE data are reported for Condition 3; all other results are from Condition 2.(b) Final MACT standards for liquid fuel-fired boilers were published in the Federal Register on October 12, 2005. See 70 FR 59402, Section 63.1217.Note: All emission data are corrected to 7% oxygen.C:\PROJECTS\ShellCA\Trial Burn Mgmt\Reporting\[TB Emissions Summary.xls]MACT Comparison
September 2006 J:\PROJECTS\05975_Shell\140\Trial Burn\Trial Burn Report\Shell Martinez TB Report R1_11_06.doc

2-1
2.0 Introduction
2.1 Project Background and Schedule Shell Oil Products operates three CO boilers that burn RCRA-designated hazardous waste at its refinery in Martinez, CA. These boilers are identified as COB-1, COB-2 and COB-3. Shell responded to Agency requests requiring the submission of an updated RCRA Part B Application, including a TBP. The Trial Burn test was conducted in accordance with the approved TBP, Revision 2, dated November 2005.
Trial burn testing was performed over the June 5-14, 2006 time period. A total of three operating conditions (triplicate runs per condition) were evaluated over the course of this program:
A low ESP power test (Condition 1) was completed on June 6;
A normal process operation test (Condition 2) was completed on June 7, 8 and 9; and
A low temperature test (Condition 3) was completed on June 13.
The overall trial burn schedule is depicted through detailed summaries of the various sampling train run times in Tables 2-1 and 2-2. Table 2-1 shows the run times associated with all sampling trains for the entire program. Table 2-2 provides the times for the “overall” run period defined as the duration from the start of the first sampling train to the end of the last sampling train. These overall run periods were used to generate the minimum, maximum and average values for the process data collected by Shell and to also provide an overall run average for the spiked organic constituent during Test Condition 3.
2.2 Project Scope and Test Requirements The trial burn test program had several objectives to fully meet all regulatory requirements. First, the testing was intended demonstrate the ability of the combustion system to meet the emission and performance standards called out in the facility’s permit. The primary objectives were to:
Conduct a Trial Burn as required by Section V.F.2 of the facility’s permit;
Demonstrate that the CO Boilers comply with the applicable emission standards and operating limits (performance standards) outlined in Section V.C.3 of the facility’s permit; and
Revise certain operating limits as presently outlined in Section V.C.3 of the facility’s permit.
A secondary objective of the trial burn was to develop data on stack emissions for use in updating the facility’s health risk assessment. In order to achieve all program objectives, the trial burn was conducted under three distinct operating conditions as described earlier. These test conditions are described in more detail in Section 3.1 of this report.
2.3 Report Organization This report is organized in a manner that should facilitate review of all results and supporting documentation. Section 1.0 summarized emission results for key parameters and Section 2.0 provides a brief narrative concerning the project background, schedule and scope. Section 3.0 provides detailed information on process operating conditions and facility monitoring data and summarizes expectations regarding future regulatory-imposed permit limitations based on test results. Section 4.0 presents an overall summary of the trial burn sampling methodologies employed while Section 5.0 presents detailed results for the trial burn test program. Finally, Section 6.0 outlines applicable QA/QC measures implemented during both the field and analytical
September 2006 J:\PROJECTS\05975_Shell\140\Trial Burn\Trial Burn Report\Shell Martinez TB Report R1_11_06.doc

2-2
portions of the program to ensure valid data. Appendices provide all pertinent supporting documentation including:
Facility process monitoring data (Appendix A);
The report on field sampling activities prepared by The Avogadro Group, LLC (Appendix B);
The POHC spiking report prepared by Triad Chemicals, LLC. (Appendix C);
Field sampling data sheets and related documentation provided by ENSR (Appendix D); and
Analytical data reports provided by each subcontractor laboratory (Appendix E).
September 2006 J:\PROJECTS\05975_Shell\140\Trial Burn\Trial Burn Report\Shell Martinez TB Report R1_11_06.doc

2-3
Table 2-1 Trial Burn Sample Train Run Times
Run # Date PMStart Stop
C1-R1 06-Jun-06 09:30 11:40C1-R2 06-Jun-06 12:45 14:57C1-R3 06-Jun-06 15:30 17:40Run # Date Aldehydes Run # Date PM / HCl / Cl2 / NH3
Start Stop Start StopC2-R1 07-Jun-06 10:00 13:40 C2-R1 07-Jun-06 10:00 13:40C2-R2 08-Jun-06 13:15 15:50 C2-R2 08-Jun-06 13:15 15:50C2-R3 09-Jun-06 13:10 15:35 C2-R3 09-Jun-06 13:10 15:35
Run # Date Metals Run # Date Hex. ChromiumStart Stop Start Stop
C2-R1 07-Jun-06 10:00 13:40 C2-R1 07-Jun-06 10:00 13:40C2-R2 08-Jun-06 13:15 15:50 C2-R2 08-Jun-06 13:15 15:50C2-R3 09-Jun-06 13:10 15:35 C2-R3 09-Jun-06 13:10 15:35
Run # Date PCDDs/PCDFs/PAHs Run # Date SVOCsStart Stop Start Stop
C2-R1 07-Jun-06 16:22 19:35 C2-R1 07-Jun-06 16:22 19:35C2-R2 08-Jun-06 08:00 11:10 C2-R2 08-Jun-06 08:00 11:10C2-R3 09-Jun-06 08:00 11:54 C2-R3 09-Jun-06 08:00 11:10
Run # Date VOST - Condition 2 Run # Date VOST - Condition 3Start Stop Start Stop
1A 07-Jun-06 16:50 17:10 1A 13-Jun-06 10:30 10:501B 07-Jun-06 17:30 17:50 1B 13-Jun-06 11:12 11:321C 07-Jun-06 18:00 18:20 1C 13-Jun-06 11:44 12:041D 07-Jun-06 18:28 18:48 1D 13-Jun-06 12:15 12:351E 07-Jun-06 18:58 19:182A 08-Jun-06 08:40 09:00 2A 13-Jun-06 12:55 13:152B 08-Jun-06 09:04 09:24 2B 13-Jun-06 13:28 13:482C 08-Jun-06 09:30 09:50 2C 13-Jun-06 14:02 14:222D 08-Jun-06 10:00 10:20 2D 13-Jun-06 14:39 14:593A 09-Jun-06 09:40 10:00 3A 13-Jun-06 15:16 15:363B 09-Jun-06 10:08 10:28 3B 13-Jun-06 15:50 16:103C 09-Jun-06 10:38 10:58 3C 13-Jun-06 16:23 16:433D 09-Jun-06 11:06 11:26 3D 13-Jun-06 16:55 17:15
C:\PROJECTS\ShellCA\Trial Burn Mgmt\Field\[TB Run Times.xls]COB-2
September 2006 J:\PROJECTS\05975_Shell\140\Trial Burn\Trial Burn Report\Shell Martinez TB Report R1_11_06.doc

2-4
Table 2-2 Overall Trial Burn Run Times Associated with Process Data Collection and MCB Spiking
Run # Date OverallStart Stop
C1-R1 06-Jun-06 09:30 11:40
C1-R2 06-Jun-06 12:45 14:57
C1-R3 06-Jun-06 15:30 17:40
Test Condition 2
Run # Date OverallStart Stop
C2-R1 07-Jun-06 10:00 13:40
16:22 19:35
C2-R2 08-Jun-06 08:00 11:10
13:15 15:50
C2-R3 09-Jun-06 08:00 11:54
13:10 15:35
Test Condition 3
Run # Date OverallStart Stop
C2-R1 13-Jun-06 10:30 12:35
C2-R2 13-Jun-06 12:55 14:59C2-R3 13-Jun-06 15:16 17:15
C:\PROJECTS\ShellCA\Trial Burn Mgmt\Field\[TB Run Times.xls]COB-2
September 2006 J:\PROJECTS\05975_Shell\140\Trial Burn\Trial Burn Report\Shell Martinez TB Report R1_11_06.doc

3-1
3.0 Process Operating Conditions and Compliance Strategy
3.1 Overview of Test Conditions The three operating test conditions evaluated during this program consisted of a low ESP power test (Condition 1); a normal operation test (Condition 2) and a low temperature test (Condition 3). The specific objectives for each of these conditions were:
Low ESP Power Mode (Test Condition 1) --
Establish the minimum power input to the electrostatic precipitator (ESP).
Conduct testing for particulate matter (PM) and total hydrocarbons (THC).
Normal Operations Mode (Test Condition 2) --
Not used to establish any new or revised operating limits.
Conduct a variety of testing to support the health risk assessment update. Testing performed for polychlorinated dibenzo-p-dioxins / polychlorinated dibenzofurans (PCDDs/PCDFs); polycyclic aromatic hydrocarbons (PAHs); carbonyl compounds (aldehydes); volatile and semivolatile organics (VOCs and SVOCs); metals; hexavalent chromium; PM; hydrogen chloride (HCl); chlorine (Cl2); ammonia (NH3) and THC.
Low Temperature Mode (Test Condition 3) --
Establish the minimum firebox temperature, maximum waste feed rate, minimum waste feed atomization pressure and maximum firebox pressure.
Spike MCB into the waste stream to demonstrate the system’s ability to meet the DRE requirements of 99.99%.
Conduct sampling for MCB and THC along with concurrent measurement of stack gas flow.
3.2 Facility Monitoring Data Throughout the trial burn, detailed process information was collected continuously by the facility’s process control computers and data acquisition system (DAS). Tables 3-1 through 3-3 provide summaries of process data including minimum, maximum and average values for key process variables recorded during each test condition.
Specific parameters reported in Tables 3-1 through 3-3 including the time basis for the measurement are outlined below. Supporting documentation including all one-minute averages (OMAs) throughout each trial burn run period is provided in Appendix A. In general, target operating conditions specified in the trial burn plan were achieved.
September 2006 J:\PROJECTS\05975_Shell\140\Trial Burn\Trial Burn Report\Shell Martinez TB Report R1_11_06.doc

3-2
Measurement Basis (a)
Parameter Tag ID # Units Instant. OMA HRA
Waste Feed Rate F2672AVG gpm X
Waste Feed Atomization Pressure 9PDI1565 9PDI1566
psig X
Firebox Temperature T3182AVG °F X
Firebox Pressure P1725AVG in. w.c. X
ESP Power 9EI2673 kVa X
Stack Gas Flowrate 9FI1596 in. w.c. X
Stack Gas Flowrate (calculated) scfm X
CO Concentration at 7% Oxygen A2642AVG ppm X
Oxygen Concentration 9AI2611 % X
3.3 Data-in-lieu-of Testing For this program, Shell conducted trial burn testing on one unit (COB-2) and is using data-in-lieu-of to establish limits on the other two units (COB-1 and COB-3).
3.4 Anticipated Permit Conditions On the basis of the trial burn testing completed on COB-2, Shell would expect permit limits to be established as delineated in Table 3-4, pending the outcome of the Condition 3 retest.
September 2006 J:\PROJECTS\05975_Shell\140\Trial Burn\Trial Burn Report\Shell Martinez TB Report R1_11_06.doc

3-3
Table 3-1 Process Operating Data Summary – Test Condition 1
C1-R1 C1-R2Date 06-Jun-06 06-Jun-06Start 09:30 12:45Stop 11:40 14:57
Operating Parameters (a) Units Min. Max. Avg. Min. Max. Avg.Process Parameters --Waste Feed Rate (HRA) gpm 6.99 7.01 7.00 5.99 7.01 6.54Waste Feed Atom. Press. (INST) psig 78.0 80.6 79.4 77.5 80.8 79.3Firebox Temperature (HRA) °F 1,711 1,718 1,715 1,713 1,719 1,716Firebox Pressure (HRA) in. w.c. 1.22 1.25 1.23 1.20 1.26 1.22ESP Power (INST) kVa 32.9 33.9 33.3 30.3 31.9 30.8Stack Gas Flowrate (INST) in. w.c. 0.489 0.920 0.701 0.468 0.857 0.706Stack Gas Flowrate (calculated) scfm 68,889 70,644 69,756 68,352 70,422 69,356CEM Parameters --CO Conc. @ 7% O2 (HRA) ppm 16.1 18.5 16.9 14.0 17.1 15.2O2 Concentration (OMA) % 3.14 3.63 3.31 3.18 3.56 3.38
C1-R3Date 06-Jun-06 RCRA Trial BurnStart 15:30 June 6, 2006Stop 17:40 Condition 1 Averages
Operating Parameters (a) Units Min. Max. Avg. MIN MAX AVGProcess Parameters --Waste Feed Rate (HRA) gpm 6.99 7.00 7.00 6.66 7.01 6.85Waste Feed Atom. Press. (INST) psig 77.9 80.7 79.3 77.8 80.7 79.3Firebox Temperature (HRA) °F 1,711 1,716 1,714 1,712 1,718 1,715Firebox Pressure (HRA) in. w.c. 1.20 1.25 1.23 1.21 1.25 1.23ESP Power (INST) kVa 30.4 30.8 30.6 31.2 32.2 31.6Stack Gas Flowrate (INST) in. w.c. 0.430 0.872 0.708 0.462 0.883 0.705Stack Gas Flowrate (calculated) scfm 67,016 69,485 68,352 68,086 70,184 69,155CEM Parameters --CO Conc. @ 7% O2 (HRA) ppm 11.7 15.8 12.9 13.9 17.1 15.0O2 Concentration (OMA) % 3.42 3.77 3.58 3.25 3.65 3.42 (a) HRA = Hourly Rolling Average INST = Instantaneous OMA = one-minute averageC:\PROJECTS\ShellCA\Trial Burn Mgmt\Reporting\[TB Ops Summary.xls]COND 1
September 2006 J:\PROJECTS\05975_Shell\140\Trial Burn\Trial Burn Report\Shell Martinez TB Report R1_11_06.doc

3-4
Table 3-2 Process Operating Data Summary – Test Condition 2
C2-R1 C2-R2Date 07-Jun-06 08-Jun-06Start 10:00 16:22 08:00 13:15Stop 13:40 19:35 11:10 15:50
Operating Parameters (a) Units Min. Max. Avg. Min. Max. Avg.Process Parameters --Waste Feed Rate (HRA) gpm 8.35 9.09 8.63 8.92 9.06 8.99Waste Feed Atom. Press. (INST) psig 78.0 81.1 79.3 77.8 81.1 79.3Firebox Temperature (HRA) °F 1,712 1,718 1,715 1,712 1,720 1,716Firebox Pressure (HRA) in. w.c. 1.17 1.29 1.23 1.30 1.49 1.41ESP Power (INST) kVa 121.7 181.6 164.0 90.2 143.7 114.5Stack Gas Flowrate (INST) in. w.c. 0.472 0.958 0.746 0.322 0.901 0.652Stack Gas Flowrate (calculated) scfm 67,688 70,487 68,970 56,389 71,272 68,784CEM Parameters --CO Conc. @ 7% O2 (HRA) ppm 9.97 16.3 13.6 11.7 14.4 12.6O2 Concentration (OMA) % 3.30 4.06 3.71 3.48 3.96 3.72
C2-R3Date 09-Jun-06 RCRA Trial BurnStart 08:00 13:10 June 7 - 9, 2006Stop 11:54 15:35 Condition 2 Averages
Operating Parameters (a) Units Min. Max. Avg. MIN MAX AVGProcess Parameters --Waste Feed Rate (HRA) gpm 8.69 9.00 8.85 8.65 9.05 8.82Waste Feed Atom. Press. (INST) psig 77.0 80.9 79.0 77.6 81.0 79.2Firebox Temperature (HRA) °F 1,711 1,729 1,718 1,712 1,722 1,716Firebox Pressure (HRA) in. w.c. 1.29 1.48 1.41 1.25 1.42 1.35ESP Power (INST) kVa 95.5 185.8 132.4 102.5 170.4 137.0Stack Gas Flowrate (INST) in. w.c. 0.193 1.043 0.685 0.329 0.967 0.694Stack Gas Flowrate (calculated) scfm 54,208 72,973 68,799 59,428 71,577 68,851CEM Parameters --CO Conc. @ 7% O2 (HRA) ppm 11.0 17.7 14.0 10.9 16.1 13.4O2 Concentration (OMA) % 3.42 4.02 3.68 3.40 4.01 3.70 (a) HRA = Hourly Rolling Average INST = Instantaneous OMA = one-minute averageC:\PROJECTS\ShellCA\Trial Burn Mgmt\Reporting\[TB Ops Summary.xls]COND 1
September 2006 J:\PROJECTS\05975_Shell\140\Trial Burn\Trial Burn Report\Shell Martinez TB Report R1_11_06.doc

3-5
Table 3-3 Process Operating Data Summary – Test Condition 3
C3-R1 C3-R2Date 13-Jun-06 13-Jun-06Start 10:30 12:55Stop 12:35 14:59
Operating Parameters (a) Units Min. Max. Avg. Min. Max. Avg.Process Parameters --Waste Feed Rate (HRA) gpm 8.88 9.68 9.28 8.98 10.6 9.74Waste Feed Atom. Press. (INST) psig 77.1 81.4 79.0 42.3 81.3 59.8Firebox Temperature (HRA) °F 1,604 1,614 1,608 1,609 1,625 1,618Firebox Pressure (HRA) in. w.c. 5.83 5.95 5.87 5.88 6.08 5.99ESP Power (INST) kVa 78.0 148.3 100.6 77.1 116.4 103.8Stack Gas Flowrate (INST) in. w.c. 1.151 1.984 1.551 1.143 1.940 1.566Stack Gas Flowrate (calculated) scfm 87,490 92,338 90,744 88,370 93,191 91,025CEM Parameters --CO Conc. @ 7% O2 (HRA) ppm 7.67 13.9 11.1 7.38 16.0 12.8O2 Concentration (OMA) % 5.19 5.82 5.53 5.18 5.96 5.56
C3-R3Date 13-Jun-06 RCRA Trial BurnStart 15:16 June 13, 2006Stop 17:15 Condition 3 Averages
Operating Parameters (a) Units Min. Max. Avg. MIN MAX AVGProcess Parameters --Waste Feed Rate (HRA) gpm 10.7 11.0 10.9 9.52 10.41 9.97Waste Feed Atom. Press. (INST) psig 42.0 45.1 42.7 53.8 69.3 60.5Firebox Temperature (HRA) °F 1,612 1,623 1,616 1,608 1,621 1,614Firebox Pressure (HRA) in. w.c. 5.83 5.97 5.92 5.85 6.00 5.93ESP Power (INST) kVa 88.1 121.4 106.4 81.1 128.7 103.6Stack Gas Flowrate (INST) in. w.c. 1.148 2.113 1.601 1.147 2.012 1.573Stack Gas Flowrate (calculated) scfm 89,214 93,297 91,347 88,358 92,942 91,039CEM Parameters --CO Conc. @ 7% O2 (HRA) ppm 6.89 8.37 7.45 7.31 12.8 10.5O2 Concentration (OMA) % 5.26 5.61 5.45 5.21 5.80 5.51 (a) HRA = Hourly Rolling Average INST = Instantaneous OMA = one-minute averageC:\PROJECTS\ShellCA\Trial Burn Mgmt\Reporting\[TB Ops Summary.xls]COND 1
September 2006 J:\PROJECTS\05975_Shell\140\Trial Burn\Trial Burn Report\Shell Martinez TB Report R1_11_06.doc

3-6
Table 3-4 Anticipated Permit Conditions
Meas. Value ExpectedProcess Parameter Units Basis (a) From? (b) Limit
Maximum Waste Feed Rate to each CO Boiler (DNF Solids + Biosolids) gpm HRA C3 10.55Maximum Total DNF Solids (RCRA Waste) to all 3 CO Boilers ton/yr HRA Current Limit 28,000Maximum Total Waste Feed Rate to all 3 CO Boilers (DNF Solids + Biosolids) gpm HRA C3 31.65Minimum Waste Feed Atomization Pressure (c) psig INST C3 53.8
Minimum Firebox Temperature °F HRA C3 1,608
Maximum Firebox Pressure in. w.c. HRA C3 6.0
Minimum ESP Power kVa INST C1 31.2
Maximum Stack Gas Flowrate scfm INST Prior Trial Burn 154,400CO Conc. @ 7% O2 ppm HRA Regulation 100 (a) HRA = Hourly Rolling Average INST = Instantaneous OMA = one-minute average
(b) C1 = Test Condition 1; C3 = Test Condition 3
(c) Defined as the differential fluid pressure between atomizing fluid and waste feed.
Note 1: The waste feed rate includes the contribution from the MCB added (0.14 gpm)
Note 2: Limits based on Condition 3 will be re-established pending a successful retest.C:\PROJECTS\ShellCA\Trial Burn Mgmt\Reporting\[TB Ops Summary.xls]EXPECTED LIMITS
September 2006 J:\PROJECTS\05975_Shell\140\Trial Burn\Trial Burn Report\Shell Martinez TB Report R1_11_06.doc

4-1
4.0 Sampling and Analytical Program Overview
This section provides a brief overview of the methods and procedures followed for the field test program. A complete and more detailed summary of the sampling and analytical methodologies employed can be found in Sections 5.4 and 5.6 of the approved Trial Burn Plan.
The trial burn was conducted in June 2006 and was implemented by a diverse team of experienced project managers and technical specialists from Shell Martinez, ENSR and several Shell / ENSR subcontractors. Key project participants and associated responsibilities were as follows:
Steven Overman – Overall Shell trial burn coordinator
Fred Ferrante – Shell coordinator for control room operations and waste feed sampling
Oahn Ma – Shell coordinator for process data generation
Mike Dudasko – ENSR program manger
Doug Roeck – ENSR field test coordinator and task manager for trial burn plan development and final data reporting
Shawn Nelezen – Field sampling test team leader for the Avogadro Group, LLC
Marty Friedman – POHC spiking team leader for Triad Chemicals, LLC (Condition 3).
4.1 Waste Feed Stream Throughout the test program, samples of the liquid waste feed stream were collected periodically and composited over the course of each run. Samples were collected in 40-mL, 500-mL and 950-mL sample bottles and a field data sheet was completed denoting the times that these samples were taken. The waste feed samples collected were submitted to STL-Knoxville for physical parameters (ash, total chlorides, density, moisture and heat content) and STL-Sacramento for metals and organics analyses. Analytical methods followed included ASTM D 482-00a (ash), EPA Method 9056 (KNOX WC-0016) (total chlorides), ASTM D 1963-85 (density), ASTM D 240-02 (heat content), ASTM D 1744 (Karl Fischer) (moisture), EPA Method 6020 (all metals except mercury) and EPA Method 7470A (mercury). Additional samples were submitted to STL-Sacramento for volatile and semivolatile organics analysis. EPA Methods 8260B and 8270C were employed for these organic analyses.
4.2 Spiking Material The MCB material provided by Triad was not sampled during the program as it was a pure grade product. The supplier of the MCB provided a certificate of analysis as to the product purity which was 99.9986%. The feed rates reported by Triad accounted for this product purity. The target feed rate for the MCB (during Condition 3) was 75.0 lb/hr and this level was achieved with excellent accuracy throughout the test. The full report submitted by Triad can be found in Appendix C.
4.3 Stack Gas The following sections provide brief overviews of the sampling methodologies employed for all target parameters. Except where noted otherwise, all methods are from SW-846, 3rd edition, final (promulgated) Update III. All samples were collected from the single stack sampling platform available on COB-2.
September 2006 J:\PROJECTS\05975_Shell\140\Trial Burn\Trial Burn Report\Shell Martinez TB Report R1_11_06.doc
4-2
4.3.1 Carbon Dioxide, Carbon Monoxide, Oxygen and Total Hydrocarbons During all sampling runs, Avogadro continuously collected samples of stack gas for oxygen (O2), carbon dioxide (CO2) and total hydrocarbons (THC) determination. The O2 and CO2 data were used in the calculation of stack gas molecular weight. EPA Reference Method 3A (40 CFR Part 60, Appendix A) was used for the analytical procedure (continuous emission monitor). EPA Reference Method 25A was used for the THC determination. In addition, Shell continuously measured data for CO corrected to 7% oxygen during all runs with the facility’s permanently installed CEMS.
4.3.2 Particulate Matter Sampling for PM only was performed in accordance with EPA Reference Method 5. The method was followed as written without modification and was performed during Condition 1 only. Run times were 120 minutes in duration and involved isokinetic sampling at 24 sampling points (12 points per traverse). PM samples (including one field blank) were submitted to Avogadro’s analytical laboratory in Martinez, CA for gravimetric analysis.
4.3.3 Particulate Matter, Hydrogen Chloride, Chlorine and Ammonia Sampling for PM, HCl, Cl2 and NH3 was performed in accordance with EPA Method 0050. The method was followed as written without modification and was performed during Condition 2 only. Run times were 120 minutes in duration and involved isokinetic sampling at 24 sampling points (12 points per traverse). PM samples (including one field blank) were submitted to Avogadro’s analytical laboratory in Martinez, CA for gravimetric analysis. Impinger solution samples (including one field blank) for HCl, Cl2 and NH3 determination were submitted to STL-Sacramento for analysis by ion chromatography (EPA Methods 9057 and 350.1).
4.3.4 Carbonyl Compounds A Method 0011 sampling train was used to sample for target carbonyl compounds (acetaldehyde, crotonaldehyde, formaldehyde and propionaldehyde) during Condition 2 only. Run times were 120 minutes in duration and involved isokinetic sampling at 24 sampling points (12 points per traverse). This method uses 2,4-Dinitrophenylhydrazine (DNPH) reagent as the absorbent medium in the sampling train. The DNPH reagent was prepared by the laboratory within 5 days of use in the field and when a container of the DNPH was opened in the field, it was used within 48 hrs. The reagent was prepared by Enthalpy Analytical, Inc. of Durham, NC who also performed sample analyses. Each sampling train was prepared and analyzed according to EPA Method 8315A. This method entails high performance liquid chromatography (HPLC) with ultraviolet/visible detection. Procedure 1 of Method 8315A is followed for stack gas samples collected by this method.
4.3.5 Metals EPA Method 29 was followed as written without modification and was performed during Condition 2 only. This sampling train was utilized for the collection of all target metals including aluminum, antimony, arsenic, barium, beryllium, cadmium, total chromium, cobalt, copper, lead, manganese, mercury, nickel, selenium, silver, thallium, vanadium and zinc. Run times were 120 minutes in duration and involved isokinetic sampling at 24 sampling points (12 points per traverse). Program samples (including one reagent blank) were submitted to STL-Sacramento for analysis by Inductively Coupled Argon Plasma Mass Spectroscopy (ICP-MS) as described in EPA Method 6020 (all metals except mercury). Mercury analysis was performed by cold vapor atomic absorption spectrometry (CVAAS) following EPA Method 7470A.
September 2006 J:\PROJECTS\05975_Shell\140\Trial Burn\Trial Burn Report\Shell Martinez TB Report R1_11_06.doc

4-3
4.3.6 Hexavalent Chromium EPA Method 0061 was followed as written without modification and was performed during Condition 2 only. This sampling train was utilized for the determination of hexavalent chromium. Run times were 120 minutes in duration and involved isokinetic sampling at 24 sampling points (12 points per traverse). Program samples (including one field blank) were submitted to STL-Knoxville for analysis by EPA Method 7199, which involves ion chromatography coupled with a post-column reactor (IC/PCR).
4.3.7 PCDDs/PCDFs and PAHs A combined Method 0023A/0010 sampling train was used to sample for PCDDs/PCDFs and PAHs during Condition 2 only. PCDDs/PCDFs were collected following the procedures outlined in EPA Method 0023A. Target PAHs were collected following the procedures outlined in EPA Method 0010. Run times were 180 minutes in duration and involved isokinetic sampling at 24 sampling points (12 points per traverse). The sampling methodology for collection of PAHs also incorporates the collection of the XAD trap condensate for subsequent analysis. Sample train rinse solvents used were those specified in Method 0023A (acetone, methylene chloride and toluene). Program samples (including one field blank) were submitted to Alta Analytical Laboratories in El Dorado Hills, CA for analysis of all target parameters. Analysis for PCDD/PCDF congeners followed EPA Method 8290 which incorporates high resolution gas chromatography and high resolution mass spectrometry (HRGC/HRMS). Analysis for carcinogenic and non-carcinogenic PAHs followed CARB Method 429, which also incorporates HRGC/HRMS techniques.
4.3.8 Target Semivolatile Organics An EPA Method 0010 sampling train was used to sample for 49 target SVOCs during Condition 2 only. The method was followed as written without modification. Additional SVOC emission data were obtained through an assessment of TICs using mass spectral library searching and identification of up to 15 additional compounds. Run times were 180 minutes in duration and involved isokinetic sampling at 24 sampling points (12 points per traverse). Sample train fractions were submitted to STL-Sacramento for analysis by EPA Method 8270C. This procedure also featured the reporting of data for individual sample train fractions as per the extraction procedure outlined by EPA Method 3542.
4.3.9 Target Volatile Organics and POHC DRE EPA Method 0030 was followed as written without modification during Condition 2 only to determine stack gas concentrations of 64 target volatile organics. Additional VOC emission data were obtained through an assessment of tentatively identified compounds (TICs) using mass spectral library searching and identification of up to 15 additional compounds. During Condition 3, the VOST methodology was used to determine emission levels of MCB only for assessment of POHC DRE. During each run, four (4) pairs of VOST tubes were collected, each at a sampling rate of 1.0 liter per minute (Lpm) over a 20-minute period, resulting in a sample volume of approximately 20 liters per pair. Three of the four pairs from each run (a, b and d) were designated for analysis. The first set of VOST tubes from each run (pair “a”) was intended to be analyzed individually to provide an assessment of compound breakthrough. A single condensate sample representative of each four run set was also collected. Samples were submitted to STL-Knoxville for analysis by EPA Methods 5041A (VOST tubes) and 8260B (condensate). VOST blanks collected included field blanks, trip blanks and condensate blanks.
September 2006 J:\PROJECTS\05975_Shell\140\Trial Burn\Trial Burn Report\Shell Martinez TB Report R1_11_06.doc

5-1
5.0 Trial Burn Test Results
This section presents all sampling and analytical results for the trial burn associated with COB-2. All data presented are judged to be completely acceptable based on a thorough data review and comparison with documented QA protocols. All pertinent QA/QC data and related discussions are presented subsequently in Section 6.0. The field sampling report prepared by The Avogadro Group, LLC is provided in Appendix B. Additional field data sheets and other related field documentation coordinated by ENSR are found in Appendix D. Analytical data reports provided by each of the subcontractor laboratories for all field sample analyses are located in Appendix E.
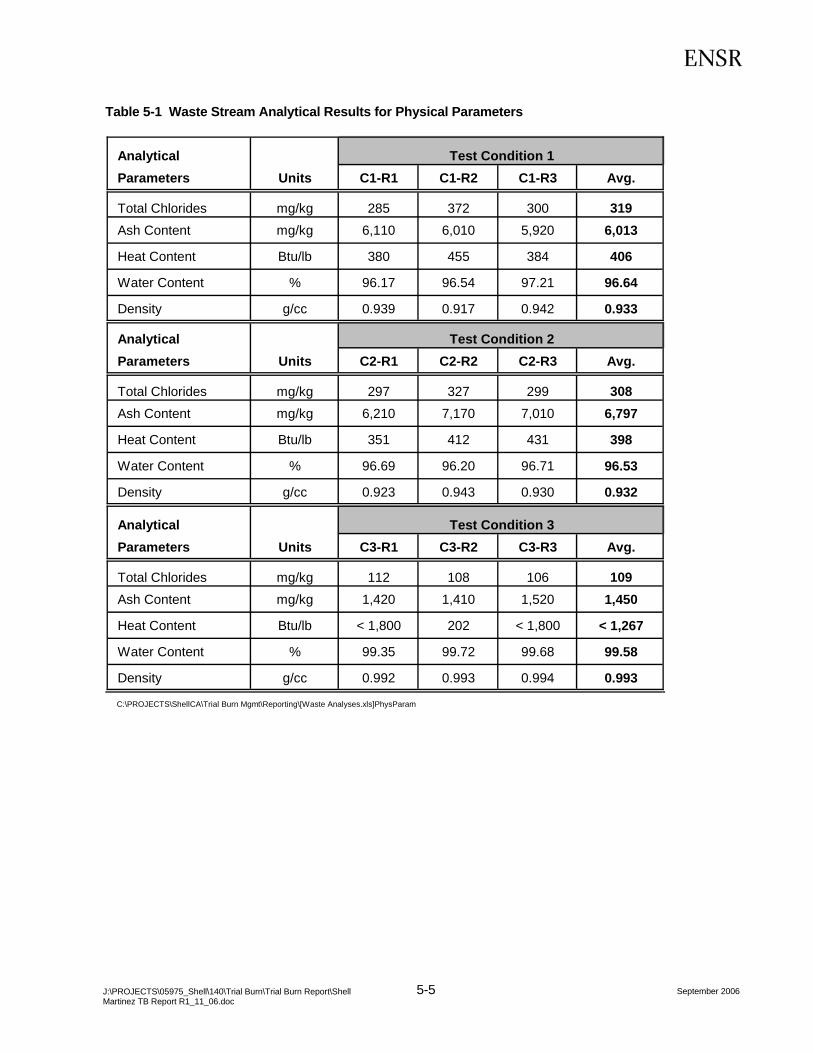
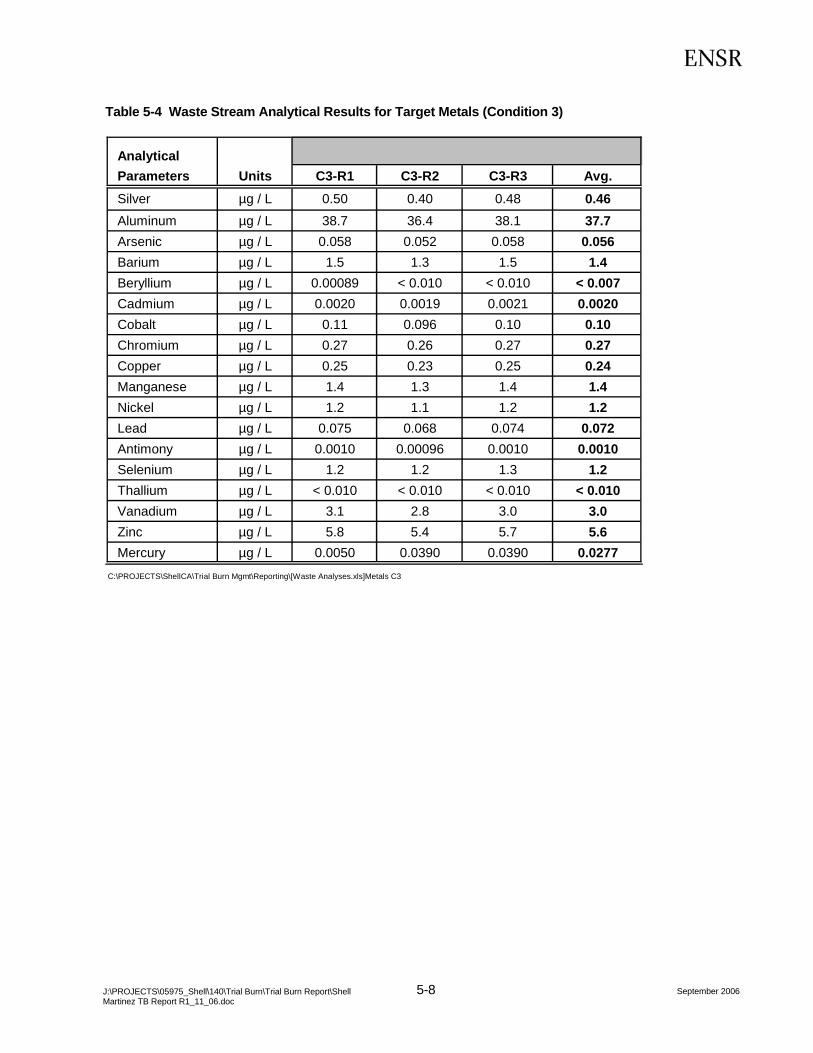
5.1 Waste Feed Stream The waste feed material fed to the combustor during each test condition was analyzed for physical parameters, volatile and semivolatile organics and metals. Analysis for all parameters was performed during all test runs. Results are presented in Tables 5-1 through 5-4. The waste material is shown to have a very high water content (> 95%); low or non-detectable levels of ash and chlorine; and low or non-detectable levels of most metals. The waste was analyzed for 49 target SVOCs and 64 target VOCs. No SVOCs and only 5 VOCs were present at a level higher than the compound-specific reporting limit (RL). Data pertaining to these organic analyses can be found in Appendix E.
5.2 Spiking Material The spiking of MCB during Condition 3 was accomplished without incident and at rates at or near the target level of 75.0 lb/hr. The full report prepared by Triad Chemicals, LLC is presented in Appendix C.
5.3 Stack Gas Measurements – Condition 1
5.3.1 Oxygen, Carbon Dioxide and Total Hydrocarbons Continuous measurement of fixed gases (O2 and CO2) and THC was performed throughout test condition 1. Results are summarized below:
Run No. O2 CO2 THC
C1-R1 3.42 13.98 0.37
C1-R2 3.32 14.10 0.67
C1-R3 3.53 13.80 0.00
5.3.2 Particulate Matter The main goal of test condition 1 was to determine the magnitude of stack gas particulate emissions while the ESP was operated at low power input (~ 30 kVa). Emission results for PM are provided in Table 5-5. The data show that COB-2 fully complied with the performance standard of 0.08 gr/dscf corrected to 7% oxygen. Test results averaged 0.0114 gr/dscf corrected to 7% oxygen for the three runs performed.
September 2006 J:\PROJECTS\05975_Shell\140\Trial Burn\Trial Burn Report\Shell Martinez TB Report R1_11_06.doc

5-2
5.4 Stack Gas Measurements – Condition 2
5.4.1 Oxygen, Carbon Dioxide and Total Hydrocarbons Continuous measurement of fixed gases (O2 and CO2) and THC was performed throughout test condition 2. Results are summarized below:
Run No. O2 CO2 THC
C2-R1 (AM) 4.32 13.23 0.06
C2-R1 (PM) 3.79 13.66 0.00
C2-R2 (AM) 3.74 13.64 0.35
C2-R2 (PM) 3.72 13.73 0.00
C2-R3 (AM) 2.59 11.09 0.37
C2-R3 (PM) 3.59 13.45 0.06
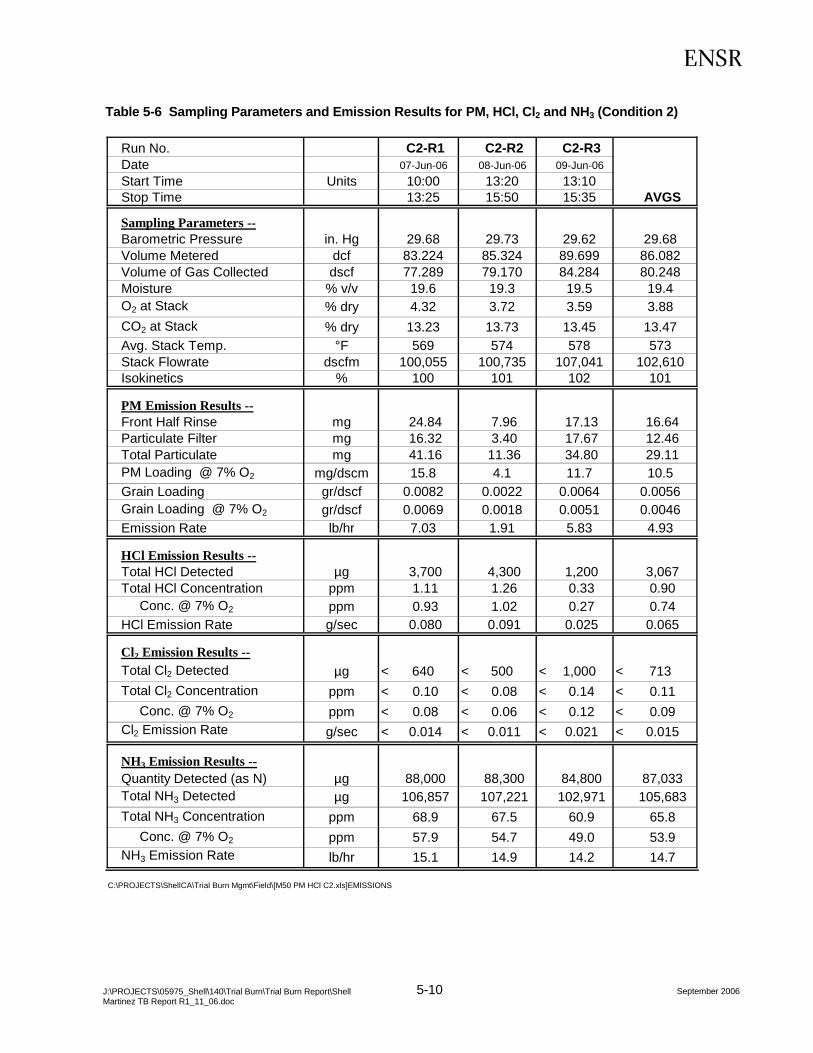
5.4.2 Particulate Matter Gravimetric analyses for particulate matter on the front-half rinse and filter fractions from the Method 0050 sampling train was performed by Avogadro with results blank-corrected for acetone contamination to the maximum extent allowed by EPA Method 5. Results are presented in Table 5-6. Test results averaged 0.0046 and were well below the current permit limit (0.08 gr/dscf corrected to 7% oxygen) as well as the future MACT limit (0.035 gr/dscf corrected to 7% oxygen).
5.4.3 Hydrogen Chloride, Chlorine and Ammonia Appropriate back-half fractions from the Method 0050 sampling train were analyzed for HCl, Cl2 and NH3 at STL-Sacramento. These results are also found in Table 5-6. Emission concentrations for HCl and Cl2 easily comply with current permit limits as well as the future MACT standard for liquid fuel-fired boilers (31 ppm).
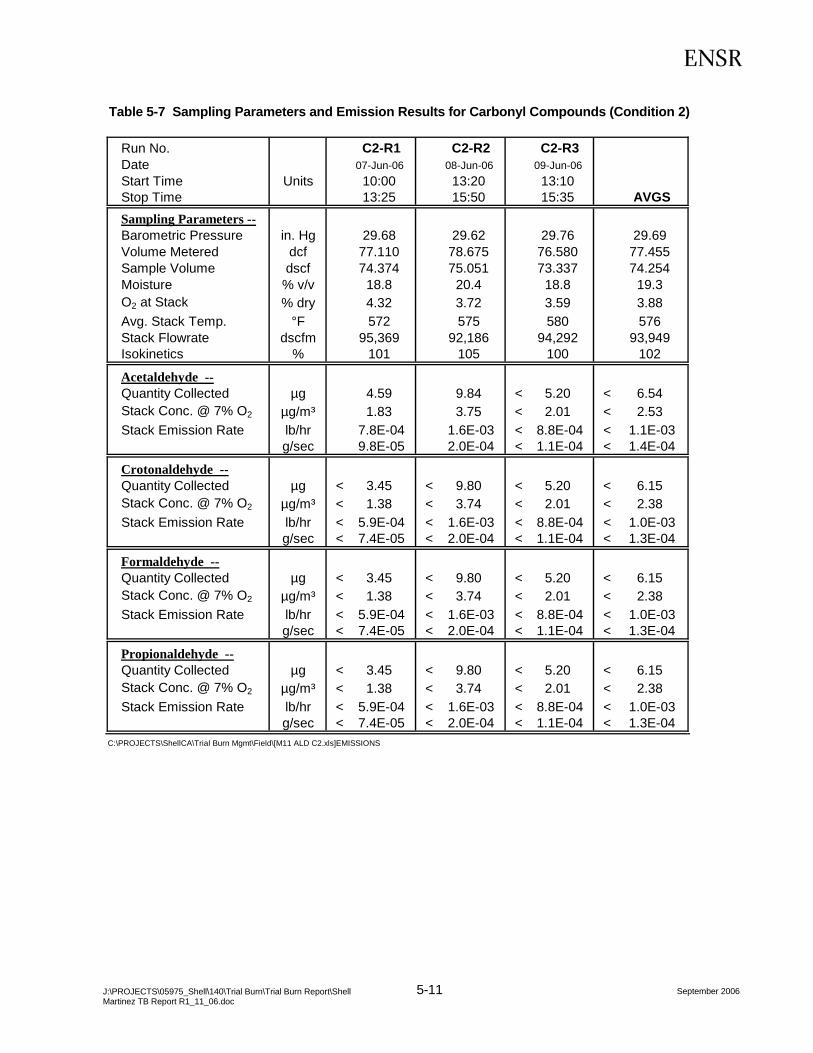
5.4.4 Carbonyl Compounds The emission rate of four target aldehyde compounds was evaluated using EPA Method 0011. A summary of key sampling parameters and calculated emission rates is shown in Table 5-7. Except for acetaldehyde during C2-R1 and C2-R2, no compounds were observed above the method-specific RL.
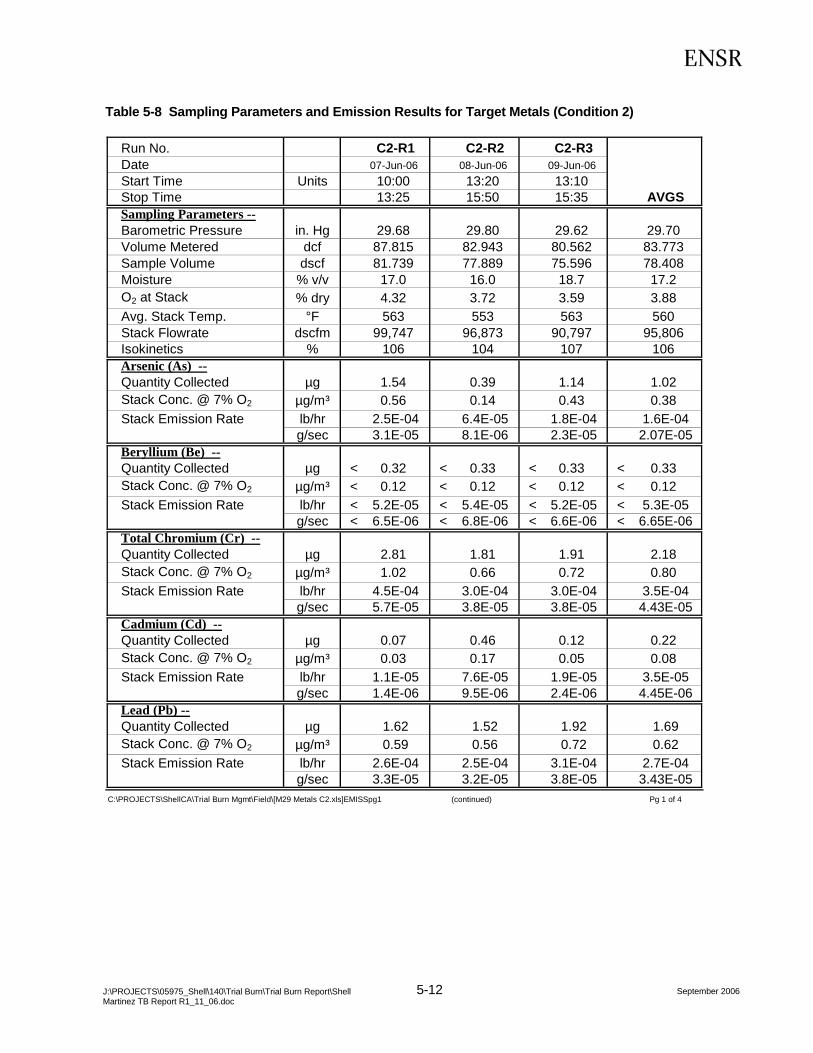
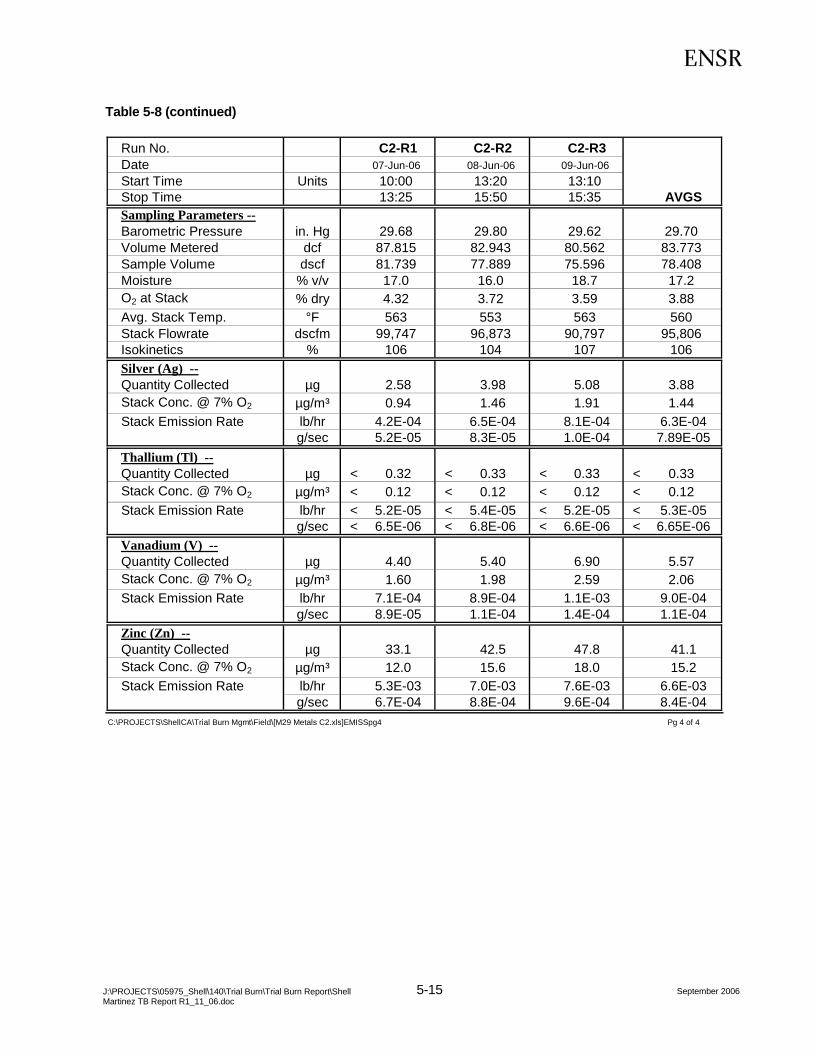
5.4.5 Metals Results for all target metals from the EPA Method 29 sampling train were reported by STL-Sacramento. In addition, ENSR performed blank-correction on all the data for field blank reagent contamination to the maximum extent allowed by the method. Results are given in Table 5-8. These results demonstrate full compliance with current permit limits. In addition, emission concentrations for low volatile metals (arsenic, beryllium and chromium), semivolatile metals (cadmium and lead) and mercury easily comply with the future MACT standards for liquid fuel-fired boilers (370, 150 and 19 µg/dscm, respectively).
September 2006 J:\PROJECTS\05975_Shell\140\Trial Burn\Trial Burn Report\Shell Martinez TB Report R1_11_06.doc

5-3
5.4.6 Hexavalent Chromium Analyses for hexavalent chromium from the EPA Method 0061 sampling train were reported by STL-Knoxville. Results are provided in Table 5-9. No emission standard currently applies to this parameter.
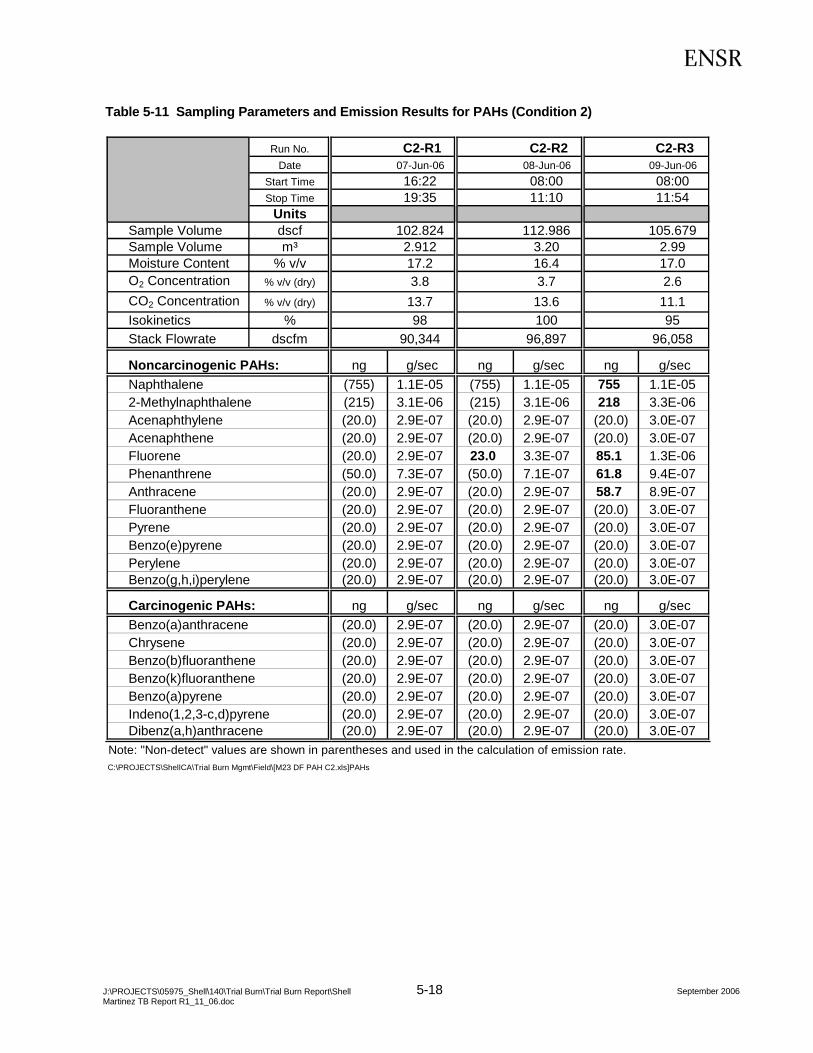
5.4.7 PCDDs/PCDFs and PAHs Samples from the Method 0023A sampling train were analyzed by Alta Analytical for all target analytes and reported as combined front-half and back-half results. PCDD/PCDF analyses followed the protocols outlined in EPA Methods 0023A and 8290, which incorporate HRGC/HRMS techniques. PAH analyses followed the procedures outlined in CARB Method 429, which also employs HRGC/HRMS. Results for PCDDs/PCDFs are shown in Table 5-10 and results for PAHs are provided in Table 5-11.
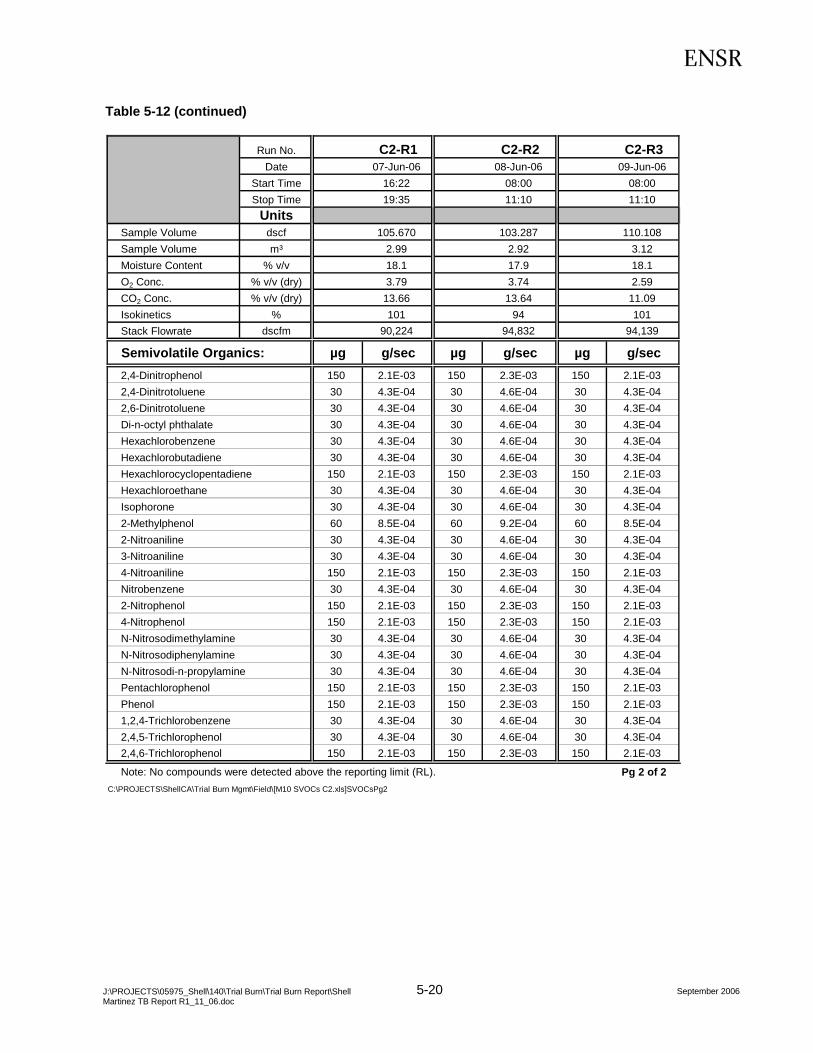
5.4.8 Target Semivolatile Organics SVOCs were reported by STL-Sacramento from the EPA Method 0010 sampling train. Emission results are presented in Table 5-12. Most SVOCs were reported as “non-detect” and thus emission rates have been calculated at the reported detection limit. TIC results (which vary from run to run) are included with the analytical data reports located in Appendix E. Bearing in mind that certain compounds can be detected even though the value is below the typical RL, the following table summarizes the number of “hits” out of the total of 49 specific target compounds:
Run No. Total Compounds
Detected
Total Compounds Detected Above the
RL
C2-R1 1 0
C2-R2 1 0
C2-R3 3 1
5.4.9 Target Volatile Organics The emission rates for target volatile organics were evaluated via Method 0030, the volatile organic sampling train (VOST). A summary of sampling parameters for all VOST runs is shown in Table 5-13. VOST runs were completed during the same overall period as the Method 0010 and 0023A isokinetic sampling trains and therefore stack flow rates used in conjunction with the VOST emission calculations represent the average flow rates determined with these sampling trains. Emission results are shown in Table 5-14. Most compounds were reported as “non-detect” and thus emission rates have been calculated at the reported detection limit. TIC results (which vary from run to run) are included with the analytical data reports located in Appendix E.
Bearing in mind that certain compounds can be detected even though the value is below the typical RL, the following table summarizes the number of “hits” out of the total of 64 specific target compounds:
September 2006 J:\PROJECTS\05975_Shell\140\Trial Burn\Trial Burn Report\Shell Martinez TB Report R1_11_06.doc

5-4
Run No. Total Compounds
Detected
Total Compounds Detected Above the
RL
C2-R1 10 3
C2-R2 11 4
C2-R3 6 2
5.5 Stack Gas Measurements – Condition 3
5.5.1 Oxygen, Carbon Dioxide and Total Hydrocarbons Continuous measurement of fixed gases (O2 and CO2) and THC was performed throughout test condition 3. Results are summarized below:
Run No. O2 CO2 THC
C3-R1 5.52 11.99 0.21
C3-R2 5.37 11.98 0.04
C3-R3 5.24 12.13 0.05
5.5.2 POHC DRE The VOST methodology was also used during Condition 3 to determine the emission rate for MCB to allow calculation of the DRE for this compound. A summary of sampling parameters for all VOST runs is shown in Table 5-15. EPA Method 2 and Method 4 runs were also conducted concurrently with the VOST runs to allow determination of stack gas flowrate. Emission results and DRE calculations are shown in Table 5-16.
Unfortunately, C3-R1 was the only run that achieved an acceptable DRE. Retesting will be performed at a future time and an addendum to this report will be provided.
September 2006 J:\PROJECTS\05975_Shell\140\Trial Burn\Trial Burn Report\Shell Martinez TB Report R1_11_06.doc
5-5
Table 5-1 Waste Stream Analytical Results for Physical Parameters
Analytical Test Condition 1Parameters Units C1-R1 C1-R2 C1-R3 Avg.
Total Chlorides mg/kg 285 372 300 319Ash Content mg/kg 6,110 6,010 5,920 6,013
Heat Content Btu/lb 380 455 384 406
Water Content % 96.17 96.54 97.21 96.64
Density g/cc 0.939 0.917 0.942 0.933
Analytical Test Condition 2Parameters Units C2-R1 C2-R2 C2-R3 Avg.
Total Chlorides mg/kg 297 327 299 308Ash Content mg/kg 6,210 7,170 7,010 6,797
Heat Content Btu/lb 351 412 431 398
Water Content % 96.69 96.20 96.71 96.53
Density g/cc 0.923 0.943 0.930 0.932
Analytical Test Condition 3Parameters Units C3-R1 C3-R2 C3-R3 Avg.
Total Chlorides mg/kg 112 108 106 109Ash Content mg/kg 1,420 1,410 1,520 1,450
Heat Content Btu/lb < 1,800 202 < 1,800 < 1,267
Water Content % 99.35 99.72 99.68 99.58
Density g/cc 0.992 0.993 0.994 0.993
C:\PROJECTS\ShellCA\Trial Burn Mgmt\Reporting\[Waste Analyses.xls]PhysParam
September 2006 J:\PROJECTS\05975_Shell\140\Trial Burn\Trial Burn Report\Shell Martinez TB Report R1_11_06.doc

5-6
Table 5-2 Waste Stream Analytical Results for Target Metals (Condition 1)
AnalyticalParameters Units C1-R1 C1-R2 C1-R3 Avg.Silver µg / L 0.59 0.45 0.62 0.55Aluminum µg / L 120 91 103 105Arsenic µg / L 0.24 0.20 0.22 0.22Barium µg / L 6.0 4.8 5.5 5.4Beryllium µg / L 0.0032 0.0025 0.0030 0.0029Cadmium µg / L 0.0067 0.0054 0.0059 0.0060Cobalt µg / L 0.33 0.26 0.29 0.29Chromium µg / L 1.2 0.89 1.1 1.1Copper µg / L 0.81 0.64 0.73 0.73Manganese µg / L 4.4 3.4 4.0 3.9Nickel µg / L 3.9 3.0 3.5 3.5Lead µg / L 0.26 0.20 0.23 0.23Antimony µg / L 0.0028 0.0030 0.0031 0.0030Selenium µg / L 5.4 4.1 4.9 4.8Thallium µg / L < 0.010 < 0.010 < 0.010 < 0.010Vanadium µg / L 9.6 7.3 8.1 8.3Zinc µg / L 18.8 14.6 16.3 16.6Mercury µg / L 0.13 0.19 0.34 0.22
C:\PROJECTS\ShellCA\Trial Burn Mgmt\Reporting\[Waste Analyses.xls]Metals C1
September 2006 J:\PROJECTS\05975_Shell\140\Trial Burn\Trial Burn Report\Shell Martinez TB Report R1_11_06.doc

5-7
Table 5-3 Waste Stream Analytical Results for Target Metals (Condition 2)
AnalyticalParameters Units C2-R1 C2-R2 C2-R3 Avg.Silver µg / L 0.53 0.35 0.39 0.42Aluminum µg / L 110 154 157 140Arsenic µg / L 0.22 0.25 0.26 0.24Barium µg / L 5.1 6.0 5.6 5.6Beryllium µg / L 0.0027 0.0036 0.0031 0.0031Cadmium µg / L 0.0060 0.0080 0.0080 0.0073Cobalt µg / L 0.31 0.42 0.44 0.39Chromium µg / L 0.98 1.10 1.10 1.06Copper µg / L 0.76 1.0 1.0 0.92Manganese µg / L 4.1 5.5 5.5 5.0Nickel µg / L 3.6 5.0 5.0 4.5Lead µg / L 0.24 0.30 0.31 0.28Antimony µg / L 0.0024 0.0025 0.0021 0.0023Selenium µg / L 4.6 5.5 5.5 5.2Thallium µg / L < 0.010 < 0.010 < 0.010 < 0.010Vanadium µg / L 8.7 12.4 13.0 11.4Zinc µg / L 17.6 24.1 24.8 22.2Mercury µg / L 0.27 0.28 0.31 0.29
C:\PROJECTS\ShellCA\Trial Burn Mgmt\Reporting\[Waste Analyses.xls]Metals C12
September 2006 J:\PROJECTS\05975_Shell\140\Trial Burn\Trial Burn Report\Shell Martinez TB Report R1_11_06.doc
5-8
Table 5-4 Waste Stream Analytical Results for Target Metals (Condition 3)
AnalyticalParameters Units C3-R1 C3-R2 C3-R3 Avg.Silver µg / L 0.50 0.40 0.48 0.46Aluminum µg / L 38.7 36.4 38.1 37.7Arsenic µg / L 0.058 0.052 0.058 0.056Barium µg / L 1.5 1.3 1.5 1.4Beryllium µg / L 0.00089 < 0.010 < 0.010 < 0.007Cadmium µg / L 0.0020 0.0019 0.0021 0.0020Cobalt µg / L 0.11 0.096 0.10 0.10Chromium µg / L 0.27 0.26 0.27 0.27Copper µg / L 0.25 0.23 0.25 0.24Manganese µg / L 1.4 1.3 1.4 1.4Nickel µg / L 1.2 1.1 1.2 1.2Lead µg / L 0.075 0.068 0.074 0.072Antimony µg / L 0.0010 0.00096 0.0010 0.0010Selenium µg / L 1.2 1.2 1.3 1.2Thallium µg / L < 0.010 < 0.010 < 0.010 < 0.010Vanadium µg / L 3.1 2.8 3.0 3.0Zinc µg / L 5.8 5.4 5.7 5.6Mercury µg / L 0.0050 0.0390 0.0390 0.0277
C:\PROJECTS\ShellCA\Trial Burn Mgmt\Reporting\[Waste Analyses.xls]Metals C3
September 2006 J:\PROJECTS\05975_Shell\140\Trial Burn\Trial Burn Report\Shell Martinez TB Report R1_11_06.doc

5-9
Table 5-5 Sampling Parameters and Emission Results for PM (Condition 1)
Run No. C1-R1 C1-R2 C1-R3Date 06-Jun-06 06-Jun-06 06-Jun-06Start Time Units 09:30 12:45 15:30Stop Time 11:40 14:57 17:40 AVGSSampling Parameters --
Barometric Pressure in. Hg 29.68 29.68 29.68 29.68Volume Metered dcf 80.336 83.535 83.853 82.575Volume of Gas Collected dscf 75.760 77.601 77.209 76.857Moisture % v/v 18.4 17.2 18.5 18.0O2 at Stack % dry 3.42 3.32 3.53 3.42CO2 at Stack % dry 13.98 14.10 13.80 13.96Avg. Stack Temp. °F 571 576 579 575Stack Flowrate dscfm 101,938 102,168 100,603 101,570Isokinetics % 96 98 99 98Particulate Emission Results --
Front Half Rinse mg 34.74 20.25 19.09 24.69Particulate Filter mg 57.30 49.38 33.77 46.82Total Particulate mg 92.04 69.63 52.86 71.51PM Loading @ 7% O2 mg/dscm 34.2 25.1 19.4 26.2Grain Loading gr/dscf 0.0187 0.0138 0.0105 0.0144Grain Loading @ 7% O2 gr/dscf 0.0149 0.0109 0.0084 0.0114
Emission Rate lb/hr 16.3 12.1 9.1 12.5
C:\PROJECTS\ShellCA\Trial Burn Mgmt\Field\[M5 PM Only C1.xls]EMISSIONS
September 2006 J:\PROJECTS\05975_Shell\140\Trial Burn\Trial Burn Report\Shell Martinez TB Report R1_11_06.doc
5-10
Table 5-6 Sampling Parameters and Emission Results for PM, HCl, Cl2 and NH3 (Condition 2)
Run No. C2-R1 C2-R2 C2-R3Date 07-Jun-06 08-Jun-06 09-Jun-06Start Time Units 10:00 13:20 13:10Stop Time 13:25 15:50 15:35 AVGS
Sampling Parameters --Barometric Pressure in. Hg 29.68 29.73 29.62 29.68Volume Metered dcf 83.224 85.324 89.699 86.082Volume of Gas Collected dscf 77.289 79.170 84.284 80.248Moisture % v/v 19.6 19.3 19.5 19.4O2 at Stack % dry 4.32 3.72 3.59 3.88CO2 at Stack % dry 13.23 13.73 13.45 13.47Avg. Stack Temp. °F 569 574 578 573Stack Flowrate dscfm 100,055 100,735 107,041 102,610Isokinetics % 100 101 102 101
PM Emission Results --Front Half Rinse mg 24.84 7.96 17.13 16.64Particulate Filter mg 16.32 3.40 17.67 12.46Total Particulate mg 41.16 11.36 34.80 29.11PM Loading @ 7% O2 mg/dscm 15.8 4.1 11.7 10.5Grain Loading gr/dscf 0.0082 0.0022 0.0064 0.0056Grain Loading @ 7% O2 gr/dscf 0.0069 0.0018 0.0051 0.0046Emission Rate lb/hr 7.03 1.91 5.83 4.93
HCl Emission Results --Total HCl Detected µg 3,700 4,300 1,200 3,067Total HCl Concentration ppm 1.11 1.26 0.33 0.90 Conc. @ 7% O2 ppm 0.93 1.02 0.27 0.74HCl Emission Rate g/sec 0.080 0.091 0.025 0.065
Cl2 Emission Results --Total Cl2 Detected µg < 640 < 500 < 1,000 < 713Total Cl2 Concentration ppm < 0.10 < 0.08 < 0.14 < 0.11 Conc. @ 7% O2 ppm < 0.08 < 0.06 < 0.12 < 0.09Cl2 Emission Rate g/sec < 0.014 < 0.011 < 0.021 < 0.015
NH3 Emission Results --Quantity Detected (as N) µg 88,000 88,300 84,800 87,033Total NH3 Detected µg 106,857 107,221 102,971 105,683Total NH3 Concentration ppm 68.9 67.5 60.9 65.8 Conc. @ 7% O2 ppm 57.9 54.7 49.0 53.9NH3 Emission Rate lb/hr 15.1 14.9 14.2 14.7
C:\PROJECTS\ShellCA\Trial Burn Mgmt\Field\[M50 PM HCl C2.xls]EMISSIONS
September 2006 J:\PROJECTS\05975_Shell\140\Trial Burn\Trial Burn Report\Shell Martinez TB Report R1_11_06.doc
5-11
Table 5-7 Sampling Parameters and Emission Results for Carbonyl Compounds (Condition 2)
Run No. C2-R1 C2-R2 C2-R3Date 07-Jun-06 08-Jun-06 09-Jun-06Start Time Units 10:00 13:20 13:10Stop Time 13:25 15:50 15:35 AVGSSampling Parameters --Barometric Pressure in. Hg 29.68 29.62 29.76 29.69Volume Metered dcf 77.110 78.675 76.580 77.455Sample Volume dscf 74.374 75.051 73.337 74.254Moisture % v/v 18.8 20.4 18.8 19.3O2 at Stack % dry 4.32 3.72 3.59 3.88Avg. Stack Temp. °F 572 575 580 576Stack Flowrate dscfm 95,369 92,186 94,292 93,949Isokinetics % 101 105 100 102
Acetaldehyde --Quantity Collected µg 4.59 9.84 < 5.20 < 6.54Stack Conc. @ 7% O2 µg/m³ 1.83 3.75 < 2.01 < 2.53Stack Emission Rate lb/hr 7.8E-04 1.6E-03 < 8.8E-04 < 1.1E-03
g/sec 9.8E-05 2.0E-04 < 1.1E-04 < 1.4E-04
Crotonaldehyde --Quantity Collected µg < 3.45 < 9.80 < 5.20 < 6.15Stack Conc. @ 7% O2 µg/m³ < 1.38 < 3.74 < 2.01 < 2.38Stack Emission Rate lb/hr < 5.9E-04 < 1.6E-03 < 8.8E-04 < 1.0E-03
g/sec < 7.4E-05 < 2.0E-04 < 1.1E-04 < 1.3E-04
Formaldehyde --Quantity Collected µg < 3.45 < 9.80 < 5.20 < 6.15Stack Conc. @ 7% O2 µg/m³ < 1.38 < 3.74 < 2.01 < 2.38Stack Emission Rate lb/hr < 5.9E-04 < 1.6E-03 < 8.8E-04 < 1.0E-03
g/sec < 7.4E-05 < 2.0E-04 < 1.1E-04 < 1.3E-04
Propionaldehyde --Quantity Collected µg < 3.45 < 9.80 < 5.20 < 6.15Stack Conc. @ 7% O2 µg/m³ < 1.38 < 3.74 < 2.01 < 2.38Stack Emission Rate lb/hr < 5.9E-04 < 1.6E-03 < 8.8E-04 < 1.0E-03
g/sec < 7.4E-05 < 2.0E-04 < 1.1E-04 < 1.3E-04C:\PROJECTS\ShellCA\Trial Burn Mgmt\Field\[M11 ALD C2.xls]EMISSIONS
September 2006 J:\PROJECTS\05975_Shell\140\Trial Burn\Trial Burn Report\Shell Martinez TB Report R1_11_06.doc
5-12
Table 5-8 Sampling Parameters and Emission Results for Target Metals (Condition 2)
Run No. C2-R1 C2-R2 C2-R3Date 07-Jun-06 08-Jun-06 09-Jun-06Start Time Units 10:00 13:20 13:10Stop Time 13:25 15:50 15:35 AVGSSampling Parameters --Barometric Pressure in. Hg 29.68 29.80 29.62 29.70Volume Metered dcf 87.815 82.943 80.562 83.773Sample Volume dscf 81.739 77.889 75.596 78.408Moisture % v/v 17.0 16.0 18.7 17.2O2 at Stack % dry 4.32 3.72 3.59 3.88Avg. Stack Temp. °F 563 553 563 560Stack Flowrate dscfm 99,747 96,873 90,797 95,806Isokinetics % 106 104 107 106Arsenic (As) --Quantity Collected µg 1.54 0.39 1.14 1.02Stack Conc. @ 7% O2 µg/m³ 0.56 0.14 0.43 0.38Stack Emission Rate lb/hr 2.5E-04 6.4E-05 1.8E-04 1.6E-04
g/sec 3.1E-05 8.1E-06 2.3E-05 2.07E-05Beryllium (Be) --Quantity Collected µg < 0.32 < 0.33 < 0.33 < 0.33Stack Conc. @ 7% O2 µg/m³ < 0.12 < 0.12 < 0.12 < 0.12Stack Emission Rate lb/hr < 5.2E-05 < 5.4E-05 < 5.2E-05 < 5.3E-05
g/sec < 6.5E-06 < 6.8E-06 < 6.6E-06 < 6.65E-06Total Chromium (Cr) --Quantity Collected µg 2.81 1.81 1.91 2.18Stack Conc. @ 7% O2 µg/m³ 1.02 0.66 0.72 0.80Stack Emission Rate lb/hr 4.5E-04 3.0E-04 3.0E-04 3.5E-04
g/sec 5.7E-05 3.8E-05 3.8E-05 4.43E-05Cadmium (Cd) --Quantity Collected µg 0.07 0.46 0.12 0.22Stack Conc. @ 7% O2 µg/m³ 0.03 0.17 0.05 0.08Stack Emission Rate lb/hr 1.1E-05 7.6E-05 1.9E-05 3.5E-05
g/sec 1.4E-06 9.5E-06 2.4E-06 4.45E-06Lead (Pb) --Quantity Collected µg 1.62 1.52 1.92 1.69Stack Conc. @ 7% O2 µg/m³ 0.59 0.56 0.72 0.62Stack Emission Rate lb/hr 2.6E-04 2.5E-04 3.1E-04 2.7E-04
g/sec 3.3E-05 3.2E-05 3.8E-05 3.43E-05C:\PROJECTS\ShellCA\Trial Burn Mgmt\Field\[M29 Metals C2.xls]EMISSpg1 (continued) Pg 1 of 4
September 2006 J:\PROJECTS\05975_Shell\140\Trial Burn\Trial Burn Report\Shell Martinez TB Report R1_11_06.doc

5-13
Table 5-8 (continued)
Run No. C2-R1 C2-R2 C2-R3Date 07-Jun-06 08-Jun-06 09-Jun-06Start Time Units 10:00 13:20 13:10Stop Time 13:25 15:50 15:35 AVGSSampling Parameters --Barometric Pressure in. Hg 29.68 29.80 29.62 29.70Volume Metered dcf 87.815 82.943 80.562 83.773Sample Volume dscf 81.739 77.889 75.596 78.408Moisture % v/v 17.0 16.0 18.7 17.2O2 at Stack % dry 4.32 3.72 3.59 3.88Avg. Stack Temp. °F 563 553 563 560Stack Flowrate dscfm 99,747 96,873 90,797 95,806Isokinetics % 106 104 107 106Mercury (Hg) --Quantity Collected µg 9.23 6.49 8.04 7.92Stack Conc. @ 7% O2 µg/m³ 3.35 2.38 3.02 2.92Stack Emission Rate lb/hr 1.5E-03 1.1E-03 1.3E-03 1.3E-03
g/sec 1.9E-04 1.3E-04 1.6E-04 1.61E-04Aluminum (Al) --Quantity Collected µg 1,558 1,910 2,081 1,850Stack Conc. @ 7% O2 µg/m³ 565 702 782 683Stack Emission Rate lb/hr 2.5E-01 3.1E-01 3.3E-01 3.0E-01
g/sec 3.2E-02 4.0E-02 4.2E-02 3.76E-02Antimony (Sb) --Quantity Collected µg < 0.22 < 0.09 < 0.15 < 0.15Stack Conc. @ 7% O2 µg/m³ < 0.08 < 0.03 < 0.06 < 0.06Stack Emission Rate lb/hr < 3.6E-05 < 1.5E-05 < 2.4E-05 < 2.5E-05
g/sec < 4.5E-06 < 1.9E-06 < 3.0E-06 < 3.11E-06Barium (Ba) --Quantity Collected µg 1.20 0.80 1.40 1.13Stack Conc. @ 7% O2 µg/m³ 0.44 0.29 0.53 0.42Stack Emission Rate lb/hr 1.9E-04 1.3E-04 2.2E-04 1.8E-04
g/sec 2.4E-05 1.7E-05 2.8E-05 2.30E-05Cobalt (Co) --Quantity Collected µg 0.78 0.29 0.27 0.45Stack Conc. @ 7% O2 µg/m³ 0.28 0.11 0.10 0.16Stack Emission Rate lb/hr 1.3E-04 4.8E-05 4.3E-05 7.2E-05
g/sec 1.6E-05 6.0E-06 5.4E-06 9.09E-06C:\PROJECTS\ShellCA\Trial Burn Mgmt\Field\[M29 Metals C2.xls]EMISSpg2 (continued) Pg 2 of 4
September 2006 J:\PROJECTS\05975_Shell\140\Trial Burn\Trial Burn Report\Shell Martinez TB Report R1_11_06.doc

5-14
Table 5-8 (continued)
Run No. C2-R1 C2-R2 C2-R3Date 07-Jun-06 08-Jun-06 09-Jun-06Start Time Units 10:00 13:20 13:10Stop Time 13:25 15:50 15:35 AVGSSampling Parameters --Barometric Pressure in. Hg 29.68 29.80 29.62 29.70Volume Metered dcf 87.815 82.943 80.562 83.773Sample Volume dscf 81.739 77.889 75.596 78.408Moisture % v/v 17.0 16.0 18.7 17.2O2 at Stack % dry 4.32 3.72 3.59 3.88Avg. Stack Temp. °F 563 553 563 560Stack Flowrate dscfm 99,747 96,873 90,797 95,806Isokinetics % 106 104 107 106Copper (Cu) --Quantity Collected µg 3.58 2.08 2.38 2.68Stack Conc. @ 7% O2 µg/m³ 1.30 0.76 0.89 0.99Stack Emission Rate lb/hr 5.8E-04 3.4E-04 3.8E-04 4.3E-04
g/sec 7.3E-05 4.3E-05 4.8E-05 5.5E-05Manganese (Mn) --Quantity Collected µg 1.74 3.74 5.84 3.77Stack Conc. @ 7% O2 µg/m³ 0.63 1.37 2.19 1.40Stack Emission Rate lb/hr 2.8E-04 6.2E-04 9.3E-04 6.1E-04
g/sec 3.5E-05 7.8E-05 1.2E-04 7.7E-05Nickel (Ni) --Quantity Collected µg 5.00 4.60 4.00 4.53Stack Conc. @ 7% O2 µg/m³ 1.81 1.69 1.50 1.67Stack Emission Rate lb/hr 8.1E-04 7.6E-04 6.4E-04 7.3E-04
g/sec 1.0E-04 9.5E-05 8.0E-05 9.2E-05Selenium (Se) --Quantity Collected µg 133.0 76.5 113.0 107.5Stack Conc. @ 7% O2 µg/m³ 48.2 28.1 42.5 39.6Stack Emission Rate lb/hr 2.1E-02 1.3E-02 1.8E-02 1.7E-02
g/sec 2.7E-03 1.6E-03 2.3E-03 2.2E-03C:\PROJECTS\ShellCA\Trial Burn Mgmt\Field\[M29 Metals C2.xls]EMISSpg3 (continued) Pg 3 of 4
September 2006 J:\PROJECTS\05975_Shell\140\Trial Burn\Trial Burn Report\Shell Martinez TB Report R1_11_06.doc
5-15
Table 5-8 (continued)
Run No. C2-R1 C2-R2 C2-R3Date 07-Jun-06 08-Jun-06 09-Jun-06Start Time Units 10:00 13:20 13:10Stop Time 13:25 15:50 15:35 AVGSSampling Parameters --Barometric Pressure in. Hg 29.68 29.80 29.62 29.70Volume Metered dcf 87.815 82.943 80.562 83.773Sample Volume dscf 81.739 77.889 75.596 78.408Moisture % v/v 17.0 16.0 18.7 17.2O2 at Stack % dry 4.32 3.72 3.59 3.88Avg. Stack Temp. °F 563 553 563 560Stack Flowrate dscfm 99,747 96,873 90,797 95,806Isokinetics % 106 104 107 106Silver (Ag) --Quantity Collected µg 2.58 3.98 5.08 3.88Stack Conc. @ 7% O2 µg/m³ 0.94 1.46 1.91 1.44Stack Emission Rate lb/hr 4.2E-04 6.5E-04 8.1E-04 6.3E-04
g/sec 5.2E-05 8.3E-05 1.0E-04 7.89E-05Thallium (Tl) --Quantity Collected µg < 0.32 < 0.33 < 0.33 < 0.33Stack Conc. @ 7% O2 µg/m³ < 0.12 < 0.12 < 0.12 < 0.12Stack Emission Rate lb/hr < 5.2E-05 < 5.4E-05 < 5.2E-05 < 5.3E-05
g/sec < 6.5E-06 < 6.8E-06 < 6.6E-06 < 6.65E-06Vanadium (V) --Quantity Collected µg 4.40 5.40 6.90 5.57Stack Conc. @ 7% O2 µg/m³ 1.60 1.98 2.59 2.06Stack Emission Rate lb/hr 7.1E-04 8.9E-04 1.1E-03 9.0E-04
g/sec 8.9E-05 1.1E-04 1.4E-04 1.1E-04Zinc (Zn) --Quantity Collected µg 33.1 42.5 47.8 41.1Stack Conc. @ 7% O2 µg/m³ 12.0 15.6 18.0 15.2Stack Emission Rate lb/hr 5.3E-03 7.0E-03 7.6E-03 6.6E-03
g/sec 6.7E-04 8.8E-04 9.6E-04 8.4E-04C:\PROJECTS\ShellCA\Trial Burn Mgmt\Field\[M29 Metals C2.xls]EMISSpg4 Pg 4 of 4
September 2006 J:\PROJECTS\05975_Shell\140\Trial Burn\Trial Burn Report\Shell Martinez TB Report R1_11_06.doc

5-16
Table 5-9 Sampling Parameters and Emission Results for Hexavalent Chromium (Condition 2)
Run No. C2-R1 C2-R2 C2-R3Date 07-Jun-06 08-Jun-06 09-Jun-06Start Time Units 10:00 13:20 13:10Stop Time 13:25 15:50 15:35 AVGSSampling Parameters --Barometric Pressure in. Hg 29.68 29.73 29.62 29.68Volume Metered dcf 79.565 78.642 88.898 82.368Sample Volume dscf 75.811 75.435 85.755 79.001Moisture % v/v 23.3 17.7 14.4 18.5O2 at Stack % dry 4.32 3.72 3.59 3.88Avg. Stack Temp. °F 569 574 577 574Stack Flowrate dscfm 93,490 99,293 108,891 100,558Isokinetics % 105 98 102 101
Hexavalent ChromiumQuantity Collected µg 0.27 0.15 0.37 0.26Stack Conc. @ 7% O2 µg/m³ 0.11 0.06 0.12 0.10Stack Emission Rate lb/hr 4.4E-05 2.6E-05 6.2E-05 4.4E-05
g/hr 0.020 0.012 0.028 0.020g/sec 5.5E-06 3.3E-06 7.8E-06 5.6E-06
C:\PROJECTS\ShellCA\Trial Burn Mgmt\Field\[M61 CR6 C2.xls]EMISSIONS
September 2006 J:\PROJECTS\05975_Shell\140\Trial Burn\Trial Burn Report\Shell Martinez TB Report R1_11_06.doc

5-17
Table 5-10 Sampling Parameters and Emission Results for PCDDs/PCDFs – TEQ Basis (Condition 2)
Run No. C2-R1 C2-R2 C2-R3Date 07-Jun-06 08-Jun-06 09-Jun-06
Start Time 16:22 08:00 08:00Stop Time 19:35 11:10 11:54
UnitsSample Volume dscf 102.824 112.986 105.679Sample Volume m³ 2.91 3.20 2.99Moisture Content % v/v 17.2 16.4 17.0O2 Concentration % v/v (dry) 3.79 3.74 2.59CO2 Concentration % v/v (dry) 13.66 13.64 11.09Isokinetics % 98 100 95Stack Flowrate dscfm 90,344 96,897 96,058PCDD / PCDF pg ng/m³ pg ng/m³ pg ng/m³Parameters TEF (a) TEQ TEQ TEQ
2,3,7,8-TCDD 1.00 (3.93) 0.0E+00 (5.82) 0.0E+00 (3.97) 0.0E+001,2,3,7,8-PeCDD 0.50 (4.19) 0.0E+00 (4.43) 0.0E+00 (4.23) 0.0E+001,2,3,4,7,8-HxCDD 0.10 (7.88) 0.0E+00 (7.63) 0.0E+00 (6.26) 0.0E+001,2,3,6,7,8-HxCDD 0.10 (7.12) 0.0E+00 (6.89) 0.0E+00 (5.66) 0.0E+001,2,3,7,8,9-HxCDD 0.10 (7.32) 0.0E+00 (7.09) 0.0E+00 (5.82) 0.0E+001,2,3,4,6,7,8-HpCDD 0.01 (5.61) 0.0E+00 (5.80) 0.0E+00 (5.75) 0.0E+00OCDD 0.001 20.2 6.9E-06 (10.6) 0.0E+00 17.0 5.7E-062,3,7,8-TCDF 0.10 (4.26) 0.0E+00 (5.07) 0.0E+00 (5.92) 0.0E+001,2,3,7,8-PeCDF 0.05 (5.20) 0.0E+00 (6.87) 0.0E+00 (6.94) 0.0E+002,3,4,7,8-PeCDF 0.50 (4.89) 0.0E+00 (6.46) 0.0E+00 (6.53) 0.0E+001,2,3,4,7,8-HxCDF 0.10 (2.54) 0.0E+00 (2.53) 0.0E+00 (2.70) 0.0E+001,2,3,6,7,8-HxCDF 0.10 (2.34) 0.0E+00 (2.33) 0.0E+00 (4.09) 0.0E+002,3,4,6,7,8-HxCDF 0.10 (2.58) 0.0E+00 (2.57) 0.0E+00 (2.74) 0.0E+001,2,3,7,8,9-HxCDF 0.10 (2.82) 0.0E+00 (2.81) 0.0E+00 (3.00) 0.0E+001,2,3,4,6,7,8-HpCDF 0.01 (3.52) 0.0E+00 (4.30) 0.0E+00 (5.22) 0.0E+001,2,3,4,7,8,9-HpCDF 0.01 (4.23) 0.0E+00 (5.17) 0.0E+00 (6.28) 0.0E+00OCDF 0.001 35.3 1.2E-05 34.9 1.1E-05 41.4 1.4E-05TOTAL TEQs (ng/m³) = 1.9E-05 1.1E-05 2.0E-05 AVG:TOTAL TEQs (ng/m³ @ 7 % O2) = 1.6E-05 8.8E-06 1.5E-05 1.3E-05TOTAL TEQs (g/s) = 8.1E-13 5.0E-13 8.8E-13
(a) U.S.EPA (1989) Toxic Equivalency FactorNote: "Non-detect" values are shown in parentheses and treated as zero in the calculation
of concentration on a TEQ basis.C:\PROJECTS\ShellCA\Trial Burn Mgmt\Field\[M23 DF PAH C2.xls]TEQS-TOT
September 2006 J:\PROJECTS\05975_Shell\140\Trial Burn\Trial Burn Report\Shell Martinez TB Report R1_11_06.doc
5-18
Table 5-11 Sampling Parameters and Emission Results for PAHs (Condition 2)
Run No. C2-R1 C2-R2 C2-R3Date 07-Jun-06 08-Jun-06 09-Jun-06
Start Time 16:22 08:00 08:00Stop Time 19:35 11:10 11:54
UnitsSample Volume dscf 102.824 112.986 105.679Sample Volume m³ 2.912 3.20 2.99Moisture Content % v/v 17.2 16.4 17.0O2 Concentration % v/v (dry) 3.8 3.7 2.6CO2 Concentration % v/v (dry) 13.7 13.6 11.1Isokinetics % 98 100 95Stack Flowrate dscfm 90,344 96,897 96,058
Noncarcinogenic PAHs: ng g/sec ng g/sec ng g/secNaphthalene (755) 1.1E-05 (755) 1.1E-05 755 1.1E-052-Methylnaphthalene (215) 3.1E-06 (215) 3.1E-06 218 3.3E-06Acenaphthylene (20.0) 2.9E-07 (20.0) 2.9E-07 (20.0) 3.0E-07Acenaphthene (20.0) 2.9E-07 (20.0) 2.9E-07 (20.0) 3.0E-07Fluorene (20.0) 2.9E-07 23.0 3.3E-07 85.1 1.3E-06Phenanthrene (50.0) 7.3E-07 (50.0) 7.1E-07 61.8 9.4E-07Anthracene (20.0) 2.9E-07 (20.0) 2.9E-07 58.7 8.9E-07Fluoranthene (20.0) 2.9E-07 (20.0) 2.9E-07 (20.0) 3.0E-07Pyrene (20.0) 2.9E-07 (20.0) 2.9E-07 (20.0) 3.0E-07Benzo(e)pyrene (20.0) 2.9E-07 (20.0) 2.9E-07 (20.0) 3.0E-07Perylene (20.0) 2.9E-07 (20.0) 2.9E-07 (20.0) 3.0E-07Benzo(g,h,i)perylene (20.0) 2.9E-07 (20.0) 2.9E-07 (20.0) 3.0E-07
Carcinogenic PAHs: ng g/sec ng g/sec ng g/secBenzo(a)anthracene (20.0) 2.9E-07 (20.0) 2.9E-07 (20.0) 3.0E-07Chrysene (20.0) 2.9E-07 (20.0) 2.9E-07 (20.0) 3.0E-07Benzo(b)fluoranthene (20.0) 2.9E-07 (20.0) 2.9E-07 (20.0) 3.0E-07Benzo(k)fluoranthene (20.0) 2.9E-07 (20.0) 2.9E-07 (20.0) 3.0E-07Benzo(a)pyrene (20.0) 2.9E-07 (20.0) 2.9E-07 (20.0) 3.0E-07Indeno(1,2,3-c,d)pyrene (20.0) 2.9E-07 (20.0) 2.9E-07 (20.0) 3.0E-07Dibenz(a,h)anthracene (20.0) 2.9E-07 (20.0) 2.9E-07 (20.0) 3.0E-07
Note: "Non-detect" values are shown in parentheses and used in the calculation of emission rate.C:\PROJECTS\ShellCA\Trial Burn Mgmt\Field\[M23 DF PAH C2.xls]PAHs
September 2006 J:\PROJECTS\05975_Shell\140\Trial Burn\Trial Burn Report\Shell Martinez TB Report R1_11_06.doc

5-19
Table 5-12 Sampling Parameters and Emission Results for Semivolatile Organics (Condition 2)
Run No. C2-R1 C2-R2 C2-R3Date 07-Jun-06 08-Jun-06 09-Jun-06
Start Time 16:22 08:00 08:00Stop Time 19:35 11:10 11:10
UnitsSample Volume dscf 105.670 103.287 110.108Sample Volume m³ 2.99 2.92 3.12Moisture Content % v/v 18.1 17.9 18.1O2 Conc. % v/v (dry) 3.79 3.74 2.59CO2 Conc. % v/v (dry) 13.66 13.64 11.09Isokinetics % 101 94 101Stack Flowrate dscfm 90,224 94,832 94,139
Semivolatile Organics: µg g/sec µg g/sec µg g/secN-Nitrosodiethylamine 30 4.3E-04 30 4.6E-04 30 4.3E-04Aniline 30 4.3E-04 30 4.6E-04 30 4.3E-04Benzidine 300 4.3E-03 300 4.6E-03 300 4.3E-03Benzoic acid 150 2.1E-03 146 2.2E-03 190 2.7E-03bis(2-Chloroethoxy)methane 30 4.3E-04 30 4.6E-04 30 4.3E-04bis(2-Chloroethyl) ether 30 4.3E-04 30 4.6E-04 30 4.3E-04bis(2-Chloroisopropyl) ether 30 4.3E-04 30 4.6E-04 30 4.3E-04bis(2-Ethylhexyl) phthalate 22 3.1E-04 30 4.6E-04 14.3 2.0E-044-Bromophenyl phenyl ether 30 4.3E-04 30 4.6E-04 30 4.3E-04Butyl benzyl phthalate 30 4.3E-04 30 4.6E-04 30 4.3E-044-Chloroaniline 30 4.3E-04 30 4.6E-04 30 4.3E-044-Chloro-3-methylphenol 150 2.1E-03 150 2.3E-03 150 2.1E-032-Chloronaphthalene 30 4.3E-04 30 4.6E-04 30 4.3E-042-Chlorophenol 30 4.3E-04 30 4.6E-04 30 4.3E-044-Chlorophenyl phenyl ether 30 4.3E-04 30 4.6E-04 30 4.3E-04Di-n-butyl phthalate 30 4.3E-04 30 4.6E-04 24 3.4E-041,2-Dichlorobenzene 30 4.3E-04 30 4.6E-04 30 4.3E-041,3-Dichlorobenzene 30 4.3E-04 30 4.6E-04 30 4.3E-041,4-Dichlorobenzene 30 4.3E-04 30 4.6E-04 30 4.3E-043,3'-Dichlorobenzidine 30 4.3E-04 30 4.6E-04 30 4.3E-042,4-Dichlorophenol 30 4.3E-04 30 4.6E-04 30 4.3E-04Diethyl phthalate 30 4.3E-04 30 4.6E-04 30 4.3E-042,4-Dimethylphenol 30 4.3E-04 30 4.6E-04 30 4.3E-04Dimethyl phthalate 30 4.3E-04 30 4.6E-04 30 4.3E-044,6-Dinitro-2-methylphenol 150 2.1E-03 150 2.3E-03 150 2.1E-03
Note: Only benzoic acid was detected above its reporting limit (RL) (C2-R3). Pg 1 of 2C:\PROJECTS\ShellCA\Trial Burn Mgmt\Field\[M10 SVOCs C2.xls]SVOCsPg1
September 2006 J:\PROJECTS\05975_Shell\140\Trial Burn\Trial Burn Report\Shell Martinez TB Report R1_11_06.doc
5-20
Table 5-12 (continued)
Run No. C2-R1 C2-R2 C2-R3Date 07-Jun-06 08-Jun-06 09-Jun-06
Start Time 16:22 08:00 08:00Stop Time 19:35 11:10 11:10
UnitsSample Volume dscf 105.670 103.287 110.108Sample Volume m³ 2.99 2.92 3.12Moisture Content % v/v 18.1 17.9 18.1O2 Conc. % v/v (dry) 3.79 3.74 2.59CO2 Conc. % v/v (dry) 13.66 13.64 11.09Isokinetics % 101 94 101Stack Flowrate dscfm 90,224 94,832 94,139
Semivolatile Organics: µg g/sec µg g/sec µg g/sec2,4-Dinitrophenol 150 2.1E-03 150 2.3E-03 150 2.1E-032,4-Dinitrotoluene 30 4.3E-04 30 4.6E-04 30 4.3E-042,6-Dinitrotoluene 30 4.3E-04 30 4.6E-04 30 4.3E-04Di-n-octyl phthalate 30 4.3E-04 30 4.6E-04 30 4.3E-04Hexachlorobenzene 30 4.3E-04 30 4.6E-04 30 4.3E-04Hexachlorobutadiene 30 4.3E-04 30 4.6E-04 30 4.3E-04Hexachlorocyclopentadiene 150 2.1E-03 150 2.3E-03 150 2.1E-03Hexachloroethane 30 4.3E-04 30 4.6E-04 30 4.3E-04Isophorone 30 4.3E-04 30 4.6E-04 30 4.3E-042-Methylphenol 60 8.5E-04 60 9.2E-04 60 8.5E-042-Nitroaniline 30 4.3E-04 30 4.6E-04 30 4.3E-043-Nitroaniline 30 4.3E-04 30 4.6E-04 30 4.3E-044-Nitroaniline 150 2.1E-03 150 2.3E-03 150 2.1E-03Nitrobenzene 30 4.3E-04 30 4.6E-04 30 4.3E-042-Nitrophenol 150 2.1E-03 150 2.3E-03 150 2.1E-034-Nitrophenol 150 2.1E-03 150 2.3E-03 150 2.1E-03N-Nitrosodimethylamine 30 4.3E-04 30 4.6E-04 30 4.3E-04N-Nitrosodiphenylamine 30 4.3E-04 30 4.6E-04 30 4.3E-04N-Nitrosodi-n-propylamine 30 4.3E-04 30 4.6E-04 30 4.3E-04Pentachlorophenol 150 2.1E-03 150 2.3E-03 150 2.1E-03Phenol 150 2.1E-03 150 2.3E-03 150 2.1E-031,2,4-Trichlorobenzene 30 4.3E-04 30 4.6E-04 30 4.3E-042,4,5-Trichlorophenol 30 4.3E-04 30 4.6E-04 30 4.3E-042,4,6-Trichlorophenol 150 2.1E-03 150 2.3E-03 150 2.1E-03
Note: No compounds were detected above the reporting limit (RL). Pg 2 of 2C:\PROJECTS\ShellCA\Trial Burn Mgmt\Field\[M10 SVOCs C2.xls]SVOCsPg2
September 2006 J:\PROJECTS\05975_Shell\140\Trial Burn\Trial Burn Report\Shell Martinez TB Report R1_11_06.doc

5-21
Table 5-13 VOST Sampling Parameters (Condition 2)
Bar. Run Sampling Times Sample Meter SamplePress. ID Volume Temp. Volume
Date in Hg No. Start Stop aL °C dsL 7-Jun-06 29.68 1A 16:50 17:10 20.020 13.5 20.411
7-Jun-06 29.68 1B 17:30 17:50 20.480 17.1 20.621
7-Jun-06 29.68 1C 18:00 18:20 22.970 17.1 23.128
7-Jun-06 29.68 1D 18:28 18:48 19.580 17.8 19.667
7-Jun-06 29.68 1E 18:58 19:18 21.290 17.1 21.436
8-Jun-06 29.71 2A 08:40 09:00 20.270 14.7 20.597
8-Jun-06 29.71 2B 09:04 09:24 25.460 16.1 25.747
8-Jun-06 29.71 2C 09:30 09:50 23.110 16.7 23.326
8-Jun-06 29.71 2D 10:00 10:20 19.950 16.3 20.165
9-Jun-06 29.65 3A 09:40 10:00 18.630 10.7 19.161
9-Jun-06 29.65 3B 10:08 10:28 18.770 13.5 19.118
9-Jun-06 29.65 3C 10:38 10:58 20.170 17.4 20.2689-Jun-06 29.65 3D 11:06 11:26 20.210 17.2 20.318
DGM Y = 1.0049
C:\PROJECTS\ShellCA\Trial Burn Mgmt\Field\[VOST VOCs C2.xls]EMISS PG2
September 2006 J:\PROJECTS\05975_Shell\140\Trial Burn\Trial Burn Report\Shell Martinez TB Report R1_11_06.doc

5-22
Table 5-14 Emission Results for Target Volatile Organics (Condition 2)
Run No. C2-R1 Run No. C2-R2 Run No. C2-R3Date 07-Jun-06 Date 08-Jun-06 Date 09-Jun-06
Start Time 16:50 Start Time 08:40 Start Time 09:40Stop Time 18:48 Stop Time 10:20 Stop Time 11:26
VOST Sample Volume, dsL 84.852 89.835 78.865VOST Pairs Analyzed b, c, d, e a, b, c, d a, b, c, dStack Flowrate, dscfm 90,284 95,865 95,099
Volatile Organics: µg g/sec µg g/sec µg g/sec
Acetone 0.687 3.4E-04 0.811 4.1E-04 0.890 5.1E-04Acrylonitrile 3.000 1.5E-03 2.500 1.3E-03 4.000 2.3E-03Benzene 0.080 4.0E-05 0.090 4.5E-05 0.162 9.2E-05Bromobenzene 0.150 7.5E-05 0.125 6.3E-05 0.200 1.1E-04Bromochloromethane 0.150 7.5E-05 0.125 6.3E-05 0.200 1.1E-04Bromodichloromethane 0.150 7.5E-05 0.125 6.3E-05 0.200 1.1E-04Bromoform 0.150 7.5E-05 0.125 6.3E-05 0.200 1.1E-04Bromomethane 0.249 1.3E-04 0.250 1.3E-04 0.368 2.1E-042-butanone 0.600 3.0E-04 0.500 2.5E-04 0.800 4.6E-04n-Butylbenzene 0.150 7.5E-05 0.125 6.3E-05 0.200 1.1E-04sec-Butylbenzene 0.150 7.5E-05 0.125 6.3E-05 0.200 1.1E-04tert-Butylbenzene 0.150 7.5E-05 0.125 6.3E-05 0.200 1.1E-04Carbon disulfide 0.111 5.6E-05 0.104 5.3E-05 0.200 1.1E-04Carbon tetrachloride 0.135 6.8E-05 0.089 4.5E-05 0.200 1.1E-04Chlorobenzene 0.150 7.5E-05 0.125 6.3E-05 0.200 1.1E-04Chlorodibromomethane 0.150 7.5E-05 0.125 6.3E-05 0.200 1.1E-04Chloroethane 0.300 1.5E-04 0.250 1.3E-04 0.400 2.3E-04Chloroform 0.150 7.5E-05 0.125 6.3E-05 0.200 1.1E-04Chloromethane 0.291 1.5E-04 0.170 8.6E-05 0.290 1.7E-042-Chlorotoluene 0.150 7.5E-05 0.125 6.3E-05 0.200 1.1E-044-Chlorotoluene 0.150 7.5E-05 0.125 6.3E-05 0.200 1.1E-041,2-Dibromo-3-chloropropane 0.300 1.5E-04 0.250 1.3E-04 0.400 2.3E-041,2-Dibromoethane 0.150 7.5E-05 0.125 6.3E-05 0.200 1.1E-04Dibromomethane 0.150 7.5E-05 0.125 6.3E-05 0.200 1.1E-041,2-Dichlorobenzene 0.150 7.5E-05 0.125 6.3E-05 0.200 1.1E-041,3-Dichlorobenzene 0.150 7.5E-05 0.125 6.3E-05 0.200 1.1E-041,4-Dichlorobenzene 0.150 7.5E-05 0.125 6.3E-05 0.200 1.1E-04Dichlorodifluoromethane 0.102 5.1E-05 0.201 1.0E-04 0.200 1.1E-041,1-Dichloroethane 0.150 7.5E-05 0.125 6.3E-05 0.200 1.1E-041,2-Dichloroethane 0.150 7.5E-05 0.125 6.3E-05 0.200 1.1E-04cis-1,2-Dichloroethene 0.150 7.5E-05 0.125 6.3E-05 0.200 1.1E-04trans-1,2-Dichloroethene 0.150 7.5E-05 0.125 6.3E-05 0.200 1.1E-041,1-Dichloroethene 0.150 7.5E-05 0.125 6.3E-05 0.200 1.1E-04
Note: Although only relatively few compounds were detected (see Appendix E), the above calculationssum all "ND" and "real" values together (all sample fractions) to yield a "worst-case" emission rate.C:\PROJECTS\ShellCA\Trial Burn Mgmt\Field\[VOST VOCs C2.xls]EMISS PG1 Pg 1 of 2
September 2006 J:\PROJECTS\05975_Shell\140\Trial Burn\Trial Burn Report\Shell Martinez TB Report R1_11_06.doc
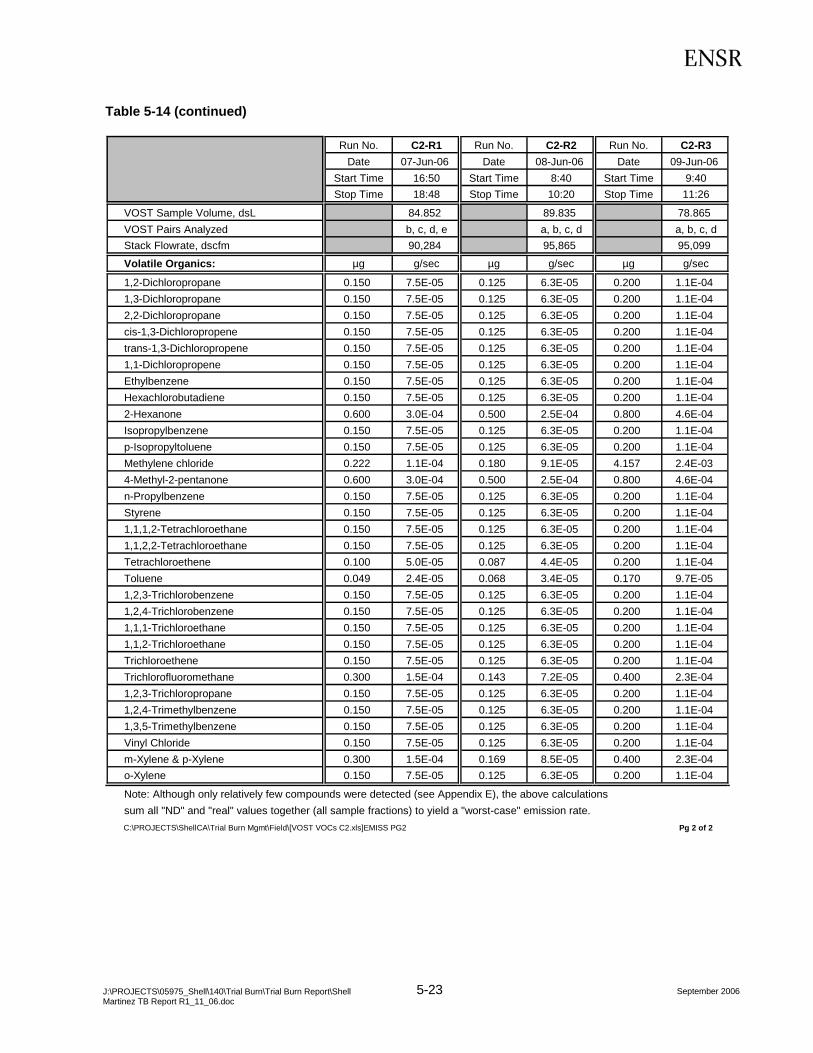
5-23
Table 5-14 (continued)
Run No. C2-R1 Run No. C2-R2 Run No. C2-R3Date 07-Jun-06 Date 08-Jun-06 Date 09-Jun-06
Start Time 16:50 Start Time 8:40 Start Time 9:40Stop Time 18:48 Stop Time 10:20 Stop Time 11:26
VOST Sample Volume, dsL 84.852 89.835 78.865VOST Pairs Analyzed b, c, d, e a, b, c, d a, b, c, dStack Flowrate, dscfm 90,284 95,865 95,099
Volatile Organics: µg g/sec µg g/sec µg g/sec
1,2-Dichloropropane 0.150 7.5E-05 0.125 6.3E-05 0.200 1.1E-041,3-Dichloropropane 0.150 7.5E-05 0.125 6.3E-05 0.200 1.1E-042,2-Dichloropropane 0.150 7.5E-05 0.125 6.3E-05 0.200 1.1E-04cis-1,3-Dichloropropene 0.150 7.5E-05 0.125 6.3E-05 0.200 1.1E-04trans-1,3-Dichloropropene 0.150 7.5E-05 0.125 6.3E-05 0.200 1.1E-041,1-Dichloropropene 0.150 7.5E-05 0.125 6.3E-05 0.200 1.1E-04Ethylbenzene 0.150 7.5E-05 0.125 6.3E-05 0.200 1.1E-04Hexachlorobutadiene 0.150 7.5E-05 0.125 6.3E-05 0.200 1.1E-042-Hexanone 0.600 3.0E-04 0.500 2.5E-04 0.800 4.6E-04Isopropylbenzene 0.150 7.5E-05 0.125 6.3E-05 0.200 1.1E-04p-Isopropyltoluene 0.150 7.5E-05 0.125 6.3E-05 0.200 1.1E-04Methylene chloride 0.222 1.1E-04 0.180 9.1E-05 4.157 2.4E-034-Methyl-2-pentanone 0.600 3.0E-04 0.500 2.5E-04 0.800 4.6E-04n-Propylbenzene 0.150 7.5E-05 0.125 6.3E-05 0.200 1.1E-04Styrene 0.150 7.5E-05 0.125 6.3E-05 0.200 1.1E-041,1,1,2-Tetrachloroethane 0.150 7.5E-05 0.125 6.3E-05 0.200 1.1E-041,1,2,2-Tetrachloroethane 0.150 7.5E-05 0.125 6.3E-05 0.200 1.1E-04Tetrachloroethene 0.100 5.0E-05 0.087 4.4E-05 0.200 1.1E-04Toluene 0.049 2.4E-05 0.068 3.4E-05 0.170 9.7E-051,2,3-Trichlorobenzene 0.150 7.5E-05 0.125 6.3E-05 0.200 1.1E-041,2,4-Trichlorobenzene 0.150 7.5E-05 0.125 6.3E-05 0.200 1.1E-041,1,1-Trichloroethane 0.150 7.5E-05 0.125 6.3E-05 0.200 1.1E-041,1,2-Trichloroethane 0.150 7.5E-05 0.125 6.3E-05 0.200 1.1E-04Trichloroethene 0.150 7.5E-05 0.125 6.3E-05 0.200 1.1E-04Trichlorofluoromethane 0.300 1.5E-04 0.143 7.2E-05 0.400 2.3E-041,2,3-Trichloropropane 0.150 7.5E-05 0.125 6.3E-05 0.200 1.1E-041,2,4-Trimethylbenzene 0.150 7.5E-05 0.125 6.3E-05 0.200 1.1E-041,3,5-Trimethylbenzene 0.150 7.5E-05 0.125 6.3E-05 0.200 1.1E-04Vinyl Chloride 0.150 7.5E-05 0.125 6.3E-05 0.200 1.1E-04m-Xylene & p-Xylene 0.300 1.5E-04 0.169 8.5E-05 0.400 2.3E-04o-Xylene 0.150 7.5E-05 0.125 6.3E-05 0.200 1.1E-04
Note: Although only relatively few compounds were detected (see Appendix E), the above calculationssum all "ND" and "real" values together (all sample fractions) to yield a "worst-case" emission rate.C:\PROJECTS\ShellCA\Trial Burn Mgmt\Field\[VOST VOCs C2.xls]EMISS PG2 Pg 2 of 2
September 2006 J:\PROJECTS\05975_Shell\140\Trial Burn\Trial Burn Report\Shell Martinez TB Report R1_11_06.doc

5-24
Table 5-15 VOST Sampling Parameters (Condition 3)
Bar. Run Sampling Times Sample Meter SamplePress. ID Volume Temp. Volume
Date in Hg No. Start Stop aL °C dsL 13-Jun-06 29.83 1A 10:30 10:50 19.440 19.0 19.541
13-Jun-06 29.83 1B 11:12 11:32 19.900 18.6 20.032
13-Jun-06 29.83 1C 11:44 12:04 20.070 18.2 20.232
13-Jun-06 29.83 1D 12:15 12:35 19.970 18.8 20.093
13-Jun-06 29.83 2A 12:55 13:15 19.120 16.5 19.386
13-Jun-06 29.83 2B 13:28 13:48 20.060 17.6 20.261
13-Jun-06 29.83 2C 14:02 14:22 19.680 18.6 19.811
13-Jun-06 29.83 2D 14:39 14:59 20.600 19.3 20.688
13-Jun-06 29.83 3A 15:16 15:36 20.200 18.1 20.373
13-Jun-06 29.83 3B 15:50 16:10 19.380 18.2 19.537
13-Jun-06 29.83 3C 16:23 16:43 19.490 18.1 19.653
13-Jun-06 29.83 3D 16:55 17:15 20.590 18.3 20.747
DGM Y = 1.0049
C:\PROJECTS\ShellCA\Trial Burn Mgmt\Field\[VOST DRE C3.xls]PARAM C3
September 2006 J:\PROJECTS\05975_Shell\140\Trial Burn\Trial Burn Report\Shell Martinez TB Report R1_11_06.doc

5-25
Table 5-16 DRE Calculations for Monochlorobenzene (Condition 3)
POHC Feed Parameters Stack Gas Parameters(a) POHC POHC (b) POHC
Run Date POHC Spike VOST Volume Quantity Stack Gas Emission
Run Start Time Purity Rate Run Sampled Detected Flowrate Rate Calculated
No. Stop Time (% wt) (lb/hr) No. (dsL) (µg) (dscfm) (lb/hr) DRE
C3-R1 13-Jun-06 1-A 19.541
10:30 1-B 20.032
12:35 1-C 20.232
1-D 20.093
Overall C3-R1: 99.9986% 75.0 79.899 0.960 147,935 6.66E-03 99.9911%
C3-R2 13-Jun-06 2-A 19.386
12:55 2-B 20.261
14:59 2-C 19.811
2-D 20.688
Overall C3-R2: 99.9986% 75.0 80.145 4.665 144,568 3.15E-02 99.9580%
C3-R3 13-Jun-06 3-A 20.373
15:16 3-B 19.537
17:15 3-C 19.653
3-D 20.747
Overall C2-R3: 99.9986% 75.0 80.310 6.625 139,804 4.32E-02 99.9424%
AVG DRE, RUNS C3-R1 -- C3-R3 : 99.9638%
C:\PROJECTS\ShellCA\Trial Burn Mgmt\Field\[VOST DRE C3.xls]POHC DRE
(a) POHC purity is provided for information only; the spike rate provided by Triad already accounts for POHC purity.(b) The stack gas flowrate used for the VOST runs is taken from the Method 2 / 4 trains run concurrently.
September 2006 J:\PROJECTS\05975_Shell\140\Trial Burn\Trial Burn Report\Shell Martinez TB Report R1_11_06.doc
6-1
6.0 Quality Assurance / Quality Control (QA/QC)
This trial burn program incorporated a variety of QA/QC measures to ensure the validity of the final results for documentation of the performance of Shell’s CO boiler unit. These measures were based upon routine field and laboratory practices as well as specific requirements delineated in the approved Trial Burn Plan and the applicable sampling and analytical protocols.
This section presents the results of all QA/QC measures evaluated during both the field sampling program and during all phases of sample analysis. Data generated for the program are judged to be completely valid since overall accuracy and precision goals consistent with general program objectives were achieved. Analytical QA/QC data are presented to support all sample results used for determining compliance with performance criteria and/or emission standards.
6.1 Sample Collection QA/QC
6.1.1 Waste Feed Stream Samples of the waste feed material were collected at the beginning, middle and end of each run as specified in Section 5.4.4 of the TBP. Field data sheets were completed by the sampler (Shell personnel) and are included in Appendix D. No problems were encountered during any periods of waste sample collection.
6.1.2 Stack Gas All samples were collected at the stack sampling platform on COB-2 as planned. One (1) field blank of each isokinetic sampling train was also submitted for analysis. For the VOST methodology, multiple field blanks (one per day of testing) and 2 trip blanks were also submitted along with program samples. In addition, DTSC provided a VOST audit cylinder which was sampled at the conclusion of testing on June 14, 2006. These VOST audit samples were submitted for analysis along with the routine program samples collected.
Sampling QA/QC measures for this program included the calibration of all applicable sampling equipment according to EPA procedures identified in 40 CFR 60, Methods 1-5, as well as manufacturer’s specifications. Details of specific calibrations are summarized in Appendix B of Avogadro’s report contained in Appendix B of this trial burn report.
Chain-of-custody (COC) procedures for all stack samples was initiated and maintained as follows:
Samples were collected, sealed and labeled with preprinted sample labels. Each isokinetic train was setup and recovered in either the Avogadro mobile trailer set up in close proximity to the tested unit or at Avogadro’s nearby facility in Martinez, CA.
Preprinted sample lists were used to check that all samples were collected and each container was checked upon completion of recovery and labeling.
All samples were packed in bubble wrap or other absorbent material and placed in either sample coolers or appropriate DOT shipping packages (dangerous goods items). All samples were subsequently driven by ENSR or Avogadro or shipped via Priority Overnight FedEx service to the designated laboratory.
September 2006 J:\PROJECTS\05975_Shell\140\Trial Burn\Trial Burn Report\Shell Martinez TB Report R1_11_06.doc

6-2
6.2 Laboratory Analysis QA/QC This section provides a detailed presentation of QA/QC results from sample analysis as reported by each analytical laboratory. Key QC data related to matrix spikes, surrogate spikes, duplicate analyses, laboratory control samples (blank spikes), method blanks and/or field blank results are presented in tabular format. Other QC procedures followed such as calibration checks and additional method-specific protocols are described in the case narratives and analytical data packages provided in Appendix E. Also, unless noted otherwise, all holding times and method-specific QC criteria were met and reported results met all applicable NELAC requirements.
6.2.1 Waste Feed Stream – Physical Parameter Analyses Evaluation of the validity of the physical parameter analyses was based on the following QA objectives:
Results of analysis of laboratory control samples (LCS) for density and total chlorine.
Results of duplicate sample analyses (LCS / LCSD) for ash and heat content and duplicate analyses performed for all parameters.
Results of a matrix spike and matrix spike duplicate (MS / MSD) for total chlorine.
Results of analysis of method blanks.
Results summarized in Table 6-1 indicate that only the duplicate chloride analysis was outside control limits, but since both the initial sample result and the duplicate result were close to the reporting limit, this is not deemed to be significant. Therefore, program quality objectives were met and completeness was determined to be 100% for all waste feed physical parameter (total chlorides, ash, moisture, density and heat content) analyses.
Table 6-1 Overall QC Summary for Waste Feed Stream Physical Parameter Analyses
QC Parameter Target Criteria Program Results
Method Blanks (ash and total chlorides) Below detection limit Non detect for both parameters
Duplicate Analyses (all parameters) < 30 % RPD All within control limits, except slightly high result for total chlorides
Matrix Spikes (MS) and Matrix Spike Duplicates (MSD) (total chlorides)
< 30 % RPD All recoveries within limits
Lab Control Samples (LCS) and Associated Duplicates (LCSD)
90 – 110% recovery and < 30 % RPD
All recoveries within limits
September 2006 J:\PROJECTS\05975_Shell\140\Trial Burn\Trial Burn Report\Shell Martinez TB Report R1_11_06.doc

6-3
6.2.2 Waste Feed Stream – Organic Analyses Evaluation of the validity of the volatile and semivolatile organic analyses performed on the waste material was based on the following QA objectives:
Results of analysis of LCS (or blank spikes).
Results of analysis of MS / MSD or LCS / LCSD.
Results for recoveries of 4 volatile surrogates and 8 semivolatile surrogates spiked into all samples prior to analysis.
Results of analysis of method blanks.
These samples required very high dilutions (500x for VOCs and 200-500x for SVOCs) in order to effectively report sample results. This resulted in elevated reporting limits for both VOC and SVOC analyses and inability to calculate surrogate recoveries for the SVOC analyses because the surrogate spike levels were so much lower than the reported result. Results summarized in Table 6-2 indicate that all other program quality objectives were met and that completeness was therefore determined to be 100% for all waste feed analyses.
Table 6-2 Overall QC Summary for Waste Feed Stream Organic Analyses
QC Parameter Target Criteria Program Results
Method Blanks Below detection limit No compounds reported above the reporting limit
Surrogate Recoveries Variable depending upon the specific compound
All recoveries within limits for VOC analyses. Not calculated for SVOC analyses.
Matrix Spikes / Matrix Spike Duplicates or LCS / LCSD
< 35 % RPD All precision goals met
Lab Control Samples 50 – 130% recovery All recoveries within limits
6.2.3 Waste Feed Stream – Metals Analyses Evaluation of the validity of the waste stream metals analyses was based on the following QA objectives:
Results of analysis of LCS and MS.
Results of analysis of duplicate analyses, MS / MSD and/or LCS / LCSD.
Results of analysis of method blanks.
Results for the majority of elements in the matrix spikes were not calculated due to the high concentration of these analytes in the sample relative to the spiking solution (greater than 4x). The remainder of the elements had low recoveries, but the LCS was in control indicating a matrix effect rather than a method performance problem. Results summarized in Table 6-3 indicate that remaining program quality objectives were met and that completeness was therefore determined to be 100% for all waste feed analyses.
September 2006 J:\PROJECTS\05975_Shell\140\Trial Burn\Trial Burn Report\Shell Martinez TB Report R1_11_06.doc

6-4
Table 6-3 Overall QC Summary for Waste Feed Stream Metals Analyses
QC Parameter Target Criteria Program Results
Method Blank Below detection limit Non detect for all parameters
MS / MSD, Duplicate Analyses or LCS / LCSD
< 35 % RPD Not calculated for the majority of elements due to the high concentration of the analytes relative to the spiking solution
Lab Control Samples 70 – 130% Recovery All recoveries within limits
6.2.4 Stack Gas Analyses
6.2.4.1 Particulate Matter
Evaluation of results of gravimetric analysis of the Method 5 (Condition 1) and Method 0050 (Condition 2) samples was based on routine laboratory practices and processing of lab blank and field blank samples. Front-half rinse sample fractions underwent blank correction at Avogadro up to the maximum allowed by the method (0.01 mg/g). The blank filter weights were within acceptable tolerances and required no blank correction. Additional QC measures followed by the gravimetric lab, such as maintenance of proper ambient conditions and use of standard weights, ensured valid data.
6.2.4.2 Hydrogen Chloride, Chlorine and Ammonia
Evaluation of the validity of anion analysis of Method 0050 train samples was based on three sets of objectives. These were:
Results of analysis of LCS and matrix spikes.
Results from the duplicate analysis of all samples.
Results of analysis of field and method blank samples.
Matrix spike recoveries for ammonia were not calculated due to the high level of this analyte in the samples relative to the spike (greater than 4x). The associated LCS was in control. Target criteria and results are shown in Table 6-4. All other results met trial burn data quality objectives and completeness was therefore determined to be 100% for these parameters.
September 2006 J:\PROJECTS\05975_Shell\140\Trial Burn\Trial Burn Report\Shell Martinez TB Report R1_11_06.doc

6-5
Table 6-4 Overall QC Summary for HCl, Cl2 and NH3 in Stack Gas Samples
QC Parameter Target Criteria Program Results
Field Blanks Below detection limit ND for HCl and Cl2; NH3 detected at a level slightly above the RL
Method Blank Below detection limit All parameters ND
Accuracy - LCS Recoveries 90%-110% recovery All samples within limits
Accuracy - MS Recoveries 70%-130% recovery HCl and Cl2 within limits; NH3 not calculated due to the high levels in the sample relative to the spike (> 4x)
Precision - LCS / LCSD, MS / MSD and Duplicate Analyses
< 35 % RPD All samples within limits
6.2.4.3 Carbonyl Compounds
Evaluation of the validity of the aldehyde emission data resultant from the analysis of the Method 0011 samples was based on the following data quality objectives:
Recoveries of an in-house spike (LCS) for formaldehyde.
Results of analysis of a field spike for formaldehyde.
Results of duplicate analysis of the C2-R2 sample for all target analytes.
Results of analysis of a field blank and a lab blank for all target analytes.
On the basis of the results presented in Table 6-5, all results were determined to be valid and completeness was therefore determined to be 100% for all target aldehyde analytical results.
Table 6-5 Overall QC Summary for Aldehydes in Stack Gas Samples
QC Parameter Target Criteria Program Results
Field Blank Below detection Limit All compounds below RL.
Lab Blank (Acetonitrile used to reconstitute the DNPH reagent)
Below detection Limit Non detect for all parameters
Accuracy - Field Spike Recovery 70 – 130% recovery 102% recovery for formaldehyde
Duplicate Analysis of one run (C2-R2)
Less than 25% RPD All parameters within limits
Lab Control Sample (In-House Spike into DNPH)
70 – 130% recovery 96.8% recovery for formaldehyde
September 2006 J:\PROJECTS\05975_Shell\140\Trial Burn\Trial Burn Report\Shell Martinez TB Report R1_11_06.doc
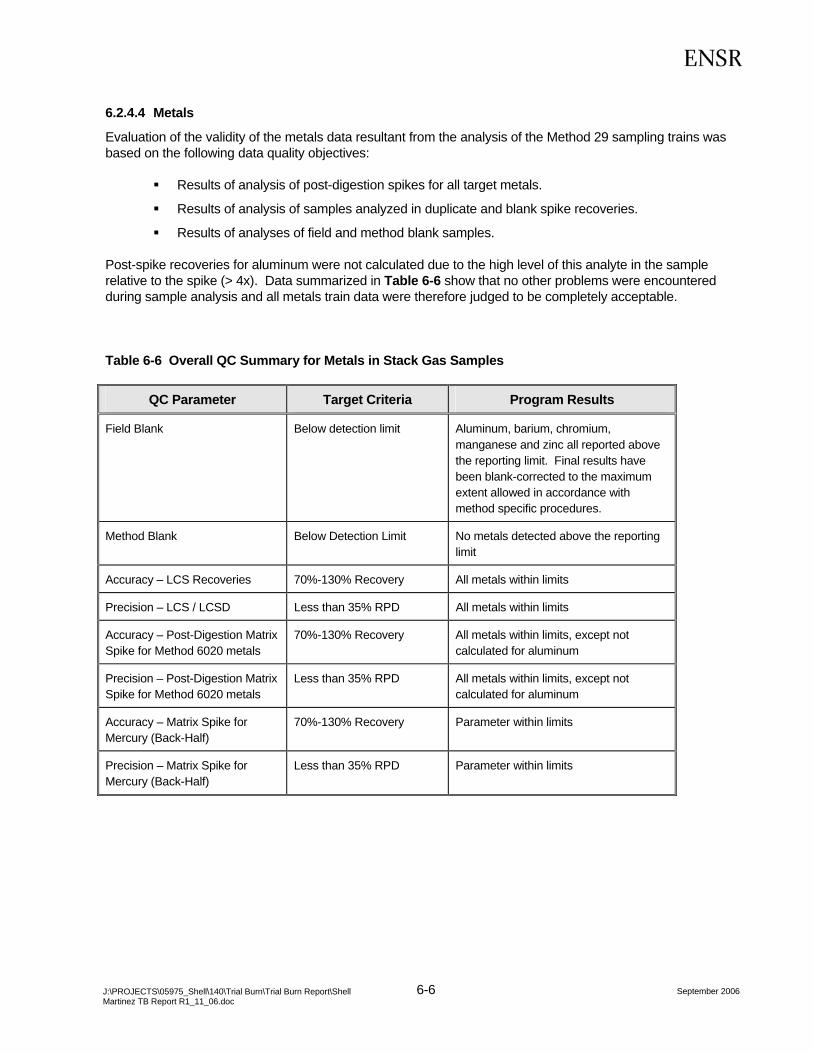
6-6
6.2.4.4 Metals
Evaluation of the validity of the metals data resultant from the analysis of the Method 29 sampling trains was based on the following data quality objectives:
Results of analysis of post-digestion spikes for all target metals.
Results of analysis of samples analyzed in duplicate and blank spike recoveries.
Results of analyses of field and method blank samples.
Post-spike recoveries for aluminum were not calculated due to the high level of this analyte in the sample relative to the spike (> 4x). Data summarized in Table 6-6 show that no other problems were encountered during sample analysis and all metals train data were therefore judged to be completely acceptable.
Table 6-6 Overall QC Summary for Metals in Stack Gas Samples
QC Parameter Target Criteria Program Results
Field Blank Below detection limit Aluminum, barium, chromium, manganese and zinc all reported above the reporting limit. Final results have been blank-corrected to the maximum extent allowed in accordance with method specific procedures.
Method Blank Below Detection Limit No metals detected above the reporting limit
Accuracy – LCS Recoveries 70%-130% Recovery All metals within limits
Precision – LCS / LCSD Less than 35% RPD All metals within limits
Accuracy – Post-Digestion Matrix Spike for Method 6020 metals
70%-130% Recovery All metals within limits, except not calculated for aluminum
Precision – Post-Digestion Matrix Spike for Method 6020 metals
Less than 35% RPD All metals within limits, except not calculated for aluminum
Accuracy – Matrix Spike for Mercury (Back-Half)
70%-130% Recovery Parameter within limits
Precision – Matrix Spike for Mercury (Back-Half)
Less than 35% RPD Parameter within limits
September 2006 J:\PROJECTS\05975_Shell\140\Trial Burn\Trial Burn Report\Shell Martinez TB Report R1_11_06.doc

6-7
6.2.4.5 Hexavalent Chromium
Evaluation of the validity of the data resultant from the analysis of the Method 0061 sampling train samples was based on the following QC indicators:
• Recoveries of lab blank (LCS) and matrix spikes.
• Duplicate analysis of all samples.
• Results of analysis of field and method blank samples.
As shown in Table 6-7, all recoveries in the LCSs and matrix spikes met the target criteria and results of all duplicate analyses were within method-specified criteria. Also, field and method blanks were free of the target analyte. Therefore, no sample analyses were rejected and completeness was determined to be 100% for all hexavalent chromium results.
Table 6-7 Overall QC Summary for Hexavalent Chromium in Stack Gas Samples
QC Parameter Target Criteria Program Results
All samples analyzed within target holding time
Holding Time Analyze within 14 days of sample collection
Field Blank Below Detection Limit Reported as ND
Method Blank Below Detection Limit Reported as ND
Lab Control Sample 90%-110% Recovery All samples within limits.
Matrix Spike 70%-130% Recovery All samples within limits
Duplicate Analyses (All samples) < 25% RPD All samples within limits
6.2.4.6 PCDDs/PCDFs
Evaluation of the validity of the PCDD/PCDF data resultant from the analysis of the Method 0023A sampling train samples was based on the following criteria:
Recoveries of internal, pre-spike and alternate recovery standards added to the samples prior to sampling or sample extraction.
Results of analysis of an LCS / LCSD for the 17 PCDD/PCDF isomers listed in EPA Method 0023A.
Results of analyses of field and method blank samples.
On the basis of the QC results summarized in Table 6-8, no sample analyses were rejected, and all data were determined to be valid.
September 2006 J:\PROJECTS\05975_Shell\140\Trial Burn\Trial Burn Report\Shell Martinez TB Report R1_11_06.doc

6-8
Table 6-8 Overall QC Summary for PCDDs/PCDFs in Stack Gas Samples
QC Parameter Target Criteria Program Results
Field Blank Below detection limit ND for all but one (OCDF) of 17 congeners
Method Blank Below detection limit ND for all but one (OCDF) of 17 congeners
LCS / LCSD 70 – 130% recovery All congeners within limits
All labeled standards within limits. One slightly low recovery in the field blank, but S/N > 10:1
Accuracy for Internal Standards (IS) and alternate recovery standard (AS)
40 – 135% recovery
All labeled standards within limits. One slightly low recovery in the field blank, but S/N > 10:1
Accuracy for pre-spike recovery standards (PS)
70 – 130% recovery
6.2.4.7 PAHs
Evaluation of the validity of the PAH data resultant from the analysis of the Method 0023A/0010 samples was based on the following data quality objectives:
Recoveries of internal standards and an alternate recovery standard (added prior to sample extraction) and surrogate pre-spike standards (added prior to field sampling).
Results of analysis of two lab control samples for the 19 compounds listed in CARB Method 429.
Results of analysis of field and method blank samples for all target analytes.
On the basis of the results presented in Table 6-9, no sample analyses were rejected, and all results were determined to be valid. Completeness was therefore determined to be 100% for all results from the Method 0010 trains submitted for PAH analysis.
September 2006 J:\PROJECTS\05975_Shell\140\Trial Burn\Trial Burn Report\Shell Martinez TB Report R1_11_06.doc
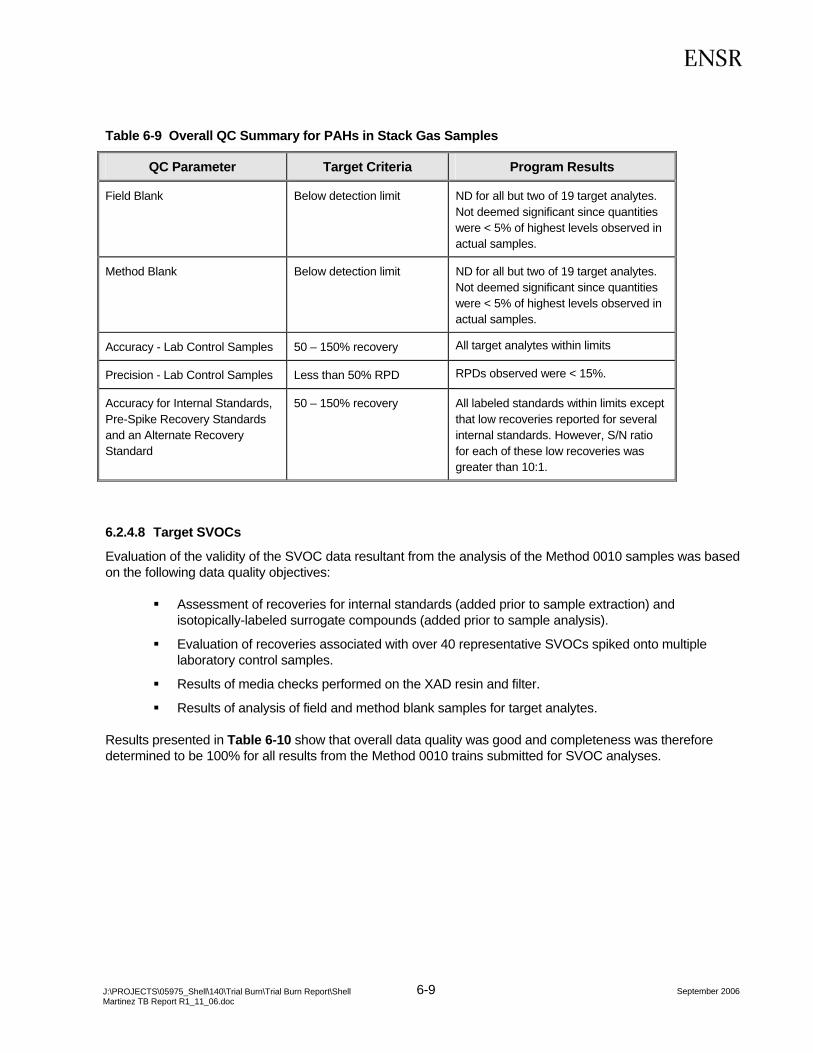
6-9
Table 6-9 Overall QC Summary for PAHs in Stack Gas Samples
QC Parameter Target Criteria Program Results
Field Blank Below detection limit ND for all but two of 19 target analytes. Not deemed significant since quantities were < 5% of highest levels observed in actual samples.
Method Blank Below detection limit ND for all but two of 19 target analytes. Not deemed significant since quantities were < 5% of highest levels observed in actual samples.
All target analytes within limits Accuracy - Lab Control Samples 50 – 150% recovery
RPDs observed were < 15%. Precision - Lab Control Samples Less than 50% RPD
Accuracy for Internal Standards, Pre-Spike Recovery Standards and an Alternate Recovery Standard
50 – 150% recovery All labeled standards within limits except that low recoveries reported for several internal standards. However, S/N ratio for each of these low recoveries was greater than 10:1.
6.2.4.8 Target SVOCs
Evaluation of the validity of the SVOC data resultant from the analysis of the Method 0010 samples was based on the following data quality objectives:
Assessment of recoveries for internal standards (added prior to sample extraction) and isotopically-labeled surrogate compounds (added prior to sample analysis).
Evaluation of recoveries associated with over 40 representative SVOCs spiked onto multiple laboratory control samples.
Results of media checks performed on the XAD resin and filter.
Results of analysis of field and method blank samples for target analytes.
Results presented in Table 6-10 show that overall data quality was good and completeness was therefore determined to be 100% for all results from the Method 0010 trains submitted for SVOC analyses.
September 2006 J:\PROJECTS\05975_Shell\140\Trial Burn\Trial Burn Report\Shell Martinez TB Report R1_11_06.doc

6-10
Table 6-10 Overall QC Summary for SVOCs in Stack Gas Samples
QC Parameter Target Criteria Program Results
Field blank – All Sample Fractions Below detection limit All analytes below detection limit
Method Blanks Below detection limit All analytes below detection limit
Accuracy – Spikes (LCS) Different % recovery range for each of the compounds spiked
All recoveries within specified limits, except low recoveries for aniline, benzoic acid and dimethyl phthalate
Precision – LCS / LCSD Different RPD goal for each compound evaluated. Target generally less than 40%.
All RPD values within specified limits
Accuracy – Recoveries for Internal Standards and Surrogates
Different % recovery range for each compound spiked
All but one surrogate recovery within limits
Media Checks Below detection limit All analytes below detection limit
6.2.4.9 Target Volatile Organics (Condition 2) and MCB (Condition 3)
Evaluation of the validity of the data resultant from the analysis of the VOST samples for volatile organics was based on the following indicators:
Recoveries of 4 surrogate compounds added to the VOST samples prior to analysis.
Replicate analysis of two traps spiked with standards (LCS samples).
Separate analysis of the front and back VOST tubes for pair “a” of each VOST set to determine whether compound breakthrough had occurred.
Results of analyses of field, trip and lab blank samples.
Results of analysis of an EPA audit cylinder presented by DTSC.
Due to the fact that so little condensate was collected (~ 1 mL) over the course of each run, a decision was made to not have these samples analyzed. It is also noted that the C2-R3 pair “a” tenax sample was received broken. Numerous samples from Condition 3 were also received broken and therefore the lab was instructed to analyze all available VOST cartridges. Only 3 different compounds exhibited breakthrough and this was only during Condition 2. This occurred 3 times for acetone and once each for chloromethane and methylene chloride. None of the compounds observed in the blanks or that exhibited breakthrough are deemed to be significant as they are common solvents used in the field or in the lab. Based on the overall results summarized in Table 6-11, completeness was therefore determined to be 100% for all VOST analyses.
September 2006 J:\PROJECTS\05975_Shell\140\Trial Burn\Trial Burn Report\Shell Martinez TB Report R1_11_06.doc

6-11
Table 6-11 Overall QC Summary for Volatile Organics in Stack Gas Samples
Condition 2 VOST Analyses --
QC Parameter Target Criteria Program Results
Field Blanks, Trip Blank and Method Blank
Below detection limit No compounds detected above RL
Lab Control Samples 50%-150% recovery All samples within control limits and good precision demonstrated (< 15% RPD).
Breakthrough Determination TX/C trap should contain < 75 ng or < 30% of amount on TX trap.
Breakthrough observed for acetone (3 times), chloromethane (once) and methylene chloride (once)
Accuracy-Surrogate Recoveries 50%-150% recovery All surrogate recoveries within limits
Condition 3 VOST Analyses –
QC Parameter Target Criteria Program Results
Field Blanks, Trip Blank and Method Blank
Below detection limit No compounds detected above RL
Lab Control Samples 50%-150% recovery All samples within control limits and good precision demonstrated (< 15% RPD).
Breakthrough Determination TX/C trap should contain < 75 ng or < 30% of amount on TX trap.
No breakthrough observed for MCB
Accuracy-Surrogate Recoveries 50%-150% recovery All surrogate recoveries within limits
Accuracy-EPA Audit Cylinder 50%-150% recovery Results submitted to DTSC. Status of reported results unknown.
September 2006 J:\PROJECTS\05975_Shell\140\Trial Burn\Trial Burn Report\Shell Martinez TB Report R1_11_06.doc
Appendix A Facility Process Monitoring Data
Daily CEM Calibration Data……….pg 3
Detailed Process Data Summaries……….pg 11
Test Condition 1 (June 6, 2006)……….pg 15
Test Condition 2 (June 7-9, 2006)……….pg 41
Test Condition 3 (June 13, 2006)……….pg 109
September 2006 J:\PROJECTS\05975_Shell\140\Trial Burn\Trial Burn Report\Shell Martinez TB Report R1_11_06.doc
Daily CEM Calibration Data
September 2006 J:\PROJECTS\05975_Shell\140\Trial Burn\Trial Burn Report\Shell Martinez TB Report R1_11_06.doc

Detailed Process Data Summaries
September 2006 J:\PROJECTS\05975_Shell\140\Trial Burn\Trial Burn Report\Shell Martinez TB Report R1_11_06.doc

Test Condition 1 (June 6, 2006)
September 2006 J:\PROJECTS\05975_Shell\140\Trial Burn\Trial Burn Report\Shell Martinez TB Report R1_11_06.doc
Test Condition 2 (June 7-9, 2006)
September 2006 J:\PROJECTS\05975_Shell\140\Trial Burn\Trial Burn Report\Shell Martinez TB Report R1_11_06.doc
Test Condition 3 (June 13, 2006)
September 2006 J:\PROJECTS\05975_Shell\140\Trial Burn\Trial Burn Report\Shell Martinez TB Report R1_11_06.doc

Appendix B Field Sampling Report The Avogadro Group, LLC
September 2006 J:\PROJECTS\05975_Shell\140\Trial Burn\Trial Burn Report\Shell Martinez TB Report R1_11_06.doc

Appendix C POHC Spiking Report Triad Chemicals, LLC
September 2006 J:\PROJECTS\05975_Shell\140\Trial Burn\Trial Burn Report\Shell Martinez TB Report R1_11_06.doc
Appendix D Field Sampling Documentation (ENSR)
Field Log……….pg 2
Field Data Sheets Associated with Waste Feed Stream Sampling……….pg 8
Detailed Listing of Sampling Parameters for All Test Conditions……….pg 12
Sample Shipment Documentation……….pg 31
September 2006 J:\PROJECTS\05975_Shell\140\Trial Burn\Trial Burn Report\Shell Martinez TB Report R1_11_06.doc

Field Log
September 2006 J:\PROJECTS\05975_Shell\140\Trial Burn\Trial Burn Report\Shell Martinez TB Report R1_11_06.doc

Field Data Sheets Associated with Waste Feed Stream Sampling
September 2006 J:\PROJECTS\05975_Shell\140\Trial Burn\Trial Burn Report\Shell Martinez TB Report R1_11_06.doc

Detailed Listing of Sampling Parameters for All Test Conditions
September 2006 J:\PROJECTS\05975_Shell\140\Trial Burn\Trial Burn Report\Shell Martinez TB Report R1_11_06.doc

Sample Shipment Documentation
September 2006 J:\PROJECTS\05975_Shell\140\Trial Burn\Trial Burn Report\Shell Martinez TB Report R1_11_06.doc

Appendix E Analytical Data Reports
STL-Knoxville: Waste Feed Analytical Results (Physical Parameters)……….pg 3
STL-Sacramento: Waste Feed Analytical Results (VOCs, SVOCs and Metals)……….pg 77
Enthalpy Analytical, Inc.: Carbonyl Compounds on Method 0011 Sampling Train...............pg 245
Alta Analytical Laboratories, Inc.: PCDDs/PCDFs and PAHs on Method 0023A Sampling Train……….pg 283
STL-Knoxville: Hexavalent Chromium on Method 0061 Sampling Train ……….pg 307
STL-Sacramento: Target SVOCs on Method 0010 Sampling Train; Metals on Method 29 Sampling Train and HCl, Cl2 and NH3 on Method 0050 Sampling Train...............pg 363
STL-Knoxville: Target VOCs (Condition 2) on Method 0030 Sampling Train...............pg 493
STL-Knoxville: MCB (Condition 3) and VOST Audit Results on Method 0030 Sampling Train ……….pg 612
September 2006 J:\PROJECTS\05975_Shell\140\Trial Burn\Trial Burn Report\Shell Martinez TB Report R1_11_06.doc

STL – Knoxville
Waste Feed Analytical Results (Physical Parameters)
September 2006 J:\PROJECTS\05975_Shell\140\Trial Burn\Trial Burn Report\Shell Martinez TB Report R1_11_06.doc

STL – Sacramento
Waste Feed Analytical Results (VOCs, SVOCs and Metals)
September 2006 J:\PROJECTS\05975_Shell\140\Trial Burn\Trial Burn Report\Shell Martinez TB Report R1_11_06.doc

Enthalpy Analytical, Inc.
Carbonyl Compounds on Method 0011 Sampling Train
September 2006 J:\PROJECTS\05975_Shell\140\Trial Burn\Trial Burn Report\Shell Martinez TB Report R1_11_06.doc

Alta Analytical Laboratories, Inc.
PCDDs/PCDFs and PAHs on Method 0023A Sampling Train
September 2006 J:\PROJECTS\05975_Shell\140\Trial Burn\Trial Burn Report\Shell Martinez TB Report R1_11_06.doc

STL – Knoxville
Hexavalent Chromium on Method 0061 Sampling Train
September 2006 J:\PROJECTS\05975_Shell\140\Trial Burn\Trial Burn Report\Shell Martinez TB Report R1_11_06.doc

STL – Sacramento
Target SVOCs on Method 0010 Sampling Train; Metals on Method 29 Sampling Train
and HCl, Cl2 and NH3 on Method 0050 Sampling Train
September 2006 J:\PROJECTS\05975_Shell\140\Trial Burn\Trial Burn Report\Shell Martinez TB Report R1_11_06.doc

Method 29 Metals Blank Correction Performed by ENSR
September 2006 J:\PROJECTS\05975_Shell\140\Trial Burn\Trial Burn Report\Shell Martinez TB Report R1_11_06.doc

STL-Knoxville
Target VOCs (Condition 2) on Method 0030 Sampling Train
September 2006 J:\PROJECTS\05975_Shell\140\Trial Burn\Trial Burn Report\Shell Martinez TB Report R1_11_06.doc
STL – Knoxville
MCB (Condition 3) and VOST Audit Results on Method 0030 Sampling Train
September 2006 J:\PROJECTS\05975_Shell\140\Trial Burn\Trial Burn Report\Shell Martinez TB Report R1_11_06.doc

Shell Martinez- Trial Burn Report Conditions 3 Disclaimer- The attachments are not posted at this time due to their large file size. These are available through the DTSC project manager.