tributary of river ganga in uttar pradesh, india
TRANSCRIPT

Page 1/25
Assessment of Surface Water Quality of River Kali-east: ATributary of River Ganga in Uttar Pradesh, IndiaVivek Rana ( [email protected] )
Central Pollution Control Board https://orcid.org/0000-0001-9442-4805
Research Article
Keywords: Biochemical oxygen demand, Constructed Wetlands, Dissolved oxygen, Environmental pollution, Industrialization, Riverwater quality
Posted Date: June 10th, 2021
DOI: https://doi.org/10.21203/rs.3.rs-591475/v1
License: This work is licensed under a Creative Commons Attribution 4.0 International License. Read Full License

Page 2/25
AbstractRiver Kali-East, a tributary of river Ganga, is a non-perennial river of India which is highly driven by the discharge of sewage andindustrial e�uent. Twenty-seven locations on the entire stretch (approx. 550 km) of river Kali-East were monitored which indicated thatcolor varied as 20-200 Hazen, dissolved oxygen (DO) as 0-8.16 mg/l, biochemical oxygen demand (BOD) as 6.6-410 mg/l, chemicaloxygen demand (COD) as 22-1409 mg/l, total suspended solids as 38-4386 mg/l, total dissolved solids as 180-2536 mg/l and fecalcoliform as 4.9 × 10² - 34 × 107 MPN/100 ml. High BOD and COD in the river revealed untreated/partially treated industrial dischargeinto the river and the self-puri�cation capacity of the river Kali-East has been inhibited for a long distance by heavy and undiminishedin�ux of domestic sewage into the river. Twenty-six drains discharge a total organic load of 148 tonnes per day into the river.Maximum pollution load was contributed by Odean Nala (42%) in Meerut district. This study recommends strict regulatory norms fordischarge of industrial e�uents by the industries in the catchment area of the river, reduction in sewage treatment gap by utilizingalternative treatment technologies (such as constructed wetlands) and proper dilution of polluted river water to improve the overallquality of the river.
1. IntroductionGanga is a perennial sacred river of India which is a life-line to millions who live on its course. Rapid urbanization and industrializationin the country is deteriorating the quality of river Ganga due to the increasingly high input of urban-industrial discharge (CPCB 2013).This increasing aquatic pollution is also affecting human health. In India, 80% of all diseases and 1/3rd of deaths were reported to beattributed to water-borne diseases (Puttick 2008). For abatement of pollution in river Ganga, the Government of India formulated theGanga Action Plan (GAP) in 1986 to reduce sewage discharge in the Ganga river. Thereafter, GAP phase II was launched in 1993 toreduce the pollution load through its tributaries. In 2009, the National Ganga River Basin Authority (NGRBA) was formed for cleaningand conservation of river Ganga. However, a nine-fold increase in the discharge of sewage into the river is observed in recent years incomparison to 1985 (Dwivedi et al. 2018). In India, there is a huge gap (65%) between sewage generation and treatment in India anduntreated sewage is being discharged into the river ecosystem (CPCB 2009).
Various researchers have assessed the water quality of river Ganga and its tributaries and the effects of anthropogenic activities onriver water quality (Mandal et al. 2009; Dwivedi et al. 2018). Haritash et al. (2016) found high fecal coliform levels at Rishikesh(Uttarakhand) whereas Matta et al. (2018) reported high levels of turbidity, total solids and suspended solids at Rishikesh(Uttarakhand). Chaudhary et al. (2017) reported high metal concentration in the Ganga river in the stretch from Haridwar to GarhMukteshwar. Siddiqui and Pandey (2019) reported high metal contents at Kanpur (Uttar Pradesh). Among tributaries of river Ganga,Mishra et al. (2015) reported the water of river Hindon un�t for human use, irrigation, and other life-supporting activities.Anthropogenic as well as natural factors degrade surface river waters and impair their use for drinking, industry, agriculture, recreation,and other purposes. This mandates a water quality monitoring program to safeguard freshwater resources (Pesce and Wunderlin2000). In the present study, the catchment area of the Kali-East river consists of sugar, textile, pulp & paper, dairy & food, distillery, andchemical industries. The industrial e�uents are characterized with high BOD, high COD, high amounts of organic and inorganiccontaminants. Some of the di�cult-to-treat pollutants such as chlorinated organics, suspended solids and organic wastes (releasedby pulp and paper mill e�uents), phenols and mineral oils (released by petrochemical industry), etc. are also among the releasedindustrial pollutants. These toxic industrial pollutants, if released untreated into the river stream, may degrade the quality of the riverseverely. These organic and inorganic pollutants are carcinogenic and cause serious physiological and neurological disorders (Ejaz etal. 2004; Pal et al. 2012).
The Hon’ble National Green Tribunal (NGT), Government of India stated that river water is considered to be �t for bathing when itmeets the criteria of having Biochemical Oxygen Demand (BOD) less than 3.0 mg/l, Dissolved Oxygen (DO) more than 5.0 mg/l andFaecal Coliform (FC) bacteria to be less than 500 MPN/100 ml (NGT 2019a). Also, Environment Protection (Amendment) Rules, 2000suggest pH 6.5–8.5, BOD ≤ 3 mg/l, DO ≥ 5 mg/l, and FC < 2500 MPN/100 ml as the primary water quality criteria for outdoor bathing.
Considering the pollution load in the river Ganga, there is a strong need to assess and regulate pollution sources in the river Ganga andits tributaries. River Kali-East (a tributary of river Ganga) is a non-perennial river driven by sewage and industrial e�uent discharge innon-rainy seasons. For assessing river pollution, studies are restricted to small stretches however for an e�cient management strategyto control river pollution there must be a comprehensive study. The study should encompass the monitoring of water qualitythroughout the river and assessment of pollution sources in river Kali-East due to the release of industrial and domestic wastewater.

Page 3/25
Considering these issues, the present study was carried out with following objectives: (i) to carry out a comprehensive evaluation ofsurface water quality of river Kali-East from its origin to the con�uence with river Ganga; and (ii) to evaluate the status of pollutionload and treatment in the catchment area of river Kali-East.
2. Materials And Methods
2.1. Description of the study areaKali-East river is a non-perennial tributary of the holy river Ganga in India. The �ow in the river is mainly due to industrial wastewaterdischarge or rainfall. It originates in Khatauli town (29°16'45.09"N, 77°47'18.96"E) in Muzaffarnagar district of Uttar Pradesh state ofIndia where the �ow in the river is attributed to a sugar mill drain. Thereafter, it traverses a distance of approximately 550 km throughthe districts of Meerut, Hapur, Ghaziabad, Bulandshahar, Aligarh and Kasganj in Uttar Pradesh. The river Kali-East meets river Ganga inKannauj district of Uttar Pradesh at 27°0'45.34"N, 79°59'6.76"E. In the catchment area of river Kali-East, various industries (sugar,distillery, chemical, pulp & paper, and textile) are located. Climate is humid sub-tropical with predominantly three seasons namelysummer season (March-May) which is extremely hot, winter season (November-February) which is cold and rainy season betweenJune and October. The temperature in the area varies from 0 to 50°C. The Bay of Bengal branch of the Indian monsoon is the majorbearer of rain in this area with an average annual rainfall of 840 mm. Approximately, 80% of the annual rainfall is received from thesouth-west monsoon during July to September.
Geologically, the study area lies within the Ganga-Yamuna inter�uve. The top stratum consists of approximately 1.3 km thick layer ofquaternary alluvium. Alluvial deposits are sub-divided into older and younger alluvium. Younger alluvium is restrained to riverpassages and the surroundings of the low-lying areas which is generally �ooded during the monsoon season. The alluvium in thisarea encompasses alternate beds of sand and clay with occasional inter-beds of calcareous concretions. The granular zones consistof various sand grades varying from �ne through medium to coarse sands (Singh 2004; Umar et al. 2008).
For the present study, 27 monitoring locations on river Kali-East were selected starting from its origin in Khatauli (Muzaffarnagar) to itscon�uence with river Ganga in Kannauj. During its course, 26 drains with different sources (domestic/industrial/mixed) meet with theriver. At two locations, freshwater Ganga canals (upper and lower Ganga canals) meet with the river which decreases the pollutionload in the river. The sampling locations on river Kali-East were selected in such a way so that the effect of the receiving wastewaterfrom drains on the river can be assessed. The sampling locations on the river, drains and freshwater canals are shown in Fig. 1 andSupplementary Figure S1.
2.2. Collection of river and drain samplesSurface river water samples were collected from 27 selected locations during the pre-monsoon season (March-May) of 2019. Thedetail of sampling locations on the river is presented in Table 1.

Page 4/25
Table 1Detail of sampling locations on river Kali-East
District Sampling Code Location Geographical coordinates
Latitude Longitude
Muzaffarnagar S1 Before con�uence of Sugar mill drain at Khatauli 29.279192 77.788599
S2 After con�uence of Sugar mill drain 29.278181 77.787853
S3 Downstream of Muzaffarnagar-Khatauli near Khadli Village 29.197999 77.799431
Meerut S4 Upstream of village Saini 29.056165 77.767262
S5 Downstream of village Saini 29.028941 77.792795
S6 Upstream of Abu drain-1 28.969660 77.774254
S7 Downstream of Abu drain-1 28.960122 77.765603
S8 After con�uence of Abu drain-2 28.9318893 77.756765
S9 Downstream of Odean Nala 28.921457 77.756156
Hapur S10 Upstream of Hapur drain-1 28.726175 77.831318
S11 Downstream of Hapur drain-1 28.695226 77.848477
S12 Downstream of Chhoiya drain 28.694523 77.850791
Ghaziabad S13 Downstream of Hapur drain 28.63685 77.814130
S14 Downstream of Kadrabad drain 28.625799 77.816904
S15 Downstream of Gulaothi drain 28.591529 77.824883
Bulandshahar S16 Upstream of Bulandshahar drains 28.420485 77.851609
S17 Upstream of Bulandshahar Devipura drain 28.413062 77.858749
S18 Downstream of Bulandshahar Devipura drain 28.412494 77.858969
S19 Downstream of Bulandshahar drains 28.39207 77.864000
Aligarh S20 Upstream of M/s Wave Distilleries and Breweries Ltd. 27.980513 78.199289
S21 Downstream of M/s Wave Distilleries and Breweries Ltd. 27.974796 78.207298
Kasganj S22 Downstream of Neem Nala 27.807538 78.543141
S23 Upstream of Kasganj drain 27.787246 78.627322
S24 Downstream of Kasganj drain 27.787246 78.627322
Kannauj S25 At Khudaganj bridge 27.177500 79.676667
S26 Upstream of Patta Nala 27.081433 79.927073
S27 Downstream of Patta Nala 27.080855 79.931004
Grab-samples were collected for physico-chemical (color, pH, DO, BOD, COD, TSS, TDS, Cl¯, NH3-N, NO3-N and PO42−) and biological
(total and fecal coliform) properties of river water. Samples for color, pH, COD, TSS, TDS, Cl¯, NH3-N, NO3-N, and PO42− were collected
in polyethylene bottles. Samples for DO, BOD, total and fecal coliform were collected in glass bottles. Sampling bottles for total andfecal coliform bacteria analysis were pre-sterilized with 70 % v/v ethanol before use. Samples for NH3-N were preserved with H2SO4,and DO & BOD samples were preserved with MnSO4 and NaN3. After collection, samples were transferred to the laboratory in an ice-box.
Wastewater samples were collected from 26 drains discharging into the river Kali-East. The detail of drains is shown in Table 2.

Page 5/25
Table 2List of drains discharging wastewater in to river Kali-East in India
Catchment area Sampling Code Drains Source of pollution Coordinates of the sampling point
Latitude Longitude
Muzaffarnagar D1 Sugar mill drain Mixed 29.277512 77.771723
Meerut D2 Village Saini drain Mixed 29.045227 77.785281
D3 Abu Nala-1 Mixed 28.974999 77.760229
D4 Abu Nala-2 Mixed 28.938786 77.753759
D5 Odean Nala Mixed 28.932410 77.749792
D6 Chhoiya drain Mixed 28.712963 77.862721
Hapur D7 Hapur drain Mixed 28.642790 77.804845
D8 Hapur city drain Domestic 28.726201 77.829546
Ghaziabad D9 Kadrabad drain Mixed 28.635293 77.804746
Gulaothi D10 Gulaothi drain Mixed 28.591294 77.803061
Bulandshahar D11 DM colony drain Domestic 28.419883 77.85176
D12 Behind chamunda mandir drain Domestic 28.417103 77.853463
D13 Devipura drain Domestic 28.412642 77.858481
D14 Behind shanidev mandir drain Domestic 28.409911 77.860892
D15 Faisalabad drain Mixed 28.409000 77.864000
D16 Kasaiwada drain Domestic 28.407526 77.862330
D17 Nahsal ghat drain Domestic 28.404597 77.866333
D18 Cheel ghat drain Domestic 28.400653 77.866675
D19 Chandbhari road Nala Domestic 28.399883 77.865031
D20 Adil Nala Domestic 28.396225 77.862753
D21 Maman road drain Mixed 28.392665 77.863288
Kasganj D22 Neem Nala Domestic 27.808402 78.540834
D23 Kasganj drain Domestic 27.796154 78.652609
Kannauj D24 Patta Nala Mixed 27.080536 79.927143
D25 Adanga Nala Domestic 27.063611 79.944722
D26 Tammi Nala Domestic 27.051085 79.929433
Wastewater samples from drains were collected before the con�uence point of the drain with the river Kali-East. Samples werecollected using grab sampling technique for the determination of physico-chemical (color, pH, BOD, COD, TSS, TDS, NH3-N and NO3-N)and biological (total and fecal coliform) properties of river water. Samples for color, pH, BOD, COD, TSS, TDS, NH3-N and NO3-N werecollected in polyethylene bottles. Samples for DO, total and fecal coliform were collected in glass bottles. Samples for NH3-N werepreserved with H2SO4, and DO samples were preserved with MnSO4 and NaN3. After collection, samples were transferred to thelaboratory in an ice-box.
For metal analysis, grab samples of water/wastewater from the river and drains in polypropylene bottles were also collected. Thesamples were immediately acidi�ed with HNO3 after collection to avoid precipitation.
2.3. Analysis of river and drain samples

Page 6/25
After reaching the laboratory, river/drain samples were analyzed for physico-chemical and biological parameters following standardmethods (APHA 2017). Metal (As, Cd, Cr, Cu, Fe, Pb, Mn, Ni, Hg, Zn, Sb, Co, Se, and V) concentration in water/wastewater samples ofriver and drains was measured using atomic absorption spectrophotometer following standard protocols (APHA 2017).
2.4. Calculations
2.4.1. Flow measurement in drainsThe �ow of wastewater in drains was measured using Ball-�oat method (CPHEEO 2013). Instantaneous �ow in drains was calculatedas
Where Q was measured in m3/sec; A is the average cross-sectional area of �ow in m2; V is the average velocity of �ow in m/sec.
The average cross-sectional area of �ow was calculated as
where the average cross-sectional area of �ow was measured in m3/sec; W and D are width and depth of the �ow measured in m.
Width, Depth, and average surface velocity are measured thrice and average values were considered for further calculation of �ow.
As �ow velocity is not identical in the entire cross-section of the drain, suitable correction factors were applied so that �ow is notexaggerated/over-estimated (Subramanya 2009). A factor of 0.8 was used for averaging velocity and �ow width. Therefore, theresulting factor (0.8 × 0.8) ~ 0.65 was considered for �ow calculation in natural drains.
2.4.2. Organic load of drainsOrganic load in drains was calculated as
where TPD is tonnes per day and MLD is million litres per day.
1.1. Quality assurance and quality controlReliable results were guaranteed by following appropriate quality assurance protocols and procedures during sample collection,preservation, and analysis. Bottles were acid washed before the collection of samples. Samples were transported in ice-boxes toensure data representativeness. The analytical quality was assured by using duplicate samples, reagent, and procedural blanks. Theatomic absorption spectrophotometer was calibrated after every �ve readings using blank and drift reagents. High calibrationcoe�cients were maintained (r2 ≥ 0.99) during the analysis of metals. For each metal, the limit of detection was calculated as thricethe standard deviation of blank samples.
3. Results And Discussion
3.1. River water quality
3.1.1. Physico-chemical properties of surface water of riverThe river Kali-East originates in Khatauli town in the Muzaffarnagar district of Uttar Pradesh. The river �ows for approximately 550 kmbefore meeting river Ganga in Kannauj. During the time of sampling (March-May), the river was not receiving any water due toprecipitation and the river Kali-East primarily carried sewage and industrial discharge. The physico-chemical properties of the riverwater are driven by the discharge of sewage and industrial e�uents from sugar, distillery, chemical, food & dairy, pulp & paper,slaughter house and textile industries in the catchment area. The sugar industries only operate seasonally however, other industriesrun throughout the year.
Flow (Q) = A × V
Averagecross − sectionalareaofflow (A) = W × D
Organicload (inTPD) =Flow (inMLD) × BOD(inmg/l)
1000

Page 7/25
In river water, the color varied as 20–200 Hazen, DO as 0-8.16 mg/l, BOD as 6.6–410 mg/l, COD as 22-1409 mg/l, TSS as 38-4368mg/l, TDS as 180–2536 mg/l, Cl¯ as 27–845 mg/l, NH3-N as 1.5–77.4 mg/l, NO3-N as 0.1–5.8 mg/l and PO4-P as 0.2–5.2 mg/l. Thephysico-chemical properties of river water at 27 selected monitoring locations are presented in Table 3.

Page 8/25
Table 3Physico-chemical properties of surface water of river Kali-East in India
Samplingcode
Monitoringlocation onriver
Parameter
Color pH DO BOD COD TSS TDS Cl¯ NH3-N
NO3-N
PO4-P
TC FC
S1 Beforecon�uence ofSugar milldrain atKhatauli
Dry - -
S2 Aftercon�uence ofSugar milldrain
30 4.9 0 410 1070 259 1094 142 3.9 1.6 2.2 7 ×10⁵
22×104
S3 Downstream ofMuzaffarnagar-Khatauli nearKhadli Village
51 7.3 0 78 167 88 1120 199 13.5 4.4 4.2 28×103
14×103
S4 Upstream ofSaini village
Dry - -
S5 Downstream ofSaini village
bdl 6.7 0 132 421 254 2536 845 13.4 2.2 1 46×105
31×105
S6 Upstream ofAbu drain-1
bdl 7.2 0 80 246 132 2376 781 12.6 1.4 1.1 22×104
45×103
S7 Downstream ofAbu drain-1
bdl 7.6 0 146 289 177 1176 316 77.4 3.9 3.4 16×106
92×105
S8 Aftercon�uence ofAbu drain-2
bdl 7.1 0 130 375 411 708 113 27.2 0.8 3.4 54×107
22×107
S9 Downstream ofOdean Nala
bdl 7.0 0 154 474 765 608 96 29.7 0.6 3.8 2 ×10⁹
17×107
S10 Upstream ofHapur drain-1
200 7.3 0 80 778 466 804 121 54.2 1.4 4.9 13×108
34×107
S11 Downstream ofHapur drain-1
143 7.2 0 49 555 280 752 126 64 2.5 4.5 49×106
49×106
S12 Downstream ofChhoiya drain
178 7.2 0 86 1074 226 752 118 49 2.4 4.1 11×106
11×106
S13 Downstream ofHapur drain
154 7.2 0 92 469 265 836 146 55.8 2.6 5.2 33×105
33×105
DO dissolved oxygen, BOD biochemical oxygen demand, COD chemical oxygen demand, TSS total suspended solids, TDS totaldissolved solids, Cl¯ chloride, NH3-N ammoniacal nitrogen, NO3-N nitrate, PO4-P phosphate, TC total coliform, FC fecal coliform
All parameters are presented in mg/l except colour (Hazen), pH, TC (MPN/100 ml), and FC (MPN/100 ml)
bdl below detection limit
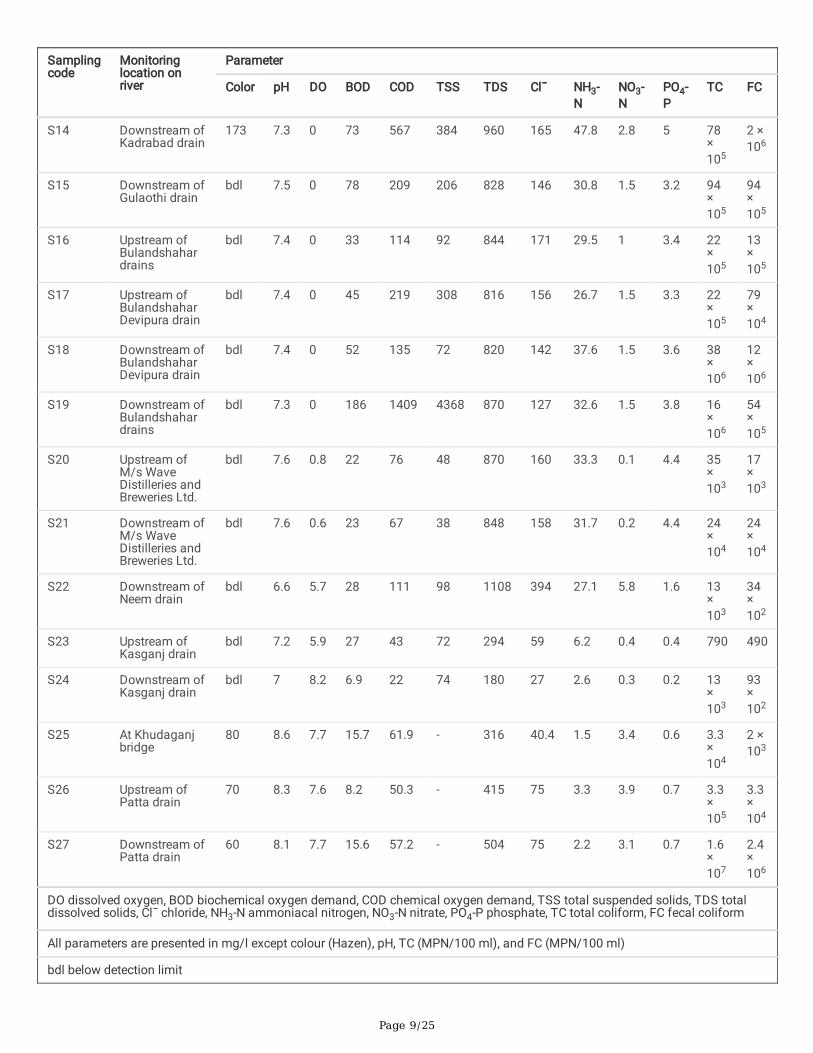
Page 9/25
Samplingcode
Monitoringlocation onriver
Parameter
Color pH DO BOD COD TSS TDS Cl¯ NH3-N
NO3-N
PO4-P
TC FC
S14 Downstream ofKadrabad drain
173 7.3 0 73 567 384 960 165 47.8 2.8 5 78×105
2 ×10⁶
S15 Downstream ofGulaothi drain
bdl 7.5 0 78 209 206 828 146 30.8 1.5 3.2 94×105
94×105
S16 Upstream ofBulandshahardrains
bdl 7.4 0 33 114 92 844 171 29.5 1 3.4 22×105
13×105
S17 Upstream ofBulandshaharDevipura drain
bdl 7.4 0 45 219 308 816 156 26.7 1.5 3.3 22×105
79×104
S18 Downstream ofBulandshaharDevipura drain
bdl 7.4 0 52 135 72 820 142 37.6 1.5 3.6 38×106
12×106
S19 Downstream ofBulandshahardrains
bdl 7.3 0 186 1409 4368 870 127 32.6 1.5 3.8 16×106
54×105
S20 Upstream ofM/s WaveDistilleries andBreweries Ltd.
bdl 7.6 0.8 22 76 48 870 160 33.3 0.1 4.4 35×103
17×103
S21 Downstream ofM/s WaveDistilleries andBreweries Ltd.
bdl 7.6 0.6 23 67 38 848 158 31.7 0.2 4.4 24×104
24×104
S22 Downstream ofNeem drain
bdl 6.6 5.7 28 111 98 1108 394 27.1 5.8 1.6 13×103
34×102
S23 Upstream ofKasganj drain
bdl 7.2 5.9 27 43 72 294 59 6.2 0.4 0.4 790 490
S24 Downstream ofKasganj drain
bdl 7 8.2 6.9 22 74 180 27 2.6 0.3 0.2 13×103
93×102
S25 At Khudaganjbridge
80 8.6 7.7 15.7 61.9 - 316 40.4 1.5 3.4 0.6 3.3×10⁴
2 ×10³
S26 Upstream ofPatta drain
70 8.3 7.6 8.2 50.3 - 415 75 3.3 3.9 0.7 3.3×10⁵
3.3×10⁴
S27 Downstream ofPatta drain
60 8.1 7.7 15.6 57.2 - 504 75 2.2 3.1 0.7 1.6×10⁷
2.4×10⁶
DO dissolved oxygen, BOD biochemical oxygen demand, COD chemical oxygen demand, TSS total suspended solids, TDS totaldissolved solids, Cl¯ chloride, NH3-N ammoniacal nitrogen, NO3-N nitrate, PO4-P phosphate, TC total coliform, FC fecal coliform
All parameters are presented in mg/l except colour (Hazen), pH, TC (MPN/100 ml), and FC (MPN/100 ml)
bdl below detection limit

Page 10/25
The color of water in�uences the photosynthesis process due to differential penetration of light, energy budget, strati�cation due tothermal gradients, and the aesthetic appearance of the aquatic ecosystems (Branco and Torgersen 2009). Color is a prominent featureof natural water when good quality water is produced from it for domestic and industrial purposes (Chow et al. 2007). In �ltered water,the color chie�y arises from the dissolved organic carbon (fraction of total organic carbon) and ferric iron (Fe (III)) bound on it(Weyhenmeyer et al. 2014). The temperature drives certain chemical and biological reactions taking place in water and aquaticorganisms (Shrivastava and Patil 2002). The pH rigorously affects the water quality by changing the alkalinity, the solubility of metalsand hardness of the water (Osibanjo et al. 2011; Sener et al. 2017). The pH is driven by several factors such as aerosol and dustparticles, dissolved materials, human-made wastes as well as wastes from plants through photosynthesis (Mitra et al. 2018).
The dissolved oxygen governs the metabolism of the biological community in an aquatic ecosystem and indicates the trophic statusof a water body (Saksena et al. 2008). The dissolved oxygen reduces in the water due to respiration of biota, decomposition of organicmatter, rise in temperature, oxygen demanding wastes and inorganic reductants such as hydrogen sul�de, ammonia, nitrates, ferrousiron, etc. (Sahu et al. 2000). Dissolved oxygen is frequently used to evaluate the water quality in reservoirs, bays, and rivers (Sanchezet al. 2007). In a study conducted by Rudolf et al. (2002) on water quality of San Vicente Bay (Chile), the dissolved oxygen contentwas considered as an index of water quality to assess the in�uence of industrial and municipal e�uents on aquatic ecosystems.
Dissolved oxygen content and biochemical oxygen demand are greatly in�uenced by a combination of physical, chemical, andbiological properties of oxygen demanding substances, encompassing algal biomass, dissolved organic matter, ammonia, volatilesuspended solids, and sediment oxygen demand (Quinn et al. 2005; Kannel et al. 2007). Biochemical oxygen demand accounts for theextent of organic pollution in aquatic ecosystems (Khan et al. 2016). The oxygen requirement during the decomposition of organicmatter and oxidation of inorganic chemicals is predicted through COD tests. Theoretically, if COD concentration is higher, then thewater is considered polluted (Amneera et al. 2013).
Nitrates are the most thermodynamically stable and non-toxic form of inorganic nitrogen as it is the end product of the aerobicdecomposition of the organic nitrogenous compound (Jaji et al. 2007). The nitrate concentration in the surface water is normally low(0–18 mg/l) however it may reach to elevated levels due to agricultural runoff (excess application of nitrogenous fertilizers andmanures), oxidation of nitrogenous waste products in human and animal excreta and refuse dump runoff (Pillay and Olaniran 2016;Mitra et al. 2018). The excess nitrogen transported as nitrate-nitrogen to rivers leads to eutrophication and episodic and persistenthypoxia (dissolved oxygen < 2 mg/l) (Mitsch et al. 2005). The existence of chloride in river water is due to the organic waste in water,primarily of animal origin. Also, major sources of phosphate in river water are domestic sewage, agricultural e�uents and industrialwastewaters (Saksena et al. 2008). The properties of surface water in Indian rivers are shown in Table 4.

Page 11/25
Table 4Properties of surface water in rivers in India and in the present study
Location River Year Parameter Reference
pH DO BOD COD TDS Cl NO3
Rishikesh (India) Ganga 2008 9-10.5
7.8–16.1
4.3–19.5
- 18–85 10-32.5
- Haritash et al.(2014)
Haridwar (India) Ganga 2012-13
6.9-8
- 2.1–2.9
4.6–6.8
- - 0.02–0.04
Matta et al.(2017)
Haridwar to GarhMukteshwar (India)
Ganga 2014-15
7.1–8.9
1.2–9.3
2–87 19–791
108.6–1743
- 1.7–15.8
Chaudhary etal. (2017)
Kolkata (India) Ganga 2005-06
6.7–7.3
- 35.1–121
129–342
40–78 - - Aktar et al.(2010)
Uttarakhand and UttarPradesh (India)
Ramganga 2014 7.3 - 15 29.4 22.2 8.6 4.7 Khan et al.(2016)
Ramganga (India) Ramganga 2014-15
7.2–8.3
0.2–9.2
0.6–46.3
3-229
27.2-619.1
3.7–27.8
- Gurjar andTare (2019)
Gomti (India) Gomti 2002-03
7.5–8.9
0.5-9 1.8–19
8.7–54
213–275
5–14
- Singh et al.(2005)
Uttar Pradesh (India) Gandak 2006 6.2–8.6
- - - 60.1-192.6
3.5–121
14–38
Bhardwaj etal. (2010)
Uttar Pradesh (India) Kali-East 2019 4.9–8.6
0-8.2 6.9–410
22-1409
180–2536
27–845
0.1–4.4
Present study
DO dissolved oxygen, BOD biochemical oxygen demand, COD chemical oxygen demand, TDS total dissolved solids, Cl¯ chloride,NO3 nitrate
All parameters are expressed in mg/l except pH
In the present study, the river was highly polluted until approximately 143 km downstream from the origin of the river. In this stretch(Muzaffarnagar to Bulandshahar district), DO was NIL and BOD was high (up to 410 mg/l). However, after the mixing of the upper andlower Ganga canal in the polluted water of the river Kali-East, the water quality improved (DO increased and BOD decreased). The DOlevel increased to 7.7 mg/l and BOD decreased to 15.6 mg/l before meeting the river Ganga.
In Muzaffarnagar district, high BOD (410 mg/l), COD (1070 mg/l) and TDS (1094 mg/l) in the river water downstream sugar mill drainwere observed. Also, low pH (4.9) in river water indicates industrial discharge from near-by industries. In Meerut district, pronouncedfoul smell around the river was observed D/s Chhoiya drain and Hapur drain. The color of the river water at these locations varied as154–178 Hazen. The foul smell in the river water may be attributed to anaerobic decomposition of organic matter present in the river.Also, it was observed that river water U/s Chhoiya drain, D/s Chhoiya drain, and D/s Hapur drain is being utilized for irrigation ofadjoining agricultural �elds. Irrigation of agricultural �elds with the polluted river water may deteriorate human health due to the bio-ampli�cation of pollutants to the human food chain. In Bulandshahar district, the river water quality (BOD-186 mg/l, COD-1409 mg/l)deteriorated after the discharge of 11 drains into the river. Till Bulandshahar, there is no DO in the river. However, after traversing adistance of approximately 143 km, the river meets upper Ganga canal and the river water quality improved substantially (DO-0.8 mg/l,BOD-22 mg/l, and COD-76 mg/l) at U/s Wave Distilleries and Breweries Ltd., Aligarh after meeting the canal. In Aligarh district, the riverfurther meets another canal i.e. lower Ganga canal and the river water quality after meeting the canal improved further (DO-5.9 mg/land fecal coliform-490 MPN/100 ml) at U/s Kasganj drain. In Kannauj district, the DO in the river Kali-East increased to 7.7 mg/lbefore the con�uence with river Ganga.
3.1.2 DO-sag curveThe DO-sag curve in the river Kali-East is presented in Fig. 2. Considering bathing water quality criteria (pH 6.5–8.5, DO ≥ 5 mg/l, BOD ≤ 3 mg/l, and FC < 500 MPN/100 ml), the water quality of the river Kali-East was found complying with bathing water standards w.r.t.pH except for one location namely, U/s Sugar mill drain in Muzaffarnagar. Low pH (4.9) in the river at this location may be attributedto the discharge of untreated e�uent from near-by sugar industries. With respect to DO, no location in the stretch from Muzaffarnagarto Aligarh was found suitable for bathing. Due to the mixing of freshwater from the Ganga canal in the river Kali-East, the water quality

Page 12/25
in Kasganj and Kannauj before meeting the river Ganga was meeting the primary water quality criteria w.r.t. DO. Also, no location in thewhole stretch of the river meets bathing water quality w.r.t. BOD. High BOD in the river is due to the discharge of untreated domesticsewage and industrial e�uents from the catchment area.
For fecal coliform, only two locations, namely, (i) U/s Kasganj drain in Kasganj and (ii) at Khudaganj bridge in Kannauj were meetingbathing water quality standards.
3.1.3 Biological properties of surface water of riverTotal coliform (TC) and fecal coliform (FC) levels in surface water of the river were estimated (Table 3). In river water, the total coliformvaried from 790 to 2 × 10⁹ MPN/100 ml and fecal coliform varied from 490 to 34 × 107 MPN/100 ml. Fecal pollution in river watercould be caused by untreated sewage, fecal bacteria remaining in the treated wastewater, and feces of wild and farmed animals.Moreover, open defecation along the banks of the river could also be the reason for elevated fecal coliform concentrations in riverwater (Bravo et al. 2017; Singh and Saxena 2018; Haque et al. 2019). The stretch of river from Muzaffarnagar to Bulandshaharcontained high total and fecal coliform levels due to the discharge of untreated domestic sewage from the drains. However, aftermeeting the upper Ganga canal and lower Ganga canal in Aligarh, the total coliform and fecal coliform levels in river water at U/sKasganj drain reached 790 and 490 MPN/100 ml, respectively. The total and fecal coliform concentration in surface water of the riverKali-East before the con�uence with river Ganga were 2.8 × 10⁸ and 9.4 × 10⁶ MPN/100 ml. The discharge of high levels of coliformsby the river Kali-East into the river Ganga increases the fecal pollution load in river Ganga which could have adverse effects on thepopulation dependent on the water of the river Ganga for drinking and cooking purposes.
3.1.4 Metals concentration in surface water of riverMetals (As, Cd, Cr, Cu, Fe, Pb, Mn, Ni, Hg, Zn, Sb, Co, Se, and V) concentration in surface river water samples are shown in Table 5.

Page 13/25
Table 5Metal concentration (mg/l) in surface river water collected from different locations on river Kali-East in India
Location Metals
As Cd Cr Cu Fe Pb Mn Ni Hg Zn Sb Co Se V
S1 Dry
S2 bdl bdl 0.02 0.08 15.70 0.11 0.28 0.01 bdl 0.14 bdl bdl bdl bdl
S3 bdl bdl bdl bdl 1.96 bdl 0.25 bdl bdl 0.02 bdl bdl bdl bdl
S4 Dry
S5 bdl bdl bdl 0.02 1.75 0.01 0.21 bdl bdl 0.07 bdl bdl bdl bdl
S6 bdl bdl bdl 0.01 0.73 bdl 0.13 bdl bdl 0.06 bdl bdl bdl bdl
S7 bdl bdl bdl 0.13 2.87 0.02 0.17 bdl bdl 0.10 bdl bdl bdl bdl
S8 bdl 0.15 0.09 0.36 10.52 0.09 0.32 0.11 bdl 1.02 bdl bdl bdl bdl
S9 bdl 0.05 0.05 0.25 11.32 0.07 0.29 0.05 bdl 0.65 bdl bdl bdl 0.06
S10 bdl 0.03 0.04 0.13 5.17 0.03 0.25 0.04 bdl 0.42 bdl bdl bdl bdl
S11 bdl 0.04 0.06 0.17 7.44 0.05 0.28 0.05 bdl 0.5 bdl bdl bdl bdl
S12 bdl 0.02 0.03 0.09 3.46 0.03 0.24 0.03 bdl 0.28 bdl bdl bdl bdl
S13 bdl 0.02 0.03 0.1 4.19 0.03 0.25 0.03 bdl 0.3 bdl bdl bdl bdl
S14 bdl 0.02 0.03 0.08 3.89 0.02 0.26 0.02 bdl bdl bdl bdl bdl 0.06
S15 bdl 0.02 0.02 0.07 3.63 0.02 0.22 0.02 bdl 0.22 bdl bdl bdl bdl
S16 bdl bdl bdl 0.03 1.82 bdl 0.21 bdl bdl 0.13 bdl bdl bdl bdl
S17 bdl 0.02 0.03 0.11 7.31 0.03 0.29 0.03 bdl 0.32 bdl bdl bdl 0.05
S18 bdl bdl bdl 0.03 1.15 0.01 0.21 bdl 0.11 bdl bdl bdl bdl bdl
S19 bdl 0.10 0.19 0.77 67.6 0.32 0.89 0.17 bdl 1.96 bdl 0.03 bdl 0.17
S20 bdl bdl bdl bdl 1.16 bdl 0.26 bdl bdl 0.03 bdl bdl bdl bdl
S21 bdl bdl bdl bdl 1.08 bdl 0.33 bdl bdl 0.04 bdl bdl bdl bdl
S22 bdl bdl bdl bdl 2.38 bdl 0.31 bdl bdl BDL 0.01 bdl bdl bdl
S23 bdl bdl bdl bdl 1.69 bdl 0.09 bdl bdl 0.01 bdl bdl bdl bdl
S24 bdl bdl bdl bdl 3.33 bdl 0.10 bdl bdl 0.02 bdl bdl bdl bdl
S25 bdl bdl bdl bdl bdl bdl bdl 0.08 bdl bdl bdl bdl bdl bdl
S26 bdl 0.01 bdl bdl bdl bdl bdl 0.08 bdl bdl bdl bdl bdl bdl
S27 bdl bdl bdl bdl bdl bdl bdl 0.12 bdl bdl bdl bdl bdl bdl
bdl below detection limit
Metals concentrations (mg/l) ranged as Cd bdl (below detection limit)-0.15, Cr bdl-0.19, Cu bdl-0.77, Fe bdl-15.7, Pb bdl-0.32, Mn bdl-0.89, Ni bdl-0.17, Hg bdl-0.11, Zn bdl-1.96, Sb bdl-0.01, Co bdl-0.03 and V bdl-0.17. Arsenic and Selenium were not found in river water.Metals in river water may be attributed to the discharge of untreated sewage from the catchment areas into the river. Also, thedischarge of untreated/improperly treated industrial wastewater could also release toxic metals into the river water. The sources ofmetals such as Cd, Cr, and Cu are reported to be domestic as well as commercial (ATSDR 2012; Masood and Malik 2011). Apart fromdomestic wastewater, the catchment area of the river Kali-East comprises of several industries pertaining to sugar, textile, pulp & paper,dairy & food, distillery, and chemical sectors. These industries may also contribute to metal pollution in the river Kali-East. For e.g.,textile wastewater consists of Cu, Fe, Mn, Pb, Zn, Cd, and Cr (Fenta 2014; Oyebamiji et al. 2019), and distillery wastewater contains Cu,

Page 14/25
Cr, Zn, Fe, Ni, Mn, and Pb (Chowdhary et al. 2018). The composition of wastewater generated by food and dairy and chemicalindustries depends upon the product-speci�c raw materials.
3.2 Pollution load due to drainsTwenty-six drains (domestic and industrial) discharge wastewater into the river Kali-East accounting for total �ow and an organic loadof 803 MLD and 148 tonnes per day, respectively. Odean Nala is the major contributor in terms of pollution load (42%). Two drainsnamely the Odean Nala (25%) and Abu Nala-2 (25%) accounted for 50% of the total wastewater being discharged into the river. Thedistrict-wise distribution of drains contributing pollution load into the river Kali-East is presented in Fig. 3. Out of the eight districts, themaximum number of drains are observed in Bulandshahar i.e. 11, however, the maximum pollution load was contributed by Meerut i.e.67.7 % of the total pollution load on the river Kali-East.
[Insert Fig. 3 here]
In drains, the color varied as 37–317 Hazen, pH as 5.1–8.2, BOD as 21.8–1067 mg/l, COD as 104–1752 mg/l, TSS as 48–946 mg/l,TDS as 552–2572 mg/l, NH3-N as 5–82 mg/l and NO3-N as 0.7–4.6 mg/l. The physico-chemical properties of wastewater in drainsmeeting river Kali-East are shown in Table 6.

Page 15/25
Table 6Physico-chemical properties of wastewater in drains meeting river Kali-East in India
Samplingcode
Name of drain Parameter
Flow Organic
load
Colour pH BOD COD TSS TDS NH3-N
NO3-N
TC FC
D1 Sugar milldrain
20.6 22 52 5.1 1067 1752 946 1296 5 1.9 45 ×104
45 ×104
D2 Village Sainidrain
33.4 12.9 317 7.8 385 893 346 2572 6 3.2 17 ×105
61 ×104
D3 Abu drain-1 82.5 7.7 120 7.9 93 405 215 1248 82 4.6 16 ×106
92 ×105
D4 Abu drain-2 199.2 17.7 87 6.5 89 401 265 780 39 1.5 94 ×106
26 ×106
D5 Odean drain 200 62.2 120 7.2 311 721 498 1008 14 2.9 17 ×107
17 ×107
D6 Chhoiya drain 21.8 0.6 70 7.9 27 119 48 1132 23 1.4 46 ×104
24 ×104
D7 Hapur drain 34.6 2.3 226 7.6 67 251 129 1136 35 2.5 54 ×105
35 ×105
D8 Hapur citydrain
1.2 0.1 102 7.6 75 210 51 1004 28 3.7 16 ×106
54 ×105
D9 Kadrabaddrain
35.5 3.1 166 7.6 88 226 54 1204 26 2.3 7 ×10⁶
33 ×105
D10 Gulaothi drain 54 8.1 75 7.3 150 498 654 872 36 1.5 92 ×107
92 ×107
D11 Maman roaddrain
36 2.0 76 7.3 56 201 483 552 21 0.8 54 ×106
35 ×106
D12 Aadil nagardrain
11.4 1.7 81 7.3 146 411 463 848 20 1.9 54 ×106
35 ×106
D13 Chandbhariroad drain
5.6 1.0 97 7.1 173 597 503 1016 26 2.7 16 ×1010
94 ×108
D14 Cheel ghatdrain
3.5 0.2 187 7.6 46 160 96 1012 24 1.0 22 ×107
11 ×107
D15 Nahsal ghatdrain
2.5 0.4 87 7.7 178 575 478 828 12 1.9 54 ×1010
54 ×1010
D16 Kasaiwadadrain
- - 72 7.4 158 564 475 1104 17 1.6 17 ×107
6 ×10⁷
D17 Faisalabaddrain
16.2 3.4 114 7.1 207 482 227 1060 32 2.7 28 ×106
12 ×106
BOD biochemical oxygen demand, COD chemical oxygen demand, TSS total suspended solids, TDS total dissolved solids, NH3-Nammoniacal nitrogen, NO3-N nitrate, TC total coliform, FC Fecal coliform
All parameters are presented in mg/l except �ow (million litres per day), organic load (tonnes per day), colour (Hazen), pH, TC(MPN/100 ml), and FC (MPN/100 ml)
Flow in drains D16 was very low (not measurable), D18 was covered with municipal solid waste, stagnant wastewater was presentin D19 and D22 was dry

Page 16/25
Samplingcode
Name of drain Parameter
Flow Organic
load
Colour pH BOD COD TSS TDS NH3-N
NO3-N
TC FC
D18 Behindshanidevmandir drain
- - 37 8.2 54 194 224 660 14 0.7 17 ×106
12 ×106
D19 Devipura drain - - 70 7.4 92 245 139 672 21 1.4 35 ×108
24 ×107
D20 Behindchamundamandir drain
20.7 1.8 97 7.2 89 261 285 612 20 1.3 35 ×106
17 ×106
D21 DM colonydrain
3.5 0.2 57 7.5 69 239 350 560 22 1.3 12 ×108
82 ×107
D22 Neem drain - - - - - - - - - - - -
D23 Kasganj drain 4.8 0.4 67 7.1 78 221 98 700 24 1.5 16 ×106
16 ×106
D24 Patta drain 11.5 0.3 50 7.7 21.8 104 58.1 780 23.3 1.8 4.5×10⁵
2.0×10⁵
D25 Adanga drain 4 0.2 40 7.2 50.4 207 437 666 12.6 1.4 2.2×10⁸
9.4×10⁷
D26 Tammi drain 1.2 0.1 50 7.4 53.2 183 376 702 20.3 1.6 2.8×10⁸
9.4×10⁶
BOD biochemical oxygen demand, COD chemical oxygen demand, TSS total suspended solids, TDS total dissolved solids, NH3-Nammoniacal nitrogen, NO3-N nitrate, TC total coliform, FC Fecal coliform
All parameters are presented in mg/l except �ow (million litres per day), organic load (tonnes per day), colour (Hazen), pH, TC(MPN/100 ml), and FC (MPN/100 ml)
Flow in drains D16 was very low (not measurable), D18 was covered with municipal solid waste, stagnant wastewater was presentin D19 and D22 was dry
High BOD (1067 mg/l), high COD (1752 mg/l), and acidic pH (5.1) were observed in the Sugar mill drain which indicated theuntreated/partially treated industrial discharge into the river. Saini Village drain consisted of high BOD (385 mg/l) and high COD (893mg/l) which may be attributed to the discharge of wastewater from paper industries in the catchment area. Also, Odean Nalacomprised BOD-311 mg/l and COD-721 mg/l which may be due to industrial discharge from textile industries in the vicinity.
4. Pollution Mitigation StrategyIllegal discharge of untreated domestic and industrial wastewater increases the pollution load in the river Kali-East. Consequently, thepolluted water of the river Kali-East pollutes the river Ganges after meeting it in Kannauj (Uttar Pradesh). To mitigate the pollution loadon the river due to domestic sewage and industrial e�uent, eleven sewage treatment plants (STPs) and one common e�uenttreatment plant (CETP) are constructed to treat wastewater generated in the basin of the river. The total sewage treatment capacity inthe basin of river Kali-East is 181 MLD, out of which 168 MLD is located in Meerut (12 STPs) and 13 MLD in Kannauj (01 STP). Fortreating industrial e�uent, one CETP (2.1 MLD) is located in the Pilakhua town of Hapur district. In spite of the construction of STPs,there is a huge gap (46.9%) between sewage generation and sewage treatment capacity in the catchment area of the river Kali-East.The competent authority must ensure that all sewage treatment facilities operate at the designed capacities. Also, the up-gradation ofSTPs must be considered if possible. All stakeholders must ensure the treatment of sewage before being discharged into the river.Different types of industries (sugar, textile, pulp & paper, dairy & food, distillery, and chemical industries) in the catchment area of theriver are a potential threat to the water quality. Timely inspection of industries regarding the compliance of discharge standards should

Page 17/25
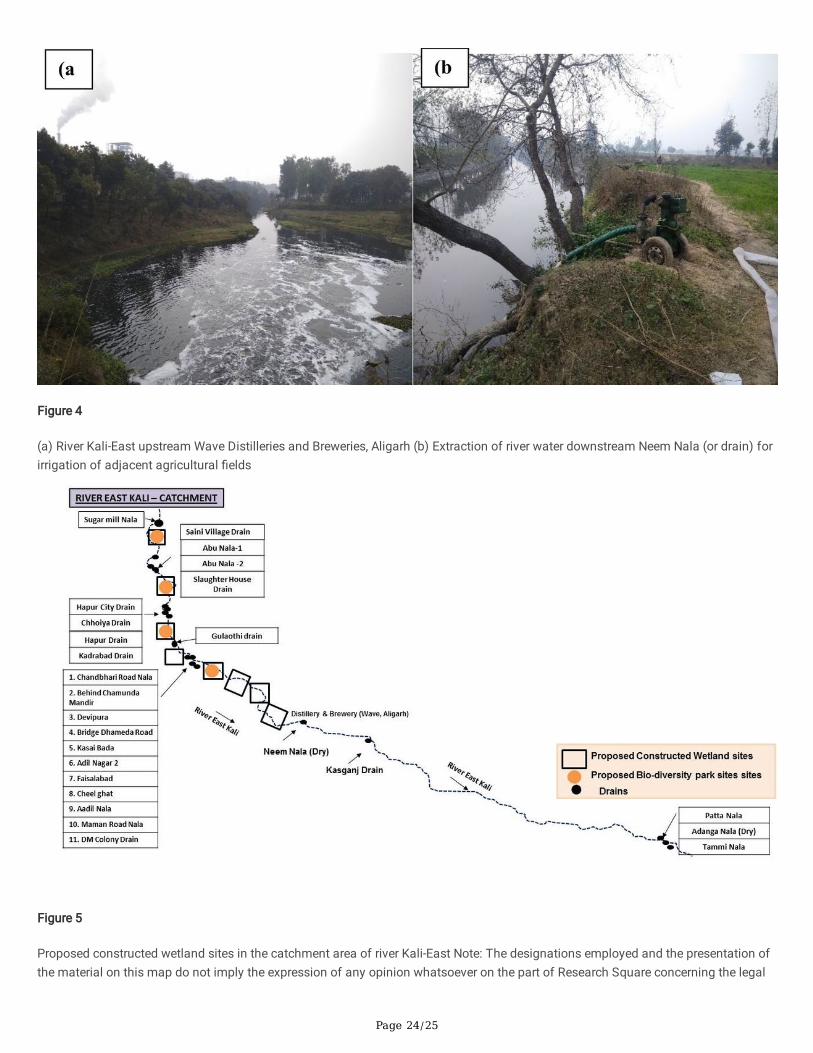
be carried out by the competent authority to ensure the water quality of the river Kali-East. The river water is also used by farmers forirrigation of agricultural �elds (Fig. 4). This must not be practiced by the farmers to avoid bio-accumulation and bio-ampli�cation ofpollutants into the food chain.
[Insert Fig. 4 here]
The Hon’ble NGT (Government of India) has ordered the construction of su�cient sewage treatment facilities for treating drainsdischarging urban sewage into the river (NGT 2019b). The Hon’ble NGT also suggested the application ofphytoremediation/constructed wetlands to treat drains carrying municipal sewage. In compliance with the NGT order, a total of ninelocations in the catchment area of the river Kali-East may be considered for the construction of treatment wetlands to treat domesticsewage and industrial e�uent (Fig. 5).
[Insert Fig. 5 here]
Constructed wetlands are a viable treatment technology that encompasses the use of natural components (such as soil, gravel, andplants) to treat wastewater (Angassa et al. 2020). Researchers have recommended the use of constructed wetlands for the treatmentof municipal and industrial wastewaters (Flores et al. 2019; Hussain et al. 2019; Maine et al. 2019; Rahi et al. 2020). Rana and Maiti(2018) used constructed wetlands planted with Colocasia esculenta (L.) Schott and Typha latifolia L. to removing COD (71.1%), totalKjeldahl nitrogen (72.3%), Cu (83.4%), Cd (83.1%), Mn (74.5%), Cr (73.6%), Co (84.2%), Zn (66.1%), Pb (77.9%), and Ni (80%) frommunicipal wastewater. Rai et al. (2015) reported removal of Pb (86%), Cu (84%), Zn (83.5%), As (83.2%), Cr (81.6%), Co (76.8%), Ni(68.1%), and Mn (62.2%) from urban sewage in Haridwar (India) by using constructed wetlands planted with T. latifolia, Phragmitesaustralis (Cav.) Trin. ex Steud. and C. esculenta. Apart from metals, the average removal e�ciency of physico-chemical characteristics,i.e., conductivity, TDS, BOD, TSS, NO3-N, NH4-N and PO4-P in winter and summer season were observed from 55.3–91.61% to 64.8–94.1%, respectively. Phytoremediation could also prove successful for the treatment of industrial wastewaters. Rai and Tripathi (2009)reported the removal of Hg from wastewater by a free-�oating water fern Azolla pinnata R.Br. (80–94%) and submerged aquaticmacrophyte Vallisneria spiralis L. (70–84%).
5. ConclusionThe water quality of the river Kali-East was assessed from its origin to con�uence with river Ganga. The surface water qualityindicated that biochemical oxygen demand varied as 6.6–410 mg/l, chemical oxygen demand as 22-1409 mg/l, color as 20–200Hazen, DO as 0-8.16 mg/l, total suspended solids as 38-4386 mg/l, total dissolved solids as 180–2536 mg/l and fecal coliform as490 − 34 × 107 MPN/100 ml. This study revealed that the river was highly polluted until approximately 143 km downstream from theorigin of the river. In this stretch (Muzaffarnagar to Bulandshahar district), DO was NIL and BOD was high (up to 410 mg/l). However,after the mixing of the upper and lower Ganga canal in the polluted water of the river Kali-East, the water quality improved (DOincreased and BOD decreased). The DO level increased to 7.7 mg/l and BOD decreased to 15.6 mg/l before meeting the river Ganga.With respect to DO, no location in the stretch from Muzaffarnagar to Aligarh was found suitable for bathing. Also, no location in thewhole stretch of the river meets bathing water quality w.r.t. BOD. High BOD and COD in the river revealed untreated/partially treatedindustrial discharge into the river and the self-puri�cation capacity of the river Kali-East has been inhibited for a long distance by theheavy and undiminished in�ux of domestic sewage into the river. A total of 26 drains carrying sewage and industrial e�uent dischargean organic load of 148 tonnes per day into the river. The maximum pollution load was contributed by Odean Nala (42%) in the Meerutdistrict. This study recommends strict regulatory norms for industries in the catchment area of the river, reduction in sewage treatmentgap and proper dilution of polluted river water to improve the overall quality of the river. The study also recommends the employmentof constructed wetlands technology to treat the drains discharging wastewater into the river.
Declarations
AcknowledgementsThe author express thanks to the sampling teams and laboratory staff at CPCB Head O�ce Delhi and Regional Directorate Lucknowto carry out this study. Ms. Yogita Mishra is appreciated for her help in the preparation of the location map using GIS.
References

Page 18/25
1. Aktar MW, Paramasivam M, Ganguly M, Purkait S, Sengupta D (2010) Assessment and occurrence of various heavy metals insurface water of Ganga river around Kolkata: a study for toxicity and ecological impact. Environ Monit Assess 160(1–4):207–213
2. Amneera WA, Najib NWAZ, Yusof SRM, Ragunathan S (2013) Water quality index of Perlis river, Malaysia. International Journal ofCivil Environmental Engineering 13(2):1–6
3. Angassa K, Leta S, Mulat W, Kloos H, Meers E (2019) Evaluation of Pilot-Scale Constructed Wetlands with Phragmites karka forPhytoremediation of Municipal Wastewater and Biomass Production in Ethiopia. Environmental Processes 6(1):65–84
4. APHA (2017) Standard methods for the examination of water and wastewater, 23th edn. APHA, AWWA, WEF, Washington, DC
5. ATSDR (2012) Toxicological Pro�le for Cadmium. Department of Health and Human Services. Public Health Service. Atlanta, GA,U.S
�. Bhardwaj V, Singh DS, Singh AK (2010) Water quality of the Chhoti Gandak River using principal component analysis, GangaPlain, India. J Earth Syst Sci 119(1):117–127
7. Branco BF, Torgersen T (2009) Predicting the onset of thermal strati�cation in shallow inland waterbodies. Aquat Sci 71(1):65–79
�. Bravo HR, McLellan SL, Klump JV, Hamidi SA, Talarczyk D (2017) Modeling the fecal coliform footprint in a Lake Michigan urbancoastal area, 95. Environmental Modelling & Software, pp 401–419
9. Central Pollution Control Board (2013) Pollution assessment: river Ganga. CPCB, Ministry of Environment and Forest, Governmentof India
10. Chaudhary M, Mishra S, Kumar A (2017) Estimation of water pollution and probability of health risk due to imbalanced nutrientsin River Ganga, India. International Journal of River Basin Management 15(1):53–60
11. Chow AT, Dahlgren RA, Harrison JA (2007) Watershed sources of disinfection byproduct precursors in the Sacramento and SanJoaquin rivers, California. Environ Sci Technol 41:7645–7652
12. Chowdhary P, Yadav A, Singh R, Chandra R, Singh DP, Raj A, Bharagava RN (2018) Stress response of Triticum aestivum L. andBrassica juncea L. against heavy metals growing at distillery and tannery wastewater contaminated site. Chemosphere 206:122–131
13. CPCB (2009) Status of water supply, waste water generation and treatment in Class-I cities and Class-II town of India. Control ofurban pollution series: CUPS/70 /2009-10. New Delhi CPCB, Ministry of Environment and Forests. Government of India, New Delhi
14. CPHEEO (2013) Latest Manual on Sewerage and Sewage Treatment, Part A: Engineering. Central Public Health and EnvironmentalEngineering Organisation. http://cpheeo.gov.in/cms/manual-on-sewerage-and-sewage-treatment.php
15. Dwivedi S, Mishra S, Tripathi RD (2018) Ganga water pollution: a potential health threat to inhabitants of Ganga basin. Environ Int117:327–338
1�. Ejaz S, Akram W, Lim CW, Lee JJ, Hussain I (2004) Endocrine disrupting pesticides: a leading cause of cancer among rural peoplein Pakistan. Exp Oncol 26:98–105
17. Fenta MM (2014) Heavy Metals Concentration in E�uents of Textile Industry, Tikur Wuha River and Milk of Cows Watering on thisWater Source, Hawassa, Southern Ethiopia. Res J Environ Sci 8(8):422–434
1�. Flores L, Garcia J, Pena R, Gar� M (2019) Constructed wetlands for winery wastewater treatment: A comparative Life CycleAssessment. Sci Total Environ 659:1567–1576
19. Gurjar SK, Tare V (2019) Spatial-temporal assessment of water quality and assimilative capacity of river Ramganga, a tributary ofGanga using multivariate analysis and QUEL2K. J Clean Prod 222(10):550–564
20. Haque MA, Jewel MAS, Sultana MP (2019) Assessment of physicochemical and bacteriological parameters in surface water ofPadma River, Bangladesh. Applied Water Science 9(1):10
21. Haritash AK, Gaur S, Garg S (2016) Assessment of water quality and suitability analysis of River Ganga in Rishikesh, India.Applied Water Science 6(4):383–392
22. Hussain Z, Arslan M, Shabir G, Malik MH, Mohsin M, Iqbal S, Afzal M (2019) Remediation of textile bleaching e�uent by bacterialaugmented horizontal �ow and vertical �ow constructed wetlands: A comparison at pilot scale. Sci Total Environ 685:370–379
23. Jaji MO, Bamgbose O, Odukoya OO, Arowolo TA (2007) Water quality assessment of Ogun River, south west Nigeria. EnvironMonit Assess 133(1–3):473–482
24. Kannel PR, Lee S, Lee YS, Kanel SR, Khan SP (2007) Application of water quality indices and dissolved oxygen as indicators forriver water classi�cation and urban impact assessment. Environ Monit Assess 132(1–3):93–110

Page 19/25
25. Khan MYA, Gani KM, Chakrapani GJ (2016) Assessment of surface water quality and its spatial variation. A case study ofRamganga River, Ganga Basin, India. Arab J Geosci 9(1):28
2�. Mandal P, Upadhyay R, Hasan A (2010) Seasonal and spatial variation of Yamuna River water quality in Delhi, India. EnvironMonit Assess 170(1–4):661–670
27. Masood F, Malik A (2011) Hexavalent chromium reduction by Bacillus sp. strain FM1 isolated from heavy-metal contaminatedsoil. Bull Environ Contam Toxicol 86(1):114–119
2�. Matta G, Naik P, Kumar A, Gjyli L, Tiwari AK, Machell J (2018) Comparative study on seasonal variation in hydro-chemicalparameters of Ganga River water using comprehensive pollution index (CPI) at Rishikesh (Uttarakhand) India. Desalination WaterTreatment 118:87–95
29. Matta G, Srivastava S, Pandey RR, Saini KK (2017) Assessment of physicochemical characteristics of Ganga Canal water qualityin Uttarakhand. Environ Dev Sustain 19(2):419–431
30. Mishra S, Kumar A, Shukla P (2016) Study of water quality in Hindon River using pollution index and environmetrics, India.Desalination Water Treatment 57(41):19121–19130
31. Mishra S, Kumar A, Yadav S, Singhal MK (2018) Assessment of heavy metal contamination in water of Kali-East River usingprinciple component and cluster analysis, India. Sustainable Water Resources Management 4(3):573–581
32. Mitra S, Ghosh S, Satpathy KK, Bhattacharya BD, Sarkar SK, Mishra P, Raja P (2018) Water quality assessment of the ecologicallystressed Hooghly River Estuary, India: A multivariate approach. Mar Pollut Bull 126:592–599
33. Mitsch WJ, Day JW, Zhang L, Lane RR (2005) Nitrate-nitrogen retention in wetlands in the Mississippi River Basin. Ecol Eng24(4):267–278
34. National Green Tribunal (NGT), Government of India (2019a) Date of hearing: 08.04.2019.http://www.greentribunal.gov.in/search_all_case.aspx (Accessed on 20.11.2019; Case type:0A; Case No. 673/2018; Year: 2019)
35. National Green Tribunal (NGT), Government of India (2019b) Case: Manoj Mishra Vs Union of India & Ors. Date of hearing:23.08.2019. http://www.greentribunal.gov.in/search_all_case.aspx (Accessed on 18.11.2019; Case type:0A; Case No. 6/2012;Year: 2019)
3�. Osibanjo O, Daso AP, Gbadebo AM (2011) The impact of industries on surface water quality of River Ona and River Alaro inOluyole Industrial Estate, Ibadan, Nigeria. Afr J Biotech 10(4):696–702
37. Oyebamiji OO, Boeing WJ, Holguin FO, Ilori O, Amund O (2019) Green microalgae cultured in textile wastewater for biomassgeneration and biodetoxi�cation of heavy metals and chromogenic substances. Bioresource Technology Reports 7:100247
3�. Pal M, Ghosh S, Mukhopadhyay M, Ghosh M (2012) Methyl mercury in �sh—a case study on various samples collected fromGanges river at West Bengal. Environ Monit Assess 184(6):3407–3414
39. Pesce SF, Wunderlin DA (2000) Use of water quality indices to verify the impact of Córdoba City (Argentina) on Suquía River.Water Res 34(11):2915–2926
40. Pillay L, Olaniran AO (2016) Assessment of physicochemical parameters and prevalence of virulent and multiple-antibiotic-resistant Escherichia coli in treated e�uent of two wastewater treatment plants and receiving aquatic milieu in Durban, SouthAfrica. Environ Monit Assess 188(5):260
41. Puttick E (2008) Mother Ganges, India's Sacred River in Emoto, Masaru (ed.), The Healing Power of Water, Hay House, pp. 241–52,ISBN 978-1401908775
42. Quinn NW, Jacobs K, Chen CW, Stringfellow WT (2005) Elements of a decision support system for real-time management ofdissolved oxygen in the San Joaquin River Deep Water Ship Channel. Environ Model Softw 20(12):1495–1504
43. Rahi MA, Faisal AA, Naji LA, Almuktar SA, Abed SN, Scholz M (2020) Biochemical performance modelling of non-vegetated andvegetated vertical subsurface-�ow constructed wetlands treating municipal wastewater in hot and dry climate. Journal of WaterProcess Engineering 33:101003
44. Rai PK, Tripathi BD (2009) Comparative assessment of Azolla pinnata and Vallisneria spiralis in Hg removal from GB Pant Sagarof Singrauli Industrial region, India. Environ Monit Assess 148(1–4):75–84
45. Rai UN, Upadhyay AK, Singh NK, Dwivedi S, Tripathi RD (2015) Seasonal applicability of horizontal sub-surface �ow constructedwetland for trace elements and nutrient removal from urban wastes to conserve Ganga River water quality at Haridwar, India. EcolEng 81:115–122

Page 20/25
4�. Rana V, Maiti SK (2018) Municipal wastewater treatment potential and metal accumulation strategies of Colocasia esculenta (L.)Schott and Typha latifolia L. in a constructed wetland. Environ Monit Assess 190(6):328
47. Rudolph A, Ahumada R, Perez C (2002) Dissolved Oxygen Content as an Index of Water Quality in San Vicente Bay, Chile (36°′ S).Environ Monit Assess 78(1):89–100
4�. Saksena DN, Garg RK, Rao RJ (2008) Water quality and pollution status of Chambal river in National Chambal sanctuary, MadhyaPradesh. J Environ Biol 29(5):701–710
49. Sánchez E, Colmenarejo MF, Vicente J, Rubio A, García MG, Travieso L, Borja R (2007) Use of the water quality index anddissolved oxygen de�cit as simple indicators of watersheds pollution. Ecol Ind 7(2):315–328
50. Sener Ş, Sener E, Davraz A (2017) Evaluation of water quality using water quality index (WQI) method and GIS in Aksu River (SW-Turkey). Sci Total Environ 584:131–144
51. Siddiqui E, Pandey J (2019) Assessment of heavy metal pollution in water and surface sediment and evaluation of ecologicalrisks associated with sediment contamination in the Ganga River: a basin-scale study. Environ Sci Pollut Res 26(11):10926–10940
52. Singh IB (2004) Late quaternary history of the Ganga plain. Journal-Geological Society of India 64(4):431–454
53. Singh PK, Saxena S (2018) Towards developing a river health index. Ecol Ind 85:999–1011
54. Singh VK, Singh KP, Mohan D (2005) Status of heavy metals in water and bed sediments of river Gomti–A tributary of the Gangariver, India. Environ Monit Assess 105(1–3):43–67
55. Subramanya K (2009) Flow in open channels, 3rd edn. Tata McGraw-Hill, New Delhi (India
5�. Umar R, Khan MMA, Ahmed I, Ahmed S (2008) Implications of Kali-Hindon inter-stream aquifer water balance for groundwatermanagement in western Uttar Pradesh. J Earth Syst Sci 117(1):69–78
57. Weyhenmeyer GA, Prairie YT, Tranvik LJ (2014) Browning of boreal freshwaters coupled to carbon-iron interactions along theaquatic continuum. PLoS One 9(2):e88104
5�. Xiao YH, Raike A, Hartikainen H, Vahatalo AV (2015) Iron as a source of color in river waters. Sci Total Environ 536:914–923
Figures

Page 21/25
Figure 1
Map of water quality monitoring locations on river Kali-East in Uttar Pradesh state of India Note: The designations employed and thepresentation of the material on this map do not imply the expression of any opinion whatsoever on the part of Research Squareconcerning the legal status of any country, territory, city or area or of its authorities, or concerning the delimitation of its frontiers orboundaries. This map has been provided by the authors.

Page 22/25
Figure 2
DO-sag curve of river Kali-East from origin to con�uence with the river Ganga (Organic load discharged by drains in river Kali-East isexpressed in tonnes per day (TPD))

Page 23/25
Figure 3
Schematic representation of drains and canals meeting river Kali-East in different districts of Uttar Pradesh (India) Note: Thedesignations employed and the presentation of the material on this map do not imply the expression of any opinion whatsoever on thepart of Research Square concerning the legal status of any country, territory, city or area or of its authorities, or concerning thedelimitation of its frontiers or boundaries. This map has been provided by the authors.
Page 24/25
Figure 4
(a) River Kali-East upstream Wave Distilleries and Breweries, Aligarh (b) Extraction of river water downstream Neem Nala (or drain) forirrigation of adjacent agricultural �elds
Figure 5
Proposed constructed wetland sites in the catchment area of river Kali-East Note: The designations employed and the presentation ofthe material on this map do not imply the expression of any opinion whatsoever on the part of Research Square concerning the legal

Page 25/25
status of any country, territory, city or area or of its authorities, or concerning the delimitation of its frontiers or boundaries. This maphas been provided by the authors.
Supplementary Files
This is a list of supplementary �les associated with this preprint. Click to download.
Supplementarydata.docx