tricumen / capital markets: regions 1q16_open 260516
TRANSCRIPT
Sector
1 / 8 26 May 2016
© Tricumen Limited 2016. All rights reserved.
-
Capital Markets: Regions 1Q16This publication is supplementary to our quarterly Results Review; it shows banks' capital marketsquarterly revenue and semi-annual pre-tax profit and productivity dynamics relative to their peers inmajor regions. The full dataset includes operating revenue, expenses and pre-tax profit at the Level 3product detail in 7 regions, as well as normalised client segment revenue allocations, RWA and Equity.All data is reconciled against the published financial statements. Further detail is available on request.
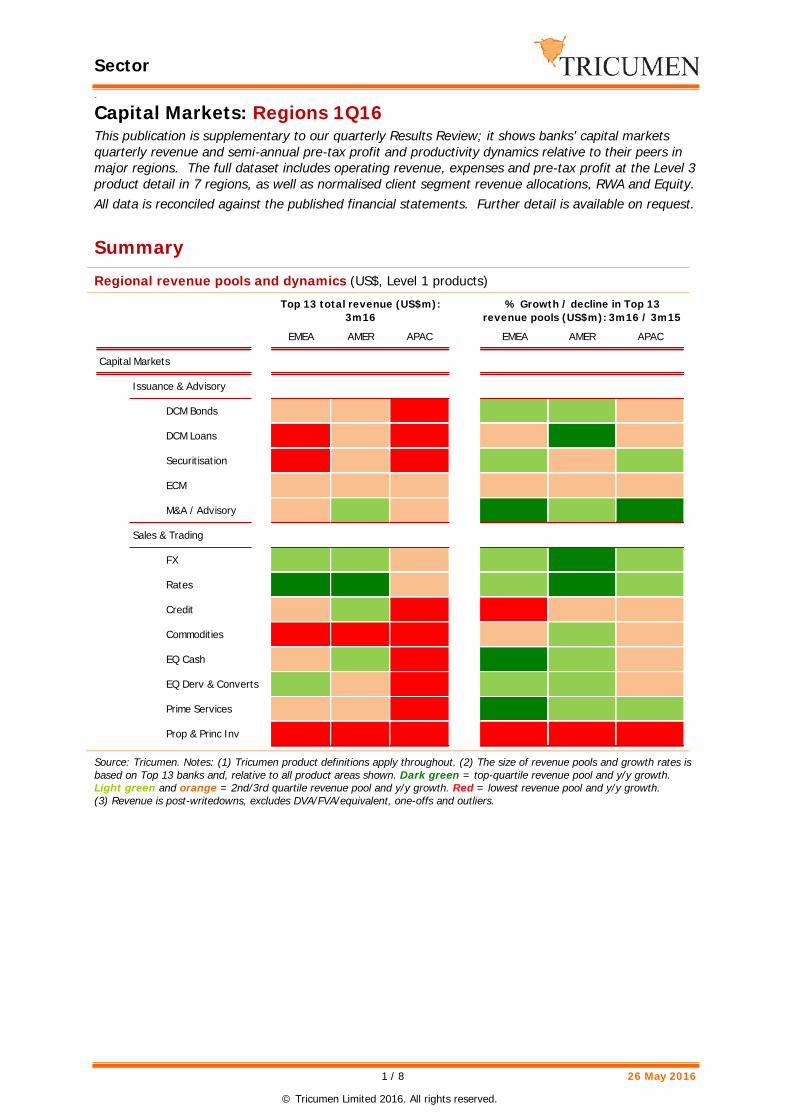
SummaryRegional revenue pools and dynamics (US$, Level 1 products)
Source: Tricumen. Notes: (1) Tricumen product definitions apply throughout. (2) The size of revenue pools and growth rates isbased on Top 13 banks and, relative to all product areas shown. Dark green = top-quartile revenue pool and y/y growth.Light green and orange = 2nd/3rd quartile revenue pool and y/y growth. Red = lowest revenue pool and y/y growth.(3) Revenue is post-writedowns, excludes DVA/FVA/equivalent, one-offs and outliers.
EMEA AMER APAC EMEA AMER APAC
Capital Markets
Issuance & Advisory
DCM Bonds
DCM Loans
Securitisation
ECM
M&A / Advisory
Sales & Trading
FX
Rates
Credit
Commodities
EQ Cash
EQ Derv & Converts
Prime Services
Prop & Princ Inv
Top 13 total revenue (US$m):3m16
% Growth / decline in Top 13revenue pools (US$m): 3m16 / 3m15
Sector
2 / 8 26 May 2016
© Tricumen Limited 2016. All rights reserved.
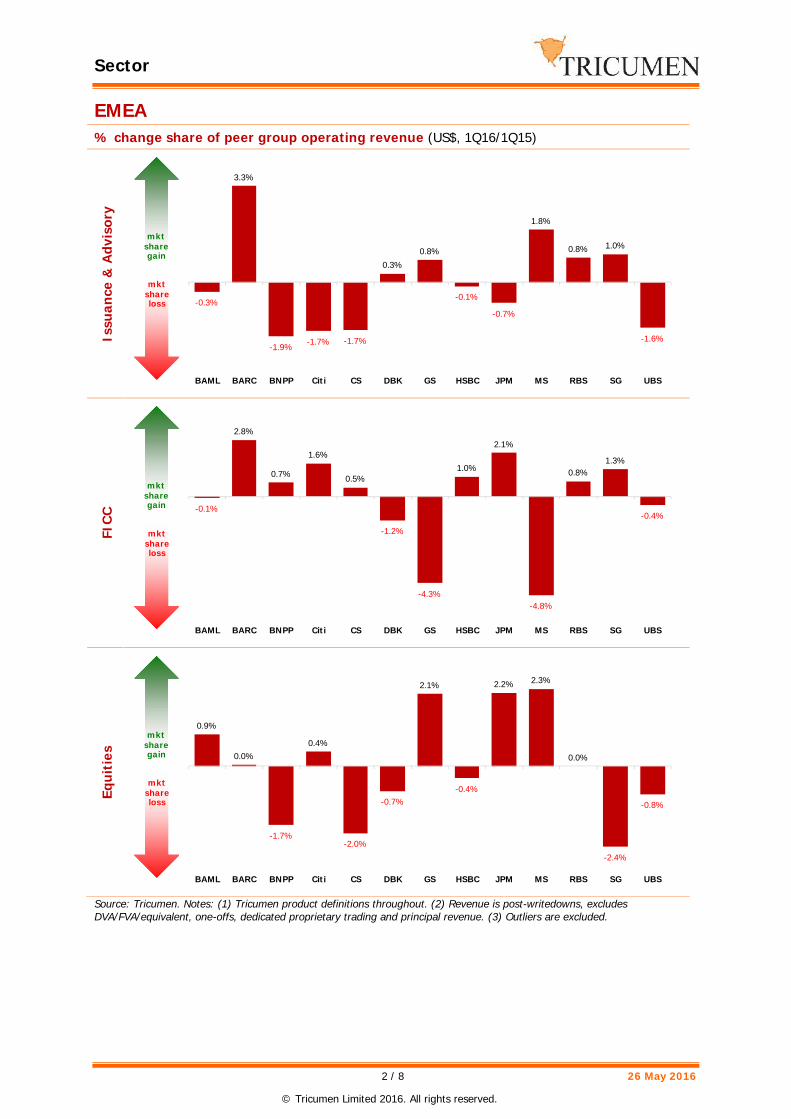
EMEA% change share of peer group operating revenue (US$, 1Q16/1Q15)
Issu
ance
& A
dvis
ory
FICC
Equi
ties
Source: Tricumen. Notes: (1) Tricumen product definitions throughout. (2) Revenue is post-writedowns, excludesDVA/FVA/equivalent, one-offs, dedicated proprietary trading and principal revenue. (3) Outliers are excluded.
-0.3%
3.3%
-1.9% -1.7% -1.7%
0.3%0.8%
-0.1%
-0.7%
1.8%
0.8% 1.0%
-1.6%
-0.03
-0.02
-0.01
0
0.01
0.02
0.03
0.04
BAML BARC BNPP Citi CS DBK GS HSBC JPM MS RBS SG UBS
mktsharegain
mktshareloss
-0.1%
2.8%
0.7%
1.6%
0.5%
-1.2%
-4.3%
1.0%
2.1%
-4.8%
0.8%1.3%
-0.4%
-0.06
-0.05
-0.04
-0.03
-0.02
-0.01
0
0.01
0.02
0.03
0.04
BAML BARC BNPP Citi CS DBK GS HSBC JPM MS RBS SG UBS
mktsharegain
mktshareloss
0.9%
0.0%
-1.7%
0.4%
-2.0%
-0.7%
2.1%
-0.4%
2.2% 2.3%
0.0%
-2.4%
-0.8%
-0.03
-0.02
-0.01
0
0.01
0.02
0.03
BAML BARC BNPP Citi CS DBK GS HSBC JPM MS RBS SG UBS
mktsharegain
mktshareloss

Sector
3 / 8 26 May 2016
© Tricumen Limited 2016. All rights reserved.
EMEA (cont.)Operating revenue dynamics (US$, Level 1 products, 1Q16/1Q15)
Source: Tricumen. Notes: (1) Tricumen product definitions apply throughout. (2) Arrows show % change in revenue vs peers.Up-/down-arrows: top-/bottom-quartile. (3) Revenue is post-writedowns, excludes DVA/FVA/equivalent, one-offs and outliers.
BAML BARC BNPP Citi CS DBK GS HSBC JPM MS RBS SG UBS Top 25% Bottom 25%
Capital Markets -18% -35%
Issuance & Advisory -5% -35%
DCM Bonds N/M 9% -46%
DCM Loans 13% -57%
Securitisation 16% -14%
ECM N/M N/M -35% -67%
M&A / Advisory N/M N/M 52% -28%
Sales & Trading -23% -34%
FX -19% -41%
Rates N/M -14% -33%
Credit -39% -69%
Commodities N/M N/M -18% -62%
EQ Cash N/M 37% -7%
EQ Derv & Converts N/M -4% -39%
Prime Services N/M 16% -12%
Prop & Princ Inv N/M N/M N/M N/M N/M N/M N/M N/M -5% -45%
Sector
4 / 8 26 May 2016
© Tricumen Limited 2016. All rights reserved.
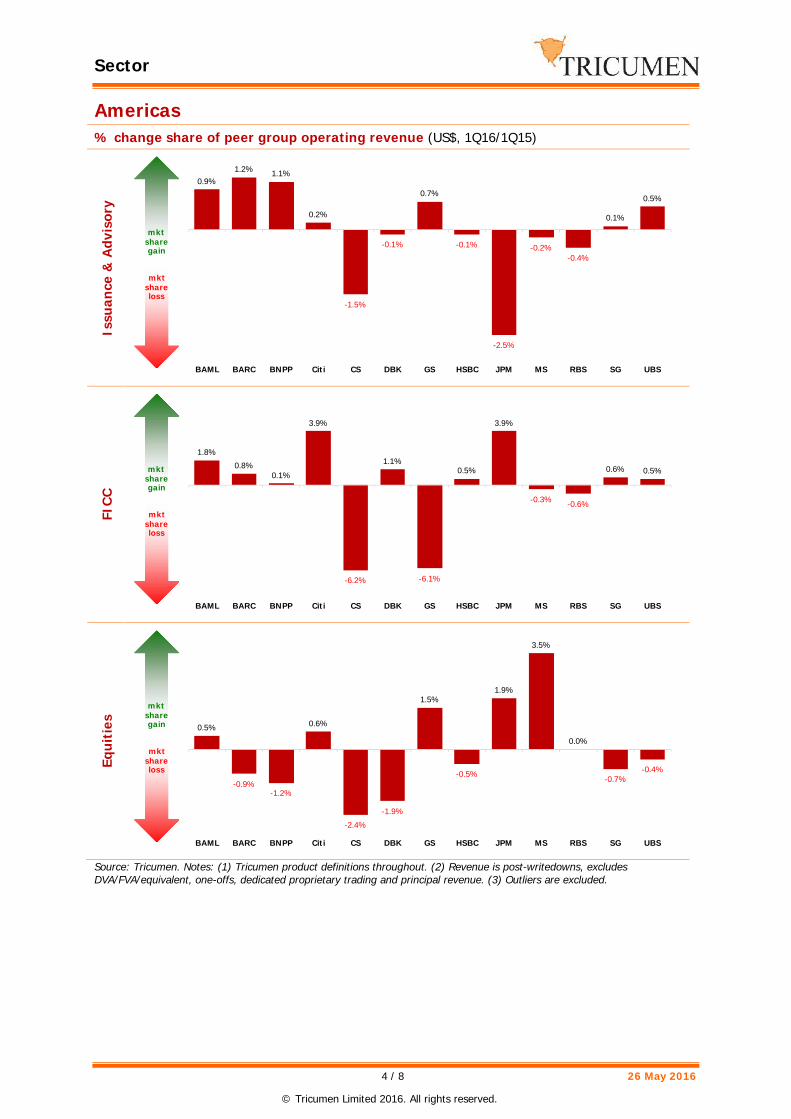
Americas% change share of peer group operating revenue (US$, 1Q16/1Q15)
Issu
ance
& A
dvis
ory
FICC
Equi
ties
Source: Tricumen. Notes: (1) Tricumen product definitions throughout. (2) Revenue is post-writedowns, excludesDVA/FVA/equivalent, one-offs, dedicated proprietary trading and principal revenue. (3) Outliers are excluded.
0.9%1.2% 1.1%
0.2%
-1.5%
-0.1%
0.7%
-0.1%
-2.5%
-0.2%-0.4%
0.1%
0.5%
-0.03
-0.025
-0.02
-0.015
-0.01
-0.005
0
0.005
0.01
0.015
BAML BARC BNPP Citi CS DBK GS HSBC JPM MS RBS SG UBS
mktsharegain
mktshareloss
1.8%0.8%
0.1%
3.9%
-6.2%
1.1%
-6.1%
0.5%
3.9%
-0.3% -0.6%
0.6% 0.5%
-0.08
-0.06
-0.04
-0.02
0
0.02
0.04
0.06
BAML BARC BNPP Citi CS DBK GS HSBC JPM MS RBS SG UBS
mktsharegain
mktshareloss
0.5%
-0.9%-1.2%
0.6%
-2.4%-1.9%
1.5%
-0.5%
1.9%
3.5%
0.0%
-0.7%-0.4%
-0.03
-0.02
-0.01
0
0.01
0.02
0.03
0.04
BAML BARC BNPP Citi CS DBK GS HSBC JPM MS RBS SG UBS
mktsharegain
mktshareloss
Sector
5 / 8 26 May 2016
© Tricumen Limited 2016. All rights reserved.
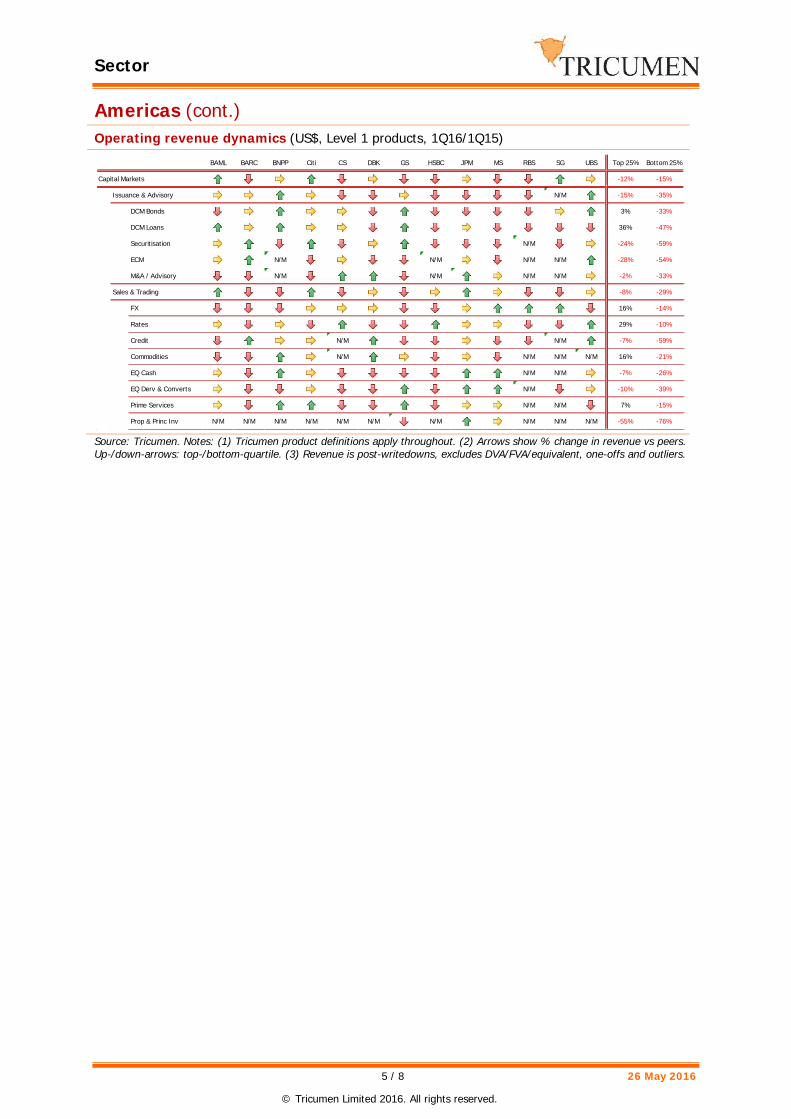
Americas (cont.)Operating revenue dynamics (US$, Level 1 products, 1Q16/1Q15)
Source: Tricumen. Notes: (1) Tricumen product definitions apply throughout. (2) Arrows show % change in revenue vs peers.Up-/down-arrows: top-/bottom-quartile. (3) Revenue is post-writedowns, excludes DVA/FVA/equivalent, one-offs and outliers.
BAML BARC BNPP Citi CS DBK GS HSBC JPM MS RBS SG UBS Top 25% Bottom 25%
Capital Markets -12% -15%
Issuance & Advisory N/M -15% -35%
DCM Bonds 3% -33%
DCM Loans 36% -47%
Securitisation N/M -24% -59%
ECM N/M N/M N/M N/M -28% -54%
M&A / Advisory N/M N/M N/M N/M -2% -33%
Sales & Trading -8% -29%
FX 16% -14%
Rates 29% -10%
Credit N/M N/M -7% -59%
Commodities N/M N/M N/M N/M 16% -21%
EQ Cash N/M N/M -7% -26%
EQ Derv & Converts N/M -10% -39%
Prime Services N/M N/M 7% -15%
Prop & Princ Inv N/M N/M N/M N/M N/M N/M N/M N/M N/M N/M -55% -76%
Sector
6 / 8 26 May 2016
© Tricumen Limited 2016. All rights reserved.
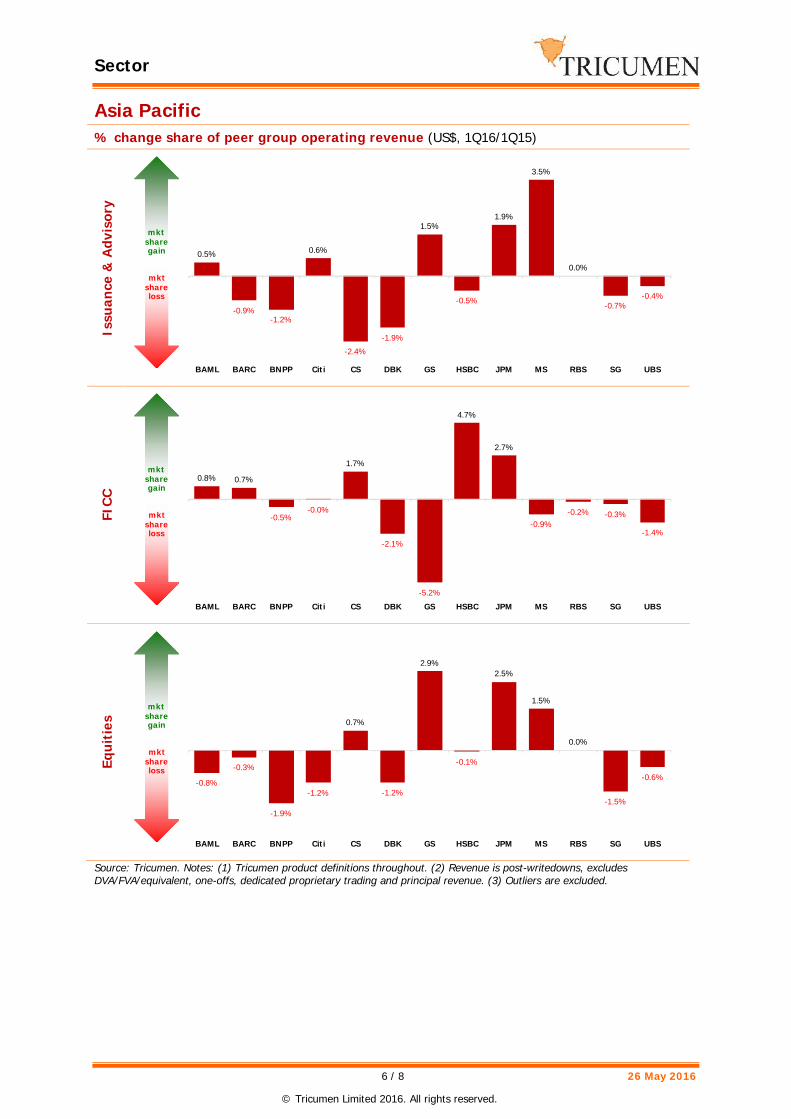
Asia Pacific% change share of peer group operating revenue (US$, 1Q16/1Q15)
Issu
ance
& A
dvis
ory
FICC
Equi
ties
Source: Tricumen. Notes: (1) Tricumen product definitions throughout. (2) Revenue is post-writedowns, excludesDVA/FVA/equivalent, one-offs, dedicated proprietary trading and principal revenue. (3) Outliers are excluded.
0.5%
-0.9%-1.2%
0.6%
-2.4%-1.9%
1.5%
-0.5%
1.9%
3.5%
0.0%
-0.7%-0.4%
-0.03
-0.02
-0.01
0
0.01
0.02
0.03
0.04
BAML BARC BNPP Citi CS DBK GS HSBC JPM MS RBS SG UBS
mktsharegain
mktshareloss
0.8% 0.7%
-0.5%-0.0%
1.7%
-2.1%
-5.2%
4.7%
2.7%
-0.9%-0.2% -0.3%
-1.4%
-0.06
-0.04
-0.02
0
0.02
0.04
0.06
BAML BARC BNPP Citi CS DBK GS HSBC JPM MS RBS SG UBS
mktsharegain
mktshareloss
-0.8%
-0.3%
-1.9%
-1.2%
0.7%
-1.2%
2.9%
-0.1%
2.5%
1.5%
0.0%
-1.5%
-0.6%
-0.03
-0.02
-0.01
0
0.01
0.02
0.03
0.04
BAML BARC BNPP Citi CS DBK GS HSBC JPM MS RBS SG UBS
mktsharegain
mktshareloss
Sector
7 / 8 26 May 2016
© Tricumen Limited 2016. All rights reserved.
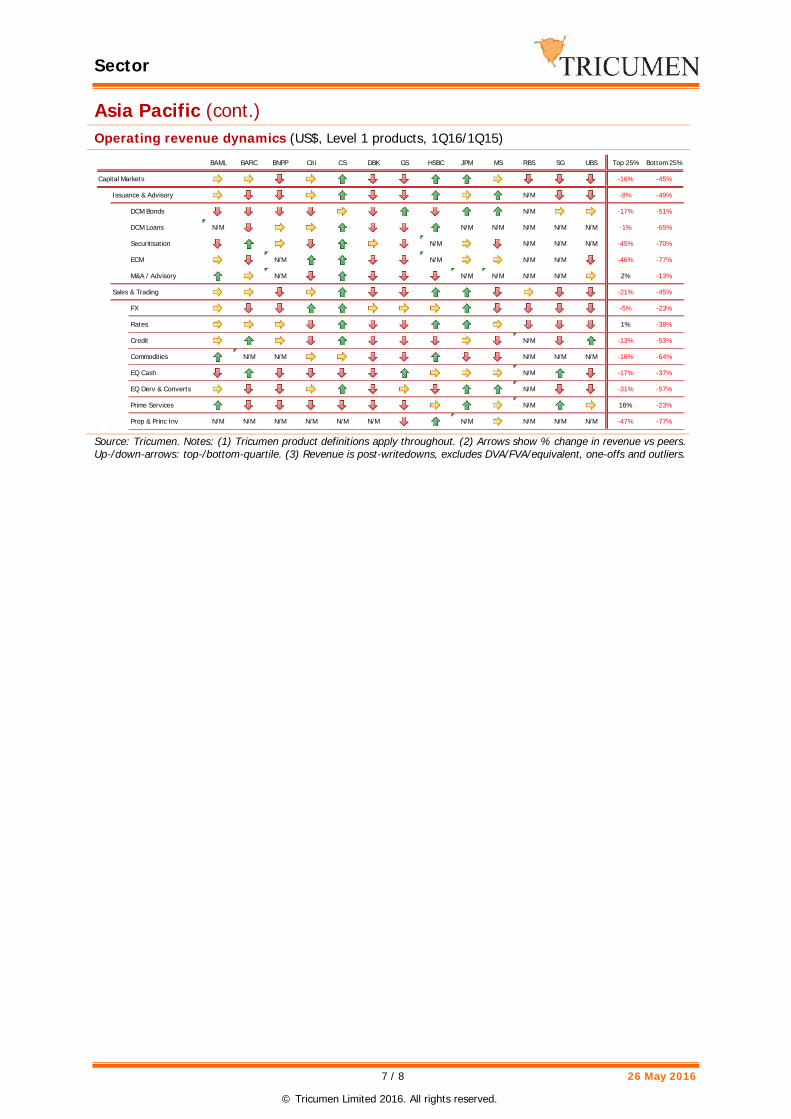
Asia Pacific (cont.)Operating revenue dynamics (US$, Level 1 products, 1Q16/1Q15)
Source: Tricumen. Notes: (1) Tricumen product definitions apply throughout. (2) Arrows show % change in revenue vs peers.Up-/down-arrows: top-/bottom-quartile. (3) Revenue is post-writedowns, excludes DVA/FVA/equivalent, one-offs and outliers.
BAML BARC BNPP Citi CS DBK GS HSBC JPM MS RBS SG UBS Top 25% Bottom 25%
Capital Markets -16% -45%
Issuance & Advisory N/M -8% -49%
DCM Bonds N/M -17% -51%
DCM Loans N/M N/M N/M N/M N/M N/M -1% -65%
Securitisation N/M N/M N/M N/M -45% -70%
ECM N/M N/M N/M N/M -46% -77%
M&A / Advisory N/M N/M N/M N/M N/M 2% -13%
Sales & Trading -21% -45%
FX -5% -23%
Rates 1% -38%
Credit N/M -13% -53%
Commodities N/M N/M N/M N/M N/M -16% -64%
EQ Cash N/M -17% -37%
EQ Derv & Converts N/M -31% -57%
Prime Services N/M 16% -23%
Prop & Princ Inv N/M N/M N/M N/M N/M N/M N/M N/M N/M N/M -47% -77%

Sector
8 / 8 26 May 2016
© Tricumen Limited 2016. All rights reserved.
About TricumenTricumen was founded in 2008. It quickly became a strong provider of diversified market intelligenceacross the capital markets and has since expanded into transaction and corporate banking coverage.Tricumen’s data has been used by many of the world’s leading investment banks as well as strategyconsulting firms, investment managers and ‘blue chip’ corporations.Situated near Cambridge in the UK, Tricumen is almost exclusively staffed with senior individuals withan extensive track record of either working for or analysing banks; and boasts what we believe is thelargest capital markets-focused research network of its peer group.
Notes & CaveatsTricumen Limited has used all reasonable care in writing, editing and presenting the information foundin this report. All reasonable effort has been made to ensure the information supplied is accurate andnot misleading. For the purposes of cross- market comparison, all numerical data is normalised inaccordance to Tricumen Limited’s proprietary product classification. Fully-researched dataset maycontain margin of error of 10%; for modelled datasets, this margin may be wider.The information and commentary provided in this report has been compiled for informational purposesonly. We recommend that independent advice and enquiries should be sought before acting upon it.Readers should not rely on this information for legal, accounting, investment, or similar purposes. Nopart of this report constitutes investment advice, any form of recommendation, or a solicitation to buyor sell any instrument or to engage in any trading or investment activity or strategy. Tricumen Limiteddoes not provide investment advice or personal recommendation nor will it be deemed to have done so.Tricumen Limited makes no representation, guarantee or warranty as to the suitability, accuracy orcompleteness of the report or the information therein. Tricumen Limited assumes no responsibility forinformation contained in this report and disclaims all liability arising from negligence or otherwise inrespect of such information.Tricumen Limited is not liable for any damages arising in contract, tort or otherwise from the use of orinability to use this report or any material contained in it, or from any action or decision taken as aresult of using the report.© Tricumen Limited 2016. All rights reserved