triggering of liquefaction recurring questions 10-boulanger
TRANSCRIPT
7/26/2019 Triggering of Liquefaction Recurring Questions 10-Boulanger
http://slidepdf.com/reader/full/triggering-of-liquefaction-recurring-questions-10-boulanger 1/30
7/26/2019 Triggering of Liquefaction Recurring Questions 10-Boulanger
http://slidepdf.com/reader/full/triggering-of-liquefaction-recurring-questions-10-boulanger 2/30
Materials for this talk are based onwork by I. M. Idriss & R. W. Boulanger.
Idriss & Boulanger (2008). “SoilLiquefaction During Earthquakes.”Monograph MNO-12, EERI.
Idriss & Boulanger (2010). “SPT-basedliquefaction triggering procedures.”Report UCD/CGM-10/02, University ofCalifornia, Davis, CA.
7/26/2019 Triggering of Liquefaction Recurring Questions 10-Boulanger
http://slidepdf.com/reader/full/triggering-of-liquefaction-recurring-questions-10-boulanger 3/30
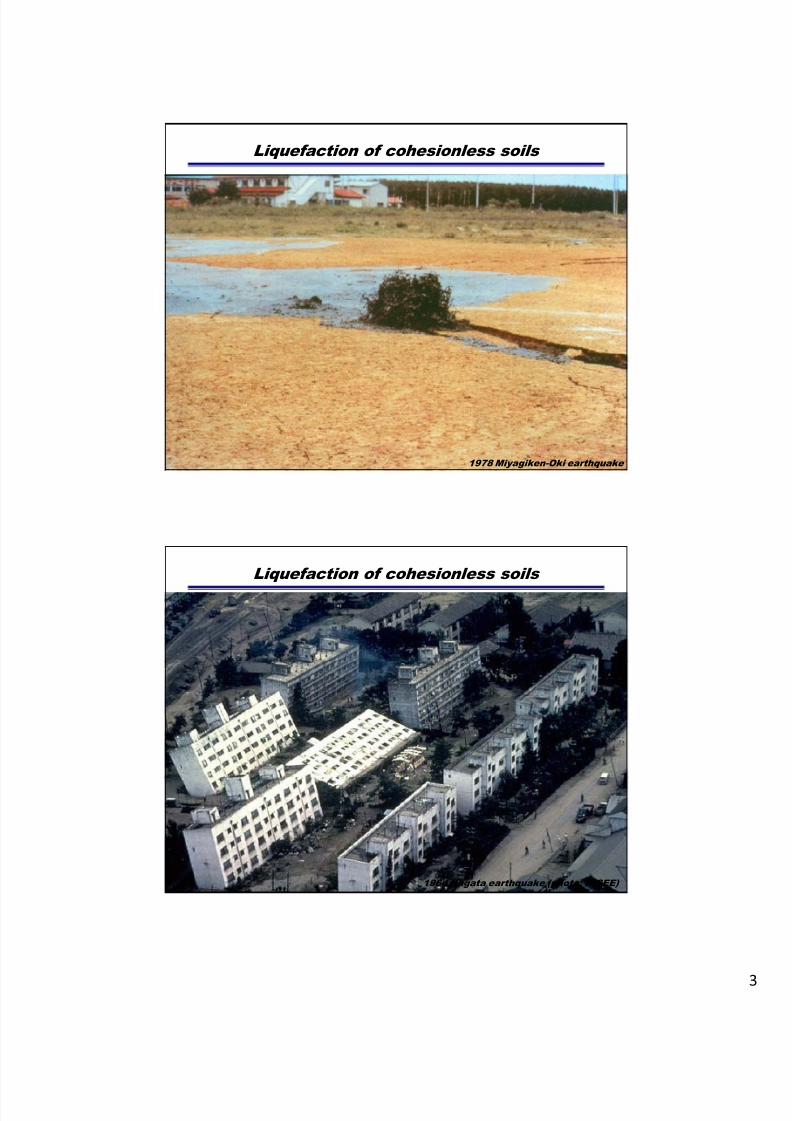
Liquefaction of cohesionless soils
1978 Miyagiken-Oki earthquake
Liquefaction of cohesionless soils
1964 Niigata earthquake (photo: NISEE)
7/26/2019 Triggering of Liquefaction Recurring Questions 10-Boulanger
http://slidepdf.com/reader/full/triggering-of-liquefaction-recurring-questions-10-boulanger 4/30
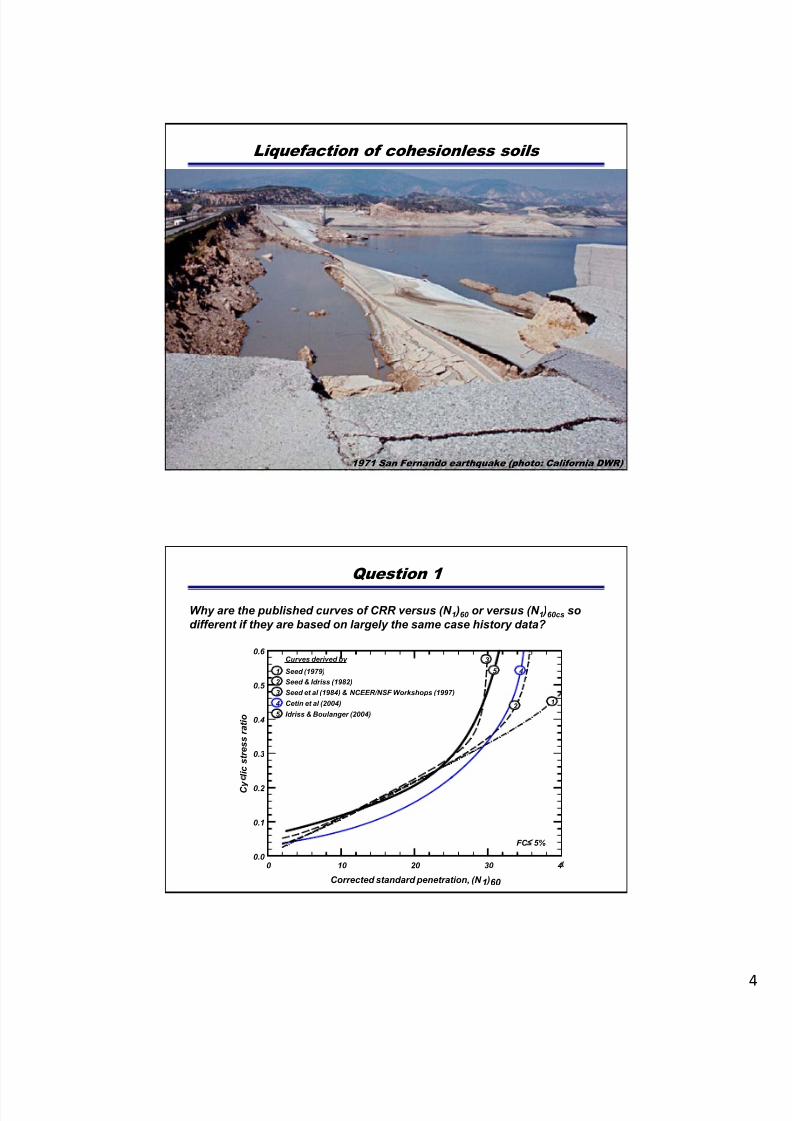
Liquefaction of cohesionless soils
1971 San Fernando earthquake (photo: California DWR)
Why are the published curves of CRR versus (N 1 )60 or versus (N 1 )60cs sodifferent if they are based on largely the same case history data?
0.6 Curves derived by 3
Question 1
l i c s t r e s s r a t i o
0.3
0.4
0.5 Seed & Idriss (1982)Seed et al (1984) & NCEER/NSF Workshops (1997)
Idriss & Boulanger (2004)
Seed (1979)
Cetin et al (2004)
12 3
5 2 1
5
4
4
Corrected standard penetration, (N 1 )60
0 10 20 30 4
C y
0.0
0.1
0.2
FC 5%
7/26/2019 Triggering of Liquefaction Recurring Questions 10-Boulanger
http://slidepdf.com/reader/full/triggering-of-liquefaction-recurring-questions-10-boulanger 5/30
max. v aCSR 0 65 r
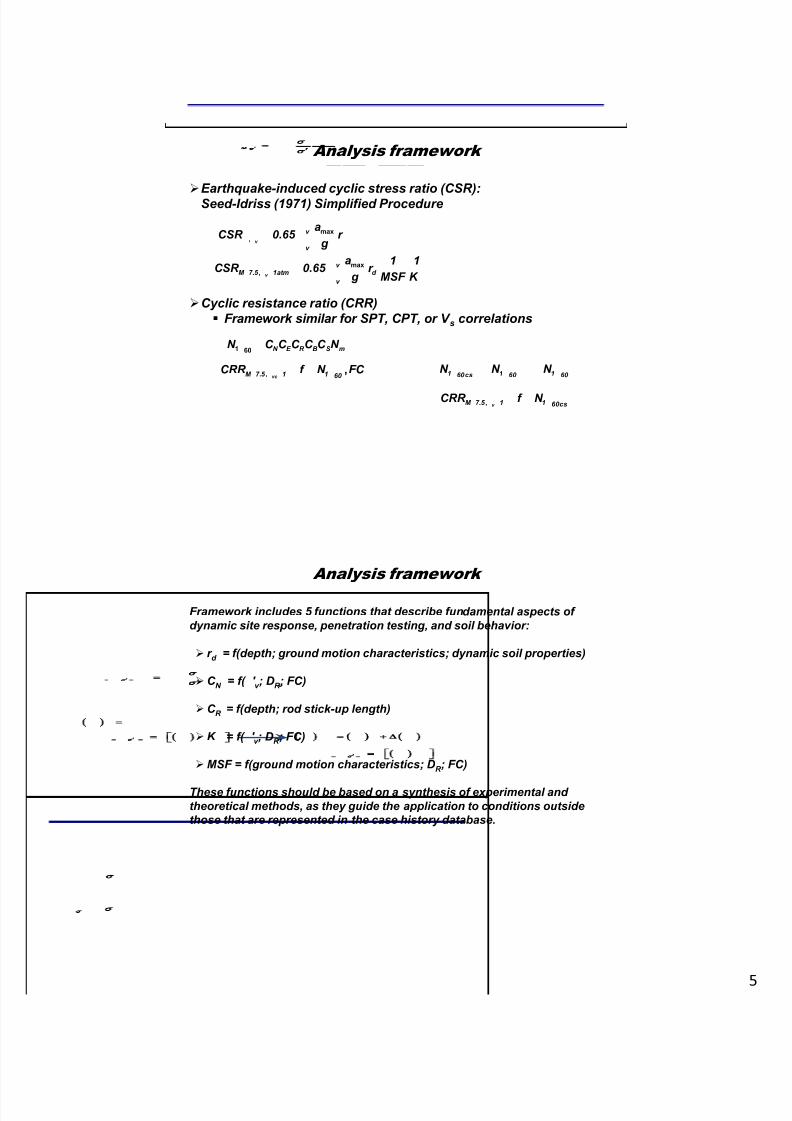
Analysis framework
Earthquake-induced cyclic stress ratio (CSR):Seed-Idriss (1971) Simplified Procedure
, v v g
max. , .
v
v M 7 5 1atm d
v
a 1 1CSR 0 65 r
g MSF K
1 60 N E R B S mN C C C C C N
Cyclic resistance ratio (CRR)Framework similar for SPT, CPT, or V s correlations
1 1 160cs 60 60 N N N . , ,
vc M 7 5 1 1 60 CRR f N FC
. , v M 7 5 1 1 60csCRR f N
Framework includes 5 functions that describe fundamental aspects ofdynamic site response, penetration testing, and soil behavior:
r d = f(depth; ground motion characteristics; dynamic soil properties)
Analysis framework
C N = f( ' v ; D R ; FC)
C R = f(depth; rod stick-up length)
K = f( ' v ; D R ; FC)
MSF = f(ground motion characteristics; D R ; FC)
These functions should be based on a synthesis of experimental andtheoretical methods, as they guide the application to conditions outsidethose that are represented in the case history database.
7/26/2019 Triggering of Liquefaction Recurring Questions 10-Boulanger
http://slidepdf.com/reader/full/triggering-of-liquefaction-recurring-questions-10-boulanger 6/30
0 10 20 30 40 50
(N 1 )60
8
4
0
w g r o u n d s u r
f a c e ( m )
0 0.2 0.4 0.6 0.8
CSR M=7.5, =1
8
4
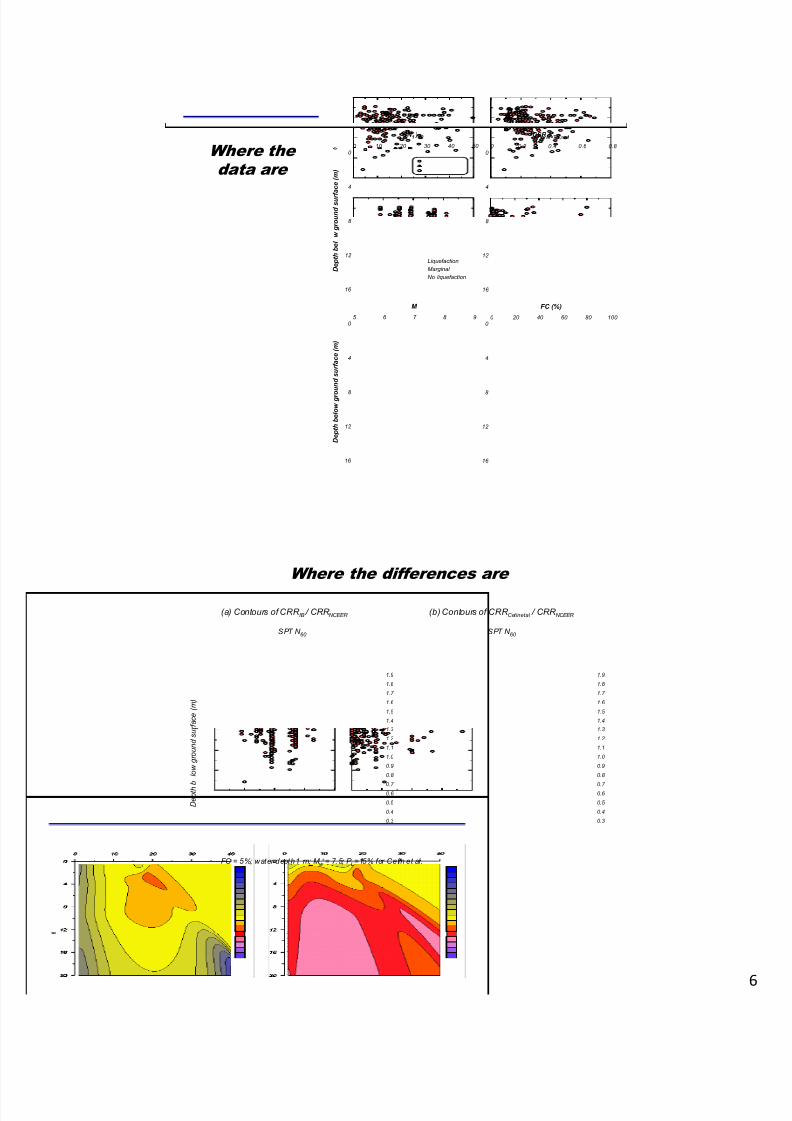
0 Where thedata are
16
12
D e p t h
b e l
LiquefactionMarginal No liquefaction
16
12
5 6 7 8 9
M
0
e ( m )
0 20 40 60 80 100
FC (%)
0
16
12
8
4
D e p t h
b e l o w g r o u n d s u r f a c
16
12
8
4
Where the differences are
SPT N 60 SPT N 60
(a) Contours of CRR IB / CRR NCEER (b) Contours of CRR Cetinetal / CRR NCEER
l o w g r o u n
d s u r f a c e
( m )
0.8
0.9
1.0
1.1
1.2
1.3
1.4
1.5
1.6
1.7
1.8
1.9
0.8
0.9
1.0
1.1
1.2
1.3
1.4
1.5
1.6
1.7
1.8
1.9
D e p t h
b
0.3
0.4
0.5
0.6 0.7
0.3
0.4
0.5
0.6 0.7
FC = 5%; water depth1 m; M w = 7.5; P L=15% for Cetin et al.
7/26/2019 Triggering of Liquefaction Recurring Questions 10-Boulanger
http://slidepdf.com/reader/full/triggering-of-liquefaction-recurring-questions-10-boulanger 7/30
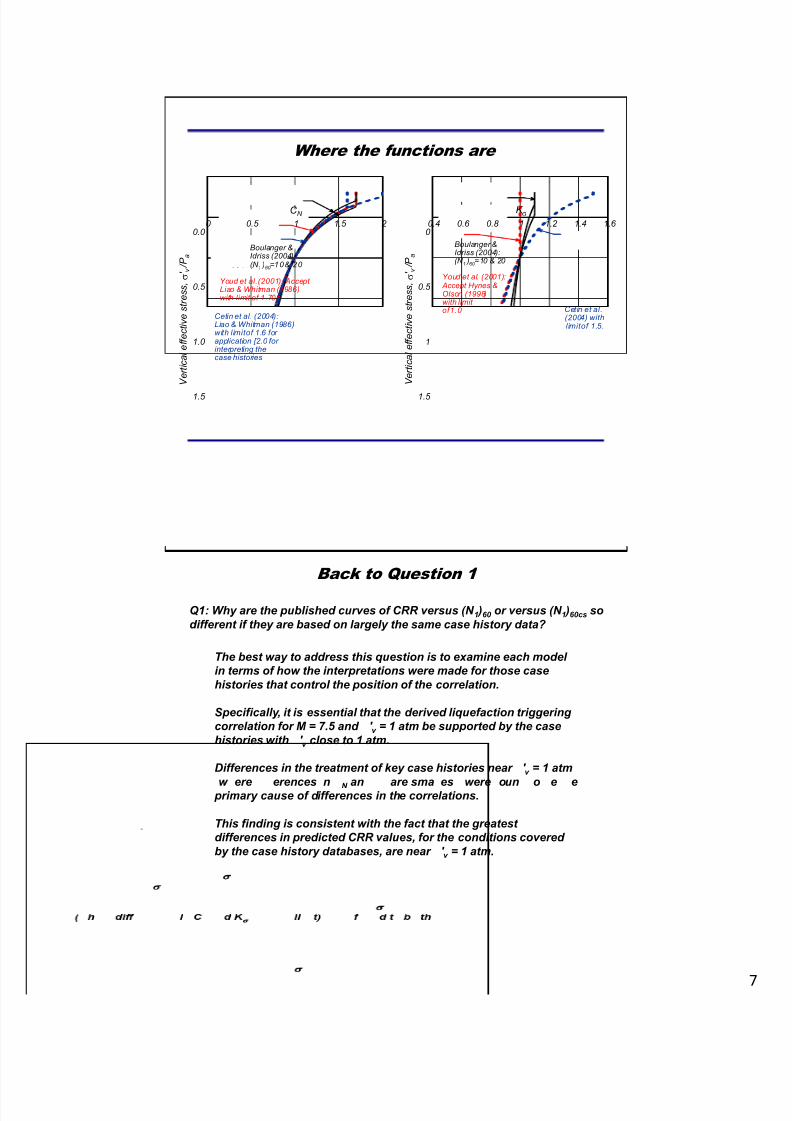
Where the functions are
0 0.5 1 1.5 2
C N
0.0 0.4 0.6 0.8 1 1.2 1.4 1.6
K
0
1.0
0.5
l e f f e c t i v e s t r e s s ,
' v / P
aBoulanger &Idriss (2004):(N 1 )60 =10& 20
Youd et al.(2001): Accept Liao & Whitman (1986)with limit of 1.70.
1
0.5
l e f f e c t i v e s t r e s s ,
' v / P
a
Cetin et al.(2004) withlimitof 1.5.
Cetin et al. (2004):Liao & Whitman (1986)with limitof 1.6 for application [2.0 for interpreting the
Boulanger &Idriss (2004):(N 1 )60 =10 & 20
Youd et al. (2001): Accept Hynes &Olson (1998)with limit of1.0
1.5
V e r t i c a
1.5
V e r t i c acase histories
The best way to address this question is to examine each model
Back to Question 1
Q1: Why are the published curves of CRR versus (N 1 )60 or versus (N 1 )60cs sodifferent if they are based on largely the same case history data?
in terms of how the interpretations were made for those casehistories that control the position of the correlation.
Specifically, it is essential that the derived liquefaction triggeringcorrelation for M = 7.5 and ' v = 1 atm be supported by the casehistories with ' v close to 1 atm.
Differences in the treatment of key case histories near ' v = 1 atm
w ere erences n N an are sma es were oun o e e primary cause of differences in the correlations.
This finding is consistent with the fact that the greatestdifferences in predicted CRR values, for the conditions coveredby the case history databases, are near ' v = 1 atm.
7/26/2019 Triggering of Liquefaction Recurring Questions 10-Boulanger
http://slidepdf.com/reader/full/triggering-of-liquefaction-recurring-questions-10-boulanger 8/30
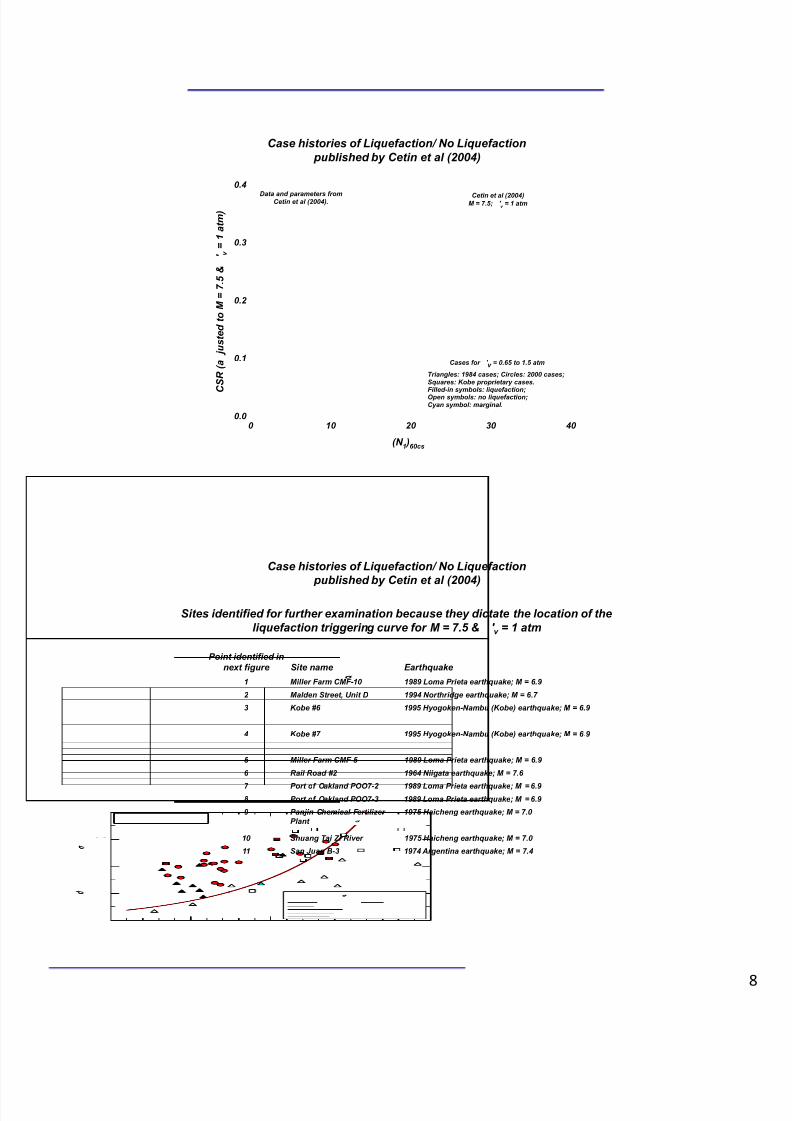
Case histories of Liquefaction/ No Liquefaction published by Cetin et al (2004)
1 a t m
)
0.4Cetin et al (2004)
M = 7.5; ' v = 1 atmData and parameters fromCetin et al (2004).
j u s t e d t o M =
7 . 5 &
' v =
0.2
0.3
(N 1 )60cs
0 10 20 30 40
C S R ( a
0.0
0.1
Triangles: 1984 cases; Circles: 2000 cases;Squares: Kobe proprietary cases.
Filled-in symbols: liquefaction;Open symbols: no liquefaction;Cyan symbol: marginal.
Cases for ' v = 0.65 to 1.5 atm
Case histories of Liquefaction/ No Liquefaction published by Cetin et al (2004)
Point identified in
Sites identified for further examination because they dictate the location of theliquefaction triggering curve for M = 7.5 & ' v = 1 atm
next figure Site name Earthquake
1 Miller Farm CMF-10 1989 Loma Prieta earthquake; M = 6.9
2 Malden Street, Unit D 1994 Northridge earthquake; M = 6.7
3 Kobe #6 1995 Hyogoken-Nambu (Kobe) earthquake; M = 6.9
4 Kobe #7 1995 Hyogoken-Nambu (Kobe) earthquake; M = 6.9
5 Miller Farm CMF-5 1989 Loma Prieta earthquake; M = 6.9
6 Rail Road #2 1964 Niigata earthquake; M = 7.6
7 Port of Oakland POO7-2 1989 Loma Prieta earthquake; M = 6.98 Port of Oakland POO7-3 1989 Loma Prieta earthquake; M = 6.9
9 Panjin Chemical FertilizerPlant
1975 Haicheng earthquake; M = 7.0
10 Shuang Tai Zi River 1975 Haicheng earthquake; M = 7.0
11 San Juan B-3 1974 Argentina earthquake; M = 7.4
7/26/2019 Triggering of Liquefaction Recurring Questions 10-Boulanger
http://slidepdf.com/reader/full/triggering-of-liquefaction-recurring-questions-10-boulanger 9/30
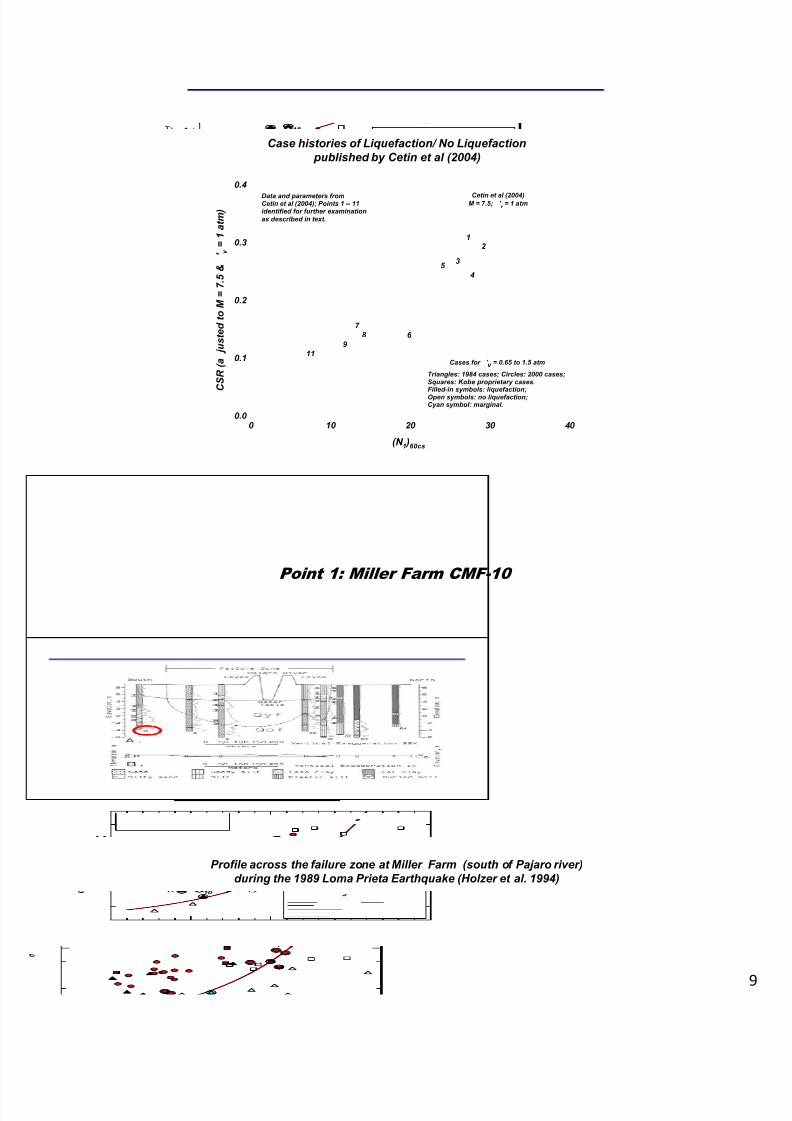
Case histories of Liquefaction/ No Liquefaction published by Cetin et al (2004)
1 a t m
)
0.4Cetin et al (2004)
M = 7.5; ' v = 1 atm
1
Data and parameters fromCetin et al (2004); Points 1 -- 11identified for further examinationas described in text.
j u s t e d t o M =
7 . 5 &
' v =
0.2
0.3 2
3
45
6 7
8 9
11
(N 1 )60cs
0 10 20 30 40
C S R ( a
0.0
0.1
Triangles: 1984 cases; Circles: 2000 cases;Squares: Kobe proprietary cases.
Filled-in symbols: liquefaction;Open symbols: no liquefaction;Cyan symbol: marginal.
Cases for ' v = 0.65 to 1.5 atm
Point 1: Miller Farm CMF-10
Profile across the failure zone at Miller Farm (south of Pajaro river)during the 1989 Loma Prieta Earthquake (Holzer et al. 1994)
7/26/2019 Triggering of Liquefaction Recurring Questions 10-Boulanger
http://slidepdf.com/reader/full/triggering-of-liquefaction-recurring-questions-10-boulanger 10/30
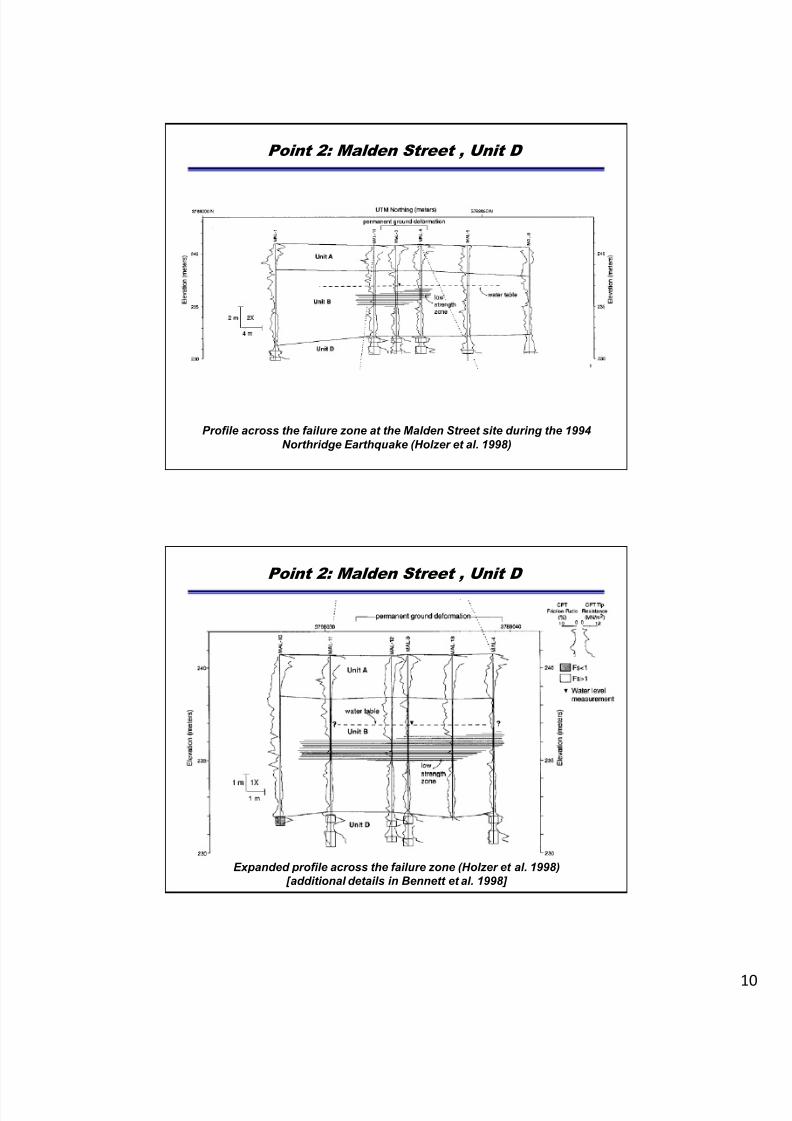
Point 2: Malden Street , Unit D
Profile across the failure zone at the Malden Street site during the 1994Northridge Earthquake (Holzer et al. 1998)
Point 2: Malden Street , Unit D
Expanded profile across the failure zone (Holzer et al. 1998) [additional details in Bennett et al. 1998]
7/26/2019 Triggering of Liquefaction Recurring Questions 10-Boulanger
http://slidepdf.com/reader/full/triggering-of-liquefaction-recurring-questions-10-boulanger 11/30
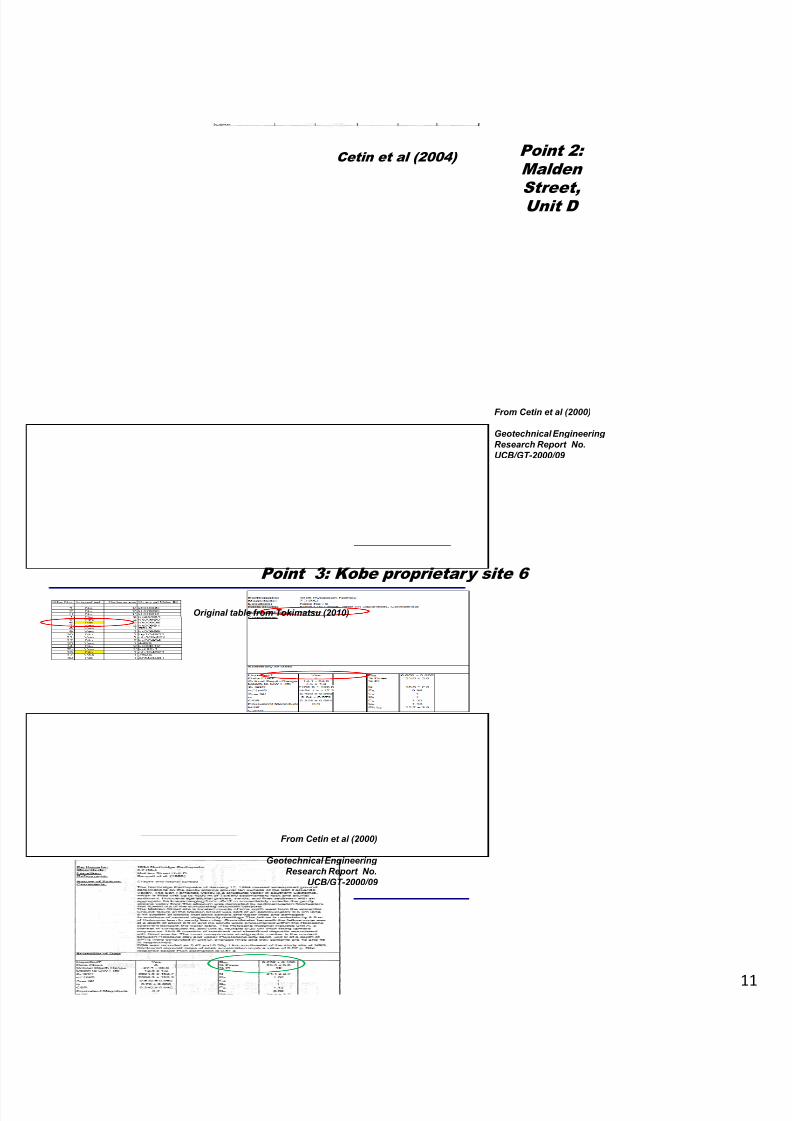
Cetin et al (2004) Point 2:Malden Street,Unit D
From Cetin et al (2000)
Geotechnical EngineeringResearch Report No.UCB/GT-2000/09
Point 3: Kobe proprietary site 6
Original table from Tokimatsu (2010)
From Cetin et al (2000)
Geotechnical EngineeringResearch Report No.
UCB/GT-2000/09
7/26/2019 Triggering of Liquefaction Recurring Questions 10-Boulanger
http://slidepdf.com/reader/full/triggering-of-liquefaction-recurring-questions-10-boulanger 12/30
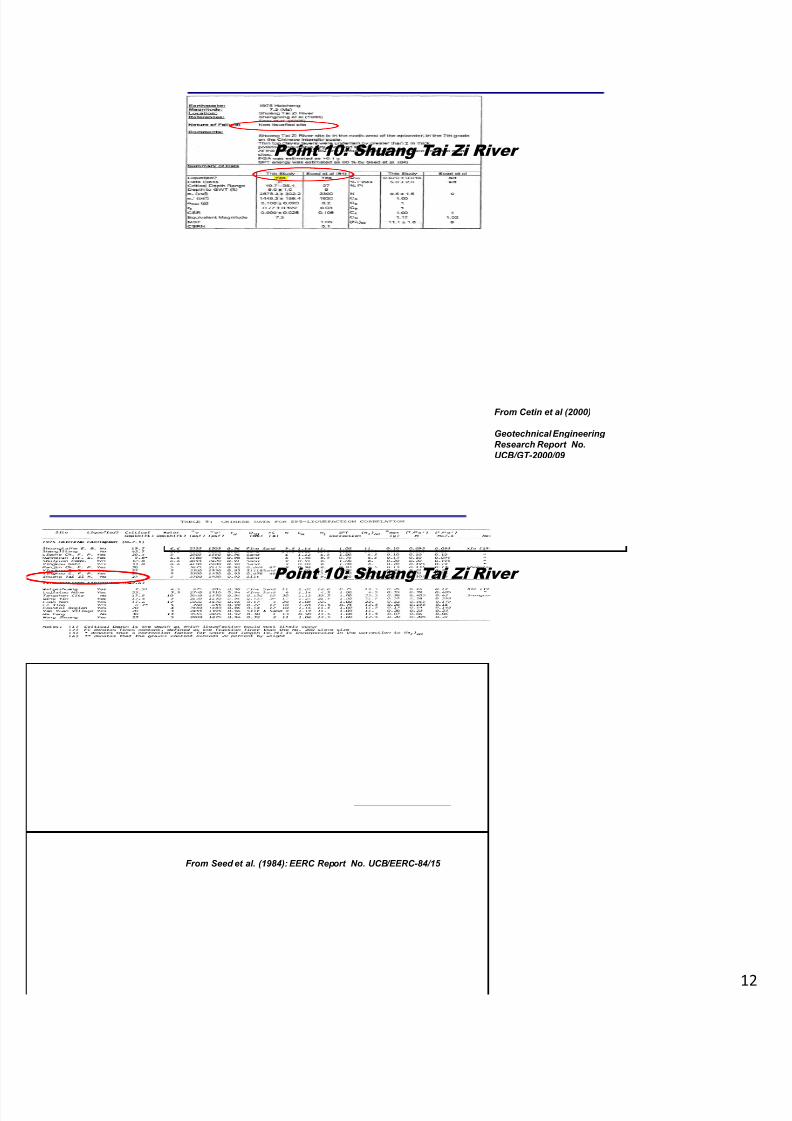
Point 10: Shuang Tai Zi River
From Cetin et al (2000)
Geotechnical EngineeringResearch Report No.UCB/GT-2000/09
Point 10: Shuang Tai Zi River
From Seed et al. (1984): EERC Report No. UCB/EERC-84/15

7/26/2019 Triggering of Liquefaction Recurring Questions 10-Boulanger
http://slidepdf.com/reader/full/triggering-of-liquefaction-recurring-questions-10-boulanger 13/30
Point 10: Shuang Tai Zi River
From original source:Shengcong & Tatsuoka (1984)
Points 1, 2, 3 & 10 were designated as "No Liquefaction" by theoriginal investigators of these sites; Cetin et al (2004) listed theseas "Liquefaction" sites.
Case histories of Liquefaction/ No Liquefaction published by Cetin et al (2004)
Point 1 Miller Farm CMF 10 ' v 0.70 atm
Point 2 Malden Street ' v 1.2 atm
Point 3 Kobe No. 6 ' v 0.68 atm
Point 10 Shuang Tai Zi R. ' v 0.69 atm
7/26/2019 Triggering of Liquefaction Recurring Questions 10-Boulanger
http://slidepdf.com/reader/full/triggering-of-liquefaction-recurring-questions-10-boulanger 14/30
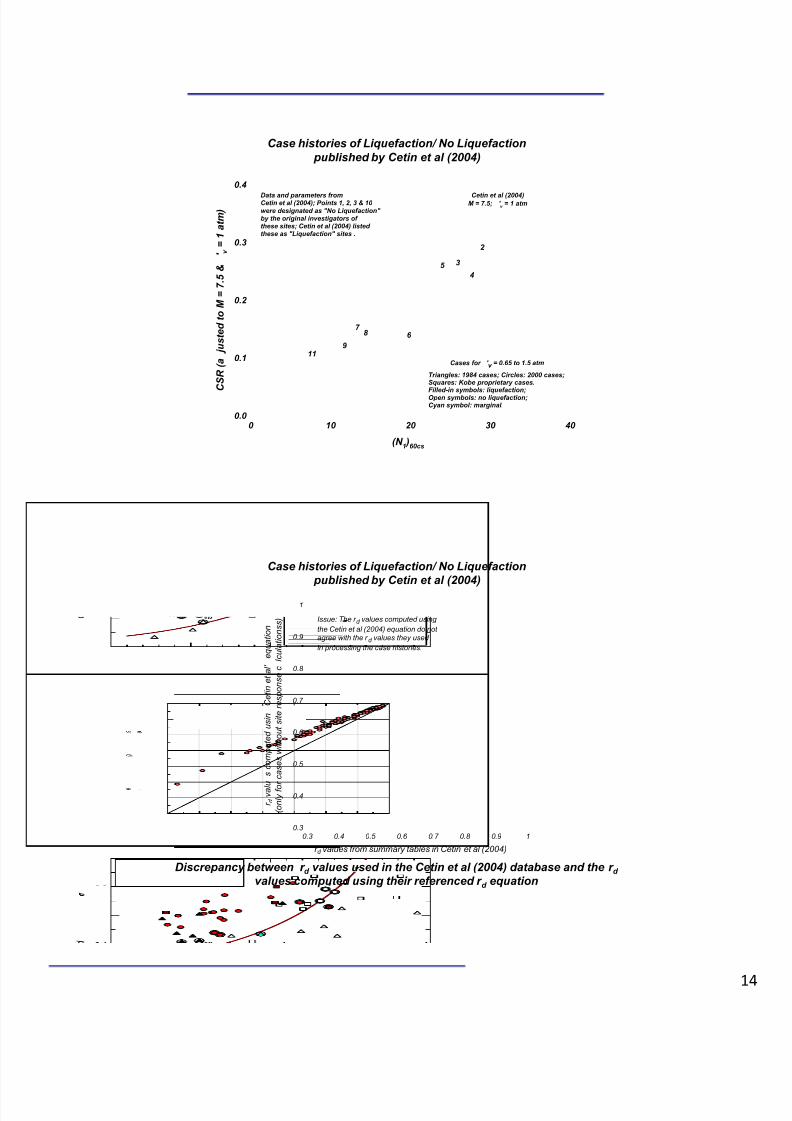
Case histories of Liquefaction/ No Liquefaction published by Cetin et al (2004)
1 a t m
)
0.4Cetin et al (2004)
M = 7.5; ' v = 1 atmData and parameters fromCetin et al (2004); Points 1, 2, 3 & 10 were designated as "No Liquefaction" by the original investigators of these sites; Cetin et al (2004) listedthese as "Liquefaction" sites .
j u s t e d t o M =
7 . 5 &
' v =
0.2
0.3 2
3
45
6 7
8
911
(N 1 )60cs
0 10 20 30 40
C S R ( a
0.0
0.1
Triangles: 1984 cases; Circles: 2000 cases;Squares: Kobe proprietary cases.
Filled-in symbols: liquefaction;Open symbols: no liquefaction;Cyan symbol: marginal.
Cases for ' v = 0.65 to 1.5 atm
Case histories of Liquefaction/ No Liquefaction published by Cetin et al (2004)
0.9
1
e q u a
t i o n
l c u l a t i o n s s ) Issue: The r d values computed using
the Cetin et al (2004) equation do notagree with the r d values they used in processing the case histories.
0.5
0.6
0.7
0.8
s c o m p u
t e d u s i n
C e
t i n e t a l '
c a s e s w
i t h o u t s i t e r e s p o n s e c
0.3 0.4 0.5 0.6 0.7 0.8 0.9 1
r d values from summary tables in Cetin et al (2004)
0.3
0.4 r d v a l u
( o n
l y f o r
Discrepancy between r d values used in the Cetin et al (2004) database and the r d values computed using their referenced r d equation
7/26/2019 Triggering of Liquefaction Recurring Questions 10-Boulanger
http://slidepdf.com/reader/full/triggering-of-liquefaction-recurring-questions-10-boulanger 15/30
Case histories of Liquefaction/ No Liquefaction published by Cetin et al (2004)
1 a t m
)
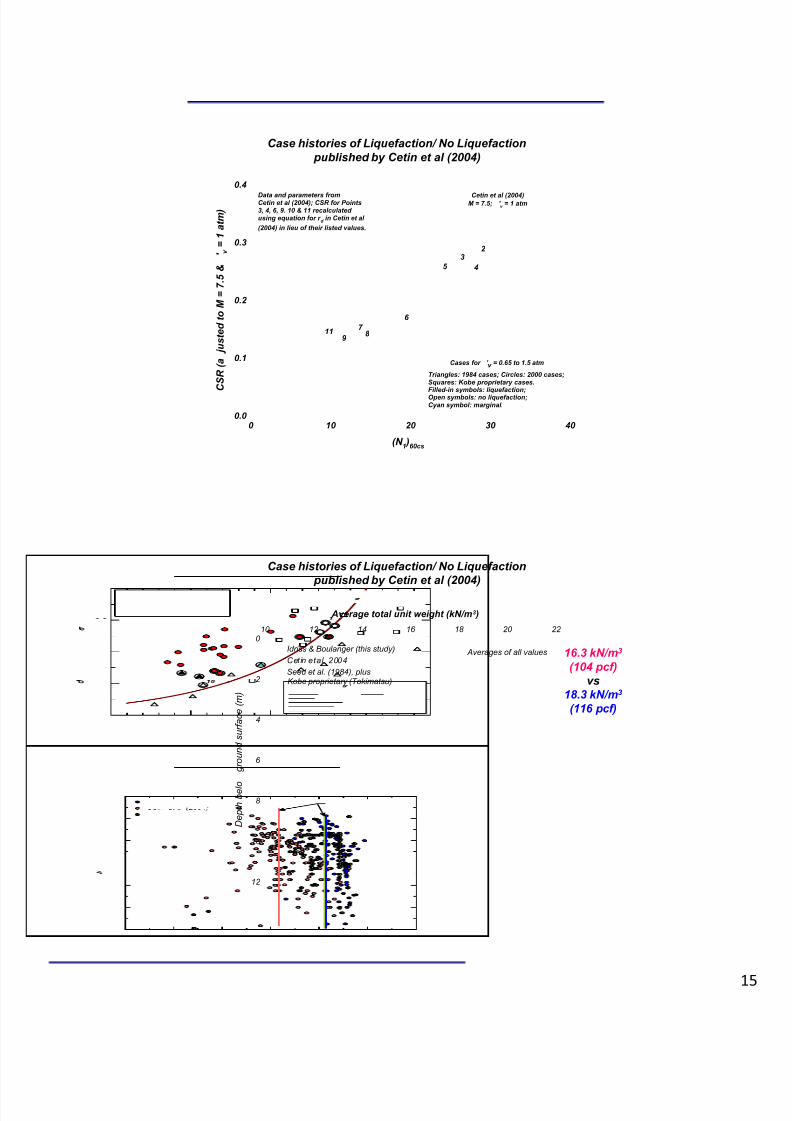
0.4Cetin et al (2004)
M = 7.5; ' v = 1 atmData and parameters fromCetin et al (2004); CSR for Points3, 4, 6, 9. 10 & 11 recalculated using equation for r d in Cetin et al (2004) in lieu of their listed values.
j u s t e d t o M =
7 . 5 &
' v =
0.2
0.32
345
6 7
8 911
(N 1 )60cs
0 10 20 30 40
C S R ( a
0.0
0.1
Triangles: 1984 cases; Circles: 2000 cases;Squares: Kobe proprietary cases.
Filled-in symbols: liquefaction;Open symbols: no liquefaction;Cyan symbol: marginal.
Cases for ' v = 0.65 to 1.5 atm
Case histories of Liquefaction/ No Liquefaction published by Cetin et al (2004)
10 12 14 16 18 20 22
Average total unit weight (kN/m 3 )
0 Idriss & Boulanger (this study)Cetin eta l 2004
Averages of all values 16.3 kN/m 3
6
4
2
g r o u n d s u r f a c e
( m )
Seed et al. (1984), plusKobe proprietary (Tokimatsu)
(104 pcf)vs
18.3 kN/m 3
(116 pcf)
12
10
8
D e p t h
b e l o
7/26/2019 Triggering of Liquefaction Recurring Questions 10-Boulanger
http://slidepdf.com/reader/full/triggering-of-liquefaction-recurring-questions-10-boulanger 16/30
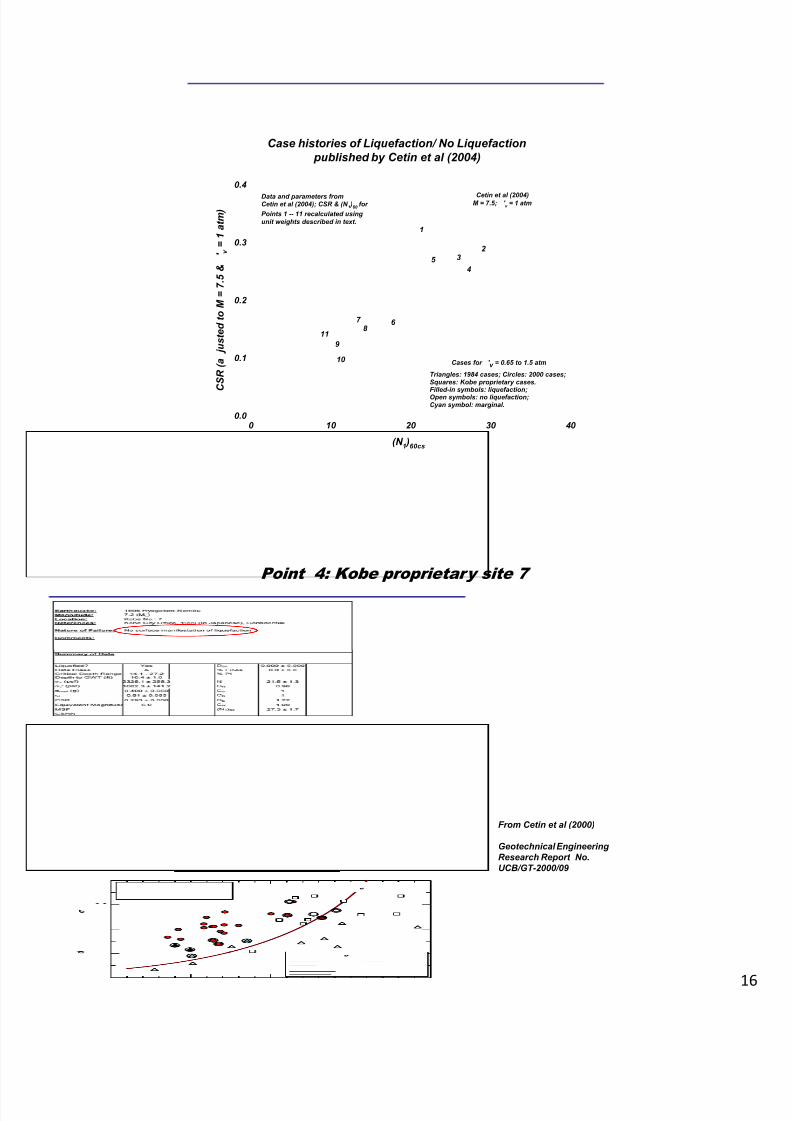
Case histories of Liquefaction/ No Liquefaction published by Cetin et al (2004)
1 a t m
)
0.4
1
Cetin et al (2004)M = 7.5; ' v = 1 atm
Data and parameters fromCetin et al (2004); CSR & (N 1 )60 for Points 1 -- 11 recalculated usingunit weights described in text.
j u s t e d t o M =
7 . 5 &
' v =
0.2
0.32
3
45
6 7 8
911
(N 1 )60cs
0 10 20 30 40
C S R ( a
0.0
0.1 10
Triangles: 1984 cases; Circles: 2000 cases;Squares: Kobe proprietary cases.
Filled-in symbols: liquefaction;Open symbols: no liquefaction;Cyan symbol: marginal.
Cases for ' v = 0.65 to 1.5 atm
Point 4: Kobe proprietary site 7
From Cetin et al (2000)
Geotechnical EngineeringResearch Report No.UCB/GT-2000/09

7/26/2019 Triggering of Liquefaction Recurring Questions 10-Boulanger
http://slidepdf.com/reader/full/triggering-of-liquefaction-recurring-questions-10-boulanger 17/30
From Cetin et al. (2000)
Point 4: Kobe proprietary site 7
Our selection of representative (N 1 )60cs based on the original datafrom Tokimatsu (2010)
Point 4: Kobe proprietary site 7
Avgdepth
(m)Depth toGWT (m) vc (kPa) 'vc ( kP a) ( Nm ) (N1)60 CB CE CN CR CS FC (%) (N1)60,cs
3.3 3.2 62 60 8 10.4 1 1.22 1.26 0.85 1 0 10.44.3 3.2 82 71 21 28.2 1 1.22 1.16 0.95 1 0 28.26.3 3.2 124 93 32 37.7 1 1.22 1.02 0.95 1 12 39.87.3 3.2 144 104 23 25.6 1 1.22 0.96 0.95 1 0 25.68.3 3.2 165 114 21 23.4 1 1.22 0.92 1 1 0 23.4
Averages:5.8 113 87 18.3 21.9 Average= 0 21.9
7/26/2019 Triggering of Liquefaction Recurring Questions 10-Boulanger
http://slidepdf.com/reader/full/triggering-of-liquefaction-recurring-questions-10-boulanger 18/30
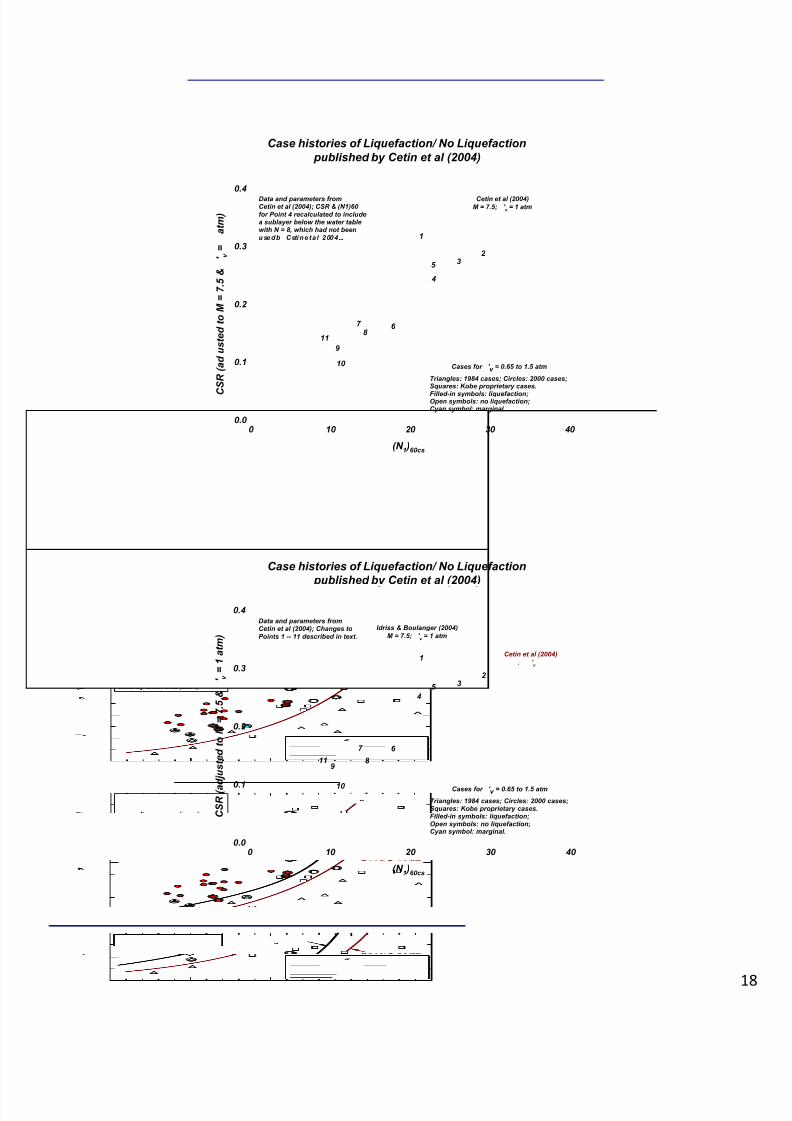
Case histories of Liquefaction/ No Liquefaction published by Cetin et al (2004)
a t m )
0.4
1
Cetin et al (2004)M = 7.5; ' v = 1 atm
Data and parameters fromCetin et al (2004); CSR & (N1)60 for Point 4 recalculated to includea sublayer below the water tablewith N = 8, which had not beenu se d b C eti n e t a l 2 00 4 . .
u s t e d t o M =
7 . 5 &
' v =
0.2
0.32
3
4
5
6 7 8
911
..
(N 1 )60cs
0 10 20 30 40
C S R ( a d
0.0
0.1 10
Triangles: 1984 cases; Circles: 2000 cases;Squares: Kobe proprietary cases.Filled-in symbols: liquefaction;Open symbols: no liquefaction;Cyan symbol: marginal.
Cases for ' v = 0.65 to 1.5 atm
1 a t m
)
0.4
1 Cetin et al (2004)'
Idriss & Boulanger (2004)M = 7.5; ' v = 1 atm
Data and parameters fromCetin et al (2004); Changes toPoints 1 -- 11 described in text.
Case histories of Liquefaction/ No Liquefaction published by Cetin et al (2004)
j u s t e d t o M =
7 . 5 &
' v =
0.2
0.32
3
45
6 7
8 9
11
. v
(N 1 )60cs
0 10 20 30 40
C S R ( a d
0.0
0.1 10 Triangles: 1984 cases; Circles: 2000 cases;Squares: Kobe proprietary cases.Filled-in symbols: liquefaction;Open symbols: no liquefaction;Cyan symbol: marginal.
Cases for ' v = 0.65 to 1.5 atm
7/26/2019 Triggering of Liquefaction Recurring Questions 10-Boulanger
http://slidepdf.com/reader/full/triggering-of-liquefaction-recurring-questions-10-boulanger 19/30
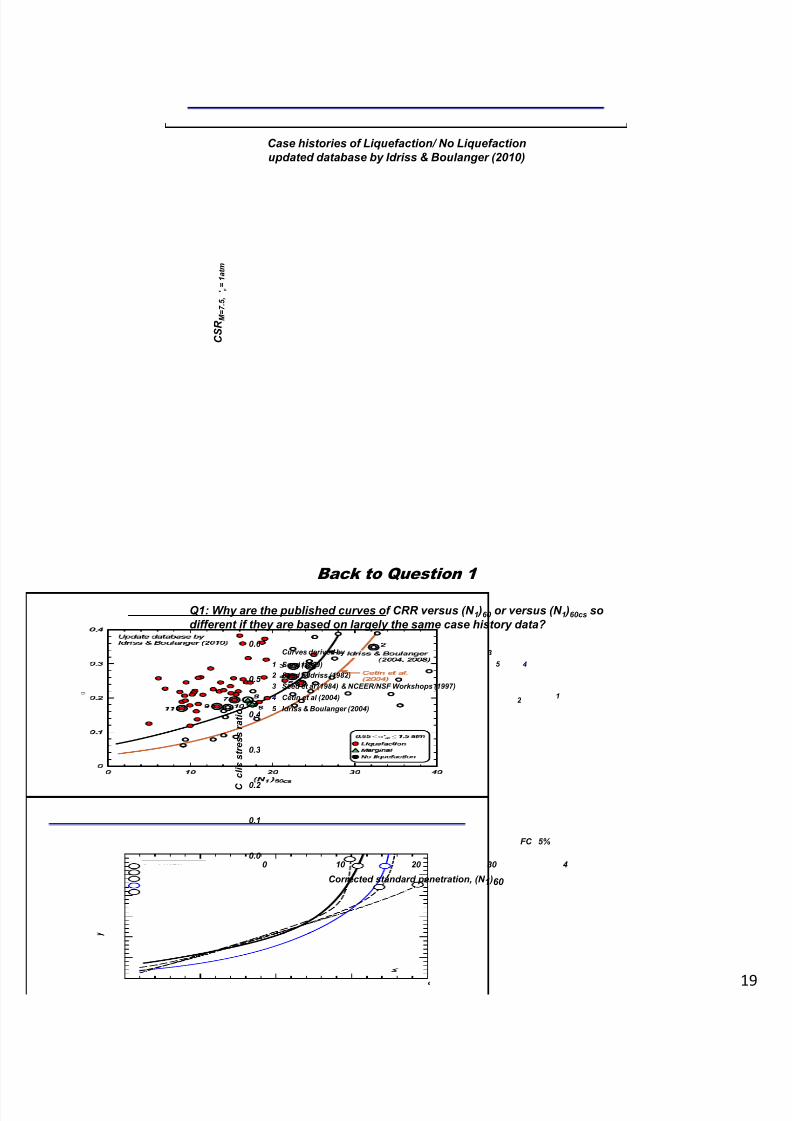
Case histories of Liquefaction/ No Liquefactionupdated database by Idriss & Boulanger (2010)
C S R
M =
7 . 5 , ' v =
1 a t m
0.6 Curves derived by 3
Back to Question 1
Q1: Why are the published curves of CRR versus (N 1 )60 or versus (N 1 )60cs sodifferent if they are based on largely the same case history data?
c l i c s t r e s s r a t i o
0.3
0.4
0.5 Seed & Idriss (1982)Seed et al (1984) & NCEER/NSF Workshops (1997)
Idriss & Boulanger (2004)
Seed (1979)
Cetin et al (2004)
12 3
5 2 1
5
4
4
Corrected standard penetration, (N 1 )60
0 10 20 30 4
C
0.0
0.1
0.2
FC 5%
7/26/2019 Triggering of Liquefaction Recurring Questions 10-Boulanger
http://slidepdf.com/reader/full/triggering-of-liquefaction-recurring-questions-10-boulanger 20/30
The Cetin et al. triggering correlation, if it wereupdated after correcting the above problems,
Back to Question 1
would be expected to move close to the Idriss- Boulanger correlation at overburden stressesof 0.65-1.5 atm.
This would also cause the Cetin et al. K relationship to become flatter because it is
CRR values at higher confining stresses woulddictate a flatter K relationship.
The combination of these changes would beexpected to reduce the degree to which the
Back to Question 1
Cetin et al. procedure predicts significantlysmaller CRR values than the other liquefactiontriggering correlations as depth increases.
Until these issues are addressed, however, theCetin et al. procedure should not be used.
7/26/2019 Triggering of Liquefaction Recurring Questions 10-Boulanger
http://slidepdf.com/reader/full/triggering-of-liquefaction-recurring-questions-10-boulanger 21/30
Q2: Can we treat these differences as "epistemic"uncertainty and hence use all models with "assignedweights"?
Question 2
No, the flaws in the Cetin et al (2004) correlationshould not be confused with "epistemic"uncertainty. The Cetin et al correlation shouldnot be used with any weight.
e exam na on us summar ze emp as zesthe need to fully examine any model and its
justification before it is adopted for use.
Q3: How should we evaluate liquefaction at depths thatexceed those represented in liquefaction casehistories?
Question 3
Two critical parameters affecting liquefaction potential with depth are C N and K .
Studies at Perris Dam provide valuable data onC N at large depths
Studies at Duncan Dam provide a valuable checkon the complete liquefaction analysis procedurefor large depths.
7/26/2019 Triggering of Liquefaction Recurring Questions 10-Boulanger
http://slidepdf.com/reader/full/triggering-of-liquefaction-recurring-questions-10-boulanger 22/30
A critical parameter affecting liquefaction potential with depth isthe value of C N . Boulanger and Idriss (2004) recommended:
m
Perris Dam and C N
aN
vo
1 60
C 1.7
m 0.784 0.0768 N
Note that m = ½, originally derived by Liao & Whitman has beenextensively used, but it can produce unreasonably low C N valuesas the depth increases.
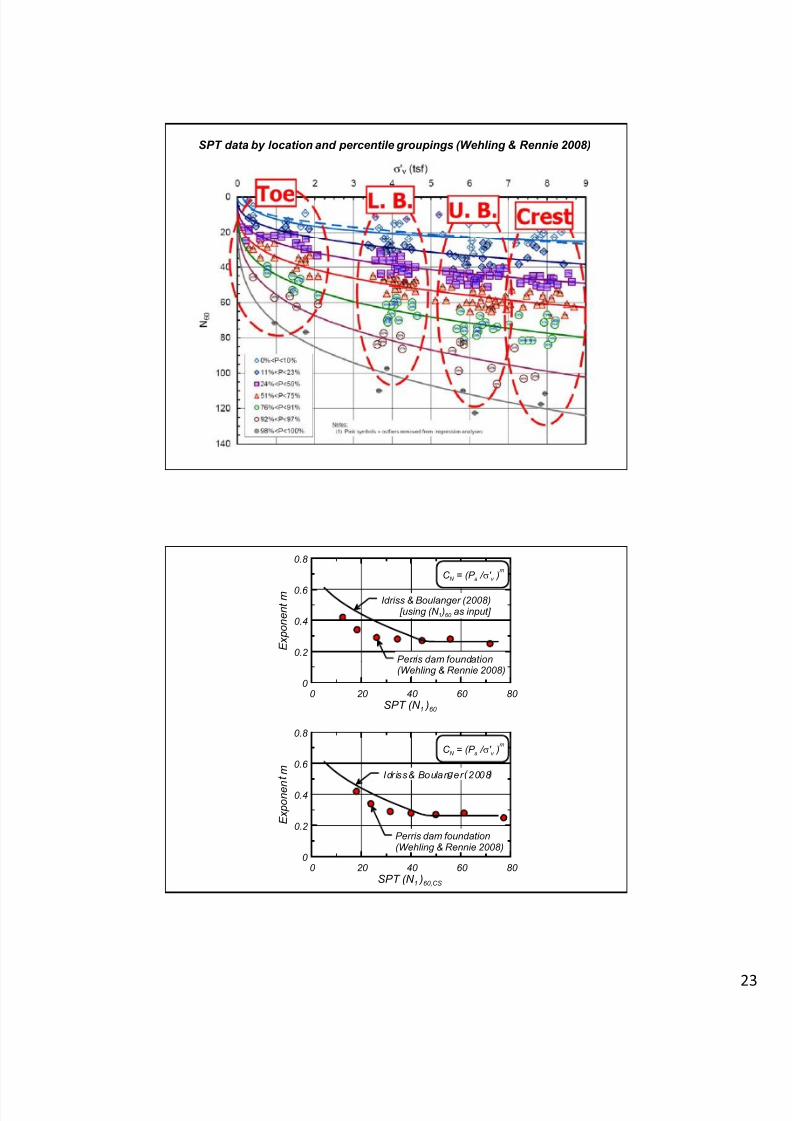
The investigations carried out at Perris Dam (CDWR 2005, Wehlingand Rennie 2008) are very helpful is assessing the value of theexponent m as a function of denseness.
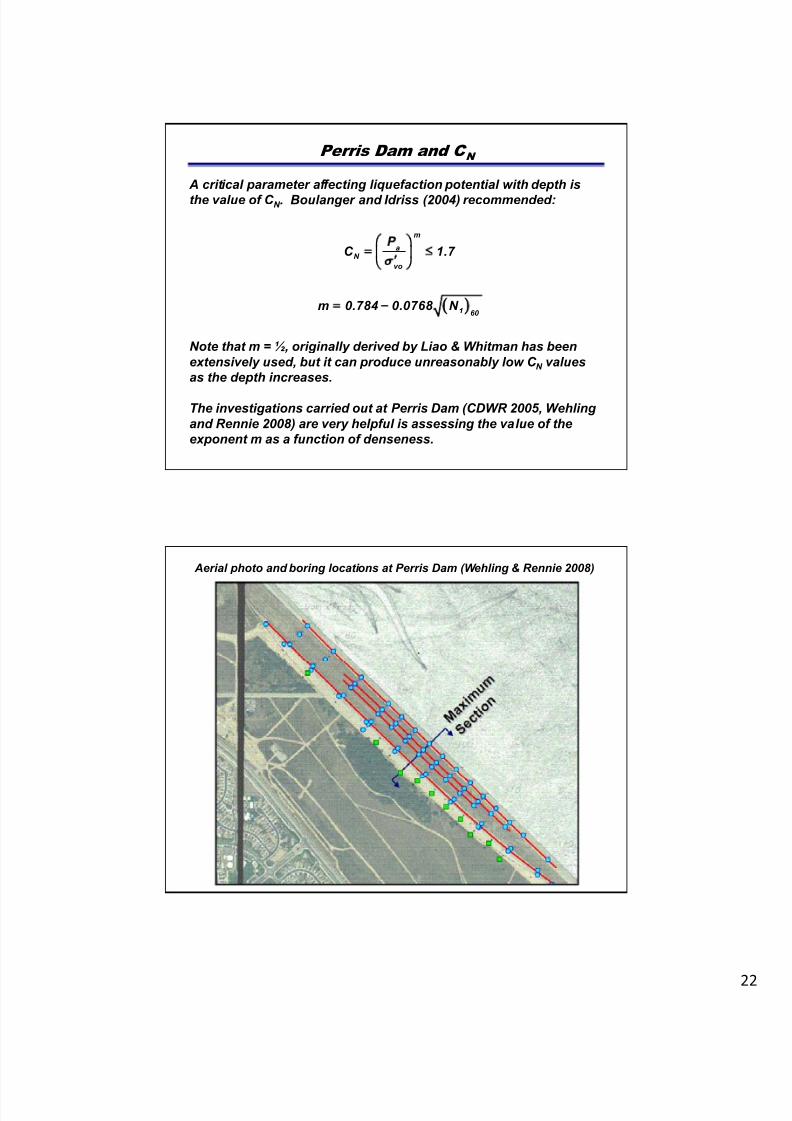
Aerial photo and boring locations at Perris Dam (Wehling & Rennie 2008)
7/26/2019 Triggering of Liquefaction Recurring Questions 10-Boulanger
http://slidepdf.com/reader/full/triggering-of-liquefaction-recurring-questions-10-boulanger 23/30
SPT data by location and percentile groupings (Wehling & Rennie 2008)
0.2
0.4
0.6
0.8
E x p o n e n t m Idriss & Boulanger (2008)
[using (N 1 )60 as input]
Perris dam foundation
C N = (P a / ' v )m
0 20 40 60 80 SPT (N 1 )60
0
0.6
0.8
m
C N = (P a / ' v )m
Idr iss& Boulan er 2008
(Wehling & Rennie 2008)
0 20 40 60 80 SPT (N 1 )60,CS
0
0.2
0.4
E x p o n e n
Perris dam foundation(Wehling & Rennie 2008)
7/26/2019 Triggering of Liquefaction Recurring Questions 10-Boulanger
http://slidepdf.com/reader/full/triggering-of-liquefaction-recurring-questions-10-boulanger 24/30
0 0.5 1 1.5 C N
0
a
0 0.5 1 1.5 C N
0
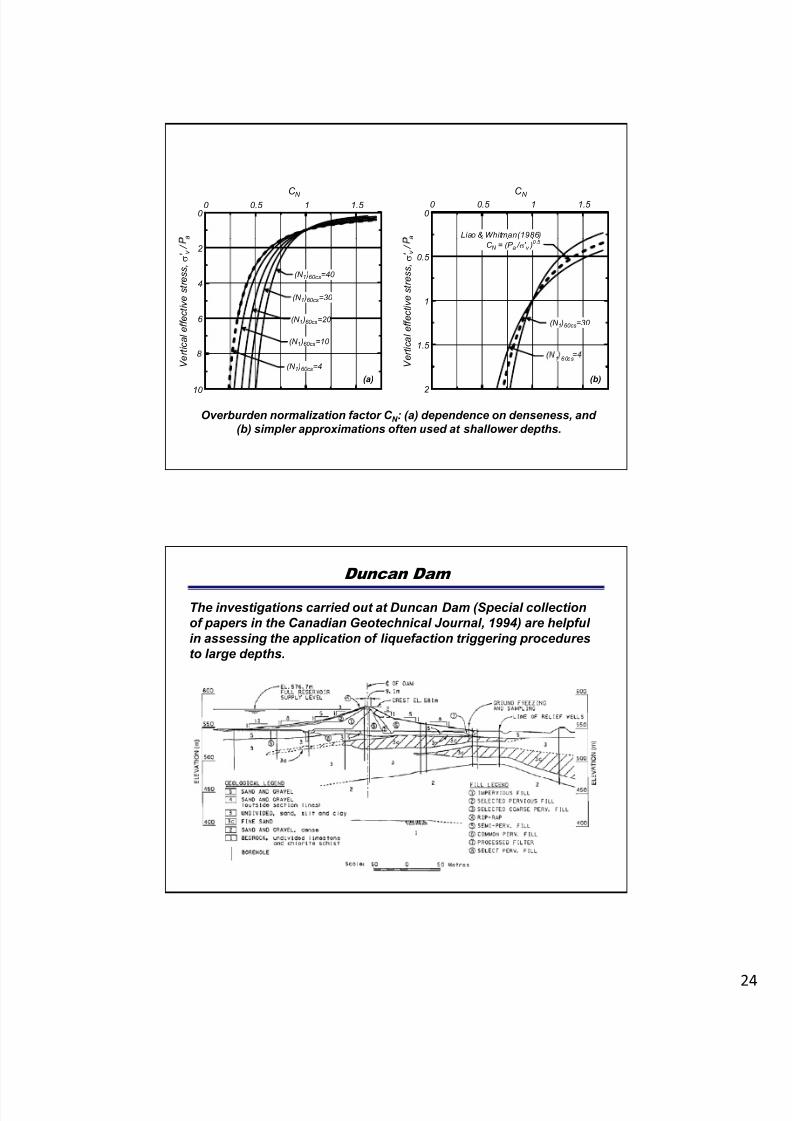
a Liao & Whitman(1986)
6
4
2
r t i c a l e f f e c t i v e s t r e s s ,
' v /
(N 1 )60cs =40
(N 1 )60cs =30
(N 1 )60cs =20
(N 1 )60cs =10 1.5
1
0.5
r t i c a l e f f e c t i v e s t r e s s ,
' v /
(N 1 )60cs =30
C N = (P a / ' v )0.5
Overburden normalization factor C N : (a) dependence on denseness, and(b) simpler approximations often used at shallower depths.
10
V e
(N 1 )60cs =4
2
V e
(a) (b)
1 60cs
The investigations carried out at Duncan Dam (Special collectionof papers in the Canadian Geotechnical Journal, 1994) are helpfulin assessing the application of liquefaction triggering proceduresto large depths.
Duncan Dam
7/26/2019 Triggering of Liquefaction Recurring Questions 10-Boulanger
http://slidepdf.com/reader/full/triggering-of-liquefaction-recurring-questions-10-boulanger 25/30
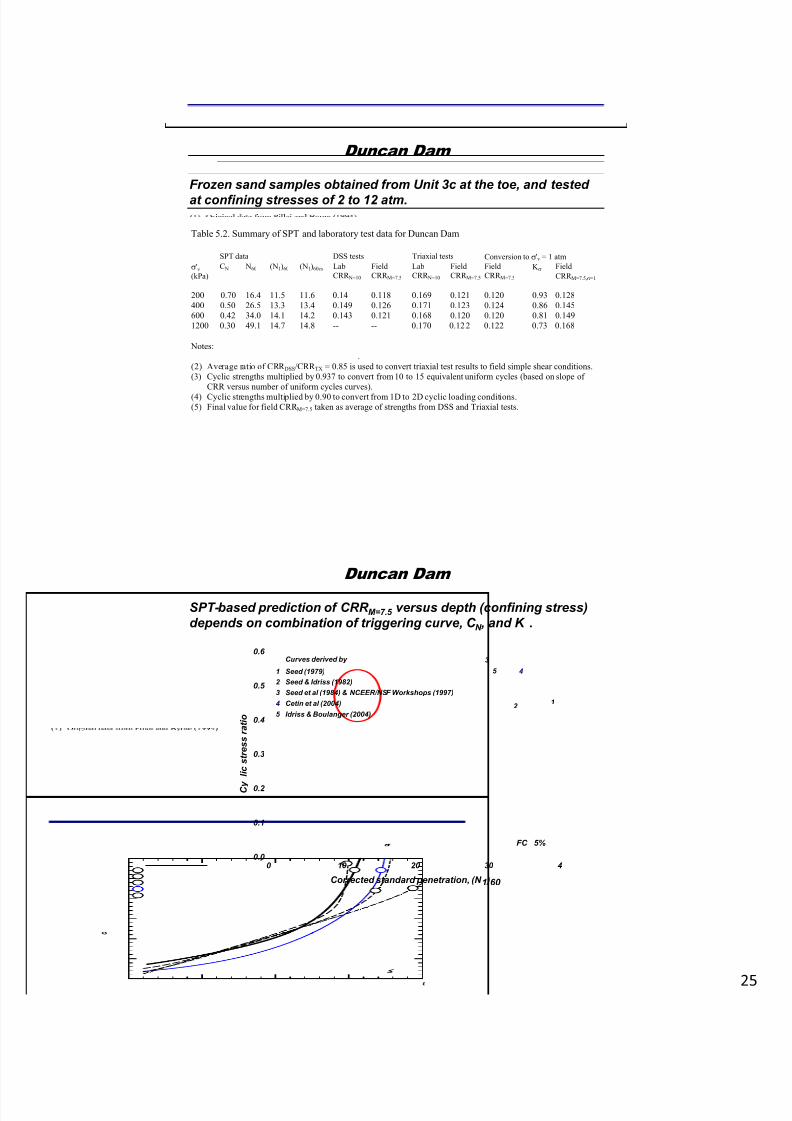
Frozen sand samples obtained from Unit 3c at the toe, and testedat confining stresses of 2 to 12 atm.
Duncan Dam
Table 5.2. Summary of SPT and laboratory test data for Duncan Dam
SPT data DSS tests Triaxial tests Conversion to 'v = 1 atm'v
(kPa)C N N60 (N1)60 (N1)60cs Lab
CRR N=10
FieldCRR M=7.5
LabCRR N=10
FieldCRR M=7.5
FieldCRR M=7.5
K FieldCRR M=7.5, =1
200 0.70 16.4 11.5 11.6 0.14 0.118 0.169 0.121 0.120 0.93 0.128400 0.50 26.5 13.3 13.4 0.149 0.126 0.171 0.123 0.124 0.86 0.145600 0.42 34.0 14.1 14.2 0.143 0.121 0.168 0.120 0.120 0.81 0.1491200 0.30 49.1 14.7 14.8 -- -- 0.170 0.12 2 0.122 0.73 0.168
Notes:.
(2) Average ratio of CRR DSS /CRR TX = 0.85 is used to convert triaxial test results to field simple shear conditions.(3) Cyclic strengths multiplied by 0.937 to convert from 10 to 15 equivalent uniform cycles (based on slope of
CRR versus number of uniform cycles curves).(4) Cyclic strengths multiplied by 0.90 to convert from 1D to 2D cyclic loading conditions.(5) Final value for field CRR M=7.5 taken as average of strengths from DSS and Triaxial tests.
SPT-based prediction of CRR M=7.5 versus depth (confining stress)depends on combination of triggering curve, C N , and K .
Duncan Dam
0.6 Curves derived by 3
l i c s t r e s s r a t i o
0.3
0.4
0.5 Seed & Idriss (1982)Seed et al (1984) & NCEER/NSF Workshops (1997)
Idriss & Boulanger (2004)
Seed (1979)
Cetin et al (2004)
12 3
5 2 1
5
4
4
Corrected standard penetration, (N 1 )60
0 10 20 30 4
C y
0.0
0.1
0.2
FC 5%

7/26/2019 Triggering of Liquefaction Recurring Questions 10-Boulanger
http://slidepdf.com/reader/full/triggering-of-liquefaction-recurring-questions-10-boulanger 26/30
Pillai & Byrne (1994) used the Seed et al. (1984) triggering curve,in-situ SPT data, and laboratory test data on frozen sand samplesto derive site-specific C N and K relationships.
Duncan Dam
0 0.2 0.4 0.6 0.8 1 1.2 N
6
4
2
0
t i v e s t r e s s ,
' v / P
a
Boulanger &Idriss (2004):(N 1 )60 =10 (N 1 )60 =20
0 0.2 0.4 0.6 0.8 1 1.2
6
4
2
0
t i v e s t r e s s ,
' v / P
a
Pillai & Byrne(1994)
12
10
8
V e r t i c a l e
f f e c
Liao & Whitman (1986)
Pillai & Byrne (1994)
12
10
8
V e r t i c a l e f f e c
(a) (b)
Boulanger &Idriss (2004):
(N 1 )
60 =10
(N 1 )60 =20
ynes sen(1999);f = 0 .722
al (1992)
CRR M=7.5 predicted using the Pillai & Byrne (1994) site-specificrelationships with the Seed et al. (1984) triggering curve.
Duncan Dam
0 10 20 30 40 50 60
SPT N 60 values
0 0 10 20 30
(N 1 )60
0 0 0.1 0.2 0.3
CRR M=7.5
0
6
4
2
f f e c t i v e s t r e s s
( a t m )
6
4
2
6
4
2
Duncan Dam- Unit3c:(Pillai & Stewart 1994)
12
10
8
V e r t i c a
l
12
10
8
12
10
8
Computed using relations by Pillai & Byrne (1994)CRR M7.5 from TX & DSS tests on frozen samples (Pillai & Byrne 1994)
7/26/2019 Triggering of Liquefaction Recurring Questions 10-Boulanger
http://slidepdf.com/reader/full/triggering-of-liquefaction-recurring-questions-10-boulanger 27/30
Duncan Dam
0 10 20 30 40 50 60
SPT N 60 values
0 0 10 20 30
(N 1 )60
0 0 0.1 0.2 0.3
CRR M=7.5
0
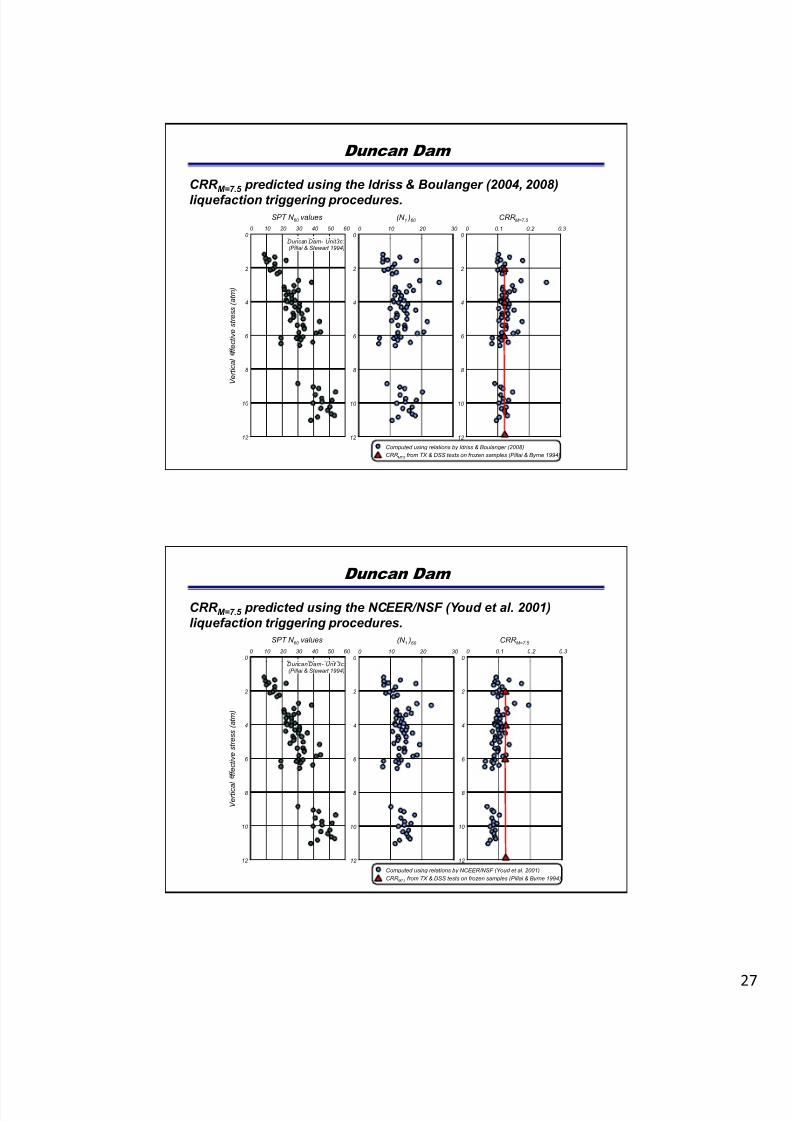
CRR M=7.5 predicted using the Idriss & Boulanger (2004, 2008)liquefaction triggering procedures.
6
4
2
f f e c t i v e s t r e s s
( a t m )
6
4
2
6
4
2
Duncan Dam- Unit3c:(Pillai & Stewart 1994)
12
10
8
V e r t i c a l
12
10
8
12
10
8
Computed using relations by Idriss & Boulanger (2008)CRR M7.5 from TX & DSS tests on frozen samples (Pillai & Byrne 1994)
Duncan Dam
0 10 20 30 40 50 60
SPT N 60 values
0 0 10 20 30
(N 1 )60
0 0 0.1 0.2 0.3
CRR M=7.5
0
CRR M=7.5 predicted using the NCEER/NSF (Youd et al. 2001)liquefaction triggering procedures.
6
4
2
f f e c t i v e s t r e s s
( a t m )
6
4
2
6
4
2
Duncan Dam- Unit 3c:(Pillai & Stewart 1994)
12
10
8
V e r t i c a
l
12
10
8
12
10
8
Computed using relations by NCEER/NSF (Youd et al. 2001)CRR M7.5 from TX & DSS tests on frozen samples (Pillai & Byrne 1994)
7/26/2019 Triggering of Liquefaction Recurring Questions 10-Boulanger
http://slidepdf.com/reader/full/triggering-of-liquefaction-recurring-questions-10-boulanger 28/30
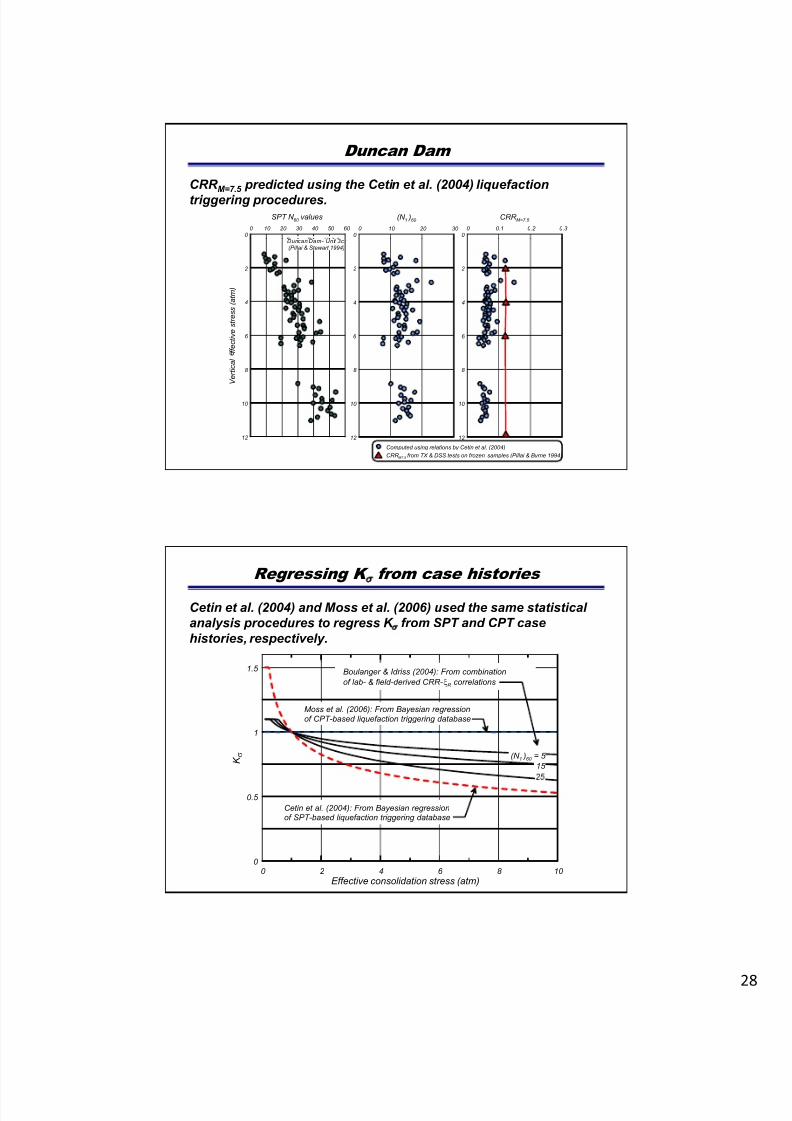
Duncan Dam
0 10 20 30 40 50 60
SPT N 60 values
0 0 10 20 30
(N 1 )60
0 0 0.1 0.2 0.3
CRR M=7.5
0
CRR M=7.5 predicted using the Cetin et al. (2004) liquefactiontriggering procedures.
6
4
2
f f e c t i v e s t r e s s
( a t m )
6
4
2
6
4
2
Duncan Dam- Unit 3c:(Pillai & Stewart 1994)
12
10
8
V e r t i c a l
12
10
8
12
10
8
Computed using relations by Cetin et al. (2004)CRR M7.5 from TX & DSS tests on frozen samples (Pillai & Byrne 1994)
Cetin et al. (2004) and Moss et al. (2006) used the same statisticalanalysis procedures to regress K from SPT and CPT casehistories, respectively.
Regressing K from case histories
1
1.5
K
Moss et al. (2006): From Bayesian regressionof CPT-based liquefaction triggering database
15 (N 1 )60 = 5
Boulanger & Idriss (2004): From combinationof lab- & field-derived CRR- R correlations
0 2 4 6 8 10 Effective consolidation stress (atm)
0
0.5 Cetin et al. (2004): From Bayesian regressionof SPT-based liquefaction triggering database

7/26/2019 Triggering of Liquefaction Recurring Questions 10-Boulanger
http://slidepdf.com/reader/full/triggering-of-liquefaction-recurring-questions-10-boulanger 29/30
Q3: How should we evaluate liquefaction at depths that exceedthose represented in liquefaction case histories?
Back to Question 3
N confining stress, and it fundamentally depends on soildenseness.
For v > 2 atm, the Liao-Whitman (1986) or Kayen et al.(1992) relationships for C N , as adopted for the NCEER/NSF(Youd et al. 2001) procedures, can lead to a significantunder-estimation of (N 1 )60 values for denser soils.
For v > 2 atm, the Boulanger-Idriss (2004) relationship for
C N produces more realistic (N 1 )60 values for denser soils,as supported by calibration chamber test data, penetrationtheory, and field studies.
Q3: How should we evaluate liquefaction at depths that exceedthose represented in liquefaction case histories?
Back to Question 3
soil denseness.
The K relationships regressed from case history data byCetin et al. (2004) & Moss et al. (2006) are not justifiable andshould not be used.
The K relationships by Boulanger & Idriss (2004) or Hynes
& Olsen (1998) are reasonable options.
The procedures by Idriss & Boulanger were in goodagreement with data for Duncan Dam. The NCEER/NSF(Youd et al. 2001) procedures with the Hynes-Olsen K relationship under-estimated CRR for the larger depths.
7/26/2019 Triggering of Liquefaction Recurring Questions 10-Boulanger
http://slidepdf.com/reader/full/triggering-of-liquefaction-recurring-questions-10-boulanger 30/30
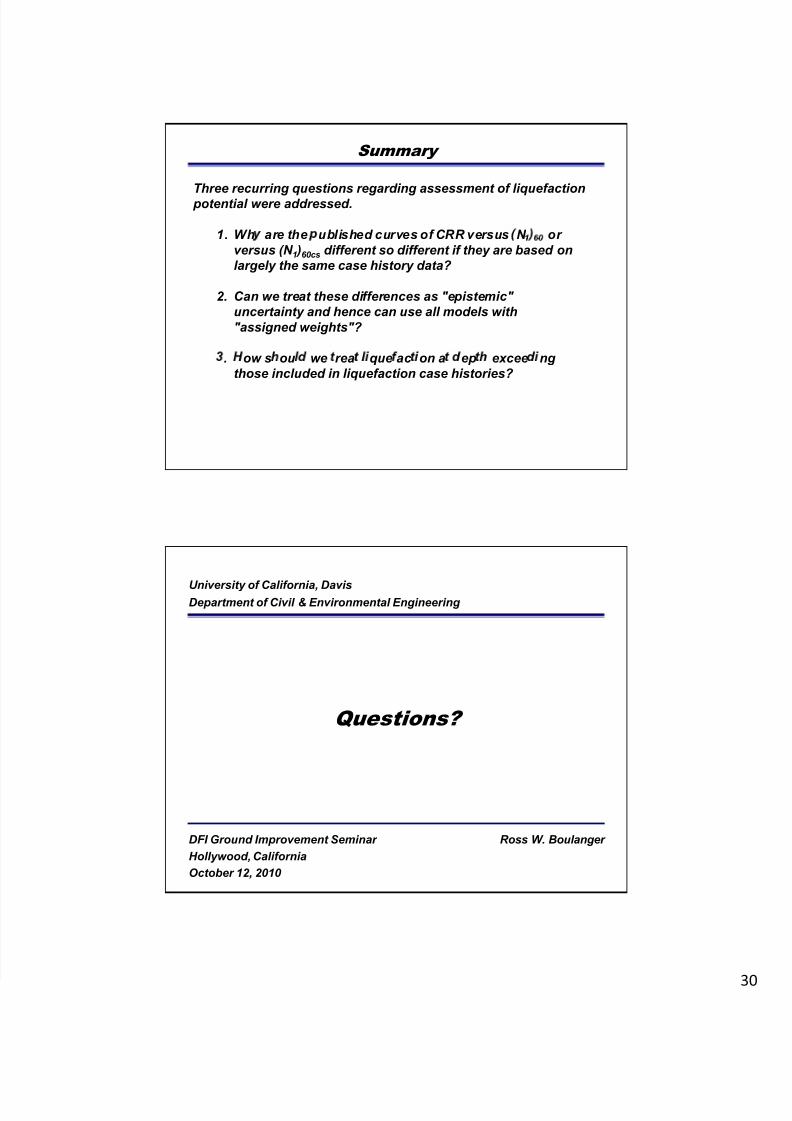
Three recurring questions regarding assessment of liquefaction potential were addressed.
1. Wh are the ublished curves of CRR versus N or
Summary
versus (N 1 )60cs different so different if they are based onlargely the same case history data?
2. Can we treat these differences as "epistemic"uncertainty and hence can use all models with"assigned weights"?
. ow s ou we rea que ac on a ep excee ng those included in liquefaction case histories?
University of California, DavisDepartment of Civil & Environmental Engineering
Questions?
Ross W. Boulanger DFI Ground Improvement Seminar Hollywood, CaliforniaOctober 12, 2010