trilateral best practices: application of technology for
TRANSCRIPT
Trilateral Best Practices: Application of Technology for Reducing Disaster Risks in China, Japan and Korea
July 2021

TCSThe Trilateral Cooperation Secretariat (TCS) is an international
organization established with a vision to promote peace and common
prosperity among the People’s Republic of China, Japan, and the
Republic of Korea. Upon the agreement signed and ratified by each of
the three governments, the TCS was officially inaugurated in Seoul in
September 2011.
UNDRR ONEA The UNDRR Office for Northeast Asia was established in 2010. ONEA
supports five countries: Republic of Korea, China, Japan, Mongolia
and DPR Korea to reduce disaster risks and to ensure implementation
of the Sendai Framework for Disaster Risk Reduction 2015-2030.
ONEA provides advocacy, policy advice, capacity development and
knowledge management support for countries in the region while
promoting partnerships for disaster risk reduction.
Trilateral Best Practices: Application of Technology for
Reducing Disaster Risks in China, Japan and Korea
Preface (TCS) 4
Preface (UNDRR) 5
Best Practices 6
Case 1 6
[China] Improving disaster management through
the National Natural Disaster Management
System (NNDIMS)
Case 2 8
[China] Integrated response to the challenges of the
typhoon ‘Rumbia’
Case 3 11
[China] Monitoring the dynamic changes of sea ice by
using remote sensing technology
Case 4 13
[China] Landslide disaster emergency rescue assisted
by UAV remote sensing technology
Case 5 15
[China] The resident-engaged community disaster risk
assessment and mapping
Case 6 18
[Japan] The Real-time Earthquake Damage Estimation
System
Case 7 21
[Japan] D e v e l o p m e n t a n d p o p u l a r i za t i o n o f
environmentally-friendly disaster resilience
technology by effective utilization of gabions
Case 8 27
[Japan] Relay-by-Smartphone
Case 9 30
[Japan] Red Relief Image Map innovation to 3D visualization
Case 10 34
[Japan] Aster: Developing sustainable disaster mitigation
with seismic coating by means of business
Case 11 38
[Korea] Korea’s Flood Forecasting and Warning System
reduces unforeseen disaster risks
Case 12 43
[Korea] Korea’s single disaster and safety communications
network (Safe-Net) makes national disaster
management infrastructure stronger with
efficient connectivity
Case 13 47
[Korea] An ICT-based self-quarantine safe protection app
for the COVID-19 pandemic
Case 14 51
[Korea] Public-private partnered emergency drone
operation team for disaster response
Table of Contents
Contributors1
Cases of China - National Disaster Reduction Center of China (NDRCC)
Cases of Japan - Asian Disaster Reduction Center (ADRC)
Cases of the ROK - Ministry of the Interior and Safety of the ROK (MOIS)
- National Disaster Management Research Institute of the ROK (NDMI)
- UNDRR Office for Northeast Asia & Global Education and Training Institute
(UNDRR ONEA & GETI)
Disclaimer
This publication is a product with external contributions. Trilateral Cooperation
Secretariat (TCS) appreciates the contributions of all the cases for promoting
the trilateral disaster management cooperation. However, all the cases are
merely for educational and informational purposes and do not necessarily
reflect the views of TCS. TCS accepts no responsibility for any consequences of
these cases.
1 In the ‘Trilateral Joint Statement on Disaster Management Cooperation’ adopted at the
5th Trilateral Ministerial Meeting on Disaster Management, the three countries agreed
to ‘Give full play to the existing education and training institutions including NDRCC,
GETI and ADRC, to carry out the trilateral cooperation on training such as capacity
building on disaster management’.

4
I am delighted to present you the booklet ‘Trilateral Best Practices: Application
of Technology for Reducing Disaster Risks’ published by Trilateral Cooperation
Secretariat (TCS), in collaboration with National Disaster Reduction Centre of
China (NDRCC), Asian Disaster Reduction Center (ADRC) in Japan, and UNDRR
Office for Northeast Asia & Global Education and Training Institute (UNDRR
ONEA & GETI) in the ROK to follow up the outcomes of the 5th and 6th
Trilateral Ministerial Meetings on Disaster Management. The booklet includes
14 best practices in which the good experience, impacts & results, lessons as
well as relevant challenges are introduced.
China, Japan and the ROK are highly exposed to disasters triggered by natural
hazards. In 2009, the three countries established the Trilateral Ministerial
Meeting on Disaster Management. The heads of government agencies
on disaster management have been gathering biennially and exchanging
cooperative measures to further strengthen the capacities of disaster
prevention and reduction. Due to climate change and urbanization, the
three countries have been encountering more threats and challenges caused
by disasters. The governments and societies of the three countries have
accumulated plenty of experience in disaster prevention and mitigation. It is
essential for the three countries and regions beyond to share the experience,
learn from each other and further develop the capacities to better implement
the ‘Sendai Framework for Disaster Risk Reduction 2015-2030’.
As an intergovernmental organization established by the governments
of China, Japan and the ROK in 2011, the TCS has been supporting and
facilitating the trilateral cooperation mechanisms in various areas among
the three countries during the past 10 years. On the occasion of the 10th
anniversary of the TCS, we hope this booklet could further promote the
exchange among the experts.
Secretary-General of Trilateral Cooperation Secretariat
MICHIGAMI Hisashi
July 2021
Preface (TCS)
5
Science, technology and innovation are critical in accelerating all aspects of disaster
risk reduction; from furthering our understanding of risk to facilitating informed
decision-making, to developing new ways of enhancing resilience.
The ‘Sendai Framework for Disaster Risk Reduction 2015-2030’ recognizes this and
calls for cooperation among scientific and technological communities to develop a
science-policy interface for effective disaster risk management.
In this regard, the countries of Northeast Asia are setting a strong example as to how
science and technology can be leveraged to strengthen disaster risk governance and
improve society’s understanding of disaster risk. Their effective early response to
the COVID-19 pandemic was enabled in large part by their successful utilization of
science and technology; from analyzing large data sets to identify those most at risk,
to ensuring that risk communication messages reached their intended audiences.
This publication highlights some of these examples and more from across the hazard
spectrum. It showcases remote sensing technologies for early warning systems, real-
time earthquake damage estimation, and new infrastructure retrofitting techniques,
to name a few. But it also notes areas where more work is needed to bridge gaps,
highlighting the collective need for further innovation and investment to address
outstanding challenges.
To that end, I commend the signatories to the ‘Trilateral Joint Statement on Disaster
Management Cooperation’, the People’s Republic of China, Japan and the Republic of
Korea, for their commitment to strengthening regional cooperation around disaster
risk reduction and contributing the examples highlighted in this publication.
I hope this collection of good practices will inspire and empower countries,
communities, and practitioners around the world to apply the best knowledge and
tools at their disposal, to invest in building their scientific capability, and to share
their lessons with others.
Only then can we better understand the risks that we face and develop appropriate
national and local strategies to reduce disaster risk and disaster losses and build a
safe and resilient planet.
Mami Mizutori
Special Representative of the Secretary-General for Disaster Risk Reduction and
Head of United Nations Office for Disaster Risk Reduction (UNDRR)
Preface (UNDRR)

6
Best Practices
Case 1
[China]
Improving disaster management through the National Natural Disaster Management System (NNDIMS)
Summary
The National Natural Disaster Management System (NNDIMS) combines information technology and operational
standards, based on China’s Natural Disasters Statistical Regulation. It has realized the comprehensive
management of various information such as natural disaster loss information, disaster relief work information,
and on-site multimedia information. It has provided a unified disaster statistics and reporting platform across
the six-level disaster management organizations, namely central government, province, city, county, township,
and village, that forms a hierarchical model of level-by-level reporting for ordinary disasters and on-site direct
reporting for major disasters. At present, the system receives more than 100,000 disaster reports annually, which
plays an important role in the response and disposal of major disasters in recent years and provides important
information supporting disaster relief work.
The Initiative
The National Natural Disaster Management System (NNDIMS) has been operated since 2009. It used browser/server
architecture and covered all county-level disaster relief departments in the beginning. In the following 10 years, the
system functions were continuously improved, and the scale of applications continued to expand. By the end of
2017, the system had covered all villages and towns in China. It realized the integrated disaster reporting through
desktop and mobile terminals, achieved the communication capability by broadband network and Beidou satellite
and formed a real-time backup operation environment between Beijing and Shanghai.
Based on the NNDIMS, the National Disaster Information Officer Database was completed in 2016. At present, it has
realized the dynamic management of 800,000 disaster information officers and achieved real-time statistics for the
number of disaster information officers and contact information.
The Good Practice & Lessons Learned
The NNDIMS has formed a smooth channel between the ministry and disaster information officers at the village
level, established a direct access channel of emergency information of major disasters, and played an important role
in emergency contact and disaster trends analysis during major disasters.

7
A series of disaster management items for government, business, scientific research, and the public have been
constructed. Nearly 1,000 items have been made every year, such as ‘disaster yesterday’ and ‘disaster review report’,
among others.
Figure 1. National Natural Disaster Management System (NNDIMS)
Impacts and Results
With the support of the NNDIMS, the number of disaster cases reported by provinces has increased from less than
1,000 to more than 100,000, and the reporting time has been sharply decreased to 12.3 hours. 90% of disaster
cases can be submitted within 24 hours. 50% of cases can be submitted within 6 hours, and major disasters can be
submitted within 1 hour.
Future Development
The National Disaster Reduction Center of China (NDRCC) will focus on applying big data technologies to disaster
management:
First, NDRCC will focus on the whole disaster category, the whole process, and the whole chain. Using big data to
analyze the disaster chain, event chain, complex issues and their coupling relationships, to improve the capacities of
comprehensive management and decision-making.
Second, NDRCC will focus on risk identification, assessment, management and control. Discovering and identifying
hidden risks and weak segments of disaster prevention and mitigation through high-precision and long series of
massive disaster data. Establishing a risk assessment method and decision-making system by using disaster loss data.
Third, NDRCC will focus on accurate disaster relief, emergency response and decision-making. NDRCC will carry out
8
capacity-building projects such as disaster trend analysis and precise statistics assessment based on disaster big
data, so as to provide a scientific basis for emergency decision-making and disaster relief policy-making.
Potential for Replication
The NNDIMS has the potential to be replicated due to its simple structure, mature operation model, and detailed
training materials.
Case 2
[China]
Integrated response to the challenges of the typhoon ‘Rumbia’
Summary
Typhoons, as one of the hazards most affecting the national economy of China, have been receiving widespread
attention. In 2018, the typhoon ‘Rumbia’ (international number: 1818) landed on the southern coast of Shanghai
on August 17, brought heavy rains, and caused great losses. Some achievements were obtained because the
central cooperated with local governments in coping with disasters, improving the efficiency of disaster response
and continuously improving the protection facilities. The main challenges were the increased risks of flood
disasters and secondary disasters caused by typhoons. The government coordinated multiple departments for
integrated monitoring and timely released warning information for various disasters. The lessons learned were
that raising people’s risk awareness is extremely critical in risk governance and strengthening the contact with
marine operations personnel is crucial. The response system in this case is replicable for dealing with various
disasters.
The Initiative
In recent years, China has developed at a high speed. Meanwhile, it has also entered a period of frequent disasters
and accidents. On one hand, the impacts of natural disasters continue to expand. On the other hand, people’s lack
of awareness of disasters, inadequate disaster preparedness, as well as increasing dependence on the government
have also contributed to the amplification of the adverse effects caused by disasters. Typhoons, as one of the
hazards most affecting the national economy, have been receiving widespread attention. In 2018, the typhoon
‘Rumbia’ (international number: 1818) landed on the southern coast of Shanghai on August 17 and brought heavy
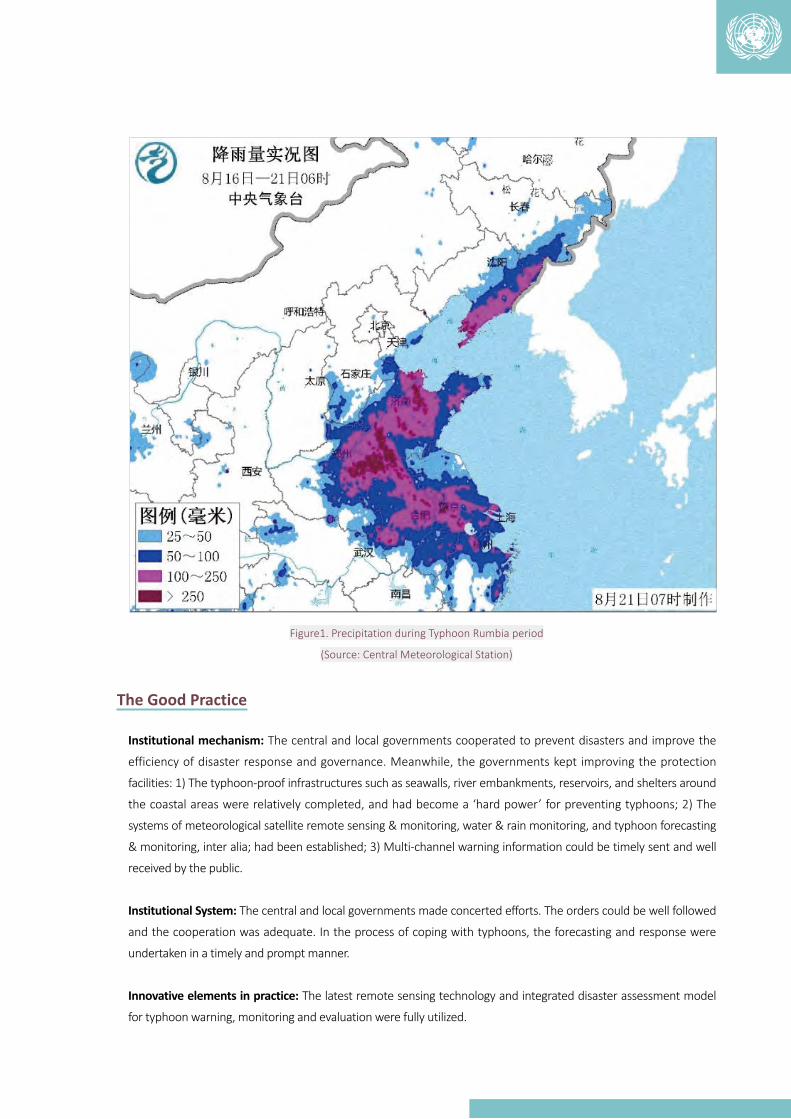
rains in the provinces (city) of Anhui, Shanghai, Zhejiang, Jiangsu, Henan, and Hubei (figure 1). By August 22, Rumbia
caused 31 deaths, 14 missing persons, and affected 14.93 million people in eight provinces. The name of ‘Rumbia’
was removed by the Typhoon Committee due to the significant damage it caused. Analyzing the response to Rumbia
is of great significance for disaster risk governance.
9
Figure1. Precipitation during Typhoon Rumbia period
(Source: Central Meteorological Station)
The Good Practice
Institutional mechanism: The central and local governments cooperated to prevent disasters and improve the
efficiency of disaster response and governance. Meanwhile, the governments kept improving the protection
facilities: 1) The typhoon-proof infrastructures such as seawalls, river embankments, reservoirs, and shelters around
the coastal areas were relatively completed, and had become a ‘hard power’ for preventing typhoons; 2) The
systems of meteorological satellite remote sensing & monitoring, water & rain monitoring, and typhoon forecasting
& monitoring, inter alia; had been established; 3) Multi-channel warning information could be timely sent and well
received by the public.
Institutional System: The central and local governments made concerted efforts. The orders could be well followed
and the cooperation was adequate. In the process of coping with typhoons, the forecasting and response were
undertaken in a timely and prompt manner.
Innovative elements in practice: The latest remote sensing technology and integrated disaster assessment model
for typhoon warning, monitoring and evaluation were fully utilized.
10
Lessons Learned
After the typhoon ‘Rumbia’, 52 lives were lost, including 33 males and 19 females. The main reasons were that
some local residents thought they would be lucky enough to be free from the disaster, so they did not pay attention
to the typhoon. In addition, the area affected by the typhoon was in the tourist season, and many tourists had
insufficient understandings of the typhoon and had insufficient knowledge of self-help. Therefore, raising people’s
risk awareness is extremely critical in risk governance. Moreover, transferring large vessels at sea to avoid risks was
difficult. Large ships were mostly in the open sea with high mobility and the public lacked effective contact methods
of receiving warming information, which made the evacuation more difficult.
To learn from these lessons we need to make improvements: 1) To strengthen the publicity and education on
the risk of typhoons to various groups in different sub-regions; 2) To strengthen contact with marine operations
personnel, especially those in high-risk industries.
Impacts and Results
During the ‘Rumbia’ typhoon, 1) By August 20, firefighters in Shanghai, Jiangsu, Zhejiang, Anhui, Henan and other
places had rescued more than 1,400 people trapped and transferred more than 4,300 people; 2) Firefighters of
Jiangsu province evacuated 230 people; 3) Firefighters of Shushan District, Hefei City, Anhui Province rescued and
evacuated more than 60 people; 4) Firefighters of Shangqiu City, Henan Province rescued and transferred of 30
trapped people.
The Challenges
Major challenges: 1) Floods and secondary disasters caused by typhoons have become the main challenges,
including heavy rainfall, the high water level in rivers and lakes, as well as excessive water storage in reservoirs; 2)
The typhoon weather services also face the challenge since the impact of the typhoon on a region is multifaceted.
The demand for decision-making is different from the demand for public services. The needs for water conservancy,
power supply, transportation, agriculture and other industries are also different. These require more attention to the
classification of typhoon meteorological services.
Measures to overcome: 1) In order to overcome the challenges induced by increased flood risks and secondary
disasters, the government has coordinated multiple departments for integrated monitoring and timely release
of warning information of various disasters. 2) The classification of typhoon meteorological services is still under
exploration.
Potential for Replication
The practice in responding to the ‘Rumbia’ typhoon can be a reference to deal with various disasters. For example,
building the ‘top-down synergy’ systems, making disaster management plans, and establishing a preventative
engineering system are also very crucial for reducing risks induced by different hazards such as earthquakes,
landslides, droughts, snowstorms, etc.

11
Case 3
[China]
Monitoring the dynamic changes of sea ice by using remote sensing technology
Summary
The Bohai Sea and the northern Yellow Sea are sea ice disaster-prone areas. Due to the geographical locations
of north latitude, they are susceptible to the cold air moving from the north to the south. Every winter there is
sea ice with different extent and thickness in those areas, which causes varying degrees of impacts to the ocean
transportation and port operations. Using satellite remote sensing technology based on spectral analysis and
information extraction, the dynamic monitoring of the process of occurring, developing and melting of sea ice
could be achieved.
The Initiative
Sea ice is a common marine hazard. The monitoring of sea ice is an important part of marine disaster prevention
and mitigation. Sea ice occurs every winter in the Bohai Sea and the northern coastal waters of the Yellow Sea in
China. Every winter, experts use remote sensing technology to monitor sea ice changes.
The Good Practice
In the winter of 2009, the most serious sea ice disasters occurred in the Yellow Sea and the Bohai Sea during the
same period in the past 30 years. The direct economic loss of fisheries in Shandong Province exceeded 2.2 billion
yuan, and the fishermen suffered heavy losses. As far as the observation of sea ice is concerned, it has long relied
mainly on fixed observatories, coastal sea ice surveys and icebreaker surveys. Although these methods can obtain
more detailed sea ice information of a certain area, it is difficult to obtain real-time and large observation data of the
area. These real-time and large-area observation data form an important basis for the early warning and prediction
of sea ice disasters. In recent years, with the development of remote sensing technology, satellite remote sensing
has gradually become an efficient means of sea ice observation.
1. https://www.sohu.com/a/249339620_114731
2. http://news.cnr.cn/native/gd/20180819/t20180819_524336056.shtml
3. https://baijiahao.baidu.com/s?id=1609321463664092069&wfr=spider&for=pc
References
12
Lessons Learned
The key lesson learned from this initiative is to increase remote sensing monitoring capacity. For optical satellites,
using the visible and near-infrared channel data, combined with the spectral characteristics of sea ice, seawater and
clouds in visible and infrared channels, sea ice identification and extraction can be achieved.
Impacts and Results
The National Disaster Reduction Center of China under the Ministry of Emergency Management has provided sea
ice monitoring products and services based on the images obtained from various earth observation satellites since
2008 for the national disaster management agency. They are also published on the website of NDRCC.
The Challenges
Due to the large coverage area of sea ice, satellite remote sensing plays an important role in large-scale routine
monitoring. However, previous sea ice monitoring was mainly based on individual cases. The risk of sea ice
development will impact fisheries and shipping. Continuous remote sensing monitoring in time and space should
become the trend of future development.
Potential for Replication
This initiative has great potential for replication. Optical remote sensing technology can also be applied to flood
monitoring. It monitors the flooded area by comparing the changes in water coverage before and after the flood
disaster.
1. http://blog.sina.com.cn/s/blog_764b1e9d0100xcji.html
2. http://www.mem.gov.cn/kp/zrzh/hyzh/201904/t20190401_243460.shtml
3. http://www.cnki.com.cn/Article/CJFDTOTAL-SKYK201004018.htm
References
13
Case 4
[China]
Landslide disaster emergency rescue assisted by UAV remote sensing technology
Summary
To cope with the Shuicheng landslide emergency, the Ministry of Emergency Management of China used UAV
(Unmanned Aerial Vehicle) remote sensing technology to carry out comprehensive and precise monitoring and
analysis of the disaster area. This provided strong information support for the rescue team and achieved good
application results. Through this practice, the UAV disaster emergency monitoring business chain has initially
been established. However, the complex on-site environment also poses challenges to UAV disaster reduction
applications. In the future, through multi-party cooperation, the aviation remote sensing disaster emergency
monitoring business chain will be improved, and promote UAV technology to become one of the main technical
means to deal with earthquakes, geological disasters, and other disasters.
The Initiative
On 23 July 2019, a landslide occurred in Shuicheng County, Guizhou Province. There were many casualties as a
result. The topography of the site was undulating, the broken surface of the landslide was unstable, and the safety
risk of the rescuers was high. Houses in the landslide area were completely washed away and buried, it was difficult
to judge the original locations and possible burial locations. The emergency rescue was immensely difficult. In order
to accurately understand the so-site situation and find the location of the buried houses, it was urgent to carry out
comprehensive and detailed monitoring and analysis of the landslide sites.
During July 24-25, NDRCC carried out oblique aerial photography on the landslide area to obtain two remote
sensing images with 5cm resolution and 5 lens phases, covering 1.7 km2 of the landslide and the surrounding impact
area. After the flight on the same day, the front UAV team and the rear support working group immediately carried
out data processing and analysis, focusing on analyzing the possible buried locations of the destroyed buildings and
the risk of secondary landslides, making product drawings, and publishing many three-dimensional models online.
These models included three-dimensional models of the landslide sites, the locations of the damaged buildings, and
secondary landslide risk assessment, inter alia, all of which were provided to the headquarters for decision-making.
This emergency response provided powerful information support for the rescue team to fully and accurately
understand the terrain on-site, deploy rescue forces, and formulate rescue plans.

14
The Good Practice
The UAV remote sensing technology responds flexibly and can enter disaster areas that are difficult for people
to enter. It can quickly obtain high-resolution remote sensing images and provide strong technical support and
information support for emergency rescue and command decision-making. This emergency response establishes
a business process from the acquisition of UAV remote sensing data to information extraction and product online
release, and the preliminary establishment of an aviation remote sensing disaster emergency monitoring business
chain, which is a successful practice of drone technology for disaster reduction application. The key factors for
success include the timely reporting of disasters, the rapid response of the drone team, and the online release of
products. Innovative factors in practice include the cooperation mechanism of drone response and the application
of drone technology in emergency rescue.
Lessons Learned
Some provincial emergency management departments have not yet incorporated aviation remote sensing into the
disaster emergency monitoring business chain. The construction of UAV remote sensing monitoring networks lacks
the full support of local provinces and cities in terms of policies, funds, and manpower. UAVs are used for multi-level
disaster reduction applications. There is a lack of funds for the construction of remote sensing data processing centers.
Future suggestions include: Promoting the construction of a cooperative mechanism for aviation remote sensing
such as the ‘Disaster Emergency Response UAV Monitoring Cooperation Mechanism’, building a low-altitude UAV
emergency monitoring and response system covering natural hazard high-risk areas, covering the entire process
of disaster risk reduction, preparedness and emergency management, and gradually establishing multi-channel
funding channels. The supported high-performance UAV remote sensing application data processing center solves
the problems of capital and manpower shortage through multiple channels.
Impacts and Results
It is important to improve the aviation remote sensing disaster emergency monitoring business chain to provide
comprehensive and accurate information support and decision support for disaster emergency management.
The Challenges
There are two main areas of current challenges:
(A) Rapid acquisition of disaster monitoring data. The disaster occurs in a wide area, the time of occurrence is
difficult to predict, and it is difficult to reach the disaster area quickly by the strength of one unit. At the same time,
there are adverse weather conditions such as cloud, fog, rain, and strong wind and poor light for night rescue work
in the disaster areas. The all-weather monitoring capabilities of the man-machine disaster emergency monitoring
system, the continuous monitoring capabilities of the disaster site, and the risk assessment capabilities pose
challenges. It is necessary to establish a cooperative relationship with local units and social force drone teams, carry
out the construction and operation of social force drone emergency cooperation mechanism, increase the research
and development and experiment of special loads such as special drone platforms and thermal infrared, and solve
technical problems of emergency application of man-machine disaster.
15
(B) Quick processing of data. The amount of monitoring data acquired by the UAV is large, and the data processing
requires the high performance of the machine. It is difficult for the mobile terminal on-site to meet the demand. It’s
necessary to use a variety of ways to transmit data, establish a high-performance data processing center, to ensure
the efficient processing of data.
Potential for Replication
It is necessary to establish a complete process of UAV disaster emergency monitoring data acquisition, processing,
analysis, information extraction, and product release, form an aviation remote sensing disaster emergency monitoring
business chain, and promote UAV technology to respond to earthquakes, geological disasters, floods and other
natural disaster risks.
Case 5
[China]
The resident-engaged community disaster risk assessment and mapping
Summary
The community disaster risk assessment is widely accepted by international organizations and governments of
different countries. Promoting the assessment and mapping of community disaster risks has become a basic
trend of community disaster prevention and mitigation. By improving China’s existing resident participatory
community disaster risk mapping technology, we have established a new technology, which introduces
single-disaster and multi-hazard risk identification and assessment technology, increases the risk assessment
of community-by-house, and improves the accuracy of community disaster risk assessment. And the new
technology does not require the participation of professional institutions and can be completed by relying
solely on the residents of the community. The cost is low, and the feasibility of promoting the application in
the community is very high. In 2017, we produced community disaster risk maps for 3 communities in China,
2 communities in Nepal and 2 communities in Bangladesh, including single-hazard risk maps for earthquakes,
floods, typhoons, fires, etc., and comprehensive risk maps for multiple disasters. These risk maps have been
provided to community managers to support their disaster prevention and mitigation efforts.
The Initiative
The community disaster risk assessment is widely accepted by international organizations and governments of
different countries. Promoting the assessment and mapping of community disaster risks has become a basic trend
of community disaster prevention and mitigation. At present, community disaster risk mappings in many countries
highly rely on professional mapping institutions. Such mappings are costly, complex, and difficult for residents to
finish by themselves, so it is impossible to spread them over the country. The resident-engaged community risk
mapping is an effective mapping method that is widely accepted in China.
16
The Good Practice
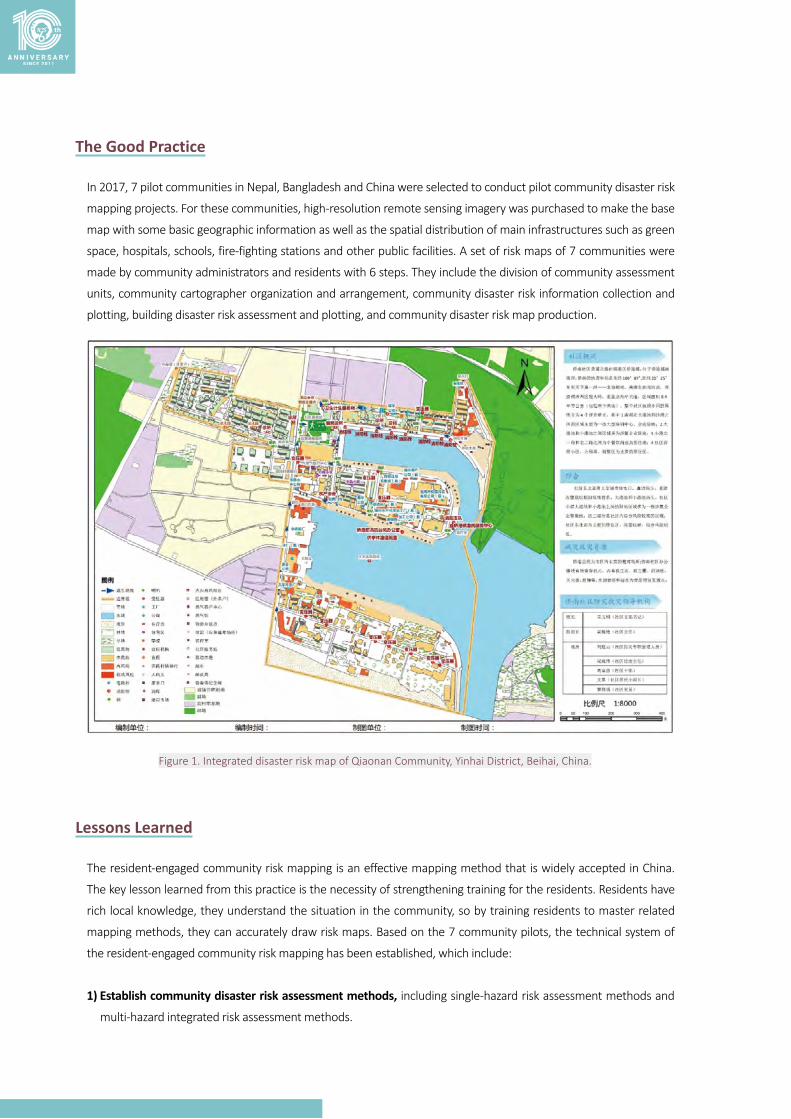
In 2017, 7 pilot communities in Nepal, Bangladesh and China were selected to conduct pilot community disaster risk
mapping projects. For these communities, high-resolution remote sensing imagery was purchased to make the base
map with some basic geographic information as well as the spatial distribution of main infrastructures such as green
space, hospitals, schools, fire-fighting stations and other public facilities. A set of risk maps of 7 communities were
made by community administrators and residents with 6 steps. They include the division of community assessment
units, community cartographer organization and arrangement, community disaster risk information collection and
plotting, building disaster risk assessment and plotting, and community disaster risk map production.
Figure 1. Integrated disaster risk map of Qiaonan Community, Yinhai District, Beihai, China.
Lessons Learned
The resident-engaged community risk mapping is an effective mapping method that is widely accepted in China.
The key lesson learned from this practice is the necessity of strengthening training for the residents. Residents have
rich local knowledge, they understand the situation in the community, so by training residents to master related
mapping methods, they can accurately draw risk maps. Based on the 7 community pilots, the technical system of
the resident-engaged community risk mapping has been established, which include:
1) Establish community disaster risk assessment methods, including single-hazard risk assessment methods and
multi-hazard integrated risk assessment methods.
17
2) Develop the indicator system for community disaster risk assessment, including urban and rural communities.
3) Formulate a technical specification for community disaster risk assessment, including the technical process for
community disaster risk assessment, the disaster risk assessment form for community residents, and standards
for community disaster risk mapping, etc.
Impacts and Results
Through this practice, we have improved China’s existing resident participatory community disaster risk assessment
and mapping technology. The original method is only a simple mapping of community risk points while the new
method introduces single-disaster and multi-hazard risk identification and assessment technology, increases the risk
assessment of community-by-house, and improves the accuracy of community disaster risk assessment.
Using the new method established by this practice, we produced community disaster risk maps for 3 communities
in China, 2 communities in Nepal, and 2 communities in Bangladesh, including single-hazard risk maps for
earthquakes, floods, typhoons, fires, etc., and comprehensive risk maps for multiple disasters. These risk maps have
been provided to community managers to support their disaster prevention and mitigation efforts.
The Challenges
The main challenge to the resident participatory community disaster risk assessment and mapping methodology
established by this practice is the production of community base maps. The practice specifically procured high-
resolution true remote sensing images for pilot studies to support 7 communities and asked professional
personnel to produce high-precision community base maps, so the pilot work was very effective. The production of
community base maps is one of the most difficult things we face when promoting to other communities. Although
our technology recommends a variety of methods, such as manual drawing, downloading from the network
electronic map, the effect of using base maps obtained by different methods to create community disaster risk
maps is different. Luckily, web-based electronic maps such as Google Maps provide a relatively detailed base map
for communities and effectively support residents’ participatory disaster risk mapping.
Potential for Replication
The method established by this practice does not require the participation of professional institutions and can be
completed by relying solely on the residents of the community. The cost is low and the feasibility of promoting its
application in the community is very high. The method has been extended to communities throughout China, and it
is also suitable for extending to communities in other countries around the world.
1. Granger K, Jones T, Leiba M, et al. Community Risk in Cairns: A Multi-Hazard Risk Assessment[J]. Australian Journal of Emergency Management, 1999, 14(2):25-26.
2. John A. S. Community Risk Assessment[R]. Community Risk Reduction, 2015:14-173. Maskrey A. Disaster mitigation: a community-based approach. [J]. Oxford England Oxfam, 1989.4. Shaw R. Community Practices for Disaster Risk Reduction in Japan[M]. Springer Japan, 2014.
References
18
Case 6
[Japan]
The Real-time Earthquake Damage Estimation System
Summary
‘The Real-time Earthquake Damage Estimation System’ was developed for utilizing a real-time damage
estimation and identification system in the event of a massive earthquake or similar widespread disaster. This
new system can estimate spatial ground motion distribution using seismic intensity information sent at different
timings from observation stations. Also, this system was installed for the Kumamoto earthquake in April 2016.
Damage estimation information was immediately sent to the local response headquarters, where it was used as
basic data for establishing the initial response.
The Initiative
In the event of a disaster, it is important to immediately identify damage in order to establish the appropriate initial
actions and disaster response. The lessons learned from a delay in emergency response measures during the 1995
Great Hanshin Earthquake and difficulty in assessing widespread damages at the time of the 2011 Great East Japan
Earthquake highlighted the importance of immediately identifying damages in a panoramic or area-wide view
and integrating the information at the phases of preliminary response, emergency measures, and recovery and
restoration measures for the comprehensive and immediate decision-making process.
While damage estimation systems have been established at the national, municipal, corporate, and other levels, an
insufficiency in estimation accuracy or difficulty in identifying the overall disaster from a panoramic perspective has been
pointed out. From such a background, this project which began in 2014 has been researching and developing a real-time
damage estimation and identification system in the event of a massive earthquake or similar widespread disaster.
This system estimates spatial ground motion distribution using seismic intensity information sent at different timing
from observation stations. Additionally, it estimates population exposure to seismic intensity and building damage using
estimated ground motion as input. The information is provided to users via Web browser or email using Web GIS.

19
EQ DamageEstimation Information
Capable of Providing
SI data
SI data
Estimated SI distribution(250-m mesh)
1,700
3,600
Strong MotionObservation EQ Damage Estimation
• Building-related data by structure and age• fragility curve
• Building damage
• Population exposure to seismic intensity• Human damage
• Daytime/nighttime population data
Local governments&JMA
K-NETKiK-net
Figure 1: Evaluation Flow of Earthquake Damage Estimation System
The Good Practice
This initiative is a good practice because it corresponds with the target (a), (c), (g), and Priority 3 & 4 of the Sendai
Framework. Just after an earthquake occurs, it is important to know the outline of the earthquake damage and
establish the appropriate initial actions based on the information. However, in the past earthquake disasters
in Japan, we have experienced that areas with greater damage are more difficult to grasp. By using real-time
earthquake damage estimation, it is possible to predict the damage in about 10 minutes even for a large earthquake.
This allows the central government, local governments, and companies to consider early disaster responses based
on that information. If the initial response can be established without wasting time, it will be possible to rescue
quickly and prevent secondary disasters. As a result, the number of deaths and economic loss can be reduced.
Lessons Learned
The first major earthquake to apply the Real-time Earthquake Damage Estimation System was the Kumamoto
earthquake that occurred in 2016. Two big earthquakes occurred (on April 14th and 16th) causing great damage. The
system issued the final estimation report within approximately 10 minutes. Upon inspection for precision, it became
clear that the estimated spatial distribution of the belt-shaped region at Mashiki-town qualitatively agrees with the
actual damage. The areas with estimated damage tend to have larger estimates compared with actual damage.
The system was then used during the Earthquake in Osaka-Fu Hokubu in 2018 and the 2018 Hokkaido Eastern Iburi
Earthquake. Application of the system to those earthquakes confirmed the high practicality of this system.

20
Actual damage Estimated damage
1 - 2 2 - 5 5 - 10 10 - 20 20 - 50 50 - 0
Total number of destroyed buildings for each 250m mesh
Figure 2: Comparison of spatial distribution of the actual destroyed buildings and the estimated destroyed buildings in the Mainshock (M7.3)
Impacts and Results
Damage estimation information in 2016 Kumamoto was immediately sent to the local response headquarters,
where it was used as basic data for establishing the initial response system. By showing the outline and effectiveness
of this system widely at academic societies and symposiums, it has attracted attention from private companies
and local governments. Aiming for implementation in society, an experimental consortium was established and an
appropriate framework for information distribution has been studied.
The Challenges
To realize implementation in society, this plan should be improved the accuracy, and enhance its functions
considering users’ needs. Among those is the need to apply a multi-hazard approach. The system has been studied
for the application not only to earthquake disasters but also to tsunamis and heavy rain.
In order for this system to be used safely in disaster prevention measures and business continuity plans (BCP), stable
operation of the earthquake observation network and damage estimation system is indispensable. Securing funds
and human resources will be a future issue.
Potential for Replication
In this system, damage estimation is based on actual observation data. Therefore, to introduce this system, it
is essential to enhance the observation network. In addition, in order to use the obtained damage estimation
information effectively, it is necessary to improve the communication environment.
21
1. http://www.j-risq.bosai.go.jp/report/
2. http://www.mowlas.bosai.go.jp/
3. http://www.j-shis.bosai.go.jp/
4. http://crs.bosai.go.jp/DynamicCRS/index.html?appid=7f61007cafa949708cd5471bc6c52188
5. https://www.jishin.go.jp/evaluation/seismic_hazard_map/
References
Case 7
[Japan]
Development and popularization of environmentally-friendly disaster resilience technology by effective utilization of gabions
Summary
Significant damage due to natural disasters in developing countries can bring hardship to recover from the
damage left in the wake of disasters. From this point of view in this project, the development of multipurpose
and effective utilization of gabion as environmentally friendly disaster resilience technology that is low
technology and low cost is being promoted for adaptive resilience. A Japanese research team is studying how
gabion structures can deliver disaster resilience technology for developing countries, ultimately producing
improved procedures and guidelines for structural construction based on damage survey, full-scale model
experiment and on-site test construction.
The Initiative2
Natural disasters can result in significant damage across the world and leave communities grappling with the social,
economic and environmental consequences for years. Developing countries, in particular, can struggle to recover
from the damage left in the wake of disasters. In Japan, the development of environmentally friendly disaster
resilience technology that is low technology and low cost is being promoted for adaptive resilience in developing
countries: the development of multipurpose and effective utilization of gabion.
Gabions are cages woven from steel wire, filled with smashed rocks and stones. A simple and flexible structure, low
cost and simple to construct, they are used all over the world and can be applied in various ways to improve disaster
2 Impact, ISSN2398-7073, pp.67-69, 2018. ( Impact, Volume 2018, Number 1, March, DOI: https://doi .org/10.21820/23987073.2018.67, 2018.)

22
resilience. Gabions can be sourced from local raw materials, making it a highly adaptive and versatile technology.
A Japanese research team is studying how gabion structures can deliver disaster resilience technology for
developing countries, ultimately producing improved procedures and guidelines for structural construction based on
damage survey, full-scale model experiment, and on-site test construction. As a collaborative effort, Japan’s National
Research Institute for Earth Science and Disaster Resilience (NIED) is working alongside Kochi University and Saga
University as well as industrial partners comprising two design consultants, a manufacturer and a construction
company. This project was funded by Grants-in-Aid for Scientific Research (Number JP16H05746) and Grants-in-Aid
for Scientific Research (Number JP16H04413) by the Japan Society for the Promotion of Science, and additionally
JICA Partnership Program proposed by Yusuhara Town, Kochi prefecture and Kochi University.
Figure 1: Gabion Retaining Wall for Road (Photo by Dr. Nakazawa)
Damage survey of the 2015 Nepal Gorkha Earthquake3
A field survey and analysis of the causes of damage to gabion-based retaining walls were conducted, after which
shaking table tests using full-scale models were performed.
3 Hara, T., Nakazawa, H., Suetsugu, D., Kuribayashi, K., Nishi, T., Tadokoro, Y., Miyoshi, K. and Zhang, H. Field survey on damages of gabion structures caused by the 2015 Nepal Gorkha Earthquake and examination of specific measures for earthquake resistaance improvement, Journal of Japan Society of Civil Engineers, Ser. A1, Vol.74, No.4, pp. I_586-597, 2018. (in Japanese)

23
According to damage survey in Araniko Highway in Nepal, for the 115 gabion-based structures along the Araniko
Highway, the use, structure, surrounding conditions, gabion dimensions and damage conditions, as well as the
grid and wire dimensions, and the filling material quality and dimensions, were all surveyed. The results show that
gabion-based structures were used as retaining walls at 56 locations (49%), as crash barriers at 22 locations (19%),
for riverbank and channel protection, etc. at 17 locations (15%), for erosion control dams at six locations (6%),
and as retainment barriers to prevent earth collapse at 13 locations (11%). Many of the retaining wall gabion units
appeared to have sizes that were adjusted to match field conditions, although their widths, heights, and depths
generally measure around 100 cm, and many upright walls had heights of about 3 m.
Damage patterns were classified into three levels: (a) no damage, (b) partial damage, and (c) collapse, with around
80% of those surveyed classified as partial or no damage. These findings showed that the minimum road function
had been maintained in many cases, which demonstrates the durability of gabion-based retaining walls (Reported
by Hara et al.2).
a b c
Figure 2: (a) refers to retaining walls judged to be undamaged in the damage survey,
(b) to those that were partially deformed or bulged out, and (c) to those that had collapsed.
Full-Scale Experiment4
The research team carried out full-scale model shake table tests to estimate the earthquake resistance of the gabion
retaining wall. These experiments were performed at Large-Scale Earthquake Simulator (LSE) of NIED, Tsukuba,
Japan. The facility features a 1-D shake table that applies strong motion to a full-scale prototype structure or a large-
scale model, and the table can simulate ground motion recorded in a large earthquake like the Kobe Earthquake (JMA
Kobe) in order to observe the model’s collapse process and to obtain data for analyses.
The retaining wall model was a three-layered structure, and each layer was built in different stacking ways to imitate
a retaining wall actually damaged in the 2015 earthquake. In addition, the ground was constructed behind the
retaining wall.
In the shake table tests, a sinusoidal wave of 8 seconds (3Hz) was used. The intensity of the input motion was
gradually increased up to the maximum acceleration of about 300 Gal. In this series of experiments, three cases
4 Nakazawa, H., Hara, T., Suetsugu, D., Nishi, T., Kuribayashi, K., Miyoshi, K. and Shimomura, S. Experimental evaluation on earthquake-resistance of road retaining wall using gabion, Journal of Disaster Research, Vol.13, No.5, pp.897-916, 2018. (doi: 10.20965/jdr.2018.p0897)

24
were compared: a typical vertical retaining wall in Nepal (Case 1), a stepwise type (Case 2), and gravity type added
a number of gabions (Case 3). In Case 1, although the wall did not collapse after shaking, it was significantly
inclined. This type of retaining wall deformation was also commonly observed in Nepal. Though the retaining wall
was soft and unstable, a large deformation occurred by shaking was thought to be the reason why they did not
eventually overturn. In the other two cases, the deformation was slight and stable. Based on these results the
team recommended the structure design and construction method suitable for Nepal and summarized them in the
guidelines.
Figure 3. State of Experiment (Example of Case 1)
Figure 4. Results of 3D Measurements. (a) Before shake test.
(b) After shaking at 203 Gals. (c) Residual deformation after final shake test
The Good Practice of Test Construction and Making Guidelines5
Based on the results of the investigations and the tests, structural problems of gabion walls were identified and
5 Shun Kimura, Tadashi Hara, Daisuke Suetsugu, Hiroshi Nakazawa, Tsuyoshi Nishi, Shoji Shimomura, Ryu Shibahara and Kentaro Kuribayashi: An issue of seismic structure and construction regarding gabion wall in rural area of Nepal, 7th Asia Conference on Earthquake Engineering, No.0151, 10p, Bangkok, 2018.

25
modifications were proposed to improve their seismic stability. Furthermore, test construction of two types of
gabion walls was executed, namely the current gabion wall used in Nepal and the modified gabion wall of Dhading
district, Nepal. Both walls are the same height, but the shapes and method of installation are different. The tests
focused on the building methods of the gabions. The current gabion wall is shaped like a gravity retaining wall but
stands upright like Case 3. In contrast, the modified gabion wall is shaped like a leaning-type retaining wall and built
in a stepwise shape like Case 2.
In this test construction, to confirm the difference of structural specifications based on the comparison between
modified gabion walls and current gabion walls, the deformation was observed in each gabion wall from the
measurements conducted at the site after the construction. As a result, it can be thought that although the leaning wall
type gabion retaining walls use a smaller number of gabion boxes than the gravity wall type, sufficient stability can be
secured against active soil pressure and deformation in the horizontal direction. Also judging the condition of the two
types after 6 months of construction, both can be said to have maintained stability. Based on these findings, the items
to be protected in the design and construction of the gabion retaining wall are summarized in the guideline.
Figure 5. State of Test Construction of Gabion Retaining Wall before and after Construction
Figure 6. Gabion Shape in Test Construction Types like Case2 and Case3
26
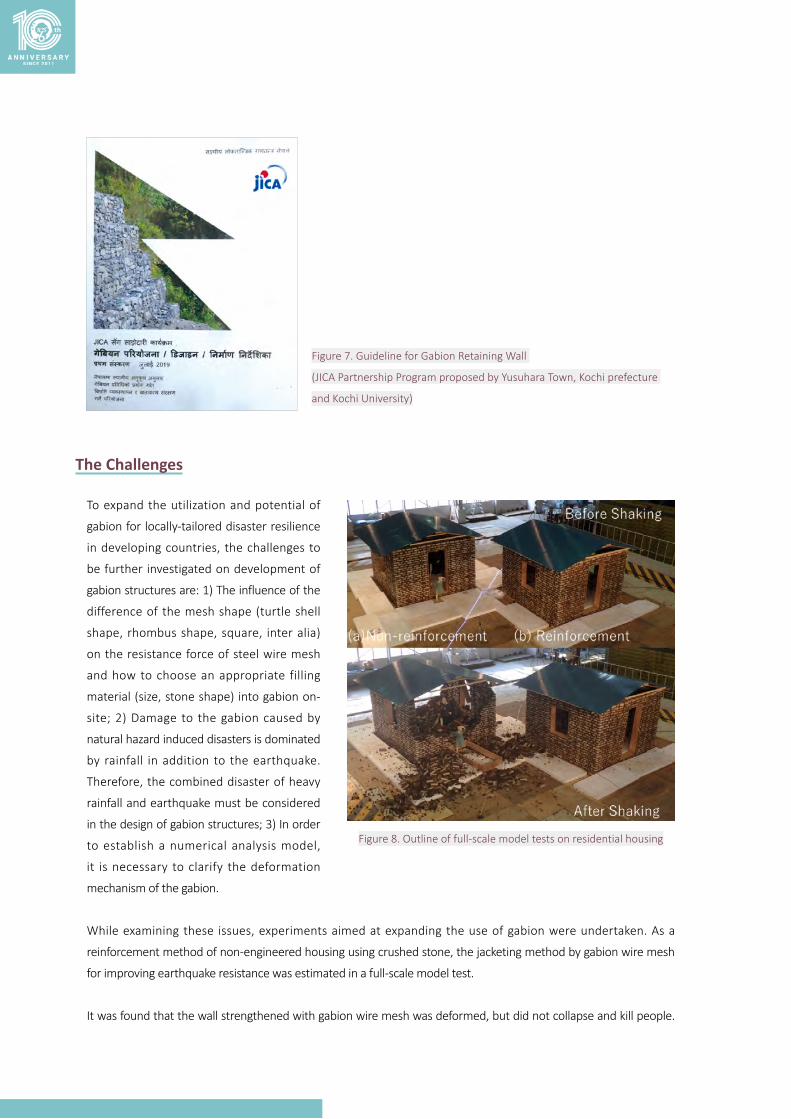
The Challenges
To expand the utilization and potential of
gabion for locally-tailored disaster resilience
in developing countries, the challenges to
be further investigated on development of
gabion structures are: 1) The influence of the
difference of the mesh shape (turtle shell
shape, rhombus shape, square, inter alia)
on the resistance force of steel wire mesh
and how to choose an appropriate filling
material (size, stone shape) into gabion on-
site; 2) Damage to the gabion caused by
natural hazard induced disasters is dominated
by rainfall in addition to the earthquake.
Therefore, the combined disaster of heavy
rainfall and earthquake must be considered
in the design of gabion structures; 3) In order
to establish a numerical analysis model,
it is necessary to clarify the deformation
mechanism of the gabion.
While examining these issues, experiments aimed at expanding the use of gabion were undertaken. As a
reinforcement method of non-engineered housing using crushed stone, the jacketing method by gabion wire mesh
for improving earthquake resistance was estimated in a full-scale model test.
It was found that the wall strengthened with gabion wire mesh was deformed, but did not collapse and kill people.
Figure 8. Outline of full-scale model tests on residential housing
Figure 7. Guideline for Gabion Retaining Wall
(JICA Partnership Program proposed by Yusuhara Town, Kochi prefecture
and Kochi University)

27
The life safety performance level was high. This method is developed toward the improvement of earthquake safety
of non-engineered buildings in Nepal.
The Goal
The ideals and goals of this effort are: 1) Probe the potential disasters/main causes of damage for each country
and develop and implement disaster resilience technologies tailored to the locality, keeping in mind each country’s
unique technologies/technical level; 2) Suggest effective pre-emptive countermeasures to the locality; 3) Educate
technicians and support self-reliance; 4) Through expanded end-usage/adoption of low-tech, local and low-cost
gabion, evolve gabion into an even more effective countermeasure technology.
Case 8
[Japan]
Relay-by-Smartphone
Summary
When disasters happen, we will face a large-scale dis-communication due to damage by disasters. In order
to solve this problem, ‘Relay-by-Smartphone’ was developed to communicate with people to share a
message about their safety and rescue requests in the affected area. ‘Relay-by-Smartphone’ engine enables
communication with another smartphone up to 70 meters away. If the person who holds data reaches an
area where the internet is available, the data can be uploaded to the cloud. This system has been already test-
installed for Kochi prefecture which might face risks to be brought by the Nankai Trough Earthquake.
Motivation
In 2011 the Great East Japan Earthquake struck Japan with serious damage caused by the massive tsunami that
followed. As a consequence, a large-scale communication disruption occurred and the area faced a situation where
the scale of the damage or the conditions of the victims could not be grasped at all. ‘Relay-by-Smartphone’ was
developed to allow people in the affected area to disseminate their safety and rescue requests in such situations.
Good Practice
‘Relay-by-Smartphone’ was coined by Professor Nishiyama of Tohoku University who developed this technology. He
experienced the Great Earthquake and realized that loss of communication has huge negative impacts on a rescue
operation. He conceived this technology so that victims of a disaster could send out a distress signal by themselves
even when the existing networks are down. The core idea is to relay data between smartphones by using only

28
standard functions on a smartphone. An app powered by the ‘Relay-by-Smartphone’ engine can be easily installed
and then its use is ready to go. Users can communicate with another smartphone up to 70 meters away. If the
person who holds data reaches an area where the Internet is available, the data can be uploaded to the cloud.
Figure 1. General mechanism of ‘Relay-by-Smartphone’
Lessons Learned
It is said that the big Nankai Trough earthquake will happen in the near future. The Nankai Trough Earthquakes had
hit the southwestern part of Japan every few hundred years. It is known to cause large-scale tsunamis in the coastal
areas and has historically devastated many cities. Kochi City is one of them. Kochi is located on the island of Shikoku.
The city has a population of around 330,000 and its scenery is quite beautiful. However, 2,800 hectares of the city,
including the city center, would be flooded by the tsunami. To make matters worse, the tsunami would reach the city
in a shorter time because the epicenters of Nankai Trough are close to the coast. It is estimated that the residents
have only 15 minutes to evacuate. Thus, Kochi City decided to have residents evacuate not to hills, but to the upper
floors of buildings that can withstand the tidal waves. For this purpose, more than 300 tsunami evacuation buildings
including newly built ones have been set up in the city. The residents can escape from the tsunami by evacuating to
the upper floors of these buildings. However, the center of Kochi City is expected to be flooded for a month due to
the land subsidence caused by the earthquake. Many citizens will therefore be left behind on the upper floors of the
evacuation buildings.
Impacts and Results
Kochi City needs to rescue these people immediately after the earthquake, but it is highly possible that all existing
communication networks would be down due to the effects of the tsunami. That means that the rescuers must
perform rescue operations without knowing the detailed information about tens of thousands of people who will
have fled to more than 300 tsunami evacuation buildings. One option is to have satellite phones in every evacuation
building. However, Kochi thought that it was too expensive and impractical. For these reasons, Kochi City eventually
chose the ‘Relay-by-Smartphone’ as a means of collecting information.

29
Figure 2. Concept of information exchange by ‘Relay-by-Smartphone’ during a disaster
The Challenges
Kochi City conducted the proof of concept of this system for three years and finally started the operation in
April 2019. If anyone who flees to the evacuation building has installed this application, they could transmit the
information of the situation around them even during communication disruption. It would become possible to
communicate directly with people in nearby buildings by ‘Relay-by-Smartphone.’ Moreover, Kochi City assumes an
operation wherein rescuers who have installed the app will collect information transmitted from the evacuees by
patrolling the flooded evacuation buildings. The app is named ‘Kochi City Tsunami SOS App’ and has been gradually
acknowledged among the residents by being used for annual evacuation drills.
Potential for Replication
This works anywhere that has similar issues. Smartphones have spread to 80% in developed countries and about
50% in developing countries and will become even more widespread. We can see that ‘Relay-by-Smartphone’ will
penetrate the worldwide market as a technology with even greater potential for the future.
1. Kozo Keikaku Engineering Inc. Ad-hoc communication technology between smartphones (https://www.smart-
relay.kke.co.jp/)
2. Innovation consortium for relay communication technology by smartphones (https://www.smaric.org/)
3. Twitter by Disaster Communication Research Team in Kozo Keikaku Engineering Inc. (https://twitter.com/
yzwtwvi8klqfqvv)
4. Research Organization of Electrical Communication, Tohoku University (ROEC)
(http://www.roec.tohoku.ac.jp/purpose/index.html)
5. Communication Systems Lab., Tohoku University, Introduction of ‘Relay-by-Smartphone’
(http://web.tohoku.ac.jp/cslab/?page_id=89)
6. Kochi City Tsunami SOS App
(https://www.city.kochi.kochi.jp/soshiki/135/tsunamisos001.html)
References

30
Case 9
[Japan]
Red Relief Image Map innovation to 3D visualization
Summary
Red Relief Image Map (RRIM) is a completely new 3D visualization method for topography using chroma of red
color to slope and brightness of red color to the ridge-valley value calculated from DEM. The RRIM has overcome
the shortness of traditional visualization methods, such as weakness for scaling, light direction dependence,
necessary of stereoscope and filtering, can express details of topography by single image map. To make the
RRIM, we used the patented technology holed by Asia Air Survey, Co., Ltd., registered in Japan as well as the US
and China. The RRIM can be used for the investigation of topographical features such as volcano, landslide and
fault, also useful for remains and ancient tomb investigation, tourist guide map and mountain climber’s map,
etc. (https://www.rrim.jp/en/)
Ground Surface Visualization
To identify and interpret displacement and deformation of slopes, geospatial information of ground surface take an
important role. Using geospatial information, there are several visualization methods to express ground surface
features. The most popular and traditional one is the contour map, it has been widely used for expressing ground
surface in the world. The contour
map represents elevation and
topographic slope gradient at the
same time. Due to the slope gradient
is represented by the density of the
c o nto u r l i n e , t h e m ax i m u m
expressible topographic slope will be
restricted by the horizontal interval
of the contour line on the map. Too
dense contour line on the map
difficult to express very steep slopes
and too wide contour line cannot
express the real features of the flat
area. Along with the development of
the digital elevation model (DEM),
t h e s h a d e d r e l i e f m a p w a s
developed as a 3D visualization
method. It expresses topographic
features by simulated shade which is
Figure.1 Different features of same DEM expressed by shaded relief map
(Chiba et al., 2008)
31
calculated by using incident light direction and elevation data. The shaded relief map helps us understand the
topographic feature with an intuitive manner. However, the problem is the topographic features could be seen
differently with the direction of light (Figure.1). Another traditional method for expressing the ground surface is
aerial photographs. Aerial photographs have been used widely to understand the large area of land cover. However,
the limitation is that, in the dense vegetation area, aerial photographs cannot show the real features of the ground
surface (Figure.2).
An innovative 3D-view, RRIM
The development of geospatial data acquisition technology (such as airborne Lidar) provides us dense and high-
resolution digital data. However, the traditional methods have some limitations to express the details of the
ground surface. To understand and interpret the features of the ground surface, a good 3D visualization method is
necessary. Chiba et al. (2008) developed an innovative method for 3D visualization of the ground surface, namely
the Red Relief Image Map (RRIM, Figure 2. d)). The RRIM is created from three elements of landform, topographic
slope, positive openness and negative openness (Yokoyama et al.; 2002). Negative openness represents concavity of
the surface and positive openness represents convexity of the surface.
To overcome the limitation of traditional methods, the innovative advantages of the RRIM are characterized as
follows.
(1) It is independent of the direction of the incident light, can visualize landscape from any viewing angles with no
shade in it.
(2) It can represent a wide range of 3D topographic structures with a single image without any specialized hardware,
e.g., 3D monitors.
(3) Suitable for a variety of land features and a wide range of scales with a single image.
(4) Ortho-rectified image with convexity and concavity information.
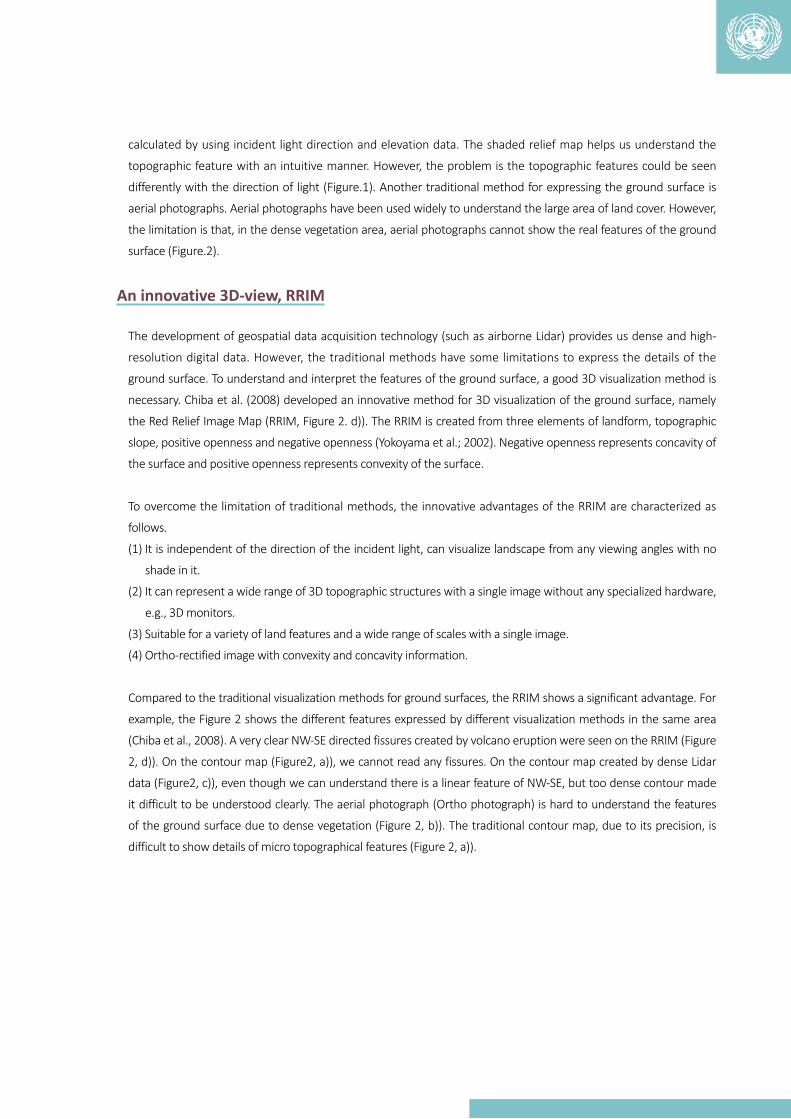
Compared to the traditional visualization methods for ground surfaces, the RRIM shows a significant advantage. For
example, the Figure 2 shows the different features expressed by different visualization methods in the same area
(Chiba et al., 2008). A very clear NW-SE directed fissures created by volcano eruption were seen on the RRIM (Figure
2, d)). On the contour map (Figure2, a)), we cannot read any fissures. On the contour map created by dense Lidar
data (Figure2, c)), even though we can understand there is a linear feature of NW-SE, but too dense contour made
it difficult to be understood clearly. The aerial photograph (Ortho photograph) is hard to understand the features
of the ground surface due to dense vegetation (Figure 2, b)). The traditional contour map, due to its precision, is
difficult to show details of micro topographical features (Figure 2, a)).
32
a
c
b
d
Figure 2 Different visualization results from different methods. a) contour map; b)Aerial photograph;
c)Contour map from airborne Lidar data; d) RRIM.
Usage of RRIM
With the advantages of the 3D visualization, the RRIM can be used to interpret natural disasters such as landslides,
debris flow, hazard mapping, and as the background map to show topographical features to help to view any map of
large scale area. Regarding natural disaster reduction, the RRIM can be used in the following situations.
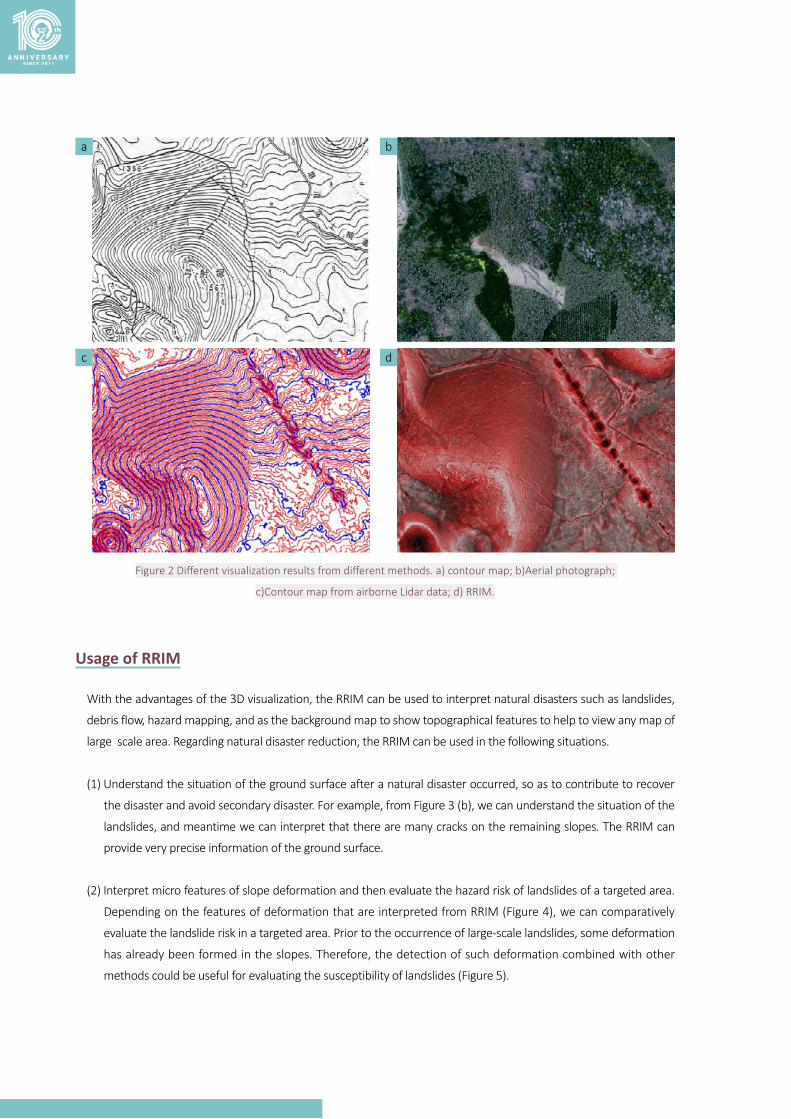
(1) Understand the situation of the ground surface after a natural disaster occurred, so as to contribute to recover
the disaster and avoid secondary disaster. For example, from Figure 3 (b), we can understand the situation of the
landslides, and meantime we can interpret that there are many cracks on the remaining slopes. The RRIM can
provide very precise information of the ground surface.
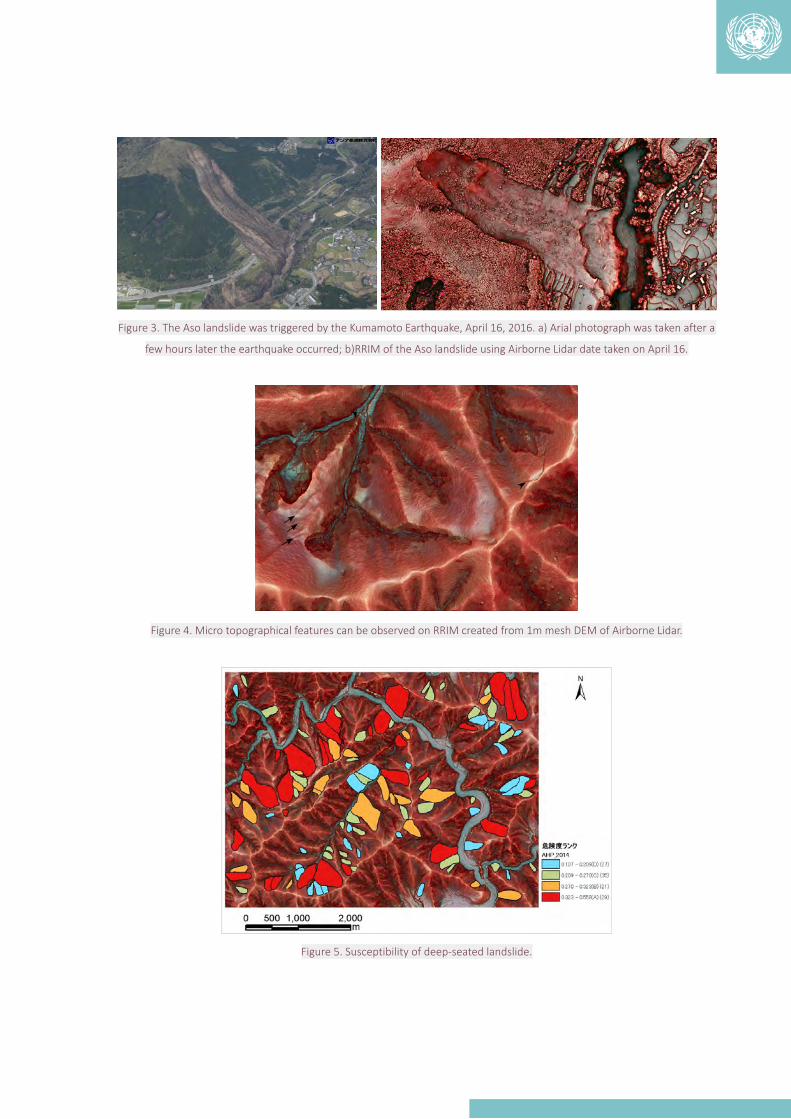
(2) Interpret micro features of slope deformation and then evaluate the hazard risk of landslides of a targeted area.
Depending on the features of deformation that are interpreted from RRIM (Figure 4), we can comparatively
evaluate the landslide risk in a targeted area. Prior to the occurrence of large-scale landslides, some deformation
has already been formed in the slopes. Therefore, the detection of such deformation combined with other
methods could be useful for evaluating the susceptibility of landslides (Figure 5).
33
Figure 3. The Aso landslide was triggered by the Kumamoto Earthquake, April 16, 2016. a) Arial photograph was taken after a
few hours later the earthquake occurred; b)RRIM of the Aso landslide using Airborne Lidar date taken on April 16.
Figure 4. Micro topographical features can be observed on RRIM created from 1m mesh DEM of Airborne Lidar.
Figure 5. Susceptibility of deep-seated landslide.

34
1. Chiba T, Kaneta S, Suzuki Y, 2008. Red Relief Image Map: New visualization method for three dimensional data.
In: The International Archives of the Photogrammetry, Remote Sensing and Spatial Information Sciences,
Beijing, China, XXXVII,B2, pp.1071-1076.
2. Yokoyama, R. Shirasawa, M. and Pike, R.J., 2002. Visualizing topography by openness: A new application of image
processing to digital elevation models. Photogrammetric Engineering and Remote Sensing, 68, pp.251-266.
References
Case 10
[Japan]
Aster: Developing sustainable disaster mitigation with seismic coating by means of business
Summary
Glass fiber reinforced paint (Power Coating) is a new retrofitting technique for masonry buildings in the world.
This technology can reduce the amount of time and labor for retrofitting. And paint is usually used to make
houses look attractive, and many masonry structures are coated with paint. By using full-scale experiment, it
was confirmed that the house retrofitted with Power Coating could improve the seismic capacity of the masonry
house. And the pilot power coating was also used for a building in Nepal.
Background and establishment
In the last century, there were many earthquakes causing loss of life exceeding 1.53 million people worldwide.
Masonry buildings are highly vulnerable and common in seismic areas around the world. Their collapse has
been a major cause of death in past earthquakes globally. Nonetheless, masonry buildings are increasingly being
constructed and used in developing countries. Therefore, retrofitting masonry structures is one of the most
important approaches for reducing earthquake casualties worldwide. In addition, seismic retrofitting ultimately
reduces earthquake recovery costs after disasters (reducing the cost of rescue and first aid activities, rubble removal,
temporary residence building, and permanent residence reconstruction to re-establish normal daily life).
To retrofit these structures, many seismic retrofitting techniques (Shotcrete, FRP and so on) have been developed
(Amiraslanzadeh et al., 2012). However, these techniques need much time and labor. They are unattractive to
local people because these methods do not improve their quality of life. Due to these challenges, the use of these
techniques has not easily been spread in developing countries.
35
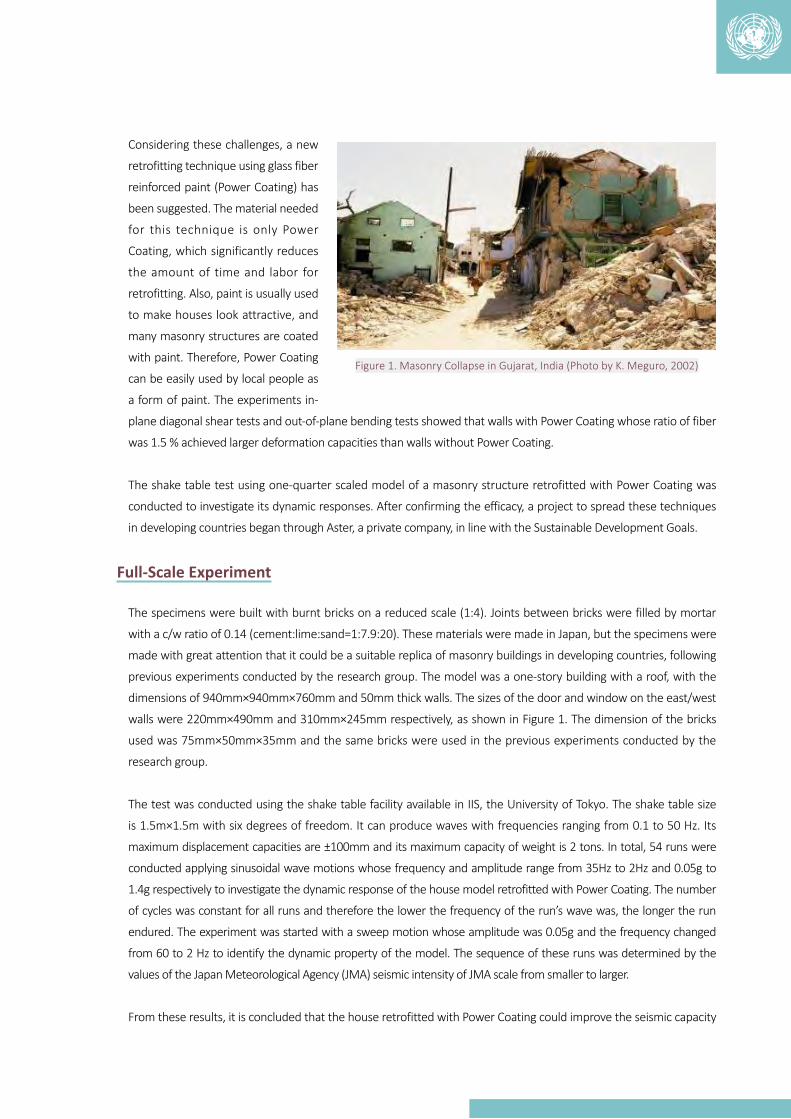
Considering these challenges, a new
retrofitting technique using glass fiber
reinforced paint (Power Coating) has
been suggested. The material needed
for this technique is only Power
Coating, which significantly reduces
the amount of time and labor for
retrofitting. Also, paint is usually used
to make houses look attractive, and
many masonry structures are coated
with paint. Therefore, Power Coating
can be easily used by local people as
a form of paint. The experiments in-
plane diagonal shear tests and out-of-plane bending tests showed that walls with Power Coating whose ratio of fiber
was 1.5 % achieved larger deformation capacities than walls without Power Coating.
The shake table test using one-quarter scaled model of a masonry structure retrofitted with Power Coating was
conducted to investigate its dynamic responses. After confirming the efficacy, a project to spread these techniques
in developing countries began through Aster, a private company, in line with the Sustainable Development Goals.
Full-Scale Experiment
The specimens were built with burnt bricks on a reduced scale (1:4). Joints between bricks were filled by mortar
with a c/w ratio of 0.14 (cement:lime:sand=1:7.9:20). These materials were made in Japan, but the specimens were
made with great attention that it could be a suitable replica of masonry buildings in developing countries, following
previous experiments conducted by the research group. The model was a one-story building with a roof, with the
dimensions of 940mm×940mm×760mm and 50mm thick walls. The sizes of the door and window on the east/west
walls were 220mm×490mm and 310mm×245mm respectively, as shown in Figure 1. The dimension of the bricks
used was 75mm×50mm×35mm and the same bricks were used in the previous experiments conducted by the
research group.
The test was conducted using the shake table facility available in IIS, the University of Tokyo. The shake table size
is 1.5m×1.5m with six degrees of freedom. It can produce waves with frequencies ranging from 0.1 to 50 Hz. Its
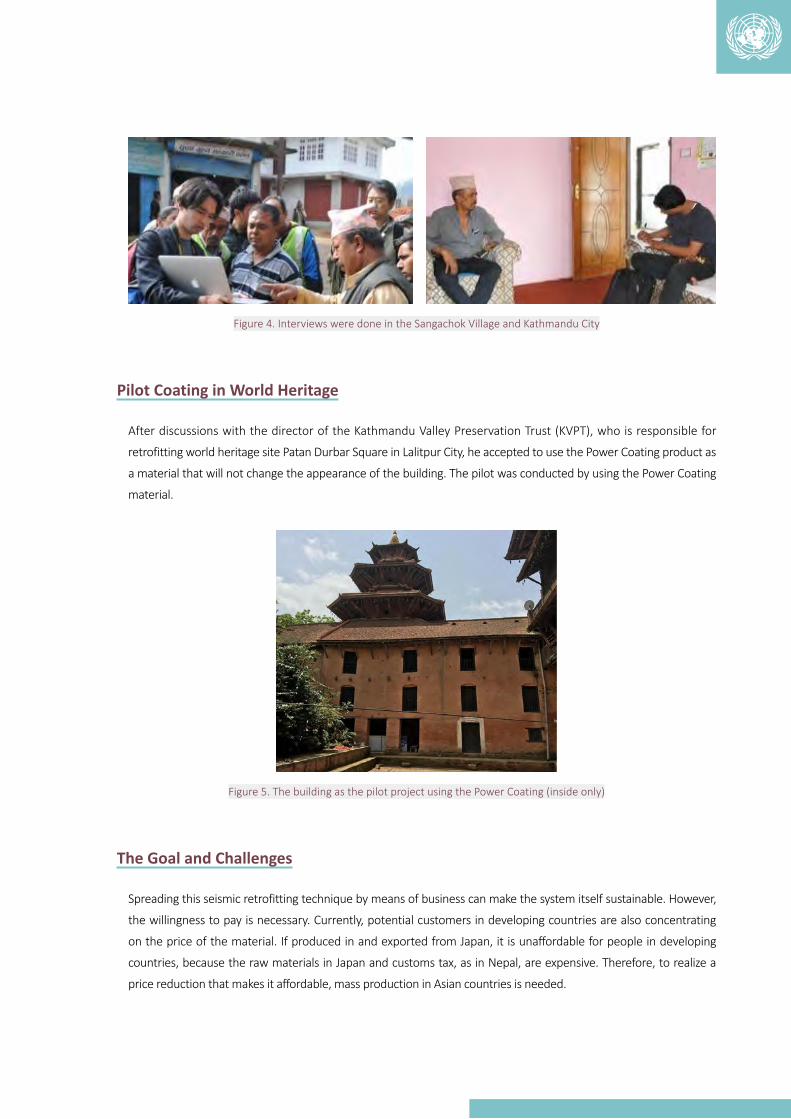
maximum displacement capacities are ±100mm and its maximum capacity of weight is 2 tons. In total, 54 runs were
conducted applying sinusoidal wave motions whose frequency and amplitude range from 35Hz to 2Hz and 0.05g to
1.4g respectively to investigate the dynamic response of the house model retrofitted with Power Coating. The number
of cycles was constant for all runs and therefore the lower the frequency of the run’s wave was, the longer the run
endured. The experiment was started with a sweep motion whose amplitude was 0.05g and the frequency changed
from 60 to 2 Hz to identify the dynamic property of the model. The sequence of these runs was determined by the
values of the Japan Meteorological Agency (JMA) seismic intensity of JMA scale from smaller to larger.
From these results, it is concluded that the house retrofitted with Power Coating could improve the seismic capacity
Figure 1. Masonry Collapse in Gujarat, India (Photo by K. Meguro, 2002)
36
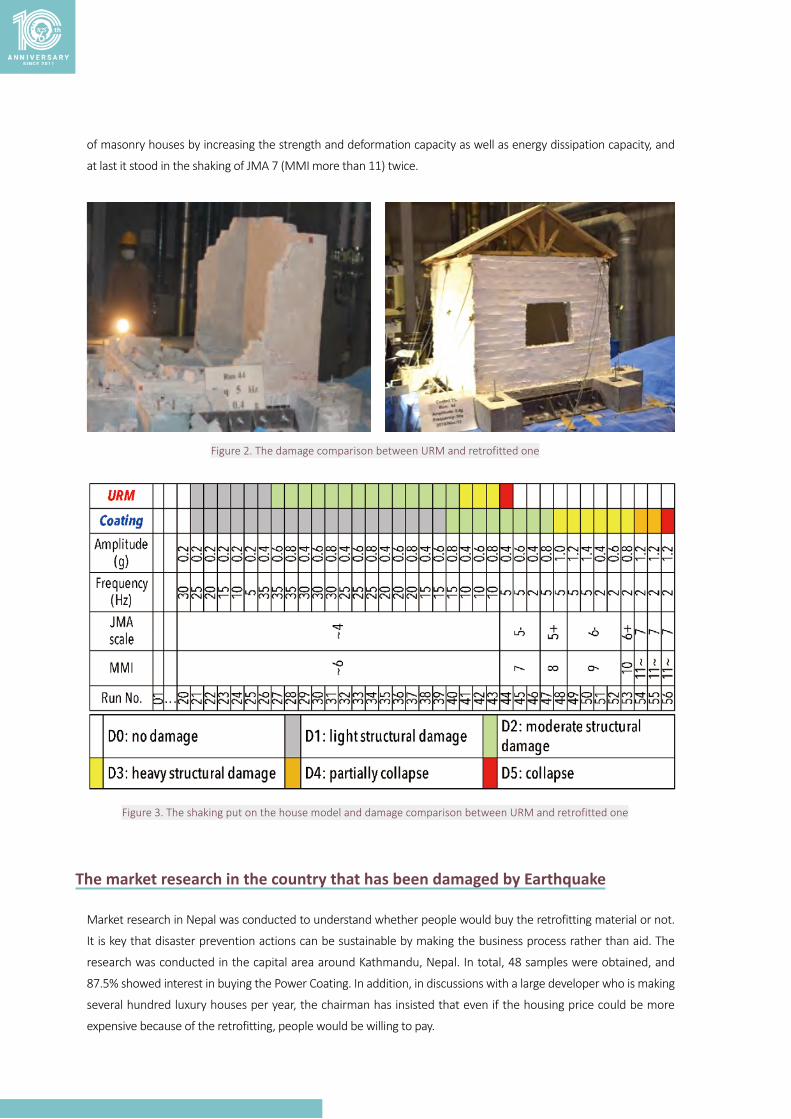
of masonry houses by increasing the strength and deformation capacity as well as energy dissipation capacity, and
at last it stood in the shaking of JMA 7 (MMI more than 11) twice.
Figure 2. The damage comparison between URM and retrofitted one
Figure 3. The shaking put on the house model and damage comparison between URM and retrofitted one
The market research in the country that has been damaged by Earthquake
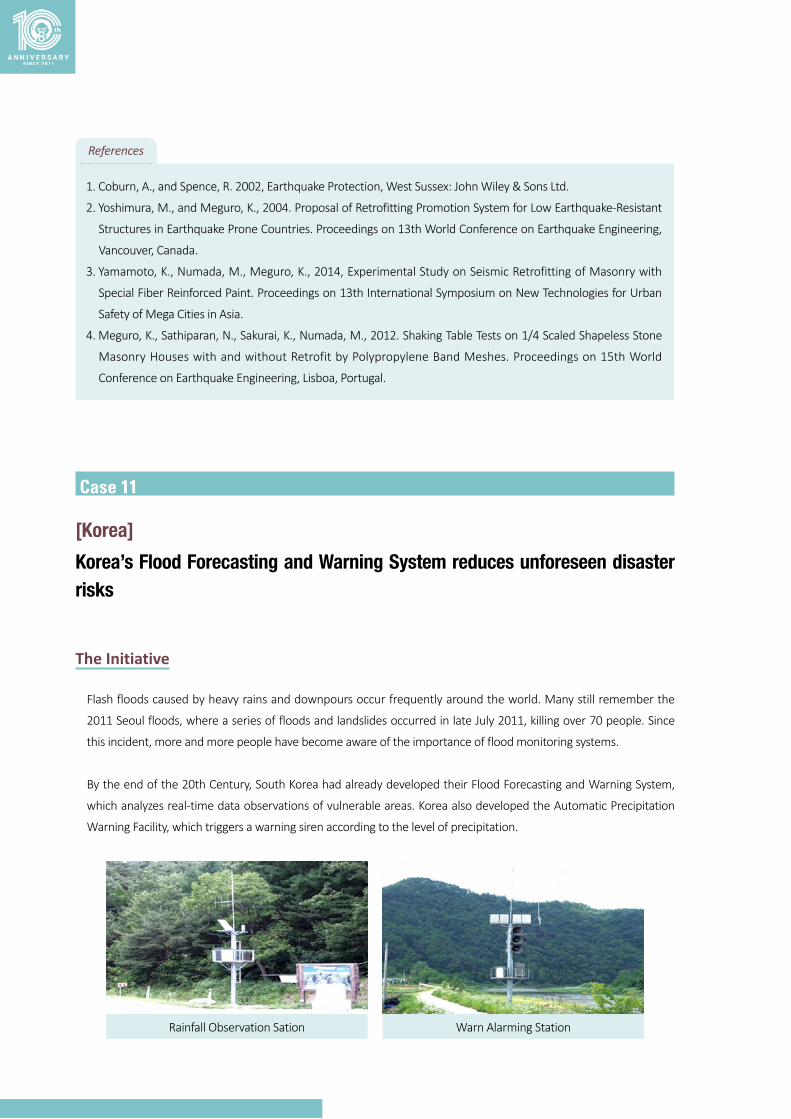
Market research in Nepal was conducted to understand whether people would buy the retrofitting material or not.
It is key that disaster prevention actions can be sustainable by making the business process rather than aid. The
research was conducted in the capital area around Kathmandu, Nepal. In total, 48 samples were obtained, and
87.5% showed interest in buying the Power Coating. In addition, in discussions with a large developer who is making
several hundred luxury houses per year, the chairman has insisted that even if the housing price could be more
expensive because of the retrofitting, people would be willing to pay.
37
Figure 4. Interviews were done in the Sangachok Village and Kathmandu City
Pilot Coating in World Heritage
After discussions with the director of the Kathmandu Valley Preservation Trust (KVPT), who is responsible for
retrofitting world heritage site Patan Durbar Square in Lalitpur City, he accepted to use the Power Coating product as
a material that will not change the appearance of the building. The pilot was conducted by using the Power Coating
material.
Figure 5. The building as the pilot project using the Power Coating (inside only)
The Goal and Challenges
Spreading this seismic retrofitting technique by means of business can make the system itself sustainable. However,
the willingness to pay is necessary. Currently, potential customers in developing countries are also concentrating
on the price of the material. If produced in and exported from Japan, it is unaffordable for people in developing
countries, because the raw materials in Japan and customs tax, as in Nepal, are expensive. Therefore, to realize a
price reduction that makes it affordable, mass production in Asian countries is needed.
38
1. Coburn, A., and Spence, R. 2002, Earthquake Protection, West Sussex: John Wiley & Sons Ltd.
2. Yoshimura, M., and Meguro, K., 2004. Proposal of Retrofitting Promotion System for Low Earthquake-Resistant
Structures in Earthquake Prone Countries. Proceedings on 13th World Conference on Earthquake Engineering,
Vancouver, Canada.
3. Yamamoto, K., Numada, M., Meguro, K., 2014, Experimental Study on Seismic Retrofitting of Masonry with
Special Fiber Reinforced Paint. Proceedings on 13th International Symposium on New Technologies for Urban
Safety of Mega Cities in Asia.
4. Meguro, K., Sathiparan, N., Sakurai, K., Numada, M., 2012. Shaking Table Tests on 1/4 Scaled Shapeless Stone
Masonry Houses with and without Retrofit by Polypropylene Band Meshes. Proceedings on 15th World
Conference on Earthquake Engineering, Lisboa, Portugal.
References
Case 11
[Korea]
Korea’s Flood Forecasting and Warning System reduces unforeseen disaster risks
The Initiative
Flash floods caused by heavy rains and downpours occur frequently around the world. Many still remember the
2011 Seoul floods, where a series of floods and landslides occurred in late July 2011, killing over 70 people. Since
this incident, more and more people have become aware of the importance of flood monitoring systems.
By the end of the 20th Century, South Korea had already developed their Flood Forecasting and Warning System,
which analyzes real-time data observations of vulnerable areas. Korea also developed the Automatic Precipitation
Warning Facility, which triggers a warning siren according to the level of precipitation.
Rainfall Observation Sation Warn Alarming Station

39
Control Sation Monitoring Station
Figure 1. Korea’s Flood Forecasting and Warning System Demonstration. Photo credit:
Korea National Emergency Management Agency.
Using a radar system, the Flood Forecasting and Warning System informs the public about areas threatened by
a high risk of flooding based on precipitation forecast data. The facility acts as a warning system that observes,
analyzes precipitation data, and disseminates real-time warning comprising precipitation observatories and warning
stations.
The system functions by establishing automatic rainfall observation stations (water leveling) at the upper and middle
areas of the mountain valley, as well as an automatic warning system at the lower area. The automatic remote
observation station at the local Disaster Prevention and Countermeasures Headquarters then receives real-time
data and sends out alerts to local administrative offices and the general public.
Figure 2. Countries with Korean flood Forecasting systems.
Photo credit: National Disaster Management Research Institute (NDMI) of the Ministry of the Interior and Safety (MOIS).
The National Disaster Management Research Institute (NDMI) has been supporting the Philippines, Lao PDR, and
Vietnam to reduce the risk caused by natural hazards such as typhoons and floods since 2013. Furthermore, this
initiative is planned to proceed in other areas (Houaphanh, Xaisomboun) of Lao PDR in 2021.
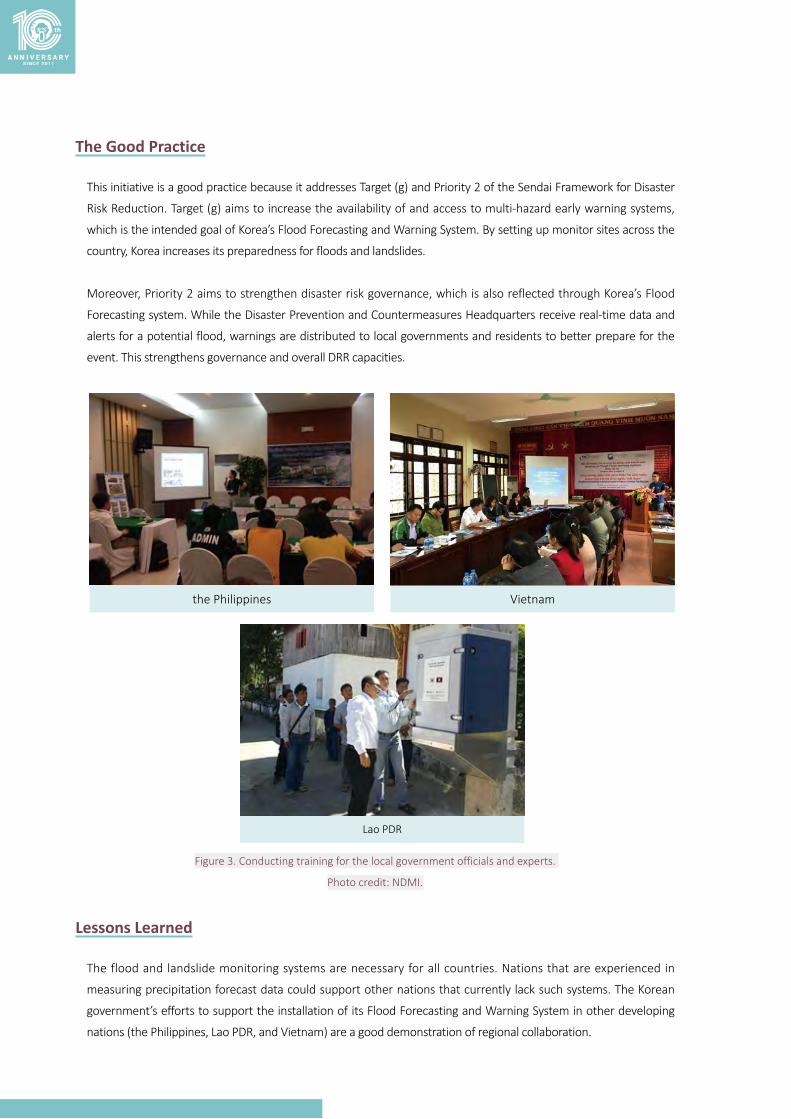
40
The Good Practice
This initiative is a good practice because it addresses Target (g) and Priority 2 of the Sendai Framework for Disaster
Risk Reduction. Target (g) aims to increase the availability of and access to multi-hazard early warning systems,
which is the intended goal of Korea’s Flood Forecasting and Warning System. By setting up monitor sites across the
country, Korea increases its preparedness for floods and landslides.
Moreover, Priority 2 aims to strengthen disaster risk governance, which is also reflected through Korea’s Flood
Forecasting system. While the Disaster Prevention and Countermeasures Headquarters receive real-time data and
alerts for a potential flood, warnings are distributed to local governments and residents to better prepare for the
event. This strengthens governance and overall DRR capacities.
the Philippines Vietnam
Lao PDR
Figure 3. Conducting training for the local government officials and experts.
Photo credit: NDMI.
Lessons Learned
The flood and landslide monitoring systems are necessary for all countries. Nations that are experienced in
measuring precipitation forecast data could support other nations that currently lack such systems. The Korean
government’s efforts to support the installation of its Flood Forecasting and Warning System in other developing
nations (the Philippines, Lao PDR, and Vietnam) are a good demonstration of regional collaboration.

41
Impacts and Results
Between 1996 and 2005, 148 sites had been established and operated in valleys, downstream of rivers, and national
parks in Korea. In addition, between 2005 and 2009, 113 more sites had been added to the monitoring and warning
system. The nation currently has a comprehensive system and covers the majority of its regions.
In the Philippines, NDMI supported the establishment of the automatic rainfall warning system as well as a water-
level sensing system along the banks of the Cagayan de Oro River, a river that runs northward across Mindanao
Island in the southern part of the country. The area was heavily damaged by Severe Tropical Storm Washi, which
caused strong currents and flooding across the region in late 2011, claiming more than 1,200 lives as a result.
Figure 4. Installing the flood warning system in the Philippines. Photo credit: NDMI.
Immediately following the disaster, the NDMI dispatched a group of experts to the affected areas as part of
an international joint damage investigation group. It comprised members from the UNESCAP/WMO Typhoon
Committee and the United Nations Office for Disaster Risk Reduction (UNDRR). As a result of these findings, a
domestic system was designed to forecast and warn of possible floods. The Philippine Meteorological Administration
asked NDMI to put the system into place across the region.

42
The established monitoring system analyzes rainfall and water-level data in real-time and sounds an
emergency alarm when any possible flood is detected. Throughout its operation, this system has
helped minimize the number of casualties and reduce social and economic damages across the region.
The Challenges
One potential challenge is the maintenance of the observation stations, particularly the equipment, in mountain
regions. These observation stations need to be checked and maintained regularly to perform well and withstand
extreme weather conditions. This has additional costs and requires human resources for the operation of the
system.
Potential for Replication
This initiative has a high potential for replication by other countries. Korea has been already sharing its flood
monitoring technologies and experience with neighboring countries to support them with disaster risk management
activities. More nations would soon acquire such technologies if more international collaboration forms.
1. http://eng.ndti.go.kr/sub/2/2_6.asp
2. http://www.korea.net/NewsFocus/policies/view?articleId=121909
3. https://www.nytimes.com/2011/07/28/world/asia/28korea.html
4. https://web.kma.go.kr/eng/weather/forecast/notice.jsp
5. http://www.drs.dpri.kyoto-u.ac.jp/pw/workshop/pdfs/16dhj_national_disaster_warning_system.pdf
6. MOIS publications ‘Building a safer Korea’
References and additional information

43
Case 12
[Korea]
Korea’s single disaster and safety communications network (Safe-Net) makes national disaster management infrastructure stronger with efficient connectivity
The Initiative
Many remember the catastrophe of the Sewol Ferry disaster in South Korea in 2014, which resulted in the death of
more than 300 people, many of whom were young students. In the wake of the disaster, the Korean government
came under intense criticism for the lack of efficiency in coordinating disaster response activities. Having faced such
scrutiny, the government determined to reform its disaster management communication system.
Soon after the disaster, Korea’s Ministry of the Interior and Safety (MOIS) launched initiatives to improve responses
to natural and social disasters. One of the initiatives was to build a unified network that connects and provides
information simultaneously to disaster-related institutions during the initial response. This network enhances
coordination among institutions and enables integrated control of the on-site response. A total of 333 institutions in
eight sectors (fire services, police, electricity, medical services, gas, coast guard, military, and local government) will
have the access to the network.
This essential communications system, called ‘Safe-Net’, enables the police, fire department, coast guard, and other
groups of public officials to communicate and provide prompt support for rescue efforts using dedicated terminals
both in normal times and emergencies. Safe-Net is a single, national-scale communication network that supports
one channel of command and control and integrated response at disaster sites. It leverages fourth-generation
wireless technologies for disaster and safety management (PS-LTE - Public Safety-Long Term Evolution), making
real-time feeds of accidents and/or risks available and enabling quick and efficient response. The function and
performance of the network have been validated through pilot programs. The main project began in 2018.
This public safety network, powered by fourth-generation wireless technologies (known as PS-LTE), can transfer
large volumes of data instantly. This means that high-quality images and videos can be sent, enabling the use of
various applications such as live streaming during emergent situations or mapping software for locating or directing
mission-critical assets or concerns. LTE can also be leveraged to unify existing disparate public safety networks.
Before, disaster response institutions used different frequencies and technologies such as VHF, UHF, and TETRA,
which made inter-agency communication difficult. Unifying these different networks through LTE aims to reduce
response times. Another advantage is that LTE networks satisfy the rigorous requirements set out for public safety
networks, including resilience, security, and quality of service.
Having successfully conducted the pilot project during the PyeongChang 2018 Winter Olympics, MOIS is deploying
the system nationwide in three phases. In the first phase, base stations were installed in five major cities and
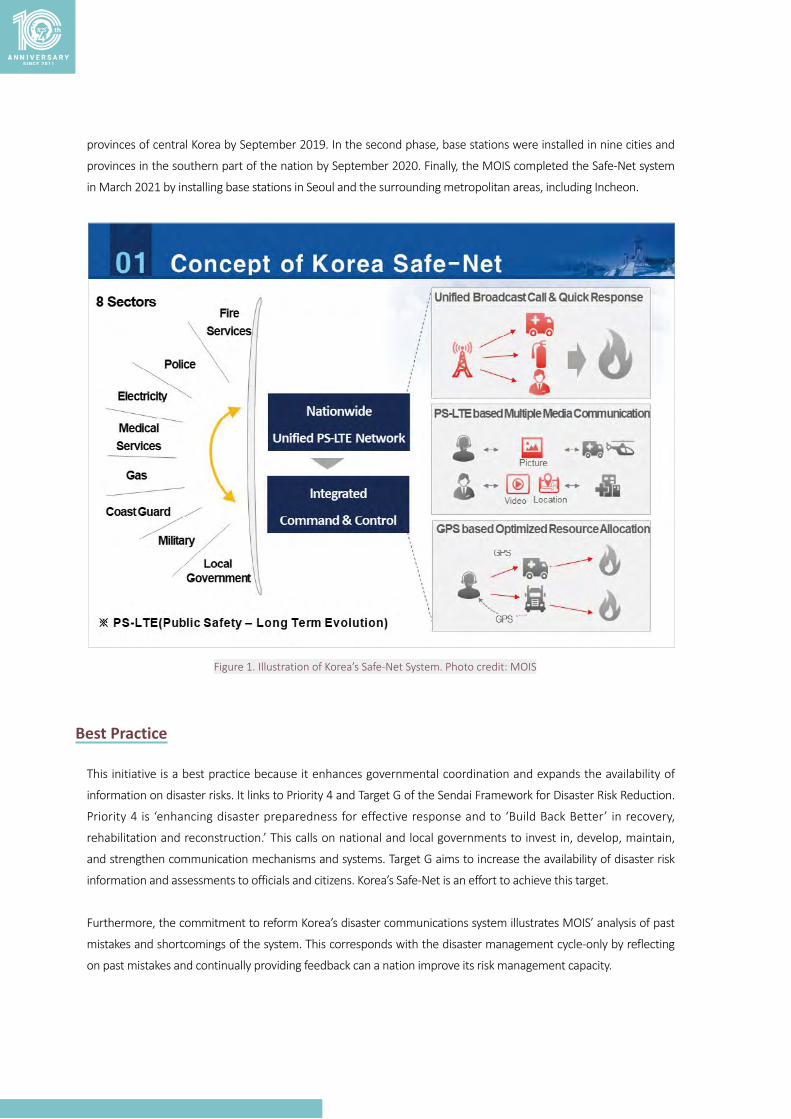
44
provinces of central Korea by September 2019. In the second phase, base stations were installed in nine cities and
provinces in the southern part of the nation by September 2020. Finally, the MOIS completed the Safe-Net system
in March 2021 by installing base stations in Seoul and the surrounding metropolitan areas, including Incheon.
Figure 1. Illustration of Korea’s Safe-Net System. Photo credit: MOIS
Best Practice
This initiative is a best practice because it enhances governmental coordination and expands the availability of
information on disaster risks. It links to Priority 4 and Target G of the Sendai Framework for Disaster Risk Reduction.
Priority 4 is ‘enhancing disaster preparedness for effective response and to ‘Build Back Better’ in recovery,
rehabilitation and reconstruction.’ This calls on national and local governments to invest in, develop, maintain,
and strengthen communication mechanisms and systems. Target G aims to increase the availability of disaster risk
information and assessments to officials and citizens. Korea’s Safe-Net is an effort to achieve this target.
Furthermore, the commitment to reform Korea’s disaster communications system illustrates MOIS’ analysis of past
mistakes and shortcomings of the system. This corresponds with the disaster management cycle-only by reflecting
on past mistakes and continually providing feedback can a nation improve its risk management capacity.
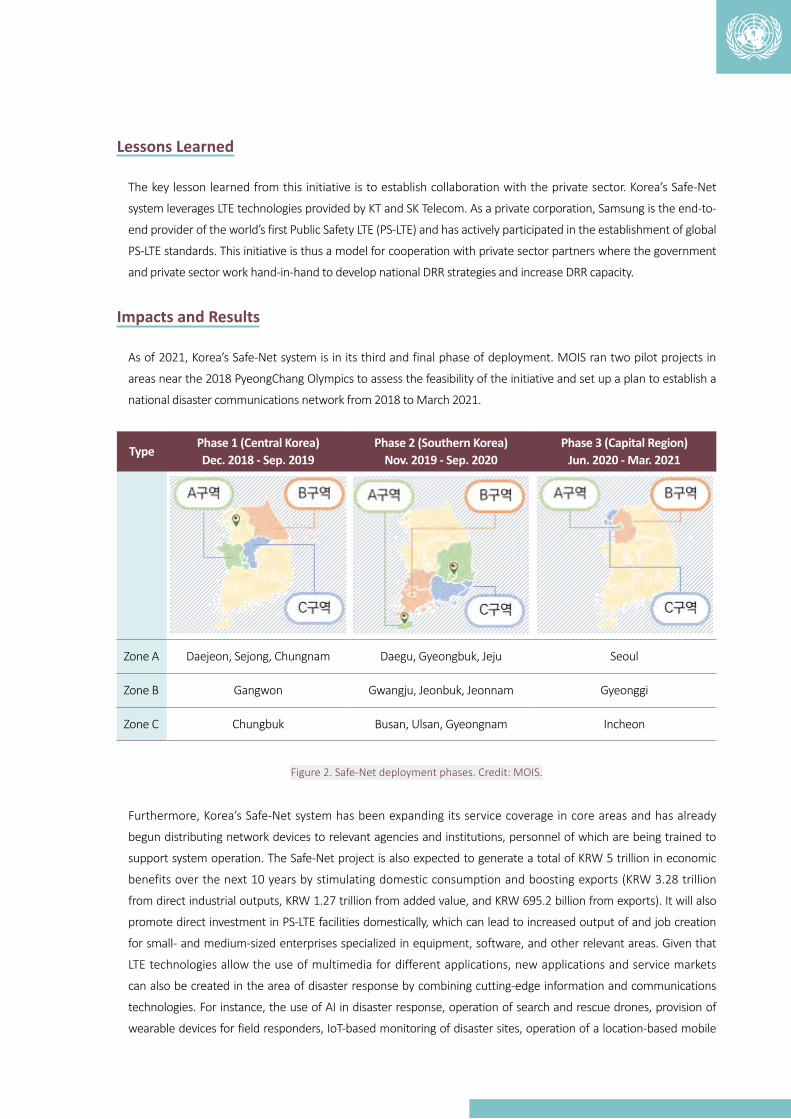
45
Lessons Learned
The key lesson learned from this initiative is to establish collaboration with the private sector. Korea’s Safe-Net
system leverages LTE technologies provided by KT and SK Telecom. As a private corporation, Samsung is the end-to-
end provider of the world’s first Public Safety LTE (PS-LTE) and has actively participated in the establishment of global
PS-LTE standards. This initiative is thus a model for cooperation with private sector partners where the government
and private sector work hand-in-hand to develop national DRR strategies and increase DRR capacity.
Impacts and Results
As of 2021, Korea’s Safe-Net system is in its third and final phase of deployment. MOIS ran two pilot projects in
areas near the 2018 PyeongChang Olympics to assess the feasibility of the initiative and set up a plan to establish a
national disaster communications network from 2018 to March 2021.
TypePhase 1 (Central Korea)Dec. 2018 - Sep. 2019
Phase 2 (Southern Korea)Nov. 2019 - Sep. 2020
Phase 3 (Capital Region)Jun. 2020 - Mar. 2021
Zone A Daejeon, Sejong, Chungnam Daegu, Gyeongbuk, Jeju Seoul
Zone B Gangwon Gwangju, Jeonbuk, Jeonnam Gyeonggi
Zone C Chungbuk Busan, Ulsan, Gyeongnam Incheon
Figure 2. Safe-Net deployment phases. Credit: MOIS.
Furthermore, Korea’s Safe-Net system has been expanding its service coverage in core areas and has already
begun distributing network devices to relevant agencies and institutions, personnel of which are being trained to
support system operation. The Safe-Net project is also expected to generate a total of KRW 5 trillion in economic
benefits over the next 10 years by stimulating domestic consumption and boosting exports (KRW 3.28 trillion
from direct industrial outputs, KRW 1.27 trillion from added value, and KRW 695.2 billion from exports). It will also
promote direct investment in PS-LTE facilities domestically, which can lead to increased output of and job creation
for small- and medium-sized enterprises specialized in equipment, software, and other relevant areas. Given that
LTE technologies allow the use of multimedia for different applications, new applications and service markets
can also be created in the area of disaster response by combining cutting-edge information and communications
technologies. For instance, the use of AI in disaster response, operation of search and rescue drones, provision of
wearable devices for field responders, IoT-based monitoring of disaster sites, operation of a location-based mobile

46
disaster response system, and many other services can be made available. From March 2021, Safe-Net has been in
full operation nationwide, allowing swift and effective responses to any type of disaster.
Challenges
Funding is one of the challenges faced by large-scale projects such as Korea’s Safe-Net system. The country is
currently transitioning from LTE to 5G network technology. The initial operation of the PS-LTE-based Safe-Net will
continue until 2025. In the meanwhile, consideration will need to be given to whether the technology base should
be switched to the 5G network.
Potential for Replication
This initiative has great potential for replication, with ample opportunities to boost exports. As of 2021, the size
of the global PS-LTE market is estimated at USD 13.7 billion and is projected to grow at an annual rate of 31%
until 2024. As Korea is leading the efforts to establish a PS-LTE network, domestic companies can benefit from
the experience gained and relevant technology base secured through the project, based on which they can enter
the global market. In fact, no other country in the world has yet established a disaster and safety communications
network based on LTE technology. The US, UK, and Canada are pursuing similar projects, and Korea is receiving
inquiries on details of its PS-LTE project, supply of equipment and devices, and success stories from state agencies
of various countries, including Thailand, Saudi Arabia, and Kuwait. The project can also bring about cost savings.
Since it allows multiple disaster-related agencies to access a single communications network, those agencies do not
need to build separate communications networks, thereby eliminating duplicate investment. The system also allows
effective operation and maintenance of the disaster response communications network at the state level, which will
reduce maintenance costs significantly.
1. http://www.mois.go.kr/eng/sub/a03/disasterAndSafety/screen.do
2. https://www.samsung.com/global/business/networks/solutions/public-safety-lte/
3. https://insights.samsung.com/2018/06/12/how-ps-lte-is-bringing-public-safety-communications-into-the-21st-
century/
4. http://www.snstelecom.com/public-safety-lte
5. https://ieeexplore.ieee.org/document/7224854/
6. http://safenetforum.or.kr/eng/main/index.php
7. MOIS publications ‘Building a safer Korea’
References
47
Case 13
[Korea]
An ICT-based self-quarantine safe protection app for the COVID-19 pandemic
The Initiative
The first COVID-19 case in South Korea occurred in Incheon on Wednesday, January 20, 2020. At the time, no one
knew that COVID-19 would become a pandemic. At the time of this writing, one year has passed since that day, but
COVID-19 is still escalating at breakneck speed in many parts of the world.
COVID-19 escalated quickly in Korea as well. The number of self-quarantined rose from 606 on February 12, 2020,
to over 30,000 by March 2, 2020. From the beginning, self-quarantining close contacts of the confirmed cases
was as important as taking care of confirmed cases. The most important thing was to keep the self-quarantined
from leaving their quarantine locations; however, the situation worsened to the point that designated case officers
can no longer keep track of the self-quarantined manually. The dramatic increase in the number of self-isolated
soon made it impossible to check their health and whether they were remaining in their quarantine locations via
phone call or in-person visit, which resulted in delayed checks and individuals leaving their quarantine locations.
Government officials could not monitor all the self-quarantined on a 24-hour basis, as the manual methods resulted
in overworked, exhausted personnel. The overworked system was calling for a revolutionary measure to manage
the self-quarantined. Therefore, MOIS came up with a self-quarantine safety protection app and the COVID-19 GIS
situation board.
The idea was to use the device that most of the Korean residents carry on a daily basis. A smartphone app was
developed so that the self-quarantined input their temperature and data on other symptoms at least twice a day.
Then, the case officers can easily check what the self-quarantined person entered through the app. When an
individual reports abnormal symptoms during the daily diagnosis, the case officer immediately receives a notification
so that the officer can take appropriate measures. Furthermore, both the case officers and self-quarantined receive
alerts when they leave their quarantine locations surreptitiously; the app figures out an out-of-bounds status with
the GPS coordinates. In addition, a GIS situation board in conjunction with the app helps the case officers in the local
governments monitor the self-quarantined efficiently and easily.
A ‘Safety-band’ was issued to those who deliberately violated the self-quarantine order. The ‘safety band’ worn on
the wrist sent location information to the App via Bluetooth. Another measure to check violations was to monitor
the movement of the phone itself. If the mobile phone of the self-quarantined was stationary for longer than a (pre-
registered) certain period of time, the case officer would receive a notification to check on the individual’s current
location.
Personal data protection was where MOIS spent considerate efforts when developing the apps. Users’ consent was
mandatory to install and run the app. Therefore, they were able to learn that the purpose of the data collection was

48
only to respond to COVID-19, and the collected data would be immediately removed afterward. The majority of app
users agreed to this upon installing the app. As of this moment, there have not been any violations or breaches of
personal data.
Self-quarantine management system (App and GIS situation board)
Figure 1. Main screens of the self-quarantine safety protection app
Self-diagnosis screen Map screen showing the quarantine
location
Management screen for case
officers
Symptomatic subject Alert
Out of bounds Alert
Figure 2. Main screens of COVID-19 GIS situation board

49
Figure 3. Comprehensive management screen of
all the self-quarantined by region/province
Figure 4. The screen that shows health condition and
current location of the self-quarantined
Best Practice
So far, the self-quarantine Safety Protection App has managed a total of 1.1 million people in Korea. It has
successfully discovered 500 quarantine breakers (and taken necessary additional measures). 100,000 case officers
from the local governments have used the app and the GIS situation board to carry out self-quarantine related
tasks efficiently. The app was particularly useful for local governments that had previously relied on phone calls and
other manual methods: the conversion to a contactless mode of management drastically reduced the amount of
administrative resources and personnel that would otherwise have been necessary, allowing local governments
to focus on COVID-19 prevention and control measures. The app’s biggest benefit for citizens is a reduction of the
infection threat. For the self-quarantined, the app is the primary mode for communicating during the self-quarantine
period, including sending health checks and receiving necessary information such as day-to-day guidelines.
Lessons Learned
In Korea, the self-quarantine Safety Protection App is one of the most important weapons in the ‘war’ against
the COVID-19 pandemic. In the early days of the pandemic, there was not enough time to establish and put
into regular use an IT-based response system, which resulted in frequent errors in the initial stages of app use as
well as inconveniences in terms of both use and security. These initial problems demonstrate the importance of
preparation. More attention needs to go to improving the information technology capabilities to respond efficiently
to new infectious diseases in the future. If not, it is likely that all the hardships and obstacles of COVID-19 will repeat.
Impacts and Results
The self-quarantine Safety Protection App was initially designed on the premise that there would be about 2,000
to 3,000 self-quarantined individuals. The app’s functions were later supplemented and expanded so that it could
also be used by all overseas entrants. The response system among the ministries and local governments has been
adjusted based on this app. Even now, as the first COVID-19 vaccinations are just beginning to be administered, the
self-quarantine Safety Protection App plays an essential role in the COVID-19 response.

50
Challenges
To save even more lives, the app needs to be modified in terms of technology. One of the most pressing needs
is to develop a new technology to increase the GPS accuracy for out-of-bound alerts. Optimized for outdoor use,
GPS sometimes fails to hit the exact coordinates of the indoor location. Therefore, the self-quarantined sometimes
receive alerts to stay in the quarantine area even though they have never left the place. This requires AI technology
that, based on analyses of received GPS data by region, can automatically determine whether an individual has left
his/her quarantine location. Furthermore, the ‘platformization’ for diverse functions is necessary so that the app can
be immediately put into use in the event of a new infectious disease outbreak. Security measures for the protection
of personal information must also be strengthened.
Potential for Replication
Korea was the first country in the world to design a self-quarantine Safety Protection App for the COVID-19
response. The app has already been introduced through many foreign media outlets, and Korea is continuing to
share its IT/app development experience with the international community. Thus far, the Korean government has
received requests from 24 countries (e.g. Chile, Argentina, Peru) and eight international organizations (e.g. IDB) to
share information. Therefore, several webinars have been held to explain the app’s functions. Furthermore, Korea
exported the app and safety band to several Central and South American countries. If the app and GIS situation
board are localized to reflect the unique circumstances of importing countries, they can be strong tools with flexible
usage for responding to COVID-19.
1. CNN: https://edition.cnn.com/asia/live-news/coronavirus-outbreak-03-04-20-intl-hnk/h_878ccdcbf1c36b0a29
9cbf9b784a36e5
2. The New York Times: https://www.nytimes.com/2020/03/23/world/asia/coronavirus-south-korea-flatten-curve.
html
3. MIT Technology Review: https://www.technologyreview.com/2020/03/06/905459/coronavirus-south-korea-
smartphone-app-quarantine
4. Le Point: https://www.pressreader.com/france/le-point/20200402/282930977465890
5. Asia Development Bank: https://development.asia/policy-brief/policy-lessons-pandemic-korean-experience
6. WION (World Is One News): https://www.youtube.com/watch?v=ljSBHaD_FDs
7. MoneyToday (sharing of K-quarantine expertise with Latin American countries): https://news.mt.co.kr/mtview.
php?no=2020051809425679501
8. Hankook Ilbo (export of K-quarantine app to Peru): https://www.hankookilbo.com/News/
Read/202005211417096235
References

51
Case 14
[Korea]
Public-private partnered emergency drone operation team for disaster response
The Initiative
Since drones were first introduced in the early 2000s, drone-related technologies and policies have been rapidly
evolving. In South Korea, since the drone qualification system was introduced in 2015, the number of those who
obtained the qualification has been growing fast, with a total of 40,771 people having earned the qualification
as of June 2020, according to the Korea Transportation Safety Authority. In addition, with the creation of a drone
association with more than 150,000 members, the drone infrastructure has been expanding at an accelerated pace,
led mainly by the private sector.
Drones have tremendous growth potential in disaster response because they can quickly acquire necessary
information at the scene of an incident through the use of multi-sensor technology, which enables increased
accessibility optimized for each mission, and they are relatively easy to use. As such, drones can play an important
role in identifying the status of a disaster and supporting decision-making through the rapid collection and sharing
of information at the scene of a large-scale disaster, for example, those triggered by typhoons or forest fires.
Since it introduced drones as part of its disaster investigation equipment in 2013, the National Disaster Management
Research Institute of the Ministry of the Interior and Safety has been using drones to investigate damages caused by
typhoons and torrential rains and conducting research on the use of drones in the areas of disasters and safety to
enhance national disaster management capabilities.
Based on the benefits of using drones in disaster response, including providing access to areas that would otherwise
be inaccessible and obtaining objective information on disaster sites, the government and private sector became
partners for national disaster management, creating the ‘Emergency Drone Operation Team for Disaster Response’
(hereafter, ‘emergency drone operation team’).
The emergency drone operation team is composed of individual drone owners who hold official drone qualifications.
The Korea Aero Models Association6 verifies members’ drone expertise, and the drone owners participate in
disaster management activities on a voluntary basis. The emergency drone operation team came up with its
disaster response plans in 2017 and launched the operation in 2018 in cooperation with 89 individual drone experts
in the areas that were affected by Typhoon Soulik, allowing it to assess the potential for using drones in disaster
6 The Korea Aero Models Association endeavors to expand the basis for model aircraft and provide policy support. It has 78 branches in 16 regions, and more than 8,000 people are involved in its activities (affiliated with the Federation of Korea Aeronautics).
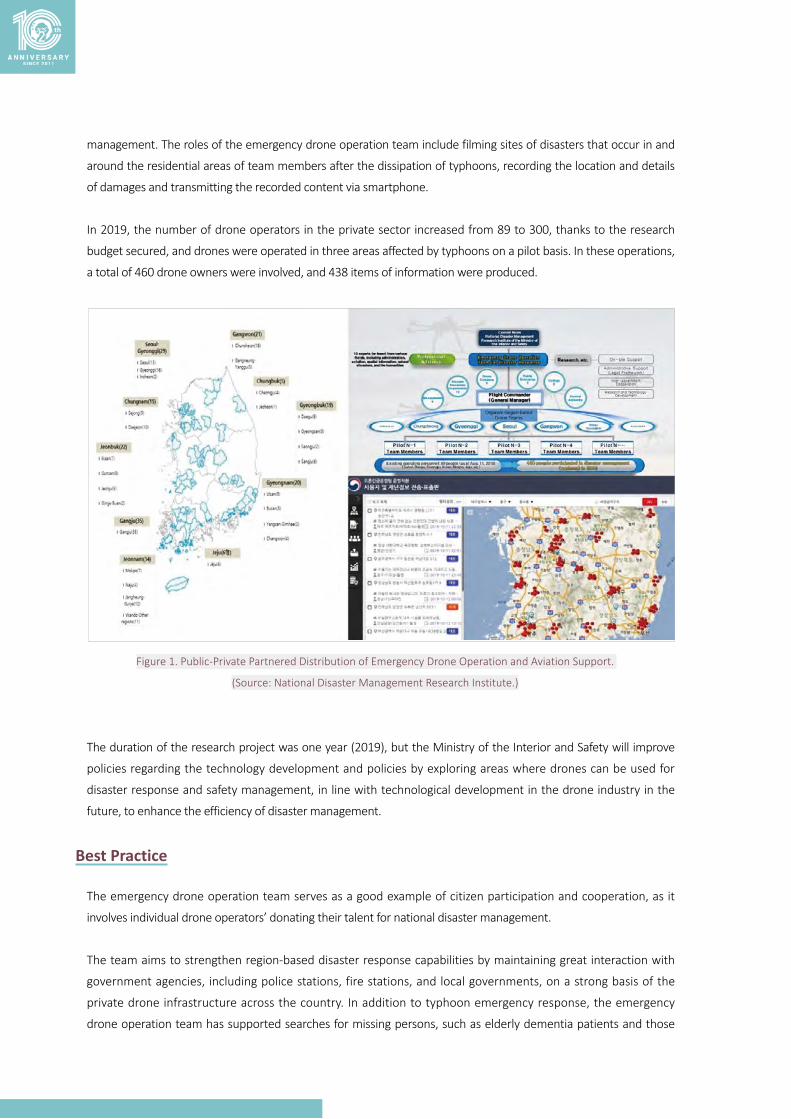
52
management. The roles of the emergency drone operation team include filming sites of disasters that occur in and
around the residential areas of team members after the dissipation of typhoons, recording the location and details
of damages and transmitting the recorded content via smartphone.
In 2019, the number of drone operators in the private sector increased from 89 to 300, thanks to the research
budget secured, and drones were operated in three areas affected by typhoons on a pilot basis. In these operations,
a total of 460 drone owners were involved, and 438 items of information were produced.
Figure 1. Public-Private Partnered Distribution of Emergency Drone Operation and Aviation Support.
(Source: National Disaster Management Research Institute.)
The duration of the research project was one year (2019), but the Ministry of the Interior and Safety will improve
policies regarding the technology development and policies by exploring areas where drones can be used for
disaster response and safety management, in line with technological development in the drone industry in the
future, to enhance the efficiency of disaster management.
Best Practice
The emergency drone operation team serves as a good example of citizen participation and cooperation, as it
involves individual drone operators’ donating their talent for national disaster management.
The team aims to strengthen region-based disaster response capabilities by maintaining great interaction with
government agencies, including police stations, fire stations, and local governments, on a strong basis of the
private drone infrastructure across the country. In addition to typhoon emergency response, the emergency
drone operation team has supported searches for missing persons, such as elderly dementia patients and those
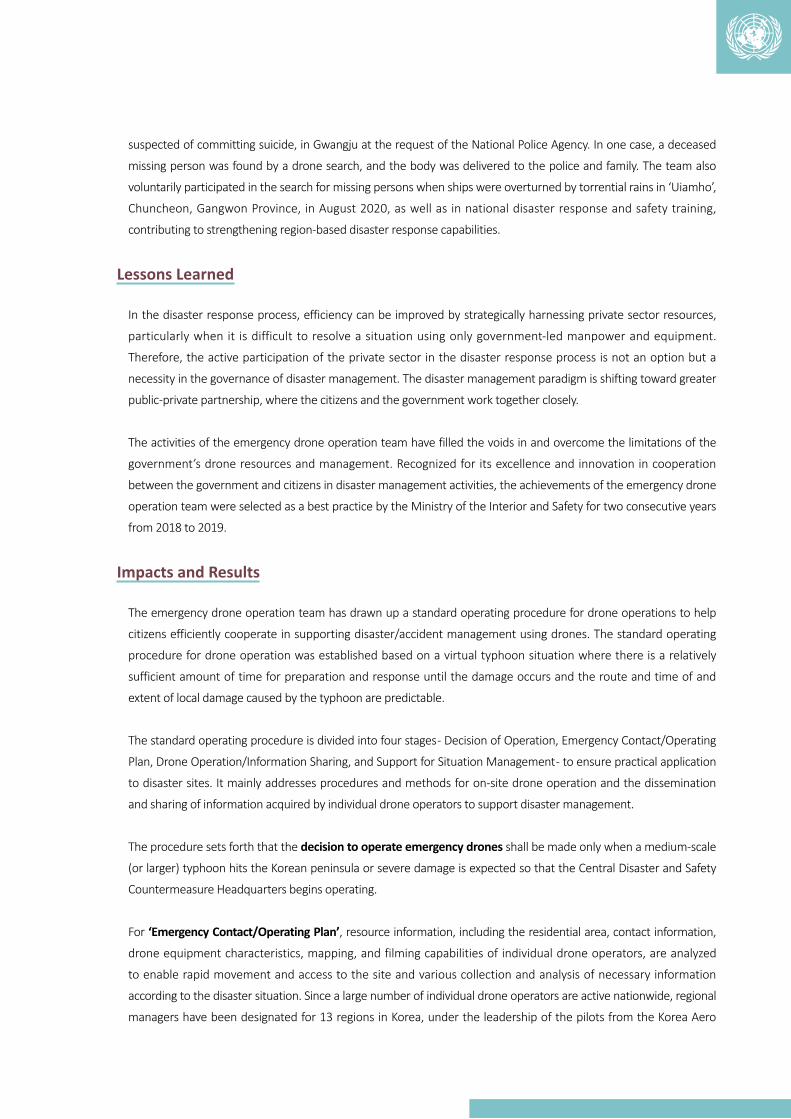
53
suspected of committing suicide, in Gwangju at the request of the National Police Agency. In one case, a deceased
missing person was found by a drone search, and the body was delivered to the police and family. The team also
voluntarily participated in the search for missing persons when ships were overturned by torrential rains in ‘Uiamho’,
Chuncheon, Gangwon Province, in August 2020, as well as in national disaster response and safety training,
contributing to strengthening region-based disaster response capabilities.
Lessons Learned
In the disaster response process, efficiency can be improved by strategically harnessing private sector resources,
particularly when it is difficult to resolve a situation using only government-led manpower and equipment.
Therefore, the active participation of the private sector in the disaster response process is not an option but a
necessity in the governance of disaster management. The disaster management paradigm is shifting toward greater
public-private partnership, where the citizens and the government work together closely.
The activities of the emergency drone operation team have filled the voids in and overcome the limitations of the
government’s drone resources and management. Recognized for its excellence and innovation in cooperation
between the government and citizens in disaster management activities, the achievements of the emergency drone
operation team were selected as a best practice by the Ministry of the Interior and Safety for two consecutive years
from 2018 to 2019.
Impacts and Results
The emergency drone operation team has drawn up a standard operating procedure for drone operations to help
citizens efficiently cooperate in supporting disaster/accident management using drones. The standard operating
procedure for drone operation was established based on a virtual typhoon situation where there is a relatively
sufficient amount of time for preparation and response until the damage occurs and the route and time of and
extent of local damage caused by the typhoon are predictable.
The standard operating procedure is divided into four stages - Decision of Operation, Emergency Contact/Operating
Plan, Drone Operation/Information Sharing, and Support for Situation Management - to ensure practical application
to disaster sites. It mainly addresses procedures and methods for on-site drone operation and the dissemination
and sharing of information acquired by individual drone operators to support disaster management.
The procedure sets forth that the decision to operate emergency drones shall be made only when a medium-scale
(or larger) typhoon hits the Korean peninsula or severe damage is expected so that the Central Disaster and Safety
Countermeasure Headquarters begins operating.
For ‘Emergency Contact/Operating Plan’, resource information, including the residential area, contact information,
drone equipment characteristics, mapping, and filming capabilities of individual drone operators, are analyzed
to enable rapid movement and access to the site and various collection and analysis of necessary information
according to the disaster situation. Since a large number of individual drone operators are active nationwide, regional
managers have been designated for 13 regions in Korea, under the leadership of the pilots from the Korea Aero
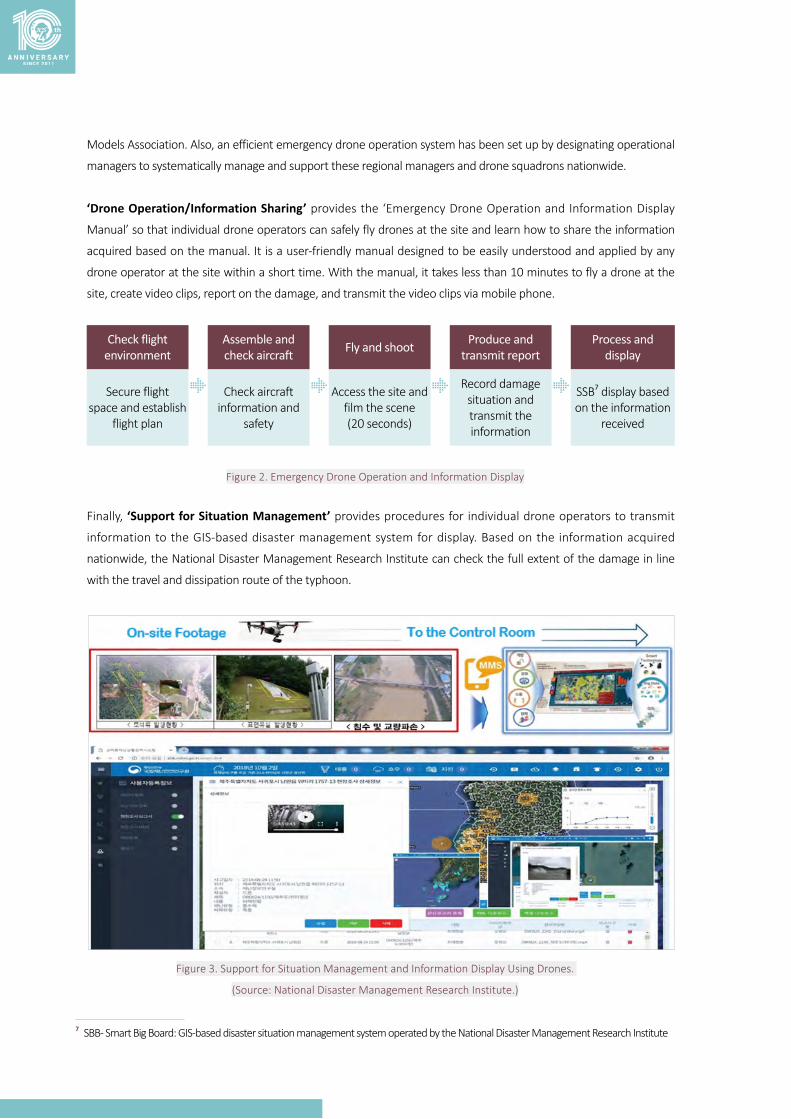
54
Models Association. Also, an efficient emergency drone operation system has been set up by designating operational
managers to systematically manage and support these regional managers and drone squadrons nationwide.
‘Drone Operation/Information Sharing’ provides the ‘Emergency Drone Operation and Information Display
Manual’ so that individual drone operators can safely fly drones at the site and learn how to share the information
acquired based on the manual. It is a user-friendly manual designed to be easily understood and applied by any
drone operator at the site within a short time. With the manual, it takes less than 10 minutes to fly a drone at the
site, create video clips, report on the damage, and transmit the video clips via mobile phone.
Check flight environment
Assemble and check aircraft Fly and shoot Produce and
transmit reportProcess and
display
Secure flight space and establish
flight plan
Check aircraft information and
safety
Access the site and film the scene (20 seconds)
Record damage situation and transmit the information
SSB7 display based on the information
received
Figure 2. Emergency Drone Operation and Information Display
Finally, ‘Support for Situation Management’ provides procedures for individual drone operators to transmit
information to the GIS-based disaster management system for display. Based on the information acquired
nationwide, the National Disaster Management Research Institute can check the full extent of the damage in line
with the travel and dissipation route of the typhoon.
Figure 3. Support for Situation Management and Information Display Using Drones.
(Source: National Disaster Management Research Institute.)
7 SBB - Smart Big Board: GIS-based disaster situation management system operated by the National Disaster Management Research Institute

55
In 2019, the emergency drone operation team was operated on a trial basis in areas affected by typhoons,
supporting a total of three cases of typhoon damage management. The activities of the team were divided mainly
into two parts: operation when a typhoon landed and operation when it dissipated.
When a typhoon is landing, the drone operators film the conditions on the ground such as damage and inundation
in residential areas, loss of breakwater, flooding of agricultural land, and vinyl greenhouse damage, and send the
videos along with location information via smartphone. After the typhoon dissipates and the weather stabilizes,
the drone operators film the damage in areas severely affected across the country and share the videos along with
location information.
Figure 4. Emergency Drone Operation System for Typhoon Response
(Source: National Disaster Management Research Institute)
Challenges
The National Disaster Management Research Institute of the Ministry of the Interior and Safety has been operating
drones as part of its disaster investigation equipment since 2013, and has continuously enhanced national disaster
management capabilities through research on the use of drones in supporting damage investigation efforts in areas
affected by typhoons, torrential rains, and other disasters.
It is important to find new areas in which drones can be used for disaster response. A legal framework, as well as
assistance structures, is necessary to efficiently promote cooperation between the public and private sectors, with
the Ministry of the Interior and Safety at the center.
Potential for Replication
The synergy effect of the cooperation between public and private drone groups for disaster response and the
expected effects of the reduced budget for drone purchases and drone operator training in the public sector and
efficient allocation of national resources have already been demonstrated in the pilot operation of the Emergency
Drone Operation Team for Disaster Response. In particular, it will be possible to establish a cooperative relationship
to enhance disaster response capabilities through constant joint activities and exchanges between region-based
individual drone operators and disaster management personnel of local governments.

56
This first pilot-based emergency drone operation team has formed the basis for the development of best practices,
greatly contributing to the increase in joint public-private drone teams, including the Civil Drone Search Team of the
Korea Coast Guard and Civilian Police Drone Search Team (tentative name) of the National Police Agency. This trend
is expected to strengthen disaster response capabilities for marine incidents using resources from the public and
private sectors as well as searches for missing persons on land.

Trilateral Best Practices: Application of Technology for Reducing Disaster Risks in China, Japan and Korea