trillion “a billion here, a billion there, and pretty soon...
TRANSCRIPT
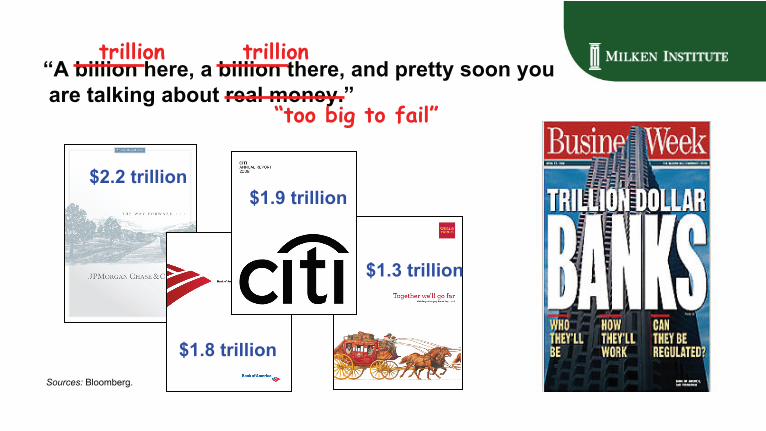
“A billion here, a billion there, and pretty soon you
are talking about real money.”
Sources: Bloomberg.
trillion
trillion
“too big to fail”
$2.2 trillion
$1.8 trillion
$1.9 trillion
$1.3 trillion

Subprime write-downs
Source:
Bloomberg.
US$ billions, as of April 10, 2009 Loss CapitalWachovia, United States 101.9 11Citigroup, United States 88.3 109.3AIG, United States 87.3 91.7Freddie Mac, United States 81.6 51.6Fannie Mae, United States 71.3 30.8Merrill Lynch, United States 55.9 29.9UBS, Switzerland 50.6 32.1Washington Mutual, United States 45.3 12.1Bank of America, United States 42.7 78.5HSBC, United Kingdom 42.2 23.7Others 621 633.2Grand total 1,288.1 1,103.9

Number of unprofitable financial institutions
on the rise
Annual, 1982-2008
0
5
10
15
20
25
30
35
1982 1984 1986 1988 1990 1992 1994 1996 1998 2000 2002 2004 2006 2008
Percent
Commercial banks: 21.9% in 2008
Savings institutions: 32.1% in 2008
Sources: Moody’s Economy.com, FDIC, Milken Institute.

The rise and fall of private-label securitizers
Sources:
Federal Reserve, Milken Institute.
Private-label
1985
total = $110 B2001
total = $1.3 T2006
total = $2.0 T2008
total = $1.2 T
New securities issuance
Fannie Mae, Freddie Mac, Ginnie Mae
2%
98%
20%
80%
56%
44%
4%
96%

Rising risk: The credit default swap market nearly doubled each year from June 2001
through October 2008
0.6 0.9 1.6 2.2 2.7 3.8 5.4 8.412.4
17.126.0
34.4
45.5
62.254.6
47.0
0
10
20
30
40
50
60
70
June2001
Dec.2001
June2002
Dec.2002
June2003
Dec.2003
June2004
Dec.2004
June2005
Dec.2005
June2006
Dec.2006
June2007
Dec.2007
June2008
Oct.2008
Notional amount of credit default swaps outstanding, US$ trillions
Source: International Swaps and Derivatives Association.

AIG received AA rating despite large
exposure in credit default swaps
$1,058 $1,167$883
$218$224
$194
$180$179
$132
$484$562
$306
0
500
1,000
1,500
2,000
2,500
2006 2007 2008
Credit default swaps
Swaptions, equityand commodityswapsCurrency swaps
Interest rate swaps
US$ billionsIssuer rating for AIG,
2005-2008
S&P AA
Moody’s Aa2
Fitch AA
Sources: AIG, Bloomberg.
Note: Credit default swaps exposure not released in 10K before 2006.

Market for liquidity freezes Spread between 1-month LIBOR and OIS
Note: LIBOR:
London Interbank
Offered Rate; OIS: Overnight indexed swap.Sources: Bloomberg, Milken Institute.
0
100
200
300
400
January-07 July-07 January-08 July-08 January-09
1-month LIBOR-OIS spread, basis points
Bear Stearns IndyMac
FannieMae/Freddie Mac
Lehman Brothers
Wachovia
Washington Mutual AIG
CPP + TLGPEESA passed
Beginning of credit crisis
EESA: Emergency Economic Stabilization Act.
CPP: Capital Purchase Program
TLGP: Temporary Liquidity Guarantee Program
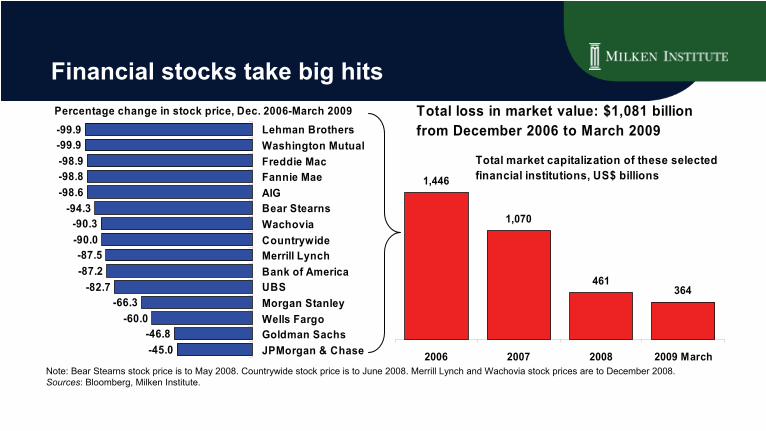
Financial stocks take big hits
Note: Bear Stearns stock price is to May 2008. Countrywide stock
price is to June 2008. Merrill Lynch and Wachovia stock prices are to December 2008.Sources: Bloomberg, Milken Institute.
-99.9-99.9-98.9-98.8-98.6
-94.3-90.3-90.0-87.5-87.2
-82.7-66.3
-60.0-46.8-45.0
Lehman BrothersWashington MutualFreddie MacFannie MaeAIGBear StearnsWachoviaCountrywideMerrill LynchBank of AmericaUBSMorgan StanleyWells FargoGoldman SachsJPMorgan & Chase
Percentage change in stock price, Dec. 2006-March 2009
1,446
1,070
461364
2006 2007 2008 2009 March
Total loss in market value: $1,081 billion from December 2006 to March 2009
Total market capitalization of these selectedfinancial institutions, US$ billions

Estimated U.S. total bailout costs (US$ billions)
The government has extended the bailouts to nearly $US10 trillion
Source:
The Milken Institute.
Federal Reserve, Treasury, FDIC:
$362
FDIC: $926
Treasury: $2,466Federal Reserve:
$6,139
Estimated U.S. total bailout costs as of March 2009 (including guarantees and all commitments):
US$9.9 trillion

TARP: Troubled Asset Relief Program
Status of TARP
funds (US$ billions) as of March 27, 2009
Source: Wall Street Journal. US$ billions
40
24.5
238.9
0 100 200 300 400 500 600
Already disbursed
Maximum announced funding level
15
Banking system
AIG
Auto companies and suppliers
Small business
Life insurers (estimated)
522.5
70
29.9
25

U.S. Treasury Department TARP funds
As of April 15, 2009
Company US$ billionsCitigroup 50.0Bank of America/Merrill Lynch 45.0JPMorgan Chase 25.0Wells Fargo 27.9Goldman Sachs 10.0Morgan Stanley 10.0PNC Financial Services 7.6U.S. Bancorp 6.6Other 161.0Total 343.1
Source: U.S. Treasury Department.
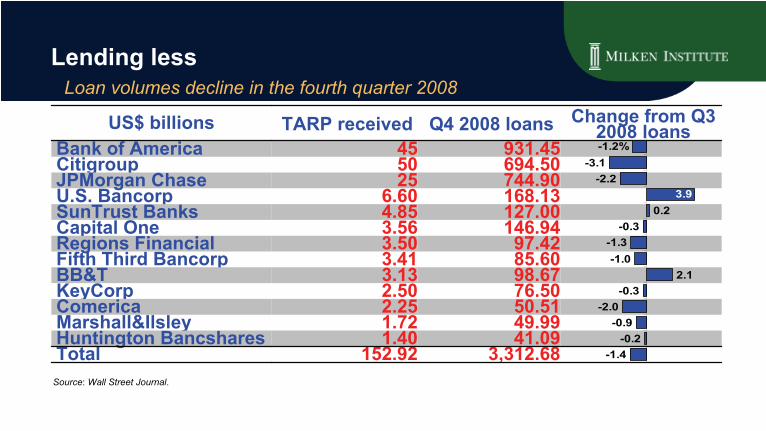
Lending less
Loan volumes decline in the fourth quarter 2008
US$ billions TARP received Q4 2008 loans Change from Q3 2008 loans
Bank of America 45 931.45Citigroup 50 694.50JPMorgan Chase 25 744.90U.S. Bancorp 6.60 168.13SunTrust Banks 4.85 127.00Capital One 3.56 146.94Regions Financial 3.50 97.42Fifth Third Bancorp 3.41 85.60BB&T 3.13 98.67KeyCorp 2.50 76.50Comerica 2.25 50.51Marshall&Ilsley 1.72 49.99Huntington Bancshares 1.40 41.09Total 152.92 3,312.68
Source: Wall Street Journal.
-3.1-2.2
0.2-0.3
-1.3-1.0
2.1-0.3
-2.0-0.9
-0.2-1.4
3.9
-1.2%
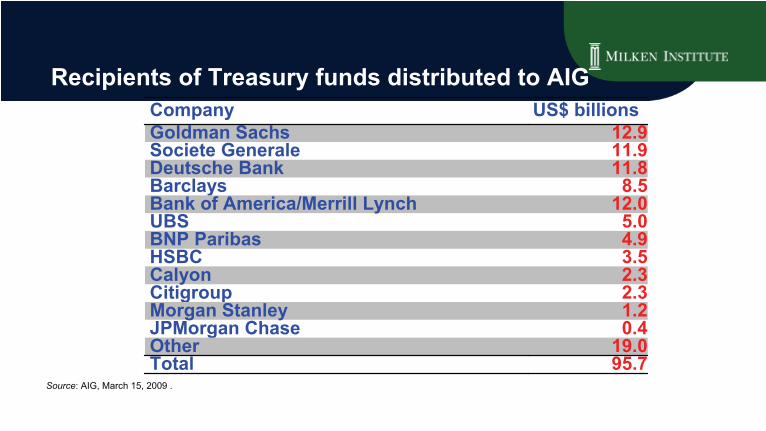
Recipients of Treasury funds distributed to AIGCompany US$ billionsGoldman Sachs 12.9Societe
Generale 11.9Deutsche Bank 11.8Barclays 8.5Bank of America/Merrill Lynch 12.0UBS 5.0BNP Paribas 4.9HSBC 3.5Calyon 2.3Citigroup 2.3Morgan Stanley 1.2JPMorgan Chase 0.4Other 19.0Total 95.7
Source: AIG, March 15, 2009 .

GM and Chrysler to receive TARP funds
Source: http://www.detnews.com
•
The Treasury has injected about $25 billion --
or 3.5 percent --
of the TARP funds, including $1.5 billion to Chrysler Financial, $6 billion to support GMAC.
•
TARP will support up to $1.25 billion on an auto industry warranty program. That would back Chrysler or GM vehicle warranties in the event either company filed for bankruptcy protection.
• A separate $5 billion auto supplier program has also been created.
•
On March 30, the Obama administration gave General Motors Corp.
60 days to come up with a tougher restructuring plan.

U.S. capital injections and write-downs
Will the massive write-downs continue?
Source:
Bloomberg.
0
50
100
150
200
250
300
Priorquarters
Q3 2007 Q4 2007 Q1 2008 Q2 2008 Q3 2008 Q4 2008 Q1 2009
Losses and write-downs: Total US$ 869.7 billionCapital injections: Total US$ 646 billion
US$ billions, most recently available data, as of March 2009
U.S. financial institutions

Total assets of selected failed or acquired financial institutions
Total assets= $3.0 trillion
Sources: Bloomberg, Milken Institute.
172
310
399
639
668
764
Countrywide,6/30/2008
Washington Mutual,6/30/2008
Bear Stearns,3/31/2008
Lehman Brothers,6/30/2008
Merrill Lynch,12/31/2008
Wachovia,9/30/2008
US$ billions
Purchased by Wells Fargo
Acquired by Bank of America
Filed for bankruptcy
Sold to JPMorgan Chase
Purchased by Bank of America
Sold to JPMorgan Chase

Public-Private Investment Program
US$ 75-100 billion of TARP/FSP capital
Legacy Securities Program
Capital Public-Private
Investment Funds
• Combines private capital with USG capital and potential USG leverage
FinancingLeverage from
Federal Reserve
• Builds on existing TALF framework
Source: U.S. Treasury.
Legacy Loans Program
Capital Public-Private
Investment Funds
• Combines USG and private capital
FinancingFunds will raise FDIC
guaranteed debt
• FDIC will guarantee debt
• Leverage up to 6.1

A question of equity: Stress tests?
U.S. regulatory capital requirements and selected equity ratios
Sources: FDIC, Bloomberg, Milken Institute.
Tier 1leverage
Tier 1 risk-
based
Total risk-
based
Well capitalized >= 5% >= 6% >= 10%
Adequately capitalized >= 4% >= 4% >= 8%
Undercapitalized < 4% < 4% < 8%
Significantly undercapitalized < 3% < 3% < 6%
Critically undercapitalized
Tangible equity capital ratio that is <= 2%
0 5 10 15 20
Citigroup
Wells Fargo
Bank NY Mellon
PNC Financial Services
US Bancorp
Bank of America
JPMorgan Chase
Morgan Stanley
Goldman Sachs
SunTrust Banks
Tier 1 capital ratioTangible common equity ratio

American Recovery and Reinvestment Act of 2009 The US$787 billion stimulus plan is intended to create 3-4 million jobs
Source:
Recovery.gov.
$8 billion
$43 billion
$53 billion
$59 billion
$81 billion
$111 billion
$288 billion
$144 billion
Other
Energy
Education and training
Health care
Protecting the vulnerable
Infrastructure and science
State and local fiscal relief
Tax relief

Administration estimated aggregate effect of the recovery package on GDP and jobs in Q4 2010
Real GDP(US$ billions) Payroll employment
Without Stimulus $11,770 133,876,000
With Stimulus $12,203 137,550,000
Effect of Package Increase GDP by 3.7% Increase jobs by 3,675,000
Source:
Christina Romer
and Jared Bernstein, “The Job Impact of the American Recovery and Reinvestment Plan."

Infrastructure outlays from the American Recovery and Reinvestment Act
U.S.$ billions
Transportation
Energy programs
Broadband,
telemedicine, and distance
learning
Housing
Federal buildings
Clean and drinking water
Source:
Congressional Budget Office.