trinidad and tobago : natural gas monetization as a...
TRANSCRIPT

Atlantic LNG Plant
MINISTRY OF ENERGY MINISTRY OF ENERGY AND ENERGY INDUSTRIESAND ENERGY INDUSTRIES
Trinidad And Tobago : Natural Gas Monetization As A Driver Of Economic And Social Prosperity
David Small Member, Board of Directors, National Gas Company of Tri nidad & Tobago
Director, Policy & Performance, Ministry of Energy & E nergy Industries
World Gas ConferenceAmsterdam, Netherlands
June 07, 2006
NATIONAL GAS COMPANY
OF TRINIDAD AND TOBAGO

The Energy Sector Is Playing a Major Role in T&T Development
The Government of Trinidad and Tobago has embarked on an ambitious and far-reaching programme to achieve widespread and sustainable development by the year 2020.
The energy industry is the primary driver of economic activity in T&T, accounting for an average of 36.6% of the country’s GDP over 2001 to 2005 (based on constant 2000 prices.) For 2005, this is projected be 40.5%
Because of its scale and scope, the energy sector will continue to be a major driver for economic development, while providing a platform for significant development of certain key ingredients in achieving the “Vision 2020” goals:
� People, �Enterprises�The Capital market�Innovation�Technology
This allows us an opportunity to use the energy sector as an agent for sustainable development and diversification.
Government agencies and the state-owned energy companies will play an important role in the realisation of these goals.
Current Context

Selected Economic Indicators
Source: Central Bank of Trinidad and Tobago

Summary of Natural Gas Resource for Trinidad and Tobago
34.87
7.07
9.03
18.77
2005
5.86.1Possible
Gas (TCF)
33.235.2TOTALS
8.68.3Probable
18.820.8Proved
20042003
Exp Leads ~ 29 TCF
Unrisked Gas leads ~ 30 TCF

Current Gas Industry Structure
Upstream Producers
PowerPowerPowerPower
PetroPetroPetroPetro----
chemicalschemicalschemicalschemicals
Iron Iron Iron Iron
& Steel& Steel& Steel& Steel
LNGLNGLNGLNG
NGC Buys, Compresses, Collects
and Transports
Phoenix Park NGL
Extraction
MarketsCustomers
NG
C G
as S
trea
m
Trains 2 & 3
Trains 1, 2 & 3
NGL’s
NGL MarketNGL MarketNGL MarketNGL Market

1970 1978 1985 1990 1995 2000 2005 2010 2015
0
200,000
400,000
600,000
800,000
1,000,000
1,200,000
Oil & Gas Sales , BOEPD
Gas
Oil
Oil and Gas Production Projection 1980-2020 (BOEPD)

Natural Gas Demand (1997 - 2006)
0
500
1000
1500
2000
2500
3000
3500
4000
(MM
scfd
)
1997 1998 1999 2000 2001 2002 2003 2004 2006
Light Industrial Ammonia Methanol Power Generation Metals Heavy Industrial LNG

Natural Gas Usage 2006 (MMcfd)
LNG, 2350, 59%
Other, 33, 1%
Metal Industries, 131, 3%
Power Generation, 260, 7%
Gas Processing, 30, 1%
Refining, 13, 0%
Ammonia, 533, 14%
Methanol, 570, 15%
Total
3920 Mmcfd
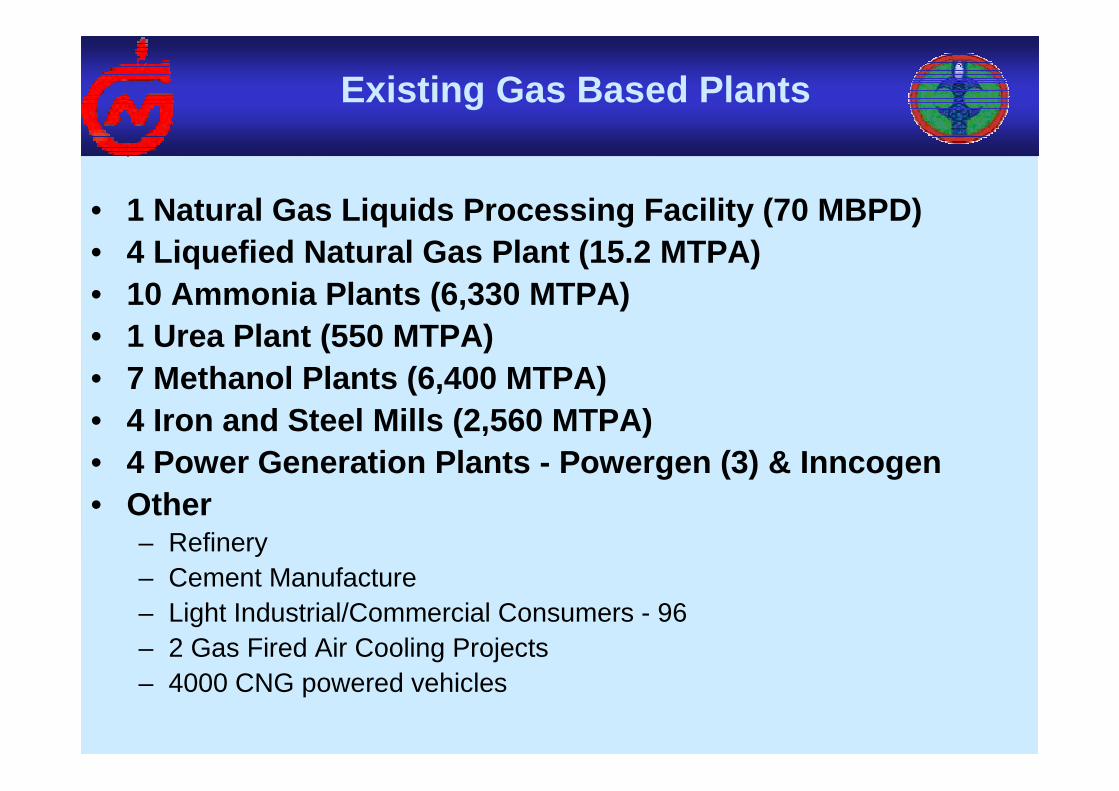
Existing Gas Based Plants
• 1 Natural Gas Liquids Processing Facility (70 MBPD)• 4 Liquefied Natural Gas Plant (15.2 MTPA)• 10 Ammonia Plants (6,330 MTPA)• 1 Urea Plant (550 MTPA)• 7 Methanol Plants (6,400 MTPA)• 4 Iron and Steel Mills (2,560 MTPA)• 4 Power Generation Plants - Powergen (3) & Inncogen• Other
– Refinery– Cement Manufacture– Light Industrial/Commercial Consumers - 96– 2 Gas Fired Air Cooling Projects– 4000 CNG powered vehicles

USA LNG Imports -1994-2005
T&T Supplied >70% Of USA LNG Imports from 2003-05
Source: US Dept. of Energy
0
100
200
300
400
500
600
700
BC
F
1994 1995 1996 1997 1998 1999 2000 2001 2002 2003 2004 2005
Trinidad and Tobago Algeria Nigeria Qatar United Arab Emirates Oman Australia Others
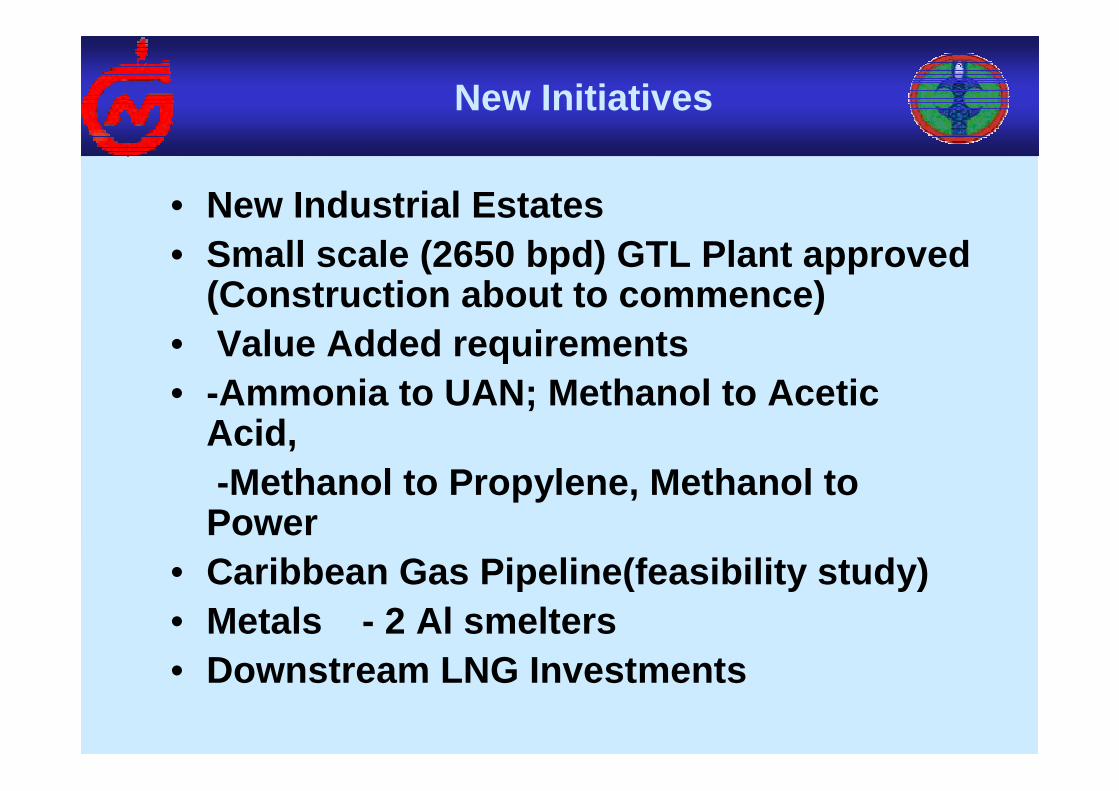
New Initiatives
• New Industrial Estates • Small scale (2650 bpd) GTL Plant approved
(Construction about to commence)• Value Added requirements• -Ammonia to UAN; Methanol to Acetic
Acid,-Methanol to Propylene, Methanol to
Power• Caribbean Gas Pipeline(feasibility study)• Metals - 2 Al smelters• Downstream LNG Investments

Major New Projects
• CLICO AUM (UAN/Melamine)• 60,000 tpy melamine • 1,400,000 tpy UAN (urea ammonium nitrate)
• First UAN (Ammonium/UAN)• 300,000 tpy ammonia• 900,000 tpy UAN
• Alutrint Aluminum Smelter & Downstream• 125,000 tpy aluminum and downstream products
• Alcoa Smelter & Downstream• 341,000 tpy aluminum and downstream products
• Essar Steel HBI (hot briquette iron)• 1,100,000 tpy HBI and 3,300,000 tpy downstream steel slabs
and hot rolled coils• Union Estate Fertilizer Complex including MTP
• 700,000 tpy ammonia• 950,000 tpy UAN• 460,000 tpy polypropylene and downstream
Total CAPEX – US$6.5 Billion -- Investment Decision s – 2006-07

Unitization of Cross-Border Reserves
Cross Border Fields
Cross
Border
Gas
Fields

JPK Proposed EOG Resources
Gas Pipeline System
Plan A –GuadeloupePlan B – Puerto Rico
Caribbean Gas Pipeline - Proposed Routing

Government Realizations
Investmenthas also beenfacilitated by Government investment in industrial infrastructure
Trinidad and Tobagois a small countryHas a small domesticmarket
Aim has been to provide a good environment for
investment throughquick decision-making
on major projects
Trade and Investment are inexorably linked and positively correlated
Economic success best achieved viadevelopment of a vibrant export oriented sector

Wealth vs Natural Resources
T&T today
25
% of Exports in Natural Resources
PP
P P
er C
apita
–th
ousa
nd $
20
15
10
5
00 1005025 75
Japan
UK
Singapore
Germany
US
France
Mexico
Costa RicaRussia
Columbia
Bolivia
Venezuela
Trinidad and Tobago
Argentina
India
Pakistan
Relationship Between Natural Resources Exports and Wealth
Note : The correlation coefficient is –0.66
T&T Vision 2020
Nigeria
Qatar
Norway
CARICOM

Ensuring Continued Economic ProsperityFinding New Reserves -- Exploration
• Phase 1 - Southern Basin Land acreage (Ongoing)
• Phase 2 - Shallow Marine Acreage (Ongoing)• Phase 3 - Deep Atlantic (Q4 2006)

The Local Value Adder
OPERATIONS SKILLSOPERATIONS SKILLS
STRATEGIC SKILLSSTRATEGIC SKILLS
OWNERSHIP & OWNERSHIP & CONTROLCONTROL
Technical Managerial Operations
EN
TER
PR
ISE
DE
VE
LOP
ME
NT
LOCAL LOCAL CAPITAL & CAPITAL &
PUBLIC PUBLIC TRADINGTRADING
Commercial Business Dev
HU
MA
N
CA
PA
BIL
ITY
CA
PITA
L
MA
RK
ETS
Leadership Analytical
Technology transfer/Innovation
Alliances & Collaboration

Local Value-Added - Elements of Strategy
OBJECTIVE
Leverage The Energy Sector To Lead To Sustainable Development Of Non-energy Sectors
STRATEGIES• Intensify links between energy sector and non-energ y
sector • Balance investment portfolio to include value added
products and services• Increasingly Shift focus away from “capital intensi ve
industries” to “knowledge industries. • Ensure investment is productive (future wealth
generating) investment rather than sunk cost investment.
• Encourage strong export-orientation of goods and services

Transformation of Wealth into Economic and Social Prosperity
Economic & Social
Prosperity
SocioeconomicMajor Cities
Regeneration PlanScience & Technology
ParkDevelopment of Urban
Centers
Economic
New In
dustrial
Estates
Fabricatio
n Yard
Hemispheric
Energy
Leadership
FTAA
Headquarters
Social
University of
Trinidad & Tobago
Free Tertiary Education
Medicine Programme
Middle Income Housing

Offshore Platform Fabrication Yard

Government Campus Plaza –50% Complete

International Waterfront Centre25%Complete

Brian Lara International Cricket Stadium
Construction Underway

National Carnival and Arts CentreConstruction about to begin

THANK YOU

Trinidad and Tobago:Where Possibilities are Endless!!
World Cup - Dortmund, June 10, 2006
TRINIDAD AND TOBAGO 2 – SWEDEN 1 !!!