trinidad y tobago energy chamber presentación
TRANSCRIPT

COLOMBIA AND LATIN
AMERICATHE NEXT CHALLENGES
Alvaro Uribe Velez
January 2013

TOPICS FOR DISCUSSION
1. The trends that will define our future
2. Latin America in a multi-polar world
3. The 2013 outlook
4. The Colombian case

1. THE TRENDS THAT WILL DEFINE OUR FUTURE
There are X trends that will shape the global future in the next 20 years…
The global middle class expansion
The rise and flight of the emerging powers
Demography will determine destiny
The pressure for natural resources

1. THE TRENDS THAT WILL DEFINE OUR FUTURE
The global middle class expansion
By 2030 a majority of the world’s population
will not be impoverished, and the growing middle class will determine global consumption patterns
The rise and flight of the emerging powers
Asia will have surpassed North
America and Europe combined in terms of global power, based
upon GDP, population size, military spending,
and technological investment
China alone will probably have the largest economy,
surpassing that of the United States a few years before 2030
Demography will
determine destiny
In 2013 the world will have reached 8.1 billion habitants
Aging population, shrinking young
population, migration and urbanization will impact world social
and economic performance
The pressure for
natural resources
Demand for food, water, and energy
will grow by approximately 35, 40,
and 50 percent respectively owing to
an increase in the global population
and the consumption patterns of an
expanding middle class
Source: U.S National Intelligence Council

1. THE TRENDS THAT WILL DEFINE OUR FUTURE
By 2050 19 of the top 30 economies by GDP will be countries that we currently
describe as ‘emerging’
China and India will be the largest and third-largest economies in the world
Eight countries – India, China, Brazil, Russia,
Indonesia, Korea, Mexico and Turkey – will be
responsible for most of global growth up to 2025
Emerging economies will account for 68% of global
growth by 2030
In 1980, 5% of goods were sourced globally. By 2000, this was 20%. By 2025, it
will be 50%
In 1980, world exports accounted for one-sixth of global GDP. Today it is a
quarter. By 2030, it will have risen to a third
By 2030 the urban middle class will rise to 42% of the
global population. The number of people with daily income of $10 to $100 a day
will rise from 1.8 billion today to 4.9 billion by 2030

Global energy demand rises by over one-third in the period to 2035, underpinned by rising living standards in China, India
& the Middle East
Iraq accounts for 45% of the growth in global production to
2035; by the 2030s it becomes the second-largest global oil exporter, overtaking Russia
By 2035, almost 90% of Middle Eastern oil exports go
to Asia; North America’s emergence as a net exporter accelerates the eastward shift
in trade
The need for electricity in emerging economies drives a 70% increase in worldwide
demand, with renewable accounting for half of new
global capacity
Electricity prices are set to increase with the highest prices persisting in the
European Union & Japan, well above those in China & the
United States
The energy sector’s water needs are set to grow, making
water an increasingly important criterion for
assessing the viability of energy projects
Two-thirds of the economic potential to improve energy
efficiency remains untapped in the period to 2035
1. THE TRENDS THAT WILL DEFINE OUR FUTURE
Global energy trends in the next 25 years…
Source: International Energy Agency

2. LATIN AMERICA IN A MULTI-POLAR WORLD
Policy Changes since 1980 match four range of opportunities
Population
Close to 600 million people
Average age between 24 and
28
Per Capita Income in PPP close to
US$10.000
Poverty reduction
64% of our population is a expanding middle class
During the last decade 40 million people have left the poverty line
Life expectancy has increased from 65 to 75 years
Child mortality has been reduced by 50 per cent
Literacy rates are above 94%.
Mobile phone penetration has increased by 78 per cent
Internet access has increased by 33%
Healthcare coverage has increased by 50 percent
water and sanitation coverage has reached 80%.
Commodities in time of Demand
10 percent of the World oil reserves
6 percent of the World Gas reserves
Almost 50 percent of the World cooper
reserves
50 per cent of the World silver reserves
13% of the World iron reserves
26% of the World fertile land
24% of the World beef supply
Bio Reserves
20 per cent of the World Biodiversity is concentrated in the Amazon ring
Almost 50% of the World potable water supply
57% of the world primary forest
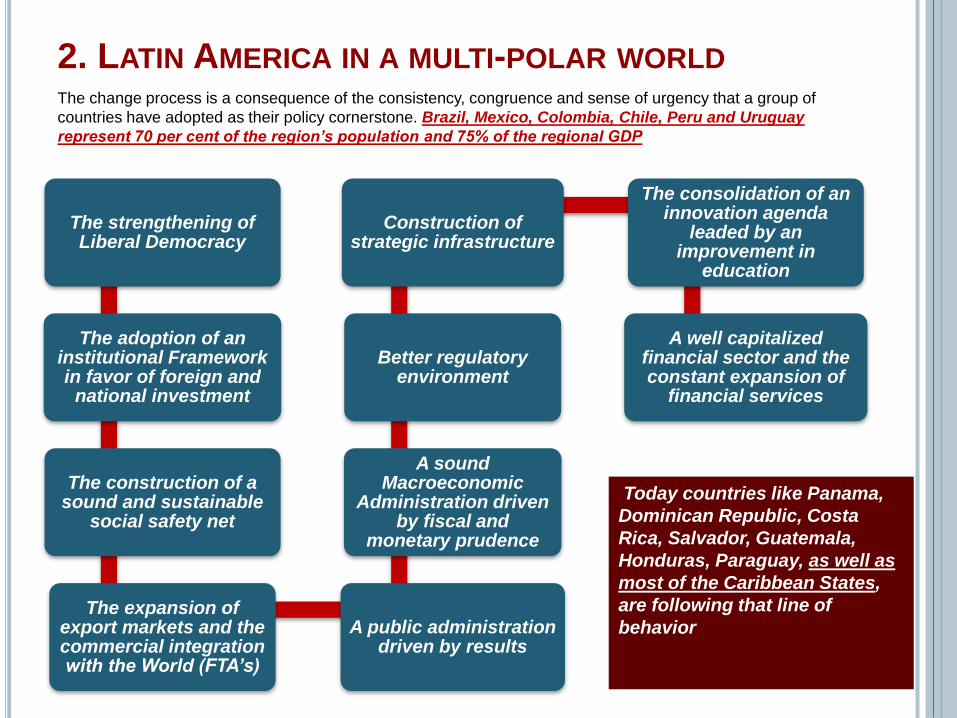
2. LATIN AMERICA IN A MULTI-POLAR WORLD
The strengthening of Liberal Democracy
The adoption of an institutional Framework in favor of foreign and
national investment
The construction of a sound and sustainable
social safety net
The expansion of export markets and the commercial integration with the World (FTA’s)
A public administration driven by results
A sound Macroeconomic
Administration driven by fiscal and
monetary prudence
Better regulatory environment
Construction of strategic infrastructure
The consolidation of an innovation agenda
leaded by an improvement in
education
A well capitalized financial sector and the constant expansion of
financial services
The change process is a consequence of the consistency, congruence and sense of urgency that a group of
countries have adopted as their policy cornerstone. Brazil, Mexico, Colombia, Chile, Peru and Uruguay
represent 70 per cent of the region’s population and 75% of the regional GDP
Today countries like Panama,
Dominican Republic, Costa
Rica, Salvador, Guatemala,
Honduras, Paraguay, as well as
most of the Caribbean States,
are following that line of
behavior

2. LATIN AMERICA IN A MULTI-POLAR WORLD
The regional current Political Map is a “Tale of two cities” like the Charles Dickens Book… (The
ALBA and the non Alba Model)
ALBA (Leaders: Venezuela,
Ecuador, Bolivia, Nicaragua and Cuba)
Anti-U.S
Anti-Free Trade
Lack of investment Confidence
Weak institutions
Political Insecurity
Ideology driven countries
Political Polarization
Modern Democratic Center Countries (Brazil, Colombia, Peru, Chile, México, Uruguay, Paraguay, Panamá, Republic
Dominican, Costa Rica, etc)
Cooperation with the U.S
Pro Free Trade
Investment Confidence
Independent Institutions
Political Stability
State Long Term Policies and Mgt by Results
Organized Party Systems
The Democratic Center takes the lead:
• Investment grade countries are in this Group: Mexico, Brazil,
Chile, Colombia, Peru and Panama
• Countries with more market access through FTA’S are in this
group
• Countries with more FDI are in this group
• Countries with more Middle Class Expansion are in this group
• Better fiscally sustainable social programs: Chile, Mexico,
Brasil and Colombia
Only the group of Countries in the Democratic Center
will become the regional active participants of the
Emerging Markets Boom…some of the ALBA
Members will see some benefits, but without solid
long term development agendas, they will face
transitory profits…
But not all the socio-economic models are a success story…

3. THE 2013 OUTLOOK
After decelerating for two consecutive years, Latin
American economies accelerated growth again at
the end of 2012. Brazil’s recovery was an engine of
performance
The region’s growth averaged around 3.2% in
2012 after 4.3% in 2011 and 6% in 2010
Latin America will approach its potential rate in 2013,
remaining the world's second best performing
region after Asia
Chile reported lower annual growth, although the
economy reaccelerated to rates higher than its long-
term trend because of expansionary monetary
conditions
Colombia’s growth was below government
expectations reaching a 3.5% level
Due to the political transition, which generates temporary contractions the Mexican
economy began decelerating in the second half of the year
Brazil became the main contributor to Latin
America’s growth reduction in the past two years
Inflation was maintained on target with the excepctions of Mexico and Brazil, that
experienced marginal increases
The 2012 experience….

3. THE 2013 OUTLOOK
Argentina
The country will face risks in 2013, although growth will improve in
comparison with 2012
Uncertainty will increase
Inflation will be around 25%
Public expenditure will be the driver of economic growth
Central Bank will continue to be the main source of funding for the Central
Government.
Economy will grow 3.4% in 2013
Brazil
The economy experienced a small scale recovery at the end of 2012
The recovery will strengthen in 2013, boosted by investment for the 2014 World Cup, as well as the fiscal and monetary
stimulus package in place
The economy will grow 5% in 2013
Chile
Monetary conditions need to be stabilized before excess demand threatens
economic stability
Growth in 2013 will be around 4.3%
Inflation will remain on target
Source: World Bank

3. THE 2013 OUTLOOK
Mexico
The deceleration initiated at the end of 2012 will extend over the first half of 2013, as a change in political
administration usually introduces a delay in the federal budget and private decisions on investment
The economy will grow only 3.5% in 2013 after 3.8% in 2012
Inflation is rising
Monetary tightening could affect growth performance
Great expectations are based on the new government reform agenda
Peru
The best performer with strong fundamentals and a well managed mining boom
Growth will reach 5.8% in 2013
Inflation will be between 1% and 3%
Venezuela
The fiscal deficit in 2012 reached troublesome levels, that will require cuts in 2013
Growth will be around 1.5% and 2%
Declines in the oil price could trigger a recession
Inflation will reach 30%
Source: World Bank

2009 2010 2011 2012e 2013f 2014f 2015f
Financial Flows
Capital Inflows 179.6 328.5 303.9 322.4 326.2 327.1 342.3
Private inflows, net 161.6 306.1 299.1 320.5 327.1 327.8 344.7
Equity Inflows, net 126.5 166.6 165.6 179.5 198.0 200.8 214.5
FDI inflows 84.9 125.3 158.3 167.3 182.4 176.3 184.2
Portfolio equity inflows 41.6 41.3 7.4 12.2 15.6 24.5 30.3
Private creditors, net 35.1 139.5 133.4 141.0 129.1 127.0 130.2
Bonds 45.9 72.9 85.2 95.1 72.2 57.7 60.2
Banks -1.7 21.7 51.7 41.4 42.7 45.2 51.4
Short-term debt flows -8.6 43.8 -3.0 4.3 12.7 23.4 16.5
Other private -0.5 1.1 -0.4 0.2 1.5 0.7 2.1
Offical inflows, net 18.0 22.5 4.8 1.9 -0.9 -0.7 -2.4
World Bank 6.6 8.3 -2.9 0.4 .. .. ..
IMF 0.4 1.3 0.2 0.1 .. .. ..
Other official 11.0 12.9 7.5 1.4 .. .. ..
3. THE 2013 OUTLOOK
Regional Financial Flows
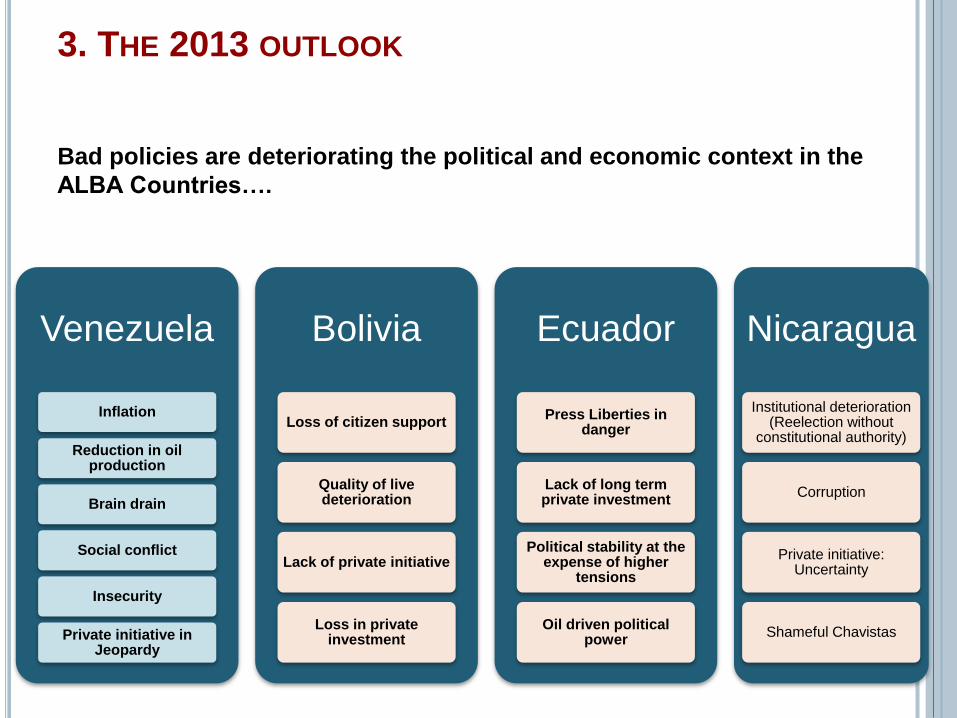
Venezuela
Inflation
Reduction in oil production
Brain drain
Social conflict
Insecurity
Private initiative in Jeopardy
Bolivia
Loss of citizen support
Quality of live deterioration
Lack of private initiative
Loss in private investment
Ecuador
Press Liberties in danger
Lack of long term private investment
Political stability at the expense of higher
tensions
Oil driven political power
Nicaragua
Institutional deterioration (Reelection without
constitutional authority)
Corruption
Private initiative: Uncertainty
Shameful Chavistas
Bad policies are deteriorating the political and economic context in the
ALBA Countries….
3. THE 2013 OUTLOOK

Building Modern Democracies
(5 parameters)
Security
Freedoms and Private Initiative
Independent Institutions
Social Cohesion
People Participation
A dynamic Economic
transformation
Investment Target Policies
Maintaining Fiscal and Monetary transformation
Integrate commodity and knowledge based
economies.
Expand export markets
Create an Entrepreneurship culture
(Innovation agenda)
Closing Social Gaps
Improve education (quality, coverage,
vocational)
Insure Universal Healthcare
Formal Job creation
Access to Finance
Climate Change, Environment and Energy
Sustainability
Expand renewable sources
Install an energy efficiency conscience
Improve waste management
Protect the Amazon Ring
Reduce Co2 Emissions
Despite the changes that have been achieved some important challenges remain…
3. THE 2013 OUTLOOK
The region top challenges

Security
28.837 homicides
2882 kidnappings
69 homicides per 100.000 habitants
1645 terrorist attacks
350 mayors out of their municipalities
158 municipalities without police
Economy
Average Economic Growth 1994-2001: 2.1%
GDP per Capita: US$2377
Investment as % of GDP: 16.5%
Exports: US$11.975 million
FDI: US$2.100 million
Inflation: 6.99%
Fiscal balance: -3.2%
Social
Unemployment: 16.2%
Health Coverage: 25 million Colombians
Pension affiliates: 4.5 million
Poverty: 57%
Education Coverage: Primary 97%, High school: 57%, University: 24%
Mobil Phone Lines: 4.6 million
Internet coverage: 1.9 million
Eleven years ago Colombia was a fragile state…
The Colombian Paradox: a long and stable democracy in a permanent threat from terrorist groups,
drug dealers and organized crime…
4. THE COLOMBIAN CASE: NO LOST CAUSES

WE INTRODUCED A COMPREHENSIVE POLICY FRAMEWORK…
Social Cohesion
Investment with
fraternity
Democratic Security
Confidence
Security as a Democratic Value
Security for all
Confront all criminal
organizations
Security without
martial law
Security with freedoms and human rights
protection
Security in coordination
with the people
Investment Target
Security:
Human
Legal
Political
Sound Macroeconomics
Incenti-ves
Access to markets
Competitiveness factors:
• Infrastructure
• Regulation
• Connectivity
• Logistical chain
Social Cohesion
Highest quality in education
Universal healthcare
Access to Finance
Stable Jobs and
entrepreneurial spirit
Connectivity
4. THE COLOMBIAN CASE: NO LOST CAUSES
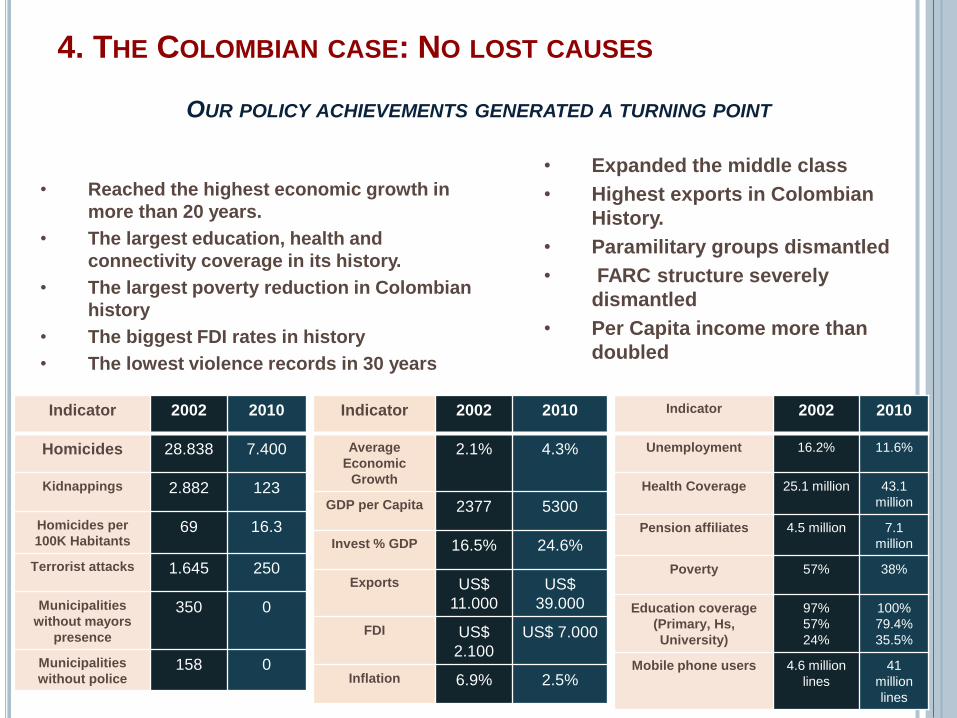
OUR POLICY ACHIEVEMENTS GENERATED A TURNING POINT
Indicator 2002 2010
Homicides 28.838 7.400
Kidnappings 2.882 123
Homicides per
100K Habitants69 16.3
Terrorist attacks 1.645 250
Municipalities
without mayors
presence
350 0
Municipalities
without police158 0
Indicator 2002 2010
Average
Economic
Growth
2.1% 4.3%
GDP per Capita 2377 5300
Invest % GDP 16.5% 24.6%
Exports US$
11.000
US$
39.000
FDI US$
2.100
US$ 7.000
Inflation 6.9% 2.5%
Indicator 2002 2010
Unemployment 16.2% 11.6%
Health Coverage 25.1 million 43.1
million
Pension affiliates 4.5 million 7.1
million
Poverty 57% 38%
Education coverage
(Primary, Hs,
University)
97%
57%
24%
100%
79.4%
35.5%
Mobile phone users 4.6 million
lines
41
million
lines
• Reached the highest economic growth in
more than 20 years.
• The largest education, health and
connectivity coverage in its history.
• The largest poverty reduction in Colombian
history
• The biggest FDI rates in history
• The lowest violence records in 30 years
• Expanded the middle class
• Highest exports in Colombian
History.
• Paramilitary groups dismantled
• FARC structure severely
dismantled
• Per Capita income more than
doubled
4. THE COLOMBIAN CASE: NO LOST CAUSES

Structural Elements
Political Stability
Sound Macroeconomic Management
Human, Political and Legal Security
Competitive elements
Investment incentives
Access to markets (Canada, EU, EEUU, MERCOSUR, etc)
Free Trade Zones
Logistical advantages
Legal stability agreements
Comparative elements
Investment Grade
Stable institutions
Growing internal demand
Complementary
Human Capital
New World Class Sectors incentives.
Strong financial system
We made Colombia a viable country for FDI due to a multiplicity of factors…
4. THE COLOMBIAN CASE: NO LOST CAUSES

In 2002 it was believed that by 2009 Colombia oil
production will not be able to attend national demand
In 2003 the oil and gas sector restructuring was
designed
ECOPETROL undertook a strategy shift to become a
more competitive and professional corporation
The National Hydrocarbon Agency was created
Between 2002 and 2010 341 exploration and
production contracts were signed
In 2007 ECOPETROL was capitalized by 10% through
local capital markets. 486.000 Colombians
bought shares
Between 2002 and May 2010 447 new fields were
explored
From 2002 to 2010 successful exploration
passed from 40% to 61.4%
Seismic exploration in the country (Onshore, Offshore
and 2 dimensions) increased by more than
250%
Colombia is currently close to produce 1 million oil
barrels per day
Success triggers
Security: Investment,
exploration
Government Reform: New
ECOPETROL and ANH
Investment target policies:
New players and new
exploration and production
contracts
The case of the oil sector in Colombia: Change is possible
4. THE COLOMBIAN CASE: NO LOST CAUSES

Colombia has 2 billion barrels of proven oil
reserves
Colombia reached 1 million barrels per day
in 2012
Colombia consumes 298.000 barrels per
day
The USA is Colombia’s mayor oil
export destination
Colombia has 4.7 trillion cubic feet of
Natural Gas Reserves
Colombia has 5643 million short tons of
recoverable coal reserves, the largest
in South America
Colombia produces approximately 82 million short tons,
while only consuming 5.6 million short tons.
4. THE COLOMBIAN CASE: NO LOST CAUSES
Key elements in Colombia’s energy outlook
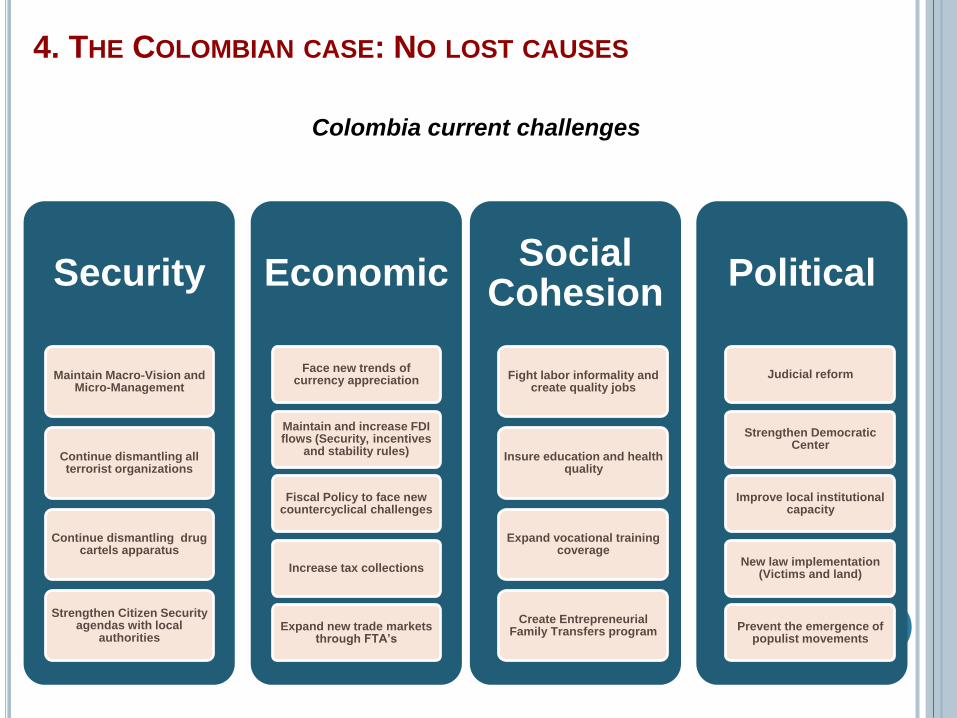
Security
Maintain Macro-Vision and Micro-Management
Continue dismantling all terrorist organizations
Continue dismantling drug cartels apparatus
Strengthen Citizen Security agendas with local
authorities
Economic
Face new trends of currency appreciation
Maintain and increase FDI flows (Security, incentives
and stability rules)
Fiscal Policy to face new countercyclical challenges
Increase tax collections
Expand new trade markets through FTA’s
Social Cohesion
Fight labor informality and create quality jobs
Insure education and health quality
Expand vocational training coverage
Create Entrepreneurial Family Transfers program
Political
Judicial reform
Strengthen Democratic Center
Improve local institutional capacity
New law implementation (Victims and land)
Prevent the emergence of populist movements
4. THE COLOMBIAN CASE: NO LOST CAUSES
Colombia current challenges

WWW.ALVAROURIBEVELEZ.COM