trip generation study big box retail
TRANSCRIPT

Traffic Planning October 2009
Trip Generation Study Big Box Retail
(Home Improvement Superstores In New York City)
Final Draft
ii
Trip Generation Study
Big Box Retail (Home Improvement Super Stores)
Contract. 08D00.F02
The preparation of this report has been financed in part through funds from the U.S. Department
of Transportation, Federal Highway Administration (FTA) through the New York State Department
of transportation and the New York Metropolitan Transportation Council. This document is
disseminated by the New York City of transportation in the interest of information exchange. It
reflects the views of the New York City Department of Transportation (NYCDOT) which is
responsible for the facts and the accuracy of the data presented. The report does not necessarily
reflect any official views or policies of the Federal Transit Administration, the federal Highway
Administration or the State of New York. This report does not constitute a standard, specification
or regulation.
Prepared by:
New York City Department of Transportation Janette Sadik-Khan, Commissioner
Lori Ardito, First Deputy Commissioner
Gerard Soffian, Acting Deputy Commissioner
Ryan Russo, Assistant Commissioner
Naim Rasheed, Project Director
Michael Griffith, Deputy Project Director
Harvey LaReau, Highway Transportation Specialist
Hillary Geitz, Principal Administrative Associate
Solomon Assefa, Associate City Planner (Statistical Analysis)
Ali Jaffri, Highway Transportation Specialist

iii

iv
Table of Contents TABLE OF CONTENTS ................................................................................................................. IV LIST OF FIGURES .......................................................................................................................... V LIST OF TABLES........................................................................................................................... VI EXECUTIVE SUMMARY ............................................................................................................... VII INTRODUCTION ............................................................................................................................. 1
STUDY GOALS/OBJECTIVES ........................................................................................................... 1 SITE SELECTION ............................................................................................................................ 2 40 WEST 23RD STREET, MANHATTAN .............................................................................................. 2 2970 CROPSEY AVENUE, BROOKLYN ............................................................................................. 2 111 JERICHO TURNPIKE, SYOSSET NY ........................................................................................... 3 50 – 10 NORTHERN BOULEVARD, QUEENS ..................................................................................... 4 112-20 ROCKAWAY BOULEVARD, QUEENS ..................................................................................... 4 545 TARGEE STREET, STATEN ISLAND ........................................................................................... 5 2750 VETERANS ROAD, STATEN ISLAND ......................................................................................... 6 625 ZEREGA AVENUE, BRONX ........................................................................................................ 6
TRIP GENERATION ....................................................................................................................... 7 VEHICLE COUNTS .......................................................................................................................... 7 QUESTIONNAIRE SURVEY ............................................................................................................. 12
SIGNIFICANT FACTORS IN TRIP GENERATION ...................................................................... 14 DEMOGRAPHICS AND SOCIO-ECONOMIC CHARACTERISTICS .......................................................... 16 LAND USE ................................................................................................................................... 21 TRANSPORTATION /ACCESSIBILITY................................................................................................ 23 STATISTICAL TEST: ...................................................................................................................... 31
APPENDICES ............................................................................................................................... 41 A. DEMOGRAPHIC/SOCIO-ECONOMIC DATA .................................................................................. 42 B. STREET AND TRANSIT ACCESSIBILITY MAPS ............................................................................. 48 C. LAND USE MAPS .................................................................................................................... 57 D. QUESTIONNAIRE SURVEY ........................................................................................................ 62 E. RESULTS OF THE ANOVA FOR THE AM, MIDDAY, AND PM PEAK ............................................... 63 F. EXPONENTIAL SMOOTHING ESTIMATIONS FOR DAILY VEHICLE TRIPS ......................................... 72

v
List of Figures FIGURE 1: HOME IMPROVEMENT SUPERSTORE SITES (HISS) .......................................................................... 0 FIGURE 2: AERIAL VIEW OF 23RD STREET FACILITY ....................................................................................... 2 FIGURE 3: AERIAL VIEW OF CROPSEY AVENUE FACILITY ............................................................................... 3 FIGURE 4: AERIAL VIEW OF JERICHO TURNPIKE FACILITY .............................................................................. 3 FIGURE 5: AERIAL VIEW OF NORTHERN BOULEVARD FACILITY ..................................................................... 4 FIGURE 6: AERIAL VIEW OF ROCKAWAY BOULEVARD FACILITY .................................................................... 5 FIGURE 7: AERIAL VIEW OF TARGEE STREET FACILITY .................................................................................. 5 FIGURE 8: AERIAL VIEW OF VETERANS ROAD FACILITY ................................................................................. 6 FIGURE 9: AERIAL VIEW OF ZEREGA AVENUE FACILITY ................................................................................. 6 FIGURE 10: FACILITY TRIP DISTRIBUTION AND PEAK HOURS ......................................................................... 9 FIGURE 11: AVERAGE VEHICLE OCCUPANCY .................................................................................................10 FIGURE 12: AVERAGE PARKING ACCUMULATION .........................................................................................11 FIGURE 13: DELIMITING THE CATCHMENT AREA ...........................................................................................15 FIGURE 14: CATCHMENT AREA AND CORRESPONDING CENSUS TRACTS – CROPSEY AVE .............................17 FIGURE 15: POPULATION DENSITY .................................................................................................................18 FIGURE 16: HOUSEHOLD SIZE ........................................................................................................................19 FIGURE 17: MEDIAN HOUSEHOLD INCOME ....................................................................................................20 FIGURE 18: VEHICLES PER HOUSEHOLD .........................................................................................................20 FIGURE 19: CROPSEY AVENUE ZONING ANALYSIS ........................................................................................22 FIGURE 20: CROPSEY AVENUE ROADWAY ACCESS ........................................................................................25 FIGURE 21: CROPSEY AVENUE OBSERVED AND ESTIMATED VEHICLE TRIPS .................................................30 FIGURE 22: ZEREGA AVENUE OBSERVED AND ESTIMATED VEHICLE TRIPS ...................................................30 FIGURE 23: DATA PLOT AND EQUATION - AM PEAK......................................................................................35 FIGURE 24: DATA PLOT AND EQUATION - MD PEAK......................................................................................36 FIGURE 25: DATA PLOT AND EQUATION - PM PEAK ......................................................................................37 FIGURE 26: DATA PLOT AND EQUATION - WD PEAK .....................................................................................38 FIGURE 27: DATA PLOT AND EQUATION - AM ADJ. .......................................................................................39 FIGURE 28: DATA PLOT AND EQUATION - PM ADJ.........................................................................................40 FIGURE 29: 23RD ST. STREET SYSTEM ...........................................................................................................49 FIGURE 30: 23RD ST. TRANSIT SYSTEM..........................................................................................................50 FIGURE 31: CROPSEY AVE STREET SYSTEM ...................................................................................................50 FIGURE 32: CROPSEY AVE TRANSIT SYSTEM .................................................................................................51 FIGURE 33: NORTHERN BLVD STREET SYSTEM ..............................................................................................51 FIGURE 34: NORTHERN BLVD TRANSIT SYSTEM ............................................................................................52 FIGURE 35: ROCKAWAY BLVD STREET SYSTEM ............................................................................................52 FIGURE 36: ROCKAWAY BLVD TRANSIT SYSTEM ...........................................................................................53 FIGURE 37: TARGEE ST STREET SYSTEM ........................................................................................................53 FIGURE 38: TARGEE ST. TRANSIT SYSTEM .....................................................................................................54 FIGURE 39: VETERANS RD STREET SYSTEM ...................................................................................................54 FIGURE 40: VETERANS ROAD TRANSIT SYSTEM ............................................................................................55 FIGURE 41: ZEREGA AVE STREET SYSTEM .....................................................................................................55 FIGURE 42: ZEREGA AVE TRANSIT SYSTEM ...................................................................................................56 FIGURE 43: 23RD STREET LAND USE..............................................................................................................58 FIGURE 44: CROPSEY AVENUE LAND USE......................................................................................................58 FIGURE 45: NORTHERN BLVD LAND USE .......................................................................................................59 FIGURE 46: ROCKAWAY BLVD LAND USE .....................................................................................................59 FIGURE 47: TARGEE STREET LAND USE .........................................................................................................60 FIGURE 48: VETERANS ROAD LAND USE .......................................................................................................60 FIGURE 49: ZEREGA AVENUE LAND USE .......................................................................................................61

vi
List of Tables TABLE 1: HISS FACILITY VEHICLE TRIPS/1,000 SQUARE FEET ....................................................................... VII TABLE 2: SUMMARY RESULTS ........................................................................................................................ X TABLE 3: VEHICLE TRIPS /1,000 SQ FT ............................................................................................................ X TABLE 4: HISS SITES IN NEW YORK ............................................................................................................... 1 TABLE 5: HISS STORE HOURS AND SURVEY PERIODS .................................................................................... 7 TABLE 6: WEEKDAY PEAK HOUR .................................................................................................................... 8 TABLE 7: PEAK PERIODS OF THE TRIP GENERATOR AND BACKGROUND TRAFFIC ........................................... 8 TABLE 8: DAILY VEHICLE OCCUPANCY .......................................................................................................... 9 TABLE 9: MODE AND VEHICLE CLASSIFICATION ............................................................................................10 TABLE 10: HISS FACILITY PEAK HOUR VEHICLE TRIPS PER 1000 SQUARE FEET ..........................................12 TABLE 11: SURVEY RESPONSES .....................................................................................................................12 TABLE 12: TRIP AND USER TYPE ....................................................................................................................13 TABLE 13: QUESTIONNAIRE SURVEY - MODE SHARE .....................................................................................13 TABLE 14: TRIP TIME AND DISTANCE ............................................................................................................13 TABLE 15: DEMOGRAPHIC/SOCIO-ECONOMIC SUMMARY ..............................................................................16 TABLE 16: PERCENTAGE ZONING DISTRIBUTION ...........................................................................................23 TABLE 17: ROADWAY ACCESSIBILITY ...........................................................................................................26 TABLE 18: TRANSIT ACCESSIBILITY ...............................................................................................................26 TABLE 19: SECONDARY SURVEY OUTLIERS ...................................................................................................27 TABLE 20: SUMMARY TRIP GENERATION .......................................................................................................29 TABLE 21: NYC, ITE AND EIS VEHICLE TRIPS PER 1,000 SQUARE FEET .......................................................29 TABLE 22: TRIP RATE COMPARISONS .............................................................................................................34

vii
Executive Summary S1. Introduction This Trip Generation Study is an attempt to determine the trip generating characteristics of new
large-scale retail “super stores” and in this case specifically home improvement superstores
(HISS). From a pool of 22 HISS’s within the NYC area, seven facilities were chosen as well as
one from Nassau County for detailed analysis. These eight facilities include one from Manhattan,
Brooklyn, the Bronx and Nassau County and two from Staten Island and Queens. This analysis
focuses on the trips generated by the facilities, trip characteristics such as mode, occupancy, trip
type and customer charactertistics, as well as the socio-economic characteristics, physical site
characteristics (number of parking spaces and facility size), and the transportation accessibility of
the immediate catchment area.
S.2 Trip Generation Field Surveys Traffic counts were conducted in 2007 at facility driveways which recorded vehicle ins and outs,
vehicle classification, occupancy, and parking accumulation and utilization. Additionally,
questionnaire surveys were performed at four facilities to gather additional information about the
trip type, mode and purpose.
S.2.1 Vehicle Trips Individual peak period and 24 hour vehicle trip rates are shown in Table 1. In every case the
Manhattan facility had lower vehicle trip rates than the other facilities. This is largely due to the
high transit/low vehicle mode share in the area. The Northern Blvd. and Rockaway Blvd. facilities
in Queens had the highest weekday 24 hour vehicle trip rates as well as high weekend peak hour
rates.
Table 1: HISS facility vehicle trips/1,000 square feet
WD 24 hour AM MD PM Sat Peak 23rd Street 10.62 0.49 0.97 0.95 1.60 Cropsey Ave 44.09 3.17 3.29 3.17 5.51 Jericho Turnpike 52.91 3.99 5.15 3.20 3.08 Northern Boulevard 59.26 4.04 4.20 3.83 5.75 Rockaway Blvd 56.61 4.67 3.87 3.92 6.59 Targee Street 43.39 3.38 3.16 3.32 6.06 Veterans Road 28.01 1.92 2.37 1.91 5.00 Zerega Avenue 40.71 2.97 3.28 3.04 4.98
S.2.2 Mode of Travel

viii
Transportation mode information was collected by both the trip generation survey as well as the
questionnaire survey. The questionnaire survey includes transit modes not covered by the trip
generation survey and was performed at the 23rd street Manhattan site where the trip generation
survey was unable to record mode share due to the absence of dedicated on-site parking.
The private automobile was the predominant mode of travel to all Home Depots except the 23rd
Street Manhattan facility where walking and public transit were more heavily used. The two
Queens facilities generated more walk/bike trips and commercial van trips and less private
vehicle trips than the other five facilities (excluding 23rd Street).
S.2.3 Vehicle Occupancy The weekday vehicle occupancy peaked at 1.55 persons per vehicle while the Saturday vehicle
occupancy rate peaked at 1.60 persons per vehicle. Both peaks occurred in the PM hours.
Saturday and Sunday vehicle occupancy rates were very similar.
S.3 Significant Factors in Trip Generation The study identified a 1 mile radius catchment area as the primary study area for each of the
facilities and focused on the following contributing factors to trip generation:
• Demographic/Socio-Economic
• Land Use/Zoning
• Transportation/Accessibility
S.3.1 Demographics/Socio-Economic Variables The demographic analysis shows the average population within the 1 mile radius catchment area
is 115,481 persons with a range from 13,625 at the Jericho Turnpike, Nassau County catchment
area, which is located in a more suburban environment, to 281,228 at the Manhattan site, which
has the highest development density. The economic analysis shows that the average median
household income is $51,780, ranging from $26,646 at the Cropsey Avenue catchment area in
Brooklyn to $98,385 at the Jericho Turnpike catchment area. The average household size is 2.7
persons per household and ranges from 1.59 at the 23rd Street Manhattan catchment area to 3.32
persons per household at the Rockaway Boulevard catchment area in Queens.
S.3.2 Land Use The zoning analysis grouped zoning districts based upon predominant use and development
densities. Residential districts were grouped into three classes (R1-R4, R5-R7, R8-R10),
Commercial districts into two classes (C1-C4, C5-C7) and manufacturing districts were all
grouped together. The analysis shows that the catchment areas of the two Staten Island

ix
facilities, the Nassau County facility and the Rockaway Boulevard facility in Queens are
surrounded by primarily low density residential uses. The Northern Boulevard site in Queens, the
Cropsey Avenue site in Brooklyn, and the Zerega Avenue site in the Bronx have primarily
medium density residential catchment areas. The 23rd Street Manhattan site catchment area is a
mixture of high density residential, commercial and manufacturing uses.
S.3.3 Transportation Accessibility Accessibility to the sites was evaluated based upon direct travel routes and transit provision
(arterials, bus lines and subway stops) in the surrounding catchment areas, taking into account
the proximity of the various transportation facilities to the sites.
S.4 NYC Trip Generation Rates A statistical test of variance was conducted on the trip rates of the eight facilities resulting in the
exclusion of three Home Depot sites. The three facilities that were not included in the NYC trip
rate computation are the 23rd Street facility in Manhattan, the Jericho Turnpike facility in Nassau
County and the Veterans Road facility in Staten Island. An average NYC trip rate was created
using the remaining 5 facilities of which the summary results are shown in table 2 below.

x
Table 2: Summary Results
NYC Home Depot Average Area (sq ft):
136,171 WD AM WD MD WD PM Sat Pk
Vehicle Trip Rate/1,000 sq ft 3.65 3.56 3.46 5.78
Modal Split Walk 10.4% 12.3% 10.6% 11.1%
Bike 0.4% 0.4% 0.3% 0.3%
Auto 73.9% 76.8% 81.2% 82.8%
Taxi 0.9% 1.8% 1.9% 1.7%
Commercial Van 14.4% 8.7% 6.0% 4.1%
Vehicle Trip Temporal Distribution 7.2% 7.1% 7.0% 9.8%
Vehicle Directional Split (ins/outs) 52% / 48% 50% / 50% 51% / 49% 50% / 50%
Vehicular Occupancy Auto 1.24 1.33 1.40 1.52
Taxi 1.50 1.44 1.57 1.58
Commercial Van 1.29 1.36 1.29 1.29
# Truck Trips 15 13 5 6
Truck Trip Rate/1,000 sq ft 0.110 0.095 0.036 0.043
Table 3 below shows the vehicle trip generation rates for NYC derived from the survey as well as
the ITE trip generation rates and the rates used in NYC specific Home Improvement Superstore
EIS’s conducted in 1999.
Table 3: Vehicle Trips /1,000 sq ft
NYC ITE EIS Weekday AM 3.65 2.85 N/A Weekday MD 3.56 N/A 4.70 Weekday PM 3.46 3.05 4.28 Sat Peak 5.78 5.40 6.83

Introduction Study Goals/Objectives The New York City Department of Transportation is responsible for managing traffic on the street
network and addressing traffic impacts that result from significant urban development. The ability
to reasonably predict potential impacts from proposed developments through the use of proper
tools is central to the effective management of traffic.
New York City (NYC), though established and built up over time, finds ways of rejuvenating itself
through imaginative zoning and other incentives that encourage urban revitalization and growth.
Such changes in land-use and urban development form have direct implications for traffic and
congestion on the street network. Recently, the city has seen an explosion in the increase of big
box retail stores such as Home Improvement Superstores (HISS). In order to generate
reasonable predictions and an effective traffic planning response to this phenomenon, the tools
and data used must take into account the unique conditions of New York City.
The current research effort is aimed at determining what traffic will be generated by new large-
scale retail “super stores”, in this case specifically Home Improvement Superstores, instances of
which have been increasing rapidly in the five boroughs. It should be noted that the hours of
operation of these facilities are also changing, with many operating 24 hours a day, thus affecting
the temporal distribution of traffic and the vehicle mix in the traffic stream.
Big box retail stores that have gone into operation recently provide empirical evidence to examine
the assumptions and projections that were made and reflected in Environmental Impact
Statements (EIS). They also provide an opportunity to develop more appropriate and accurate
trip generation rates for the future, if needed.
This study therefore aims to develop appropriate trip generation rates for big box retail facilities in
NYC, taking into consideration that the character of NYC itself varies considerably between
boroughs. Currently the ITE “Trip Generation Handbook” trip rates tend to reflect an average
national condition and therefore can lead to less than reasonable predications when applied to a
dense urban environment. ITE trip rates are often modified based on limited site surveys to more
clearly reflect NYC’s characteristics. The current effort seeks to investigate the operations of
existing facilities in various locations to determine their trip generation rates as well as to identify
some of the significant variables that account for any differences in trip generation rates.
The current research process involves the following basic steps:

2
1. Identify and select appropriate Home Improvement Superstore sites and associated
catchment areas
2. Conduct traffic count and questionnaire surveys
3. Examine significant factors that can affect trip generation
4. Conduct statistical analysis and develop trip generation rates
5. Compare new trip generation rates with ITE and other rates used in the past
Site Selection Initially, a specific group of HISS sites in the city were identified, and then evaluated to determine
which facilities would be subjected to detailed survey and analysis. The following set of objectives
was established to select the facilities to be studied:
a. At least one site should be selected from each of the five boroughs
b. At least one site should be selected from outside of NYC
c. Sites should be selected where EIS’s have been completed in order to examine the
validity and accuracy of the assumptions and trip estimates.
d. Sites should be selected with similar physical characteristics in different neighborhoods
or market area settings.
The process resulted in selecting seven facilities within the five boroughs (one each from
Manhattan, Brooklyn and the Bronx; and two each from Queens and Staten Island). One
facility was selected from Nassau County outside of New York City, thereby providing the
opportunity to determine if NYC conditions are indeed different from the average national
condition represented by the ITE trip generation handbook. Figure 1 maps the locations of all
the considered and selected sites, while Table 1 lists all of these facilities with supporting
information.

Figure 1: Home Improvement Superstore Sites (HISS)

1
Table 4: HISS sites in New York
Location (Area) Facility Address Telephone Date Opened Operating Hours Size
(Sq Ft) Parking Spaces
Que
ens
(8
loca
tions
)
1. East Elmhurst
73-01 25th Avenue, East Elmhurst, NY 11370 (718) 507-9004 12/2001 6AM-10PM M-Sat; 8AM-8PM Sun 101,000 171
2. Jamaica 92-30 168th Street, Jamaica, NY 11433 (718) 558-8640 4/2007 6AM-10PM M-Sat; 8AM-8PM Sun 113,000 225
3. Springfield Gardens 132-30 Merrick Blvd Jamaica, NY 11434 (718) 977-2081 8/16/2001 6AM-10PM M-Sat; 8AM - 7PM Sun 160,000 477
4. College Point 124-04 31st Avenue Flushing, NY 11354 (718) 661-4608 5/3/2001 6AM-9PM M-Thurs; 6AM-10PM Fri-
Sat; 8AM-9PM Sun 128,000 488
5. Flushing 131-35 Avery Avenue Flushing, NY 11354 (718) 358-9600 6/15/2005 6AM-11PM M-Sat; 8AM-9PM Sun 144,000 483
6. Long Island City*
50-10 Northern Blvd Long Island City, NY 11101 (718) 278-9031 1/7/1999 5AM-11PM M-Sat; 8AM - 9PM Sun 155,000 439
7. Glendale 75-09 Woodhaven Blvd Glendale, NY 11385 (718) 830-3323 2/17/2000 6AM-9PM M-Sat; 8AM-9PM Sun 132,000 496
8. Ozone Park*
112-20 Rockaway Blvd Ozone Park, NY 11420 (718) 641-5500 1/1994 6AM-11PM M-Sat; 8AM-8PM Sun 150,384 339
Bro
okly
n
(5 lo
catio
ns)
1. Bedford Stuyvesant 585 Dekalb Avenue, Brooklyn, NY 11205 (718) 230-0833 5/2005 6AM-10PM M-Sat; 8AM-8PM Sun 155,000 225
2. Red Hook 550 Hamilton Ave Brooklyn, NY 11232 (718) 832-8553 3/5/1998 6AM-12AM M-Sat; 8AM-9PM Sun 86,200 450
3. Mill Basin 5700 Avenue U Brooklyn, NY 11234 (718) 692-7296 4/4/2002 6AM-10PM M-Sat; 8AM-8PM Sun 90,000 210
4. Starrett City 579 Gateway Drive Brooklyn, NY 11239 (718) 827-9568 9/26/2002 6AM-10PM M-Sat; 8AM-8PM Sun 67,500 400
5. Coney Island* 2970 Cropsey Avenue Brooklyn, NY 11214 (718) 333-9850 12/20/2001 5AM-12AM M-Sat; 8AM-12AM Sun 148,861 572
Stat
en Is
land
(3
loca
tions
) 1. Staten Island East* 545 Targee Street Staten Island, NY 10304 (718) 818-9334 10/3/2002 6AM- 8PM M-Sun 88,914 363
2. Staten Island 2501 Forest Ave Staten Island, NY 10303 (718) 273-5069 8/14/1997 6AM-10PM M-Sat; 8AM-8PM Sun 125,000 501
3. Staten Island*
2750 Veterans Road Staten Island, NY 10309 (718) 984-4690 1/1/2006 6AM-9PM M-Sat; 8AM-8PM Sun 160,000 480
Bro
nx
(2
loca
tions
)
1. Bronx 1806 E Gunhill Rd Bronx, NY 10469 (718) 862-9800 6/26/1997 6AM-10PM M-Sat; 8AM-8PM Sun 123,000 491
2. Castle Hill* 635 Zerega Avenue Bronx, NY 10473 (718) 518-8811 10/10/2002 5AM-12AM M-Sat; 8AM-12AM Sun 137,698 557
Lon
g Is
land
(2
Loc
atio
ns) 1. Nassau
County 111 Jericho Turnpike, Syosset, NY 11791
(516) 364-4677 1/2001 6AM-10PM M-Sat; 8AM-8PM Sun 93,750 481
2. Nassau County
150 Fulton Avenue, Hempstead, NY 11550 (516) 565-3700 2/2002 6AM-10PM M-Sat; 8AM-8PM Sun 145,000 423
Man
hatta
n
(2
loca
tions
) 1. Midtown 23rd St* 40 West 23rd Street New York, NY 10010 (212) 929-9571 Summer 04 7AM-9PM M-Sat; 8AM-7PM Sun 108,000 0
2. Midtown 59th Street 980 Third Avenue New York, NY 10022 (212) 888-1512 Summer 04 6AM-10PM M-Sat; 8AM-8PM Sun 83,000 0

2
The eight selected facilities are described below.
40 West 23rd Street, Manhattan The 23rd Street facility in Manhattan is approximately 108,000 square feet in size and has no on-site parking facilities directly associated with the site. The facility is located on 23rd Street, which is a principal arterial. It is also near three other principal arterials: 5th Avenue, 6th Avenue, and Broadway. The facility is located in a high density commercial and residential area. An aerial view of the facility is shown below in Figure 2.
Figure 2: Aerial View of 23rd Street Facility
2970 Cropsey Avenue, Brooklyn The Cropsey Avenue facility is approximately 150,000 square feet in size and has 572 parking spaces. An Environmental Impact Statement was prepared for the facility in 1999. It is located directly off an expressway, the Belt Parkway, and is situated on Cropsey Avenue, a principal arterial. The parking lot is shared with a small storage facility which uses approximately 20 parking spaces. An aerial view of the facility is shown below in Figure 3.

3
Figure 3: Aerial View of Cropsey Avenue Facility
111 Jericho Turnpike, Syosset NY The Jericho Turnpike facility in Nassau County is approximately 93,750 square feet in size and has 480 parking spaces. It is located on a major arterial, Jericho Turnpike, just north of the Long Island Expressway. While the facility is located near other major commercial establishments, the parking lot is exclusive for its customers. An aerial view of the facility is shown below in Figure 4.
Figure 4: Aerial View of Jericho Turnpike Facility

4
50 – 10 Northern Boulevard, Queens The Northern Boulevard facility is approximately 155,000 square feet in size and has 440 parking spaces. It is located on a principal arterial, Northern Boulevard, and near two others; Broadway and Steinway Street. The facility is located in a medium density residential area that includes commercial uses such as the Sunnyside mall and some manufacturing uses. An aerial view of the facility is shown below in Figure 5.
Figure 5: Aerial View of Northern Boulevard Facility
112-20 Rockaway Boulevard, Queens The Rockaway Boulevard facility is approximately 150,000 square feet in size and has 340 on-site parking spaces. It is located on a principal arterial, Rockaway Boulevard, and near two others; Linden Boulevard and Lefferts Boulevard. The facility is situated adjacent to the Aqueduct racetrack in a low density residential area with some land zoned and used for commercial uses along the arterials. An aerial view of the facility is shown below in Figure 6.

5
Figure 6: Aerial View of Rockaway Boulevard Facility
545 Targee Street, Staten Island The Targee Street facility is approximately 89,000 square feet in size and has 360 on-site parking spaces. It is located on a principal arterial, Targee Street, and near a major expressway, the Staten Island Expressway. The facility is located in a low density residential area that includes some commercial uses. An aerial view of the facility is shown below in Figure 7.
Figure 7: Aerial View of Targee Street Facility

6
2750 Veterans Road, Staten Island The Veterans Road facility is approximately 160,000 square feet in size and has 480 on-site parking spaces. It is located on a principal arterial, Veterans Road near the Richmond Parkway and West Shore Expressway interchange. The facility is located in a commercial area that contains other retail facilities, but does not share parking area. An aerial view of the facility is shown below in Figure 8.
Figure 8: Aerial View of Veterans Road Facility
625 Zerega Avenue, Bronx The Zerega Avenue facility is approximately 137,700 square feet in size and has 550 on-site parking spaces. It is located near three expressways; The Cross Bronx Expressway, Bruckner Expressway, and the Hutchinson River Parkway. It is situated in a low density residential area that has some manufacturing uses. An aerial view of the facility is shown below in Figure 9.
Figure 9: Aerial View of Zerega Avenue Facility

7
Trip Generation Vehicle Counts To obtain the trip generation information for each facility, detailed surveys were conducted to
collect data on the number of trips to and from the facilities by time of day, vehicle type, and
vehicle occupancy, as well as parking accumulation. The surveys were conducted on two
weekdays and one Saturday for each of the eight facilities. The Cropsey Avenue, Jericho
Turnpike, and Zerega Avenue facilities were also surveyed on a Sunday. The trip generation
survey recorded the following in 15 minute intervals:
a.) Vehicle ins and outs and vehicle classification counts at the site driveways.
b.) Vehicle occupancy
c.) Parking utilization/accumulation (2 hour intervals)
Table 5 below shows the store hours of operation and periods when the surveys were conducted.
Table 5: HISS Store Hours and Survey Periods
HISS Weekday Saturday Sunday
Store Hours Survey Period Store Hours Survey Period Store Hours Survey Period
23rd Street , Mn 7AM - 9PM 7AM - 9PM 7AM – 9PM Noon - 6PM 8AM – 7PM -
Cropsey Ave, Bk 6AM - 10PM 6AM – 10PM 6AM - 10PM 6AM - 10PM 8AM - 7PM 8AM - 8PM Jericho Turnpike, Nassau County 6AM - 10PM 6AM – 10PM 6AM - 10PM 6AM - 10PM 8AM - 7PM 7AM - 7PM
Northern Blvd, Qn 5AM - 11PM 6AM – 10PM 5AM - 11PM Noon - 6PM 8AM – 9PM -
Rockaway Blvd, Qn 6AM - 11PM 6AM – Midnight 6AM - 11PM Noon - 6PM 8AM – 8PM -
Targee Street, SI 6AM - 8PM 6AM - 8PM 6AM – 8PM Noon - 6PM 6AM – 8PM -
Veterans Road, SI 6AM - 9PM 6AM – 10PM 8AM – 8PM Noon - 6PM 8AM – 8PM -
Zerega Ave , Bx 6AM - 10PM 6AM – 10PM 6AM - 10PM 6AM - 10PM 8AM - 7PM 8AM - 8PM
The parking accumulation surveys recorded the number of cars in the parking lot before and after
the survey as well as the total vehicles parked every two hours during the survey period. The
surveys recorded travel mode for walk, bike, and auto as well as vehicle classification (car, taxi,
commercial van or truck). The 23rd street facility does not provide on-site parking, so the
questionnaire survey focused on person trips to and from the facility at the building entrances.
Peak Hours The weekday peak hour was determined for each facility from the traffic survey and is shown in
Table 6 below. The earliest weekday peak hour occurred from 10:30 to 11:30 AM at both

8
facilities in Queens and the Cropsey Avenue facility in Brooklyn. The latest weekday peak hour
was 3:00 PM to 4:00 PM, observed at the 23rd Street facility in Manhattan.
Table 6: Weekday Peak Hour
23rd Street, New York 3:00 - 4:00 PM Cropsey Ave, Kings 10:30 - 11:30 AM Jericho Turnpike, Nassau 12:45 - 1:45 PM Northern Blvd, Queens 10:30 - 11:30 AM Rockaway Blvd, Queens 10:30 - 11:30 AM Targee Street, Staten Island 2:30 - 3:30 PM Veterans Rd West, Staten Island 12:45 - 1:45 PM Zerega Ave, Bronx 1:15 - 2:15 PM
Equally important as the peak hour of the generator is the peak of the background traffic which
was determined from automated traffic recorders (ATR’s). The peak period of the street network
background traffic was derived from ATR’s located near the facilities at Cropsey Avenue and
Zerega Avenue as well as from New York City Bridge counts. The weekday background traffic
peak periods concur essentially with those in the ITE.
Upon reviewing both the background and generator peak hours, it was decided that two hour
peak periods would be used for the analysis. The peak periods for both the trip generator and the
background traffic are shown below in Table 7 along with the ITE peak periods for comparison.
These were derived from a comparative analysis of the peak periods of all facilities, and selecting
the most common peak periods. Figure 10 below displays the weekday AM, MD and PM peak
periods (indicated in pink overlays) in relation to the facilities trip distribution.
Table 7: Peak Periods of the Trip Generator and Background Traffic
Generator NYC ITE Weekday AM 9:00 - 11:00 AM 10:00-12:00 Weekday MD 12:00 - 2:00 PM Weekday PM 5:00 - 7:00 PM 12:00-5:00 Weekday Peak 10:00 - 12:00 PM Saturday Peak 12:45 - 2:45 PM 12:00-3:00 Background Traffic Weekday AM 7:00 - 9:00 AM 7:00-9:00AM Weekday PM 4:00 - 6:00 PM 4:00-6:00PM

9
Figure 10: Facility Trip Distribution and Peak Hours
* 23rd Street Facility (yellow shading) recorded person trips
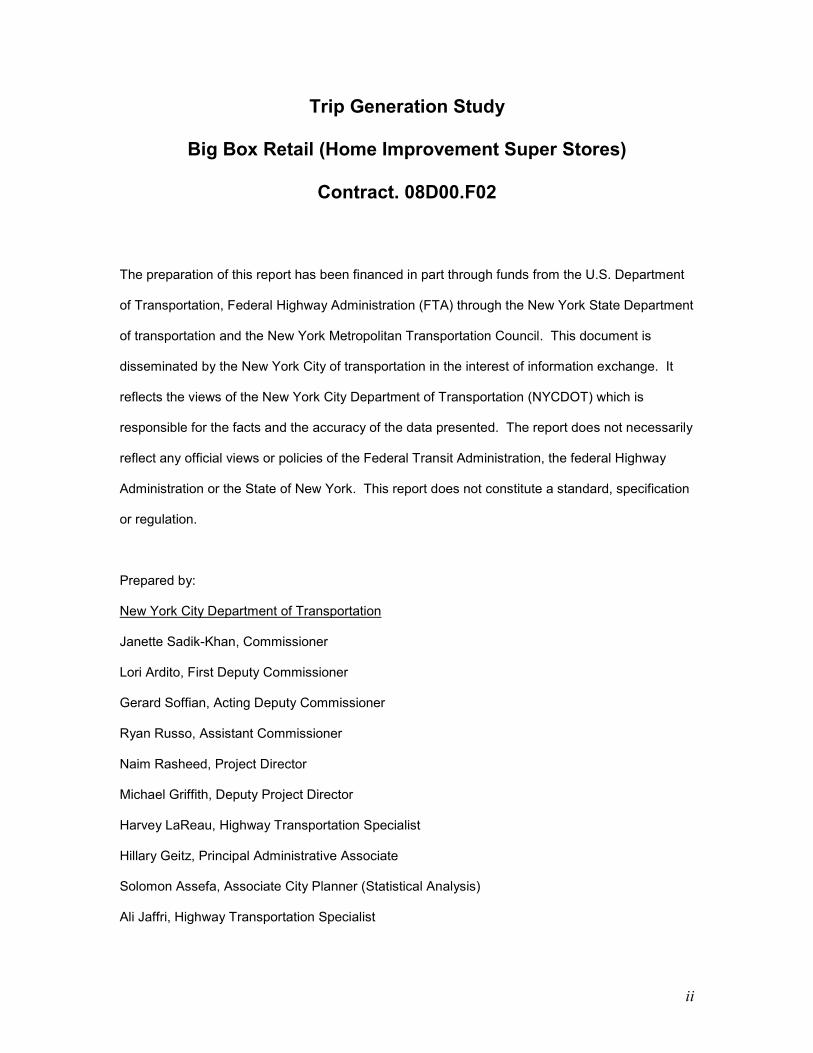
Vehicle Occupancy The traffic count and questionnaire surveys both recorded vehicle occupancy: Figure 11 below
shows graphs of the 8 site average Weekday, Saturday, and Sunday vehicle occupancy. Table 8
below displays the vehicle occupancy for each site. For the purpose of this survey, vehicles
included trucks, commercial vans, taxis, and private automobiles. Note: taxi operators were not
counted as occupants.
Table 8: Daily Vehicle Occupancy
Vehicle Occupancy Weekday Saturday Sunday 23rd Street N/A N/A N/A Cropsey Ave 1.282 1.360 1.528 Jericho Street 1.101 1.146 1.344 Northern Blvd 1.343 1.610 N/A Rockaway Blvd 1.326 1.574 N/A Targee Street 1.148 1.331 N/A Veterans Road 1.552 1.255 N/A Zerega Avenue 1.440 1.609 1.645
10
Figure 11: Average Vehicle Occupancy
As shown in Figure 11, vehicle occupancy varied by weekday and weekend as well as by time of
day. Vehicle occupancy ranged from 1.15 to 1.45 on Weekdays, and from 1.05 to 1.58 on
weekends. Individual facility daily vehicle occupancy rates ranged from 1.10 to 1.55 on the
weekday and from 1.15 to 1.61 on Saturdays.
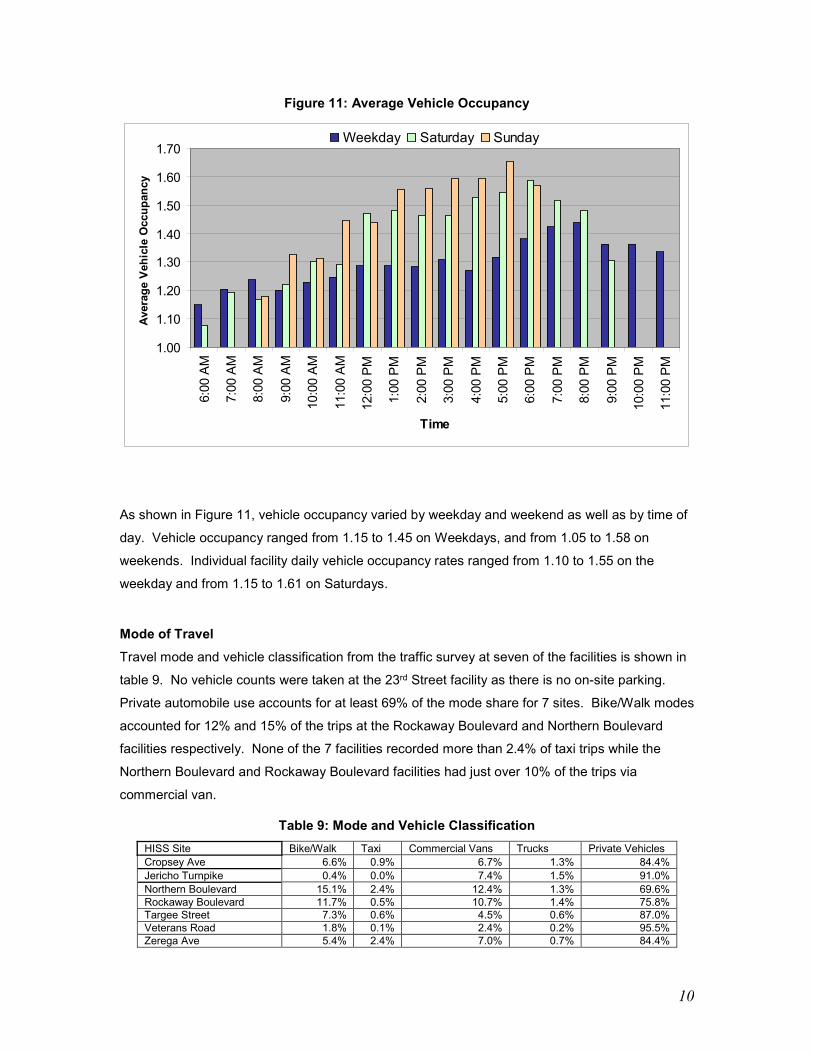
Mode of Travel Travel mode and vehicle classification from the traffic survey at seven of the facilities is shown in
table 9. No vehicle counts were taken at the 23rd Street facility as there is no on-site parking.
Private automobile use accounts for at least 69% of the mode share for 7 sites. Bike/Walk modes
accounted for 12% and 15% of the trips at the Rockaway Boulevard and Northern Boulevard
facilities respectively. None of the 7 facilities recorded more than 2.4% of taxi trips while the
Northern Boulevard and Rockaway Boulevard facilities had just over 10% of the trips via
commercial van.
Table 9: Mode and Vehicle Classification HISS Site Bike/Walk Taxi Commercial Vans Trucks Private Vehicles Cropsey Ave 6.6% 0.9% 6.7% 1.3% 84.4% Jericho Turnpike 0.4% 0.0% 7.4% 1.5% 91.0% Northern Boulevard 15.1% 2.4% 12.4% 1.3% 69.6% Rockaway Boulevard 11.7% 0.5% 10.7% 1.4% 75.8% Targee Street 7.3% 0.6% 4.5% 0.6% 87.0% Veterans Road 1.8% 0.1% 2.4% 0.2% 95.5% Zerega Ave 5.4% 2.4% 7.0% 0.7% 84.4%
1.00
1.10
1.20
1.30
1.40
1.50
1.60
1.70
6:00
AM
7:00
AM
8:00
AM
9:00
AM
10:0
0 AM
11:0
0 AM
12:0
0 PM
1:00
PM
2:00
PM
3:00
PM
4:00
PM
5:00
PM
6:00
PM
7:00
PM
8:00
PM
9:00
PM
10:0
0 PM
11:0
0 PM
Time
Aver
age
Vehi
cle
Occ
upan
cyWeekday Saturday Sunday

11
Parking Accumulation Parking accumulation counts were recorded at 2 hour intervals at 7 facilities as the 23rd Street
facility has no on-site parking. Figure 12 below shows the average parking utilization by time of
day. The average weekday accumulation varies from approximately 8% at the time the store
opens, peaks midday at approximately 42% and is approximately 9% when the store closes. The
weekend accumulation peaks at approximately 57% at 2:00pm.
Figure 12: Average Parking Accumulation
Vehicle Trip Rates Vehicle trip rates are usually expressed as the number of trips per 1000 square feet and derived
by dividing the peak hour vehicle trips by the facility size in square feet multiplied by 1000. Since
the study uses 2 hour peaks, the eight 15-minute interval vehicle trips are averaged and
multiplied by 4 to arrive at a peak hour. Table 10 below displays the peak hour and 24 hour
vehicle trip rates per 1000 square feet for the eight HISS facilities.
0%
10%
20%
30%
40%
50%
60%
Time
Park
ing
Utili
zatio
n
Weekday 8% 22% 34% 42% 42% 36% 29% 19% 9%
Saturday 5% 17% 37% 54% 57% 50% 39% 23% 11%
6:00AM 8:00 AM 10:00 AM 12:00 PM 2:00 PM 4:00 PM 6:00 PM 8:00 PM 10:00PM

12
Table 10: HISS Facility Peak Hour Vehicle Trips per 1000 Square Feet
WD 24 hour AM MD PM Sat Peak 23rd Street 10.62 0.49 0.97 0.95 1.60 Cropsey Ave 44.09 3.17 3.29 3.17 5.51 Jericho Turnpike 52.91 3.99 5.15 3.20 3.08 Northern Boulevard 59.26 4.04 4.20 3.83 5.75 Rockaway Blvd 56.61 4.67 3.87 3.92 6.59 Targee Street 43.39 3.38 3.16 3.32 6.06 Veterans Road 28.01 1.92 2.37 1.91 5.00 Zerega Avenue 40.71 2.97 3.28 3.04 4.98
The Northern Boulevard, Rockaway Boulevard and Jericho Turnpike facilities have the highest
weekday vehicle trip rates. The 23rd Street and Veterans Road facilities have the lowest weekday
vehicle trip rates. The Cropsey Avenue, Northern Boulevard and Rockaway Boulevard facility
have the highest Saturday peak hour vehicle trip rates while the 23rd Street and Jericho Turnpike
facilities have the lowest peak hour Saturday vehicle trip rates. The 23rd Street facility’s low
vehicle trip rates can be largely attributed to the lack of on-site parking and the extensive transit
network in the general area.
Questionnaire Survey In addition to traffic counts, questionnaire surveys (interviews) were conducted to obtain
additional information such as travel time, trip length, trip purpose, trip mode, whether the trip was
a primary or linked trip, and whether the customer was a contractor, homeowner or a tenant.
Questionnaire surveys were conducted at the 23rd Street, Cropsey Avenue, Northern Boulevard,
and Zerega Avenue sites. The survey was conducted for two weekdays and one Saturday. A
Sunday survey was also conducted at the Cropsey Avenue and Zerega Avenue facilities. Table
11 below shows the number of response collected at each facility. The Northern Boulevard
facility had a low response rate. See Appendix D for a sample Questionnaire Survey.
Table 11: Survey Responses Time Period 23rd Street Cropsey Ave Northern Blvd Zerega Ave Weekday 160 221 51 244 Weekend 59 171 14 247
Table 12 provides a summary of the questionnaire survey identifying trip origin, type of customer
and whether the trip is a primary trip. Most trips originated at home as primary trips.
Approximately 15% of the customers were building contractors, 50% home owners and 30%
tenants. The results didn’t vary significantly between weekday and weekend except for a
decrease in work originated trips.

13
Table 12: Trip and User Type
Trip Origin Primary Trip User Type Home Work Other Y N Home Owner Tenant Contractor 4 Site Avg Weekday 70% 26% 4% 85% 15% 54% 28% 18% Weekend 83% 15% 2% 91% 9% 53% 32% 15%
Table 13 below shows the vehicle type/mode share derived from the questionnaire survey. The
Cropsey Avenue and Zerega Avenue questionnaire surveys yielded similar results to the traffic
survey results displayed in Table 6. While the Northern Boulevard results vary from the other
surveyed sites, it can be attributed to the low response rate at this facility. This mode share
information was used to estimate the 23rd Street facility vehicle trips, which is approximately
13.3% of the total person trips generated by the facility. This percentage was used to convert the
person trips to vehicle trips for the 23rd Street facility.
Table 13: Questionnaire Survey - Mode Share
HISS Site Car Bus Subway Taxi Walk Bike Truck/Van 23rd Street 2.9% 11.0% 36.4% 5.8% 38.7% 0.6% 4.6% Cropsey Ave 84.6% 1.4% 0.0% 0.0% 10.9% 0.5% 2.7% Northern Boulevard 23.5% 7.8% 5.9% 5.9% 19.6% 3.9% 33.3% Zerega Ave 86.9% 1.2% 0.0% 0.4% 5.7% 0.4% 4.1% Average 61% 4% 10% 2% 17% 1% 6%
Table 14 displays the average travel time and distance derived from the questionnaire survey for
the four sites. According to these results, the travel time for more than 80% of the trips were 15
minutes or less while the distance travelled for 55% of the trips were more than 2 miles. Travel
time and distance did not vary significantly between the weekday and weekend activities.
Table 14: Trip Time and Distance
Time Distance 5min 10 min 15 min 30 min 45 min 1 hour 1/2 mile 1 mile 2 mile Other 4 Site Avg Weekday 18% 19% 45% 12% 3% 3% 11% 18% 17% 55% Weekend 12% 17% 51% 17% 1% 1% 11% 13% 23% 54%

14
Significant Factors in Trip Generation Having selected the eight sites, an analysis of significant variables in trip generation was
undertaken consistent with the scope of the study. The major factors identified that could
influence trip generation rates are:
• Socio-Economic – Demographics; income and car ownership
• Physical characteristics - Land use/spatial distribution and development densities
• Transportation - Highway access, transit service provision and mode convenience
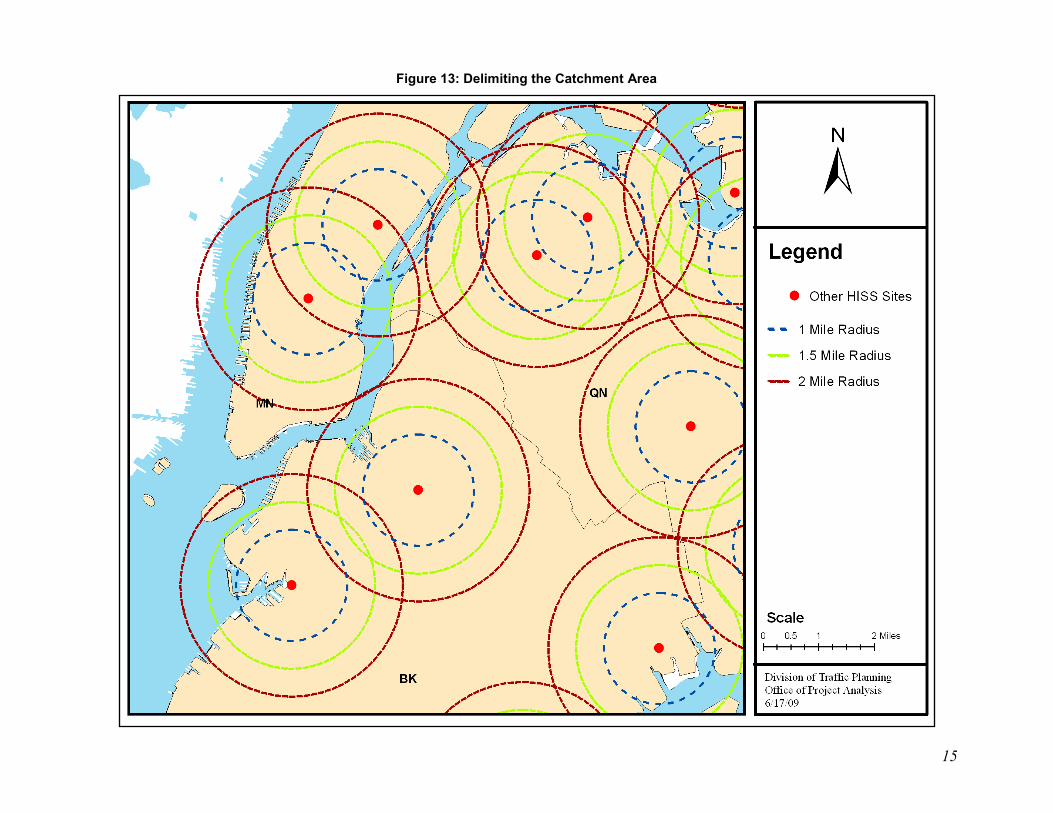
To facilitate the analysis of the possible contributing factors, a market catchment area for each of
the stores was identified. The market area is the area from which the majority of the store’s
customers are drawn. Assuming that customers will travel the shortest distance to shop,
concentric circles were drawn at radii of 1, 1.5 and 2 miles from each facility to help delimit an
appropriate catchment area. The 1 mile radius minimizes overlap of catchment areas, so it was
determined that this would be the size of the primary study area. Figure 13 illustrates the various
radii and catchment areas of multiple HISS sites.
15
Figure 13: Delimiting the Catchment Area

16
Demographics and Socio-Economic Characteristics The demographic and socio-economic characteristics of an area’s population can help to explain
some of the travel characteristics of store patrons. Therefore, characteristics such as income,
household size, and vehicle ownership were examined for each catchment area. Data from the
2000 census were used by focusing on census tracts that fall within the established catchment
areas. Figure 14 shows the Cropsey Avenue facility catchment area and corresponding census
tracts. A similar analysis was done for all the sites, see appendix A.
A summary of the demographic/socio-economic analysis for each of the facilities is shown in
Table 15. It includes population, average household (HH) size, median household income, and
the average number of vehicles per household. The analysis shows that the 23rd Street and
Northern Boulevard facilities’ catchment areas have significantly larger populations than the other
facilities. The 23rd Street facility catchment area has the smallest average household size of 1.59
persons, with a vehicle ownership rate of 0.23 vehicles per household. It also has the second
highest median household income ($61,260) in NYC. In contrast, the Jericho Turnpike facility
catchment area in Nassau County, NY has the smallest population, the second largest average
household size of 2.99 persons, the highest vehicles ownership rate of 2.05 vehicles per
household, and the highest median household income ($98,385). The characteristics of the
population of the Jericho Turnpike facility catchment area are more typical of suburban
communities than the urban characteristics found within New York City.
Table 15: Demographic/Socio-Economic Summary
HISS Sites Demographic Socio – Economic Population Population/
Square Mile HH Size Median HH
Income Vehicles/
HH 23rd Street, Mn 281,228 89,563 1.59 $61,260 0.23 Cropsey Ave, Bk 107,169 34,119 2.52 $26,646 0.61 Jericho Turnpike, Nassau 13,625 4,311 2.99 $98,385 2.05 Northern Boulevard, Qn 215,452 68,615 2.60 $37,860 0.53 Rockaway Boulevard, Qn 132,148 42,085 3.32 $45,466 1.09 Targee Street, SI 69,658 22,184 2.68 $47,433 1.15 Veterans Road, SI 37,011 11,787 2.92 $64,062 1.67 Zerega Ave, Bx 67,559 21,516 2.82 $33,134 0.75
HH - Household

17
Figure 14: Catchment Area and Corresponding Census Tracts – Cropsey Ave

18
Figures 15, 16, 17 and 18 below display the population density, household size, median
household income and vehicles per household respectively at the 8 HISS facilities and the
corresponding counties in which they reside. The yellow shaded region represents one standard
deviation above and below the 8 facility average. Figure 15 show that the 23rd Street and
Northern Boulevard facilities have a population density above the standard deviation while the
Jericho Turnpike facility has a population density below the one standard deviation area.
Figure 15: Population Density

19
Figure 16: Household Size
Figure 16 above shows that the 23rd Street facility’s catchment area population has a household
size lower than the standard deviation while the northern Boulevard facility catchment area has a
household size higher than one standard deviation from the average. Figure 17 below show that
the Jericho Turnpike catchment area population has a median household income well above
while the Cropsey Avenue catchment area population median household income is just below
one standard deviation from the 8 site average. Figure 18 shows that the Jericho Turnpike
catchment area and Veterans Road facility catchment area population have a vehicle ownership
rate higher than 1 standard deviation from the 8 site average while the 23rd Street catchment area
population has a car ownership rate lower than one standard deviation from the 8 site average.

20
Figure 17: Median Household Income
Figure 18: Vehicles per Household

21
Land Use There is a direct relationship between transportation/traffic and land use. Also different land uses
and development densities produce different travel and trip characteristics. Therefore, an
analysis of the existing zoning and land use in the catchment areas was conducted in order to
better understand local travel behaviors. Land uses were identified using city zoning maps and
MAPPluto GIS files that identify the particular land use of individual lots as well as general zoning
classifications. Due to the presence of many commercial and residential sub-districts spread
throughout the catchment areas, some form of grouping was needed for ease of analysis. The
following zoning categories and groups were developed and used in this analysis based upon the
distribution of zoning districts/land use and development densities within the catchment areas:
R1-R4, R5-R7, R8-R10, C1-C4, C5-C8 and M1-M3.
The R1-R4 districts are low density residential areas that allow 1-2 family detached and attached
housing. The R5-R7 districts allow multi-family medium density walkup residential buildings, and
R8-R10 districts allow high density elevator residential buildings. C1-C4 districts allow low to
medium density commercial uses. C5 and C6 districts allow for high density commercial uses,
R7 districts allow amusement parks, and R8 districts allow for automotive uses such as
showrooms and repair shops. Figure 19 below shows the Cropsey Avenue catchment area
zoning analysis using the groups described above.
Table 16 below shows the percentages of land by zoning district within the catchment areas. The
Jericho Turnpike catchment area, which includes the Jericho Turnpike commercial corridor and 1-
2 family detached housing, was estimated from data compiled from longislandindex.com because
the information was not available in the MapPluto GIS files.

22
Figure 19: Cropsey Avenue Zoning Analysis

23
Table 16: Percentage Zoning Distribution
HISS Sites Zoning Categories/Groups Designation R1-R4 R5-R7 R8-R10 C1-C4 C5-C7 M1-M3
23rd Street, Mn 0% 20% 15% 10% 35% 20% High Density
Cropsey Ave Bk 5% 50% 0% 15% 15% 15% Medium Density
Jericho TPK, Nassau 80% 0% 0% 10% 0% 10% Low Density
Northern Blvd, Qn 10% 50% 0% 5% 2% 33% Medium Density
Rockaway Blvd, Qn 60% 15% 0% 10% 15% 0% Medium Density
Targee Street, SI 82% 3% 0% 7% 3% 5% Low Density
Veterans Road, SI 60% 0% 0% 0% 0% 40% Low Density
Zerega Ave, Bx 30% 40% 0% 7% 3% 20% Medium Density
The analysis shows that the Targee Street, Jericho Turnpike and Veterans Road catchment
areas are zoned predominately for low density residential development, with 60% or more of the
land designated to that use. The Veterans Road and Northern Boulevard catchment areas have
the highest percentage of land zoned for manufacturing of the studied catchment areas: 40% and
33% respectively. The Cropsey Avenue, Zerega Avenue and Northern Boulevard catchment
areas each designate more than 40% of land to medium density residential uses. The Cropsey
Avenue, 23rd Street, and Rockaway Boulevard catchment areas have more than 25% of the land
area zoned for commercial uses. The 23rd street catchment area is zoned for med-high density
residential, commercial, and manufacturing uses, and accommodates the largest population, with
281,220 residents. The Northern Boulevard catchment area, with 50% of land devoted to
medium density residential development has the second largest population, with 215,652
residents. If development density and population concentration are the key determinants in trip
making, then the Cropsey Avenue HD, Northern Boulevard HD and Zerega Avenue facility should
generate more trips than the other studied catchment areas. However, accessibility, car
ownership, and vehicle occupancy are also significant factors to consider.
Transportation /Accessibility Location and accessibility have always been essential to the success of any commercial retail
activity. The extent to which each studied facility has direct access by various transportation
modes was identified and quantified in the following manner:

24
Roadway Access
a.) Proximity of expressway to the site, i.e., within 1 mile of the facility
b.) Presence of principal arterials within 1 mile of the facility
c.) Number of Collectors within 1 mile of the facility.
d.) Distance and number of signalized intersections of shortest route from facility to nearest
expressway.
e.) Average travel time from catchment area midpoint (1/2 mile radius) to facility.
f.) Number of on-site parking spaces
Transit Access
a.) Number of surface transit (bus routes) lines running adjacent and within 1 mile of the
facility.
b.) Number of subway lines and stations within 1 mile of the facility
c.) Distance of closest subway station
The quantification of the roadway and transit access factors helped to identify which sites are
either not very accessible, are accessible or are very accessible. Figure 20 below shows the
Cropsey Avenue roadway accessibility map. Similar maps for each facility can be found in
Appendix B. As seen in figure 20, the Cropsey Avenue facility has direct access from an
expressway and a principal arterial that runs through the center of the catchment area. Also
there are two principal arterials within ½ mile of the facility, thus making the site very accessible
by automobiles. It also has a bus route within 1000 feet of the site.

25
Figure 20: Cropsey Avenue Roadway Access

26
The eight facilities and their corresponding roadway and transit access factors, which assess the
degree of accessibility of the facility, are quantified in tables 17 and 18. Cropsey Avenue,
Veterans Road and Zerega Avenue were deemed highly accessible by automobile due to the
number and proximity of major expressways in the area. The 23rd Street site was rated not very
accessible by automobile due to the proximity of expressways and the lack of on-site parking.
The 23rd Street facility and the Northern Boulevard facility are very accessible via transit with
multiple subway lines and bus routes near or adjacent to the site. Conversely, the Jericho
Turnpike, Veterans Road and Zerega Avenue facilities are not very accessible by transit with no
or few subways and limited bus service in the area.
Table 17: Roadway Accessibility
Facilities # Ex
pres
sway
s
(1 m
ile)
# A
rter
ials
(1
mile
)
# C
olle
ctor
s
(1 m
ile)
Shor
test
Rou
te to
N
eare
st
Expr
essw
ay
# Si
gnal
ized
In
ters
ectio
ns
Alo
ng R
oute
Ave
rage
Tim
e Tr
avel
ed (w
ithin
ca
tchm
ent a
rea)
# Pa
rkin
g Sp
aces
Roadway Accessibility 23rd Street 2 14 2 5,400' 7 1:42 0 not very accessible Cropsey Street 1 1 3 800' 2 2:05 572 very accessible Jericho Turnpike 2 1 5 5,000' 6 2:08 480 accessible Northern Blvd 1 4 6 4,000' 8 2:07 440 accessible Rockaway Blvd 3 3 4 6,500' 12 1:54 340 accessible Targee Street 1 4 2 2,500' 5 2:58 360 accessible Veterans Rd 2 3 3 900' 0 3:00 480 very accessible Zerega Ave 3 3 2 2,800' 3 2:59 550 very accessible
Table 18: Transit Accessibility
Facilities # Su
bway
Lin
es
(1 m
ile)
# Su
bway
Sto
ps
(1
mile
)
Dis
tanc
e to
N
eare
st S
ubw
ay
Stop
# B
us L
ines
(1
mile
)
# A
dj. B
us L
ines
Adj
. Bus
Hea
dway
(P
eak
Perio
d)
Transit Accessibility 23rd Street 15 25 500' 89 7 53 Very Accessible Cropsey Street 4 7 2,000' 12 3 26 Accessible Jericho Turnpike 0 0 N/A 1 0 0 Not Accessible Northern Blvd 8 12 1,000' 26 5 48 Very accessible Rockaway Blvd 1 4 3,000' 9 2 28 Accessible Targee Street 1 2 4,000' 36 3 26 Accessible Veterans Rd 1 2 4,000' 3 0 0 Not Accessible Zerega Ave 0 0 5,000' 13 0 0 Not accessible

27
Evaluation of Significant Factors in Trip Generation The proceeding evaluation of the significant factors: demographic/socio-economic, land use and
accessibility helped to identify those facilities that are similar or dissimilar among the 8 facilities.
In comparing the significant factors of each facility a statistical analysis was applied and those
values that fell within one standard deviation were considered average while those falling above
or below the standard deviation were considered as outliers. One standard deviation was also
used among the AM, MD, PM and Saturday trip rates of the eight facilities to identify unusually
high and low rates within the set. Having grouped the factors, trip generation rates, demographic
factors, land use and accessibility into high (h), medium (m) and low (l) categories, a matrix was
used to evaluate the sites. For example, in the land use and accessibility analysis, medium
density and medium accessibility was used to represent the norm while high and low density and
accessibility were seen as different from the norm. Table 19 shows the various sites with the trip
rates and other factors expressed as high, medium or low. The medium ratings were then tallied
and the facilities were ordered by the number of medium ratings. Evaluating the facilities in this
manner reveals 23rd Street and Jericho Turnpike have many characteristics that differ significantly
from the other 6 facilities.
Table 19: Secondary Survey Outliers
Locations Vehicle Trip Rates Demographics Land Use
Access
AM
MD
PM
Sat
Pop
Den
sity
HH
Inco
me
Vehi
cles
/ H
H
HH
Siz
e
Vehi
cle
Tran
sit
# M
ediu
m
Targee Street M M M M M M M M L M M 10 Zerega Ave M M M M M M M M M H L 9
High M M M M H M M M M M H 9 Cropsey Ave M M M M M L M M M H M 9
Rockaway Blvd H M H H M M M H M M M 7 Veterans Road M M L M M M H M L H L 6
Jericho Tpk M H M L L H H H L M L 3 23rd Street L L L L H M L L H L H 1
28
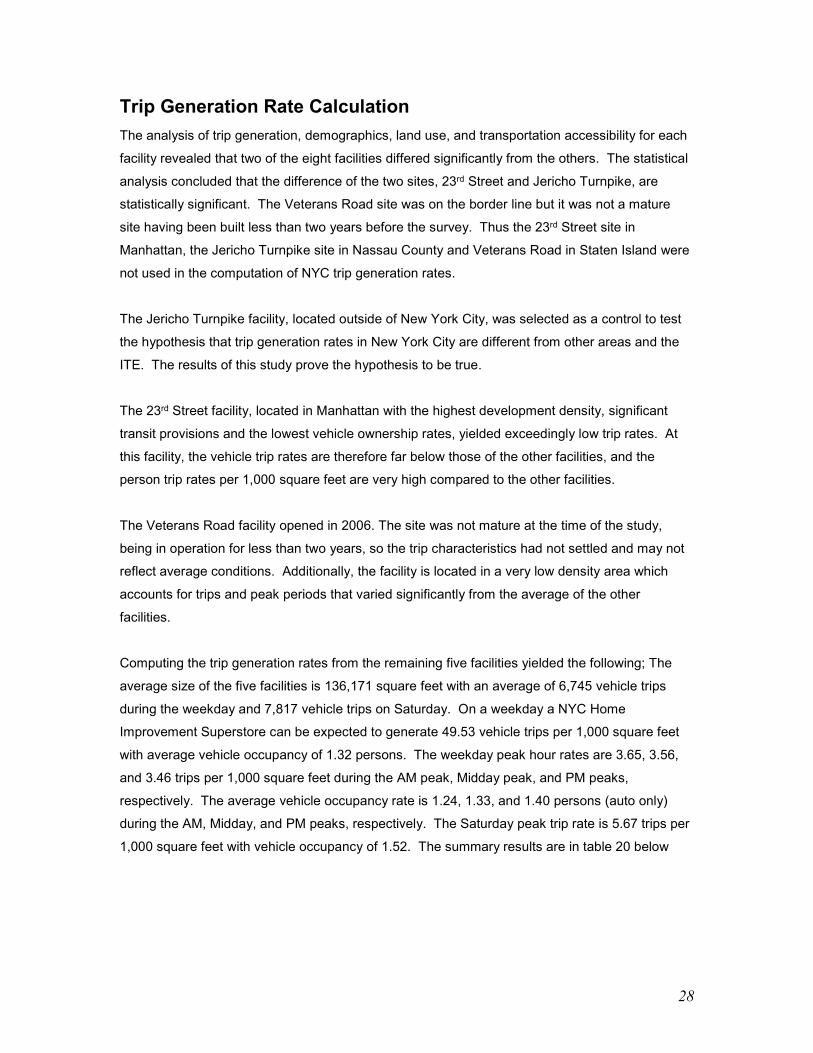
Trip Generation Rate Calculation The analysis of trip generation, demographics, land use, and transportation accessibility for each
facility revealed that two of the eight facilities differed significantly from the others. The statistical
analysis concluded that the difference of the two sites, 23rd Street and Jericho Turnpike, are
statistically significant. The Veterans Road site was on the border line but it was not a mature
site having been built less than two years before the survey. Thus the 23rd Street site in
Manhattan, the Jericho Turnpike site in Nassau County and Veterans Road in Staten Island were
not used in the computation of NYC trip generation rates.
The Jericho Turnpike facility, located outside of New York City, was selected as a control to test
the hypothesis that trip generation rates in New York City are different from other areas and the
ITE. The results of this study prove the hypothesis to be true.
The 23rd Street facility, located in Manhattan with the highest development density, significant
transit provisions and the lowest vehicle ownership rates, yielded exceedingly low trip rates. At
this facility, the vehicle trip rates are therefore far below those of the other facilities, and the
person trip rates per 1,000 square feet are very high compared to the other facilities.
The Veterans Road facility opened in 2006. The site was not mature at the time of the study,
being in operation for less than two years, so the trip characteristics had not settled and may not
reflect average conditions. Additionally, the facility is located in a very low density area which
accounts for trips and peak periods that varied significantly from the average of the other
facilities.
Computing the trip generation rates from the remaining five facilities yielded the following; The
average size of the five facilities is 136,171 square feet with an average of 6,745 vehicle trips
during the weekday and 7,817 vehicle trips on Saturday. On a weekday a NYC Home
Improvement Superstore can be expected to generate 49.53 vehicle trips per 1,000 square feet
with average vehicle occupancy of 1.32 persons. The weekday peak hour rates are 3.65, 3.56,
and 3.46 trips per 1,000 square feet during the AM peak, Midday peak, and PM peaks,
respectively. The average vehicle occupancy rate is 1.24, 1.33, and 1.40 persons (auto only)
during the AM, Midday, and PM peaks, respectively. The Saturday peak trip rate is 5.67 trips per
1,000 square feet with vehicle occupancy of 1.52. The summary results are in table 20 below

29
Table 20: Summary Trip Generation
NYC HISS Average Size: 136,171 sq ft WD AM WD MD WD PM Sat Pk
Vehicle Trips/1,000 sq ft 3.65 3.56 3.46 5.78
Mode Split Walk 10.4% 12.3% 10.6% 11.1%
Bike 0.4% 0.4% 0.3% 0.3%
Auto 73.9% 76.8% 81.2% 82.8%
Taxi 0.9% 1.8% 1.9% 1.7%
Commercial Van 14.4% 8.7% 6.0% 4.1%
Temporal Distribution 7.2% 7.1% 7.0% 9.8%
Directional Distribution (ins/outs) 52% / 48% 50% / 50% 51% / 49% 50% / 50%
Vehicular Occupancy Auto 1.24 1.33 1.40 1.52
Taxi 1.50 1.44 1.57 1.58
Commercial Van 1.29 1.36 1.29 1.29
# Truck Trips 15 13 5 6
Truck Trips/1,000 sq ft 0.110 0.095 0.036 0.043 * WD - Weekday
Comparison of Trip Rates Table 21 below shows the peak period trip generation rates for NYC (study results), the ITE and
the rates used in two EIS’s. The EIS’s were conducted for the Cropsey Avenue facility
development in Brooklyn (1999) and the Zerega Avenue facility in the Bronx (2000).
Table 21: NYC, ITE and EIS Vehicle Trips per 1,000 Square Feet
Peak Period NYC ITE EIS Weekday AM 3.65 2.85 N/A Weekday MD 3.56 N/A 4.70 Weekday PM 3.46 3.05 4.28 Sat Peak 5.78 5.40 6.83
The study concludes that the trip generation rates for Home Improvement Superstores in NYC
are higher than the ITE rates for each peak period. However, the rates used in the Environmental
Impact Statements (EIS) are higher for each peak period. Figure 21 below shows the estimated
trips resulting from trip rates used in this study (NYC), the ITE and the EIS that was done at the
Cropsey Avenue facility in comparison to the trips that were observed at Cropsey Avenue during
this study’s vehicle survey. Figure 22 shows the same information at the Zerage Avenue facility.

30
Figure 21: Cropsey Avenue Observed and Estimated Vehicle Trips
Figure 22: Zerega Avenue Observed and Estimated Vehicle Trips
0
300
600
900
1200Ve
hicl
e Tr
ips
NYC 624 609 592 988ITE 487 522 923EIS (1998) 804 732 1168Cropsey Ave. 472 490 472 750
Weekday AM Weekday MD Weekday PM Sat Peak
0
200
400
600
800
1000
Vehi
cle
Trip
s
NYC 503 490 476 796
ITE 392 420 744
EIS (1998) 647 589 940
Zerega Ave. 409 452 419 686
Weekday AM Weekday MD Weekday PM Sat Peak

31
The following explains the statistical analysis employed in developing the trip generation rates.
Statistical Test:
A one way Analysis of Variance (ANOVA) was performed to test the equality of the Average trip
rates derived from the field survey data for each of the eight buildings studied. A one way
Analysis of Variance is a way to test the equality of three or more means at one time using their
respective variances. The tests were conducted for AM, Midday, and PM peak periods of
vehicular trip generation.
Assumptions:
The trip rates were calculated using the vehicular trips generated by each building surveyed as a
function of their respective gross square feet. The population from which the samples (trip rates)
were obtained was assumed to be approximately normally distributed.
Hypothesis:
The null hypothesis (H0) is that all average trip rates calculated for each building are equal. The
alternative hypothesis (Ha) is that at least one Average trip rate (mean) is different.
Of all the information presented in the ANOVA table, our major interest is focused on the value
located in the “Significance (Sig)” column. If the number (or numbers) found in this column is
(are) less than the critical alpha value (α ) set for this study which is usually set at 0.05, then the
effect is said to be significant. Any value greater than this value, will result in a non significant
effects. If the effects are found to be non significant, then the differences between the means are
not significant enough to say that the mean trip rates are different.
When the effects are significant, or the decision from the ANOVA is to reject the null hypothesis,
the mean trip rates that are identified to be significantly different must be examined in order to
figure out where the differences lie, and what accounts for the difference and not just that there is
difference. These procedures to be applied are called “post-hoc tests”. If the sample sizes are

32
the same for each building, the Tukey Test can be used to analyze pairs of means to see if there
is a difference or similarities in the average trip rates. After performing multiple comparison, a set
of groups that have means which are not significantly different from one another are isolated.
Those that are significantly different can further be examined to determine possible factors that
account for the variations.
Results of ANOVA:
The results of the ANOVA for the AM, Midday, and PM peak periods are presented in the
Appendix C. The tables contain columns labeled the Sum of Squares, DF – for degrees of
freedom, mean square, F – or F-ratio, and sig., or sig. of F. The only columns that are critical for
interpretation are the first and the last. The others are used mainly for intermediate
computational purposes. For all peak periods, the significance levels show a value of 0.000. This
value is lower than the critical alpha value (α) set for this study which is 0.05. This indicates that
for each peak period the means are significantly different and we decide that the effects are real.
They did not occur due to chance alone. Therefore, we reject the null hypothesis that all average
trip rates calculated for each building are equal.
Levene's test of homogeneity of variance is computed by SPSS to test the ANOVA
assumption that each group (category) of the independent) (s) has the same variance. If the
Levene statistic is significant at the .05 level or better, then we reject the null hypothesis that the
groups have equal variances.
Result of the Levene’s Test: Because the Levene statistic is significant at the .05 level for the
trip rates derived for each building, we conclude that the eight buildings trip rates are not
homogenous in variances, negating an assumption of ANOVA that each building trip rates has
the same variance.

33
Note, however, that failure to satisfy the assumption of homogeneity of variances is not fatal to
ANOVA, because it is relatively robust, particularly when groups are of equal sample size. For the
eight building we analyzed, the trip rate sample size was the same.
Results of post-hoc tests: The Tukey Test was performed to compare pairs of average trip
rates (means) to see if there is a difference or similarities in the average trip rates. If we look in
the "Mean Difference" column, in the Post Hoc Tests (Appendix) we will note that some of the
differences have asterisks, to indicate which are significant at the .05 level or better. For instance,
the first such coefficient is in the am peak period, -0.2038, indicating that mean trip rates is
significantly different between the "Cropsey" and the "Jericho" buildings. Table 22below show the
buildings that do not have significant difference in their mean trip rates.

34
Table 22: Trip Rate Comparisons
AM Peak Period Buildings Buildings Significance alpha = .05 1 Cropsey Targee 0.991 2 Jericho Northern Boulevard 0.255 3 23 Street - 4 Northern Boulevard Jericho 0.255 5 Rockaway Northern Boulevard 0.483 6 Targee Cropsey, Zerega 0.991; 0.592 7 Veterans - 8 Zerega Cropsey; Targee 0.972; 0.592
Midday Peak Period Buildings Buildings Significance alpha = .05
1 Cropsey Targee; Zerega 0.984, 1.0 2 Jericho Northern Boulevard 0.064 3 23 Street Veterans 0.240 4 Northern Boulevard Jericho 0.064 5 Rockaway - 0.483 6 Targee Cropsey, Zerega 0.991; 0.0.991 7 Veterans 23 Street 0.240 8 Zerega Cropsey; Targee 1.0; 0.991
PM Peak Period
Buildings Buildings Significance alpha = .05 1 Cropsey Jericho, Targee, Zerega 1.0; 0.996; .997 2 Jericho Cropsey, Targee; Zerega 1.0; 0; 0.999;0.991 3 23 Street Veterans 1.0 4 Northern Boulevard Rockaway 0..998 5 Rockaway Northern Boulevard 0.998 6 Targee Cropsey, Jericho; Zerega 0.996; 0.999; 0.843 7 Veterans 23 street 1.0 8 Zerega Cropsey; Jericho; Targee 0.997; 0.991; 0.843

35
Figure 23: Data Plot and Equation - AM Peak

36
Figure 24: Data Plot and Equation - MD Peak

37
Figure 25: Data Plot and Equation - PM Peak

38
Figure 26: Data Plot and Equation - WD Peak

39
Figure 27: Data Plot and Equation - AM Adj.

40
Figure 28: Data Plot and Equation - PM Adj.

41
Appendices

42
A. Demographic/Socio-Economic Data
The following tables provide census tract based demographic information, including population,
households, number of vehicles available and the median household income in 1999, for the
census tracts that make up the each of the 8 HISS’s catchment areas.
Manhattan, 23rd Street Catchment Area Census Tracts
Population Households Vehicles Available
Median HH Income 1999
Manhattan 1,537,195 738644 195401 $ 47,030
Census Tract 34 New York County 6,561 3,772 549 $ 37,371
Census Tract 38 New York County 9,162 5,351 674 $ 40,886
Census Tract 40 New York County 8,690 4,560 557 $ 51,413
Census Tract 42 New York County 3,898 1,697 362 $ 63,258
Census Tract 44.01 New York County 15,112 8,564 2880 $ 66,154
Census Tract 48 New York County 6,402 3,869 949 $ 62,229
Census Tract 50 New York County 5,695 3,625 1150 $ 71,734
Census Tract 52 New York County 3,741 1,706 429 $ 82,882
Census Tract 54 New York County 3,955 2,440 582 $ 81,696
Census Tract 55.01 New York County 4,907 2,480 801 $ 77,877
Census Tract 55.02 New York County 2,174 1,238 302 $ 83,497
Census Tract 56 New York County 2,590 1,522 421 $ 85,399
Census Tract 57 New York County 2,595 1,519 489 $ 97,765
Census Tract 58 New York County 634 381 74 $ 68,523
Census Tract 59 New York County 5,581 3,123 1071 $ 72,480
Census Tract 60 New York County 3,989 2,379 1170 $ 76,573
Census Tract 61 New York County 5,101 2,445 619 $ 86,597
Census Tract 62 New York County 2,068 288 84 $ 52,656
Census Tract 63 New York County 6,265 4,069 1046 $ 77,355
Census Tract 64 New York County 7,334 4,687 1346 $ 63,678
Census Tract 65 New York County 6,690 3,553 611 $ 56,625
Census Tract 66 New York County 11,841 6,696 1373 $ 44,914
Census Tract 68 New York County 6,753 4,367 759 $ 52,442
Census Tract 70 New York County 7,763 4,866 1199 $ 67,850
Census Tract 71 New York County 5,620 3,631 874 $ 75,502
Census Tract 72 New York County 8,111 4,922 966 $ 75,097
Census Tract 73 New York County 6,699 4,548 861 $ 58,202
Census Tract 74 New York County 3,712 2,138 377 $ 76,804
Census Tract 76 New York County 2,445 1,558 217 $ 41,276
Census Tract 77 New York County 6,146 4,124 1065 $ 68,133
Census Tract 78 New York County 7,471 4,795 1012 $ 70,174
Census Tract 80 New York County 5,392 3,482 702 $ 68,868
Census Tract 81 New York County 7,359 4,711 1130 $ 61,525

43
Census Tract 82 New York County 2,647 1,931 469 $ 62,136
Census Tract 83 New York County 3,490 1,738 217 $ 28,700
Census Tract 84 New York County 1,145 626 132 $ 70,694
Census Tract 87 New York County 4,626 3,076 593 $ 56,939
Census Tract 89 New York County 5,320 3,085 751 $ 55,198
Census Tract 91 New York County 4,553 2,927 511 $ 58,381
Census Tract 93 New York County 8,714 5,262 1418 $ 51,710
Census Tract 95 New York County 2,723 828 117 $ 60,993
Census Tract 96 New York County 168 n/a n/a $ 60,083
Census Tract 97 New York County 4,852 2,656 495 $ 32,350
Census Tract 99 New York County 1,151 370 161 $ 60,476
Census Tract 101 New York County 247 n/a n/a $ 66,786
Census Tract 103 New York County 1,501 969 163 $ 61,007
Census Tract 109 New York County 159 n/a n/a $ 71,641
Census Tract 111 New York County 2,987 1,519 385 $ 41,940
Census Tract 113 New York County 288 n/a n/a $ 47,813
Census Tract 115 New York County 1,403 534 80 $ 44,519
Census Tract 119 New York County 1,424 1,070 21 $ 12,173
Brooklyn, Cropsey Avenue catchment Area Census Tracts
Population Households Vehicles Available Median HH Income 1999 Kings County 2,465,326 880,727 498,736 32,135 Census Tract 294, Kings County 2,351 606 438 40,227 Census Tract 298, Kings County 3,355 1,276 1,025 32,385 Census Tract 300, Kings County 3,576 1,304 968 37,750 Census Tract 302, Kings County 3,711 1,431 1,212 39,881 Census Tract 304, Kings County 3,966 1,591 1,105 35,724 Census Tract 306, Kings County 1,918 690 693 35,515 Census Tract 308, Kings County 1,691 697 552 32,670 Census Tract 314, Kings County 4,501 1,948 1,755 32,083 Census Tract 320, Kings County 70 24 n/a 55,781 Census Tract 326, Kings County 7,247 2,325 702 12,041 Census Tract 328, Kings County 3,304 1,006 597 24,750 Census Tract 330, Kings County 5,288 1,752 984 20,276 Census Tract 336, Kings County 5,159 1,902 1,644 33,359 Census Tract 340, Kings County 2,511 654 114 16,028 Census Tract 342, Kings County 7,462 2,825 554 10,069 Census Tract 348.01, Kings County 1,064 385 223 27,448 Census Tract 348.02, Kings County 907 268 69 16,250 Census Tract 350, Kings County 3,579 1,567 896 25,938 Census Tract 352, Kings County 1,267 460 144 7,863 Census Tract 354, Kings County 5,622 2,875 1,789 28,678 Census Tract 356, Kings County 8,164 4,308 2,377 30,493 Census Tract 374, Kings County 9,211 4,112 2,707 37,924 Census Tract 382, Kings County 6,161 1,968 863 15,601 Census Tract 386, Kings County 3,377 1,203 929 26,129

44
Census Tract 388, Kings County 3,804 1,505 1,231 37,571 Census Tract 398, Kings County 2,391 830 648 31,078 Census Tract 400, Kings County 2,948 1,112 724 30,559 Census Tract 402, Kings County 2,564 910 575 39,960
Nassau County, Jericho Turnpike Catchment Area Census Tracts
Population Households Vehicles Available
Median HH Income in 1999
Block Group 3, Census Tract 5177.01, Nassau County, New York
3,691 1,120
2,678 192,840
Block Group 3, Census Tract 5183, Nassau County, New York
644 239
381 81,030
Block Group 4, Census Tract 5183, Nassau County, New York
1,607 549
1,077 85,308
Block Group 3, Census Tract 5184, Nassau County, New York
2,271 743
1,510 102,009
Block Group 1, Census Tract 5187, Nassau County, New York
1,100 362
783 97,375
Block Group 2, Census Tract 5187, Nassau County, New York
748 272
537 82,435
Block Group 3, Census Tract 5187, Nassau County, New York
802 280
547 90,380
Block Group 4, Census Tract 5187, Nassau County, New York
547 189
351 103,621
Block Group 5, Census Tract 5187, Nassau County, New York
802 301
495 78,285
Block Group 6, Census Tract 5187, Nassau County, New York
698 258
480 62,100
Block Group 7, Census Tract 5187, Nassau County, New York
715 247
510 72,625 Queens, Northern Boulevard Catchment Area Census Tracts
Geography Population Households Aggregate Vehicles Median HH
Income 1999 Census Tract 31, Queens County 1736 578 277 33819 Census Tract 51, Queens County 2526 815 416 36020 Census Tract 53, Queens County 5966 2502 1238 38240 Census Tract 55, Queens County 1216 396 206 33611 Census Tract 57, Queens County 4904 1884 746 35290 Census Tract 59, Queens County 4779 1966 1174 41520 Census Tract 61, Queens County 6749 2955 1099 31010 Census Tract 63, Queens County 7029 2786 1171 32730 Census Tract 65, Queens County 8790 3694 1994 37169 Census Tract 71, Queens County 4572 1794 814 35909 Census Tract 73, Queens County 4881 2200 958 42019 Census Tract 75, Queens County 4518 2212 1109 30983 Census Tract 141, Queens County 1970 772 490 30542 Census Tract 143, Queens County 4509 1781 764 34515 Census Tract 145, Queens County 2282 945 675 37813 Census Tract 147, Queens County 3268 1401 887 44125 Census Tract 149, Queens County 3133 1113 609 44630 Census Tract 151, Queens County 3148 1258 750 39788 Census Tract 153, Queens County 2622 1057 495 40665 Census Tract 155, Queens County 2675 1000 530 39864 Census Tract 157, Queens County 1635 643 244 30903 Census Tract 159, Queens County 4754 1998 946 33936 Census Tract 161, Queens County 2908 903 505 45383 Census Tract 163, Queens County 4546 1678 701 25102

45
Census Tract 169, Queens County 5579 2411 1366 43205 Census Tract 171, Queens County 21 0 Census Tract 179, Queens County 1135 435 194 29250 Census Tract 181, Queens County 8915 3745 1432 34932 Census Tract 183, Queens County 6766 2837 1650 42299 Census Tract 185, Queens County 7729 3224 1480 38482 Census Tract 229, Queens County 0 0 Census Tract 235, Queens County 8426 2556 1201 33280 Census Tract 245, Queens County 4675 2057 1389 41395 Census Tract 247, Queens County 1502 521 338 44000 Census Tract 249, Queens County 5095 1999 1074 36526 Census Tract 251, Queens County 5501 2150 1153 38143 Census Tract 253, Queens County 7835 3074 1208 33682 Census Tract 255, Queens County 1849 725 556 47143 Census Tract 257, Queens County 1504 533 523 34375 Census Tract 259, Queens County 3365 1109 762 36091 Census Tract 261, Queens County 7233 2286 897 36104 Census Tract 263, Queens County 6003 2022 1155 33838 Census Tract 265, Queens County 4534 1456 767 34127 Census Tract 291, Queens County 7120 2469 1124 36892 Census Tract 293, Queens County 1368 397 371 38438 Census Tract 295, Queens County 3790 1658 1028 44231 Census Tract 297, Queens County 1961 669 671 44643 Census Tract 299, Queens County 18 0 Census Tract 309.01, Queens County 10553 3303 3132 48398 Census Tract 309.02, Queens County 7949 2679 2528 41018
Queens, Rockaway Boulevard Catchment Area Census Tracts
Population
Households Vehicles Available
Median HH Income 1999
Queens County 2,229,379 782,664 705,429 $ 42,439
Census Tract 38, Queens County 2,213 722 660 $ 42,908
Census Tract 40.01, Queens County 1,786 623 511 $ 41,436
Census Tract 40.02, Queens County 1,248 397 305 $ 31,705.00
Census Tract 54, Queens County 5,247 1677 1584 $ 44,954.00
Census Tract 58, Queens County 5,569 2055 2450 $ 46,563.00
Census Tract 86, Queens County 2,699 925 1152 $ 45,431.00
Census Tract 88, Queens County 2,967 1114 1455 $ 46,691.00
Census Tract 94, Queens County 3,079 910 731 $ 36,341.00
Census Tract 96, Queens County 3,378 955 832 $ 40,406.00
Census Tract 98, Queens County 2,918 855 672 $ 39,943.00
Census Tract 100, Queens County 3,475 956 1046 $ 55,601.00
Census Tract 102, Queens County 2,745 780 817 $ 43,589.00
Census Tract 104, Queens County 3,481 970 964 $ 41,750.00
Census Tract 106, Queens County 3,482 950 780 $ 45,396.00
Census Tract 108, Queens County 2,996 837 681 $ 54,073.00
Census Tract 110, Queens County 3,101 865 826 $ 39,122.00
Census Tract 112, Queens County 2,233 706 701 $ 43,015.00
Census Tract 114, Queens County 1,120 388 358 $ 28,571.00
Census Tract 116, Queens County 2,066 579 528 $ 41,772.00
Census Tract 118, Queens County 2,370 676 698 $ 37,179.00
Census Tract 120, Queens County 2,599 683 621 $ 45,750.00

46
Census Tract 148, Queens County 2,276 617 534 $ 32,475.00
Census Tract 150, Queens County 2,633 667 794 $ 37,684.00
Census Tract 154, Queens County 2,423 686 622 $ 41,848.00
Census Tract 156, Queens County 3,578 918 896 $ 42,583.00
Census Tract 158, Queens County 8,761 2363 2091 $ 42,329.00
Census Tract 164, Queens County 3,607 930 1083 $ 55,625.00
Census Tract 166, Queens County 3,723 1059 1059 $ 42,791.00
Census Tract 168, Queens County 2,827 836 947 $ 45,296.00
Census Tract 170, Queens County 2,512 703 759 $ 47,202.00
Census Tract 172, Queens County 2,055 627 559 $ 38,438.00
Census Tract 174, Queens County 2,571 673 896 $ 57,500.00
Census Tract 176, Queens County 2,037 606 610 $ 41,321.00
Census Tract 178, Queens County 1,885 561 625 $ 45,313.00
Census Tract 180, Queens County 1,099 320 389 $ 50,278.00
Census Tract 716, Queens County 30 n/a 22 $ 47,750.00
Census Tract 818, Queens County 3,531 1021 1320 $ 49,631.00
Census Tract 838, Queens County 4,764 1508 1989 $ 52,179.00
Census Tract 840, Queens County 6,903 1976 2706 $ 47,908.00
Census Tract 846.01, Queens County 2,809 937 1252 $ 43,167.00
Census Tract 846.02, Queens County 1,117 242 325 $ 53,646.00
Census Tract 864, Queens County 2,498 802 852 $ 60,505.00
Census Tract 884, Queens County 7,932 2915 4701 $ 60,056.00
Staten Island, Targee Street catchment Area Census Tracts
Population Households Vehicles Median HH Income 1999 Richmond County 443728 156341 216422 55039 Census Tract 6, Richmond County 2530 1165 1211 41000 Census Tract 8, Richmond County 4,730 1740 2189 $ 51,404.00 Census Tract 15, Richmond County 668 352 265 $ 49,531.00 Census Tract 20.01, Richmond County 2,261 950 1125 $ 50,859.00 Census Tract 20.02, Richmond County 3,260 1187 1634 $ 51,741.00 Census Tract 21, Richmond County 3,375 1098 1026 $ 39,967.00 Census Tract 27, Richmond County 1,911 354 308 $ 30,227.00 Census Tract 29, Richmond County 5,197 1591 901 $ 17,019.00 Census Tract 33, Richmond County 3,180 1255 1466 $ 55,568.00 Census Tract 36, Richmond County 1,937 746 1020 $ 50,671.00 Census Tract 39, Richmond County 2,432 1018 1207 $ 48,271.00 Census Tract 40, Richmond County 11,105 3700 2701 $ 30,616.00 Census Tract 47, Richmond County 3,353 1026 1330 $ 57,500.00 Census Tract 50, Richmond County 3,649 1403 1822 $ 48,600.00 Census Tract 59, Richmond County 2,584 1146 1510 $ 59,811.00 Census Tract 64, Richmond County 3,659 1302 1329 $ 40,069.00 Census Tract 96.01, Richmond County 3,885 1486 1881 $ 44,599.00 Census Tract 169.01, Richmond County 2,973 1090 1607 $ 68,403.00 Census Tract 169.02, Richmond County 1,051 354 651 $ 110,375.00 Census Tract 177, Richmond County 5,862 2034 3754 $ 83,031.00

47
Staten Island, Veterans Road Catchment Area Census Tracts
Population Households Vehicles Median HH Income 1999
Richmond County 443728 156341 216422 55039 Census Tract 196, Richmond County 4,977 1696 2967 $66,345.00 Census Tract 208.01, Richmond County 8,261 2768 4371 $ 60,528.00 Census Tract 208.03, Richmond County 5,318 1715 3074 $ 70,885.00 Census Tract 226, Richmond County 6,103 1806 2925 $ 61,278.00 Census Tract 236, Richmond County 82 16 40 N/A Census Tract 244, Richmond County 8,401 2890 5158 $ 68,073.00 Census Tract 248, Richmond County 3,868 1364 2027 $ 57,209.00
Bronx, Zerega Avenue Catchment Area Census Tracts
Population Households Vehicles Available Median HH Income 1999
Bronx County 1,332,650 463,212 239,128 27,611 Census Tract 4, Bronx County 3,257 1,051 858 39,013 Census Tract 16, Bronx County 5,208 1,810 1,031 24,552 Census Tract 36, Bronx County 7,529 2,655 1,255 29,375 Census Tract 40.01, Bronx County 1,365 547 530 29,545 Census Tract 40.02, Bronx County 1 1 n/a n/a Census Tract 74, Bronx County 3,263 1,326 1,013 40,654 Census Tract 78, Bronx County 6,171 2,079 1,444 34,353 Census Tract 84, Bronx County 2,167 616 593 39,911 Census Tract 86, Bronx County 4,381 1,440 527 14,409 Census Tract 88, Bronx County 3,397 1,080 462 16,136 Census Tract 92, Bronx County 4,989 1,778 1,271 36,589 Census Tract 94, Bronx County 1,511 463 436 40,833 Census Tract 98, Bronx County 5,538 1,906 1,741 38,642 Census Tract 102, Bronx County 45 13 n/a 20,417 Census Tract 110, Bronx County 371 264 100 9,461 Census Tract 132, Bronx County 5,655 2,187 3,034 54,509 Census Tract 144, Bronx County 5,518 1,956 838 22,656 Census Tract 154, Bronx County 875 353 275 52,339 Census Tract 156, Bronx County 1,433 580 852 56,343 Census Tract 166, Bronx County 2,193 821 887 41,776 Census Tract 194, Bronx County 1,586 630 669 51,705 Census Tract 196, Bronx County 577 152 92 34,297

48
B. Street and Transit Accessibility Maps
The following maps detail the transit and street network that exists within the 8 HISS catchment
areas.

49
Figure 29: 23rd St. Street System

50
Figure 30: 23rd St. Transit System
Figure 31: Cropsey Ave Street System

51
Figure 32: Cropsey Ave Transit System
Figure 33: Northern Blvd Street System

52
Figure 34: Northern Blvd Transit System
Figure 35: Rockaway Blvd Street System
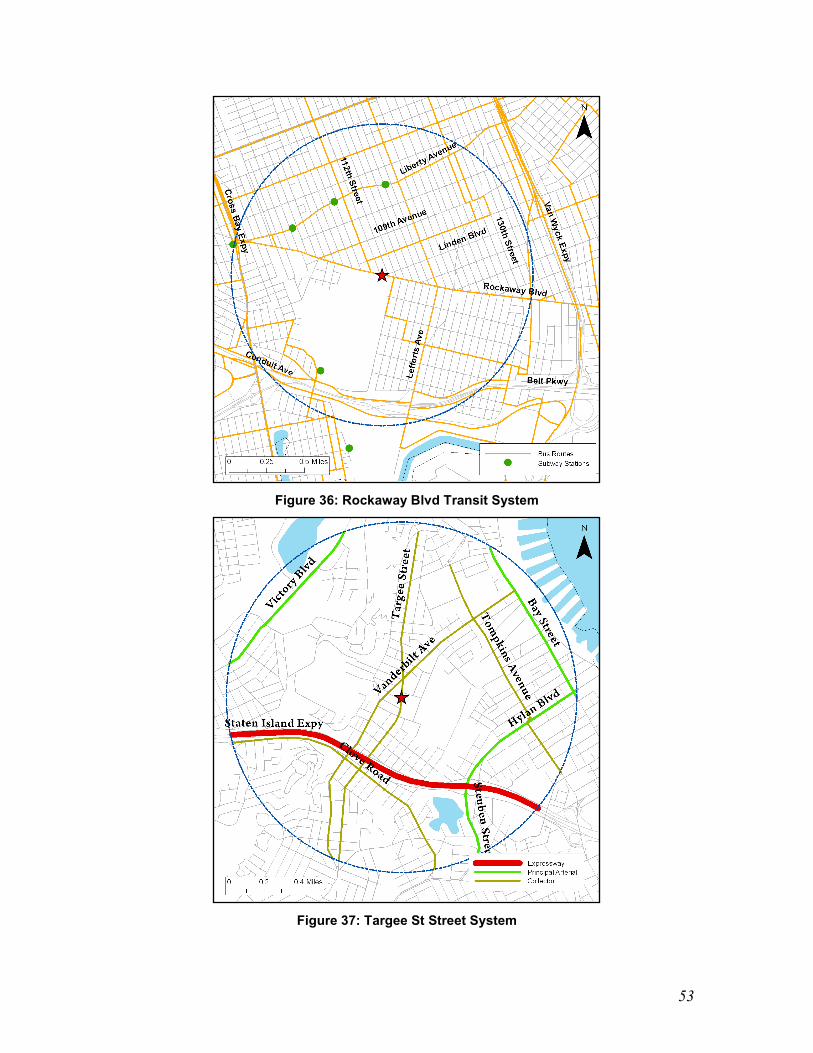
53
Figure 36: Rockaway Blvd Transit System
Figure 37: Targee St Street System

54
Figure 38: Targee St. Transit System
Figure 39: Veterans Rd Street System

55
Figure 40: Veterans Road Transit System
Figure 41: Zerega Ave Street System

56
Figure 42: Zerega Ave Transit System

57
C. Land Use Maps
The following maps detail the zoning groups and land use that exists within the 8 HISS catchment
areas.

58
Figure 43: 23rd Street Land Use
Figure 44: Cropsey Avenue Land Use

59
Figure 45: Northern Blvd Land Use
Figure 46: Rockaway Blvd Land Use

60
Figure 47: Targee Street Land Use
Figure 48: Veterans Road Land Use

61
Figure 49: Zerega Avenue Land Use

62
D. Questionnaire Survey
Big Box Retail Trip Generation Rates: HISS in New York City 1 Where did your trip originate? Site: 2 Is Store the main reason for your trip?
DOW: Date: 3 What made of transportation did you use? Start Time: End Time: 4 How far did you travel and time you travel? 5 Please check one that apply to you. DOT July 31, 2007
Trip Origin (1) Primary
Trip Store (2)
Mode of Travel (3) Travel Distance or Time (4)
Customer Category (5)
Home Work Other Specify Y N Car Bus Subway Taxi Walk Bike Other Specify 15 min
30 min
1 hour
1/2 mile
1 mile
2 mile Other Specify Home
owner Tenant Contractor

63
E. Results of the ANOVA for the AM, Midday, and PM peak

64

65

66

67

68

69

70
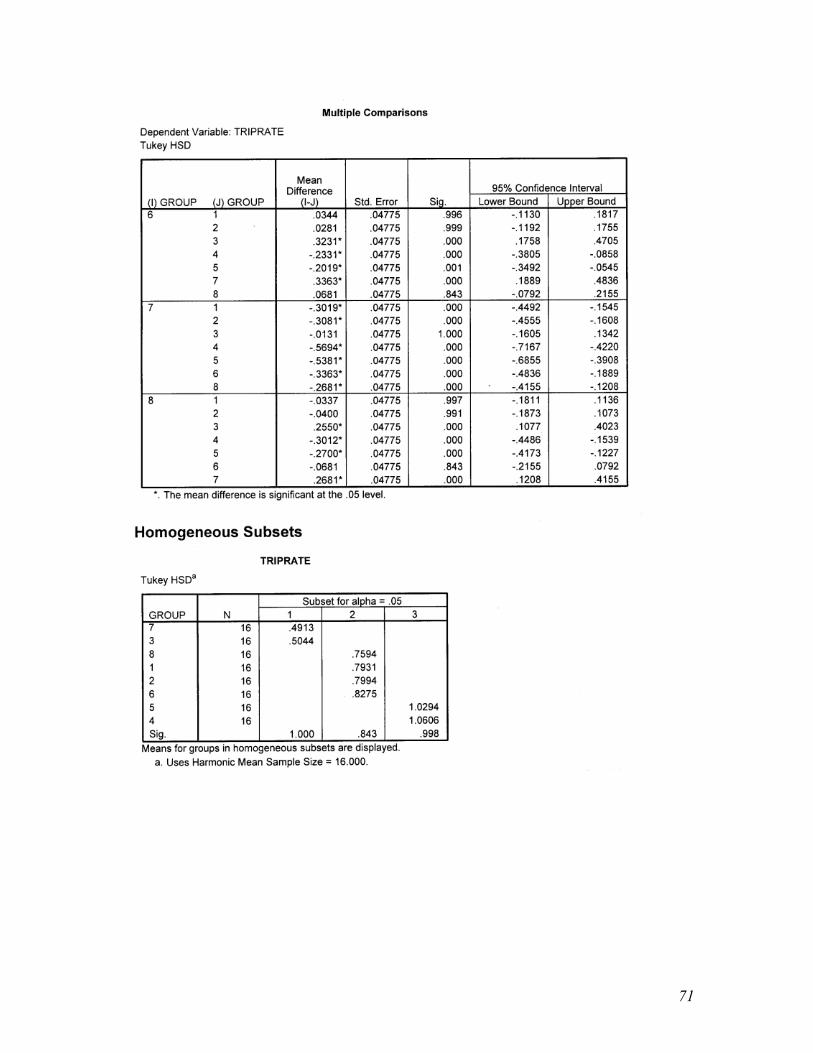
71

72
F. Exponential Smoothing Estimations For Daily Vehicle Trips

73
Trip Forecast for Northern Boulevard Facility - Saturday
time trips Rounded Forecast ALPHA α MAD MSE MAPE
AVG ERROR. CFE
1200 165.00 165.00 0.90 0.00 0.00 0.00 0.00 1215 196.00 165.00 31.00 961.00 0.16 31.00 31.00
1230 242.00 192.90 49.10 2410.81 0.20 49.10 49.10 1245 243.00 237.09 5.91 34.93 0.02 5.91 5.91
1300 221.00 242.41 21.41 458.35 0.10 -21.41 -21.41
1315 217.00 223.14 6.14 37.71 0.03 -6.14 -6.14 1330 241.00 217.61 23.39 546.90 0.10 23.39 23.39
1345 237.00 238.66 1.66 2.76 0.01 -1.66 -1.66 1400 212.00 237.17 25.17 633.33 0.12 -25.17 -25.17
1415 218.00 214.52 3.48 12.13 0.02 3.48 3.48
1430 195.00 217.65 22.65 513.10 0.12 -22.65 -22.65 1445 216.00 197.27 18.73 350.99 0.09 18.73 18.73
1500 217.00 214.13 2.87 8.26 0.01 2.87 2.87 1515 224.00 216.71 7.29 53.11 0.03 7.29 7.29
1530 216.00 223.27 7.27 52.87 0.03 -7.27 -7.27 1545 222.00 216.73 5.27 27.80 0.02 5.27 5.27
1600 221.00 221.47 0.47 0.22 0.00 -0.47 -0.47
1615 217.00 221.05 4.05 16.38 0.02 -4.05 -4.05 1630 195.00 217.40 22.40 501.97 0.11 -22.40 -22.40
1645 220.00 197.24 22.76 518.00 0.10 22.76 22.76 1700 170.00 217.72 47.72 2277.58 0.28 -47.72 -47.72
1715 189.00 174.77 14.23 202.42 0.08 14.23 14.23
1730 147.00 187.58 40.58 1646.51 0.28 -40.58 -40.58 1745 148.00 151.06 3.06 9.35 0.02 -3.06 -3.06
Summation 386.62 11276.50 1.95 -18.55 -18.55 AVG 16.81 490.28 0.08 -0.81

74
For α= 0.9 MAD 16.81 MSE 490 MAPE 8.0% AVG. ER. -0.81 CFE -18.55
Trip Forecast for 23rd Street Facility - Saturday Exponential Smoothing
Rounded time trips Forecast ALPHA AVG.
UF α MAD MSE MAPE ERROR CFE
1200 114.00 114.00 0.90 0.00 0.00 0.00 0.00 1215 142.00 114.00 28.00 784.00 0.20 28.00 28.00
1230 223.00 139.20 83.80 7022.44 0.38 83.80 83.80 1245 316.00 214.62 101.38 10277.90 0.32 101.38 101.38
1300 308.00 305.86 2.14 4.57 0.01 2.14 2.14 1315 281.00 307.79 26.79 717.50 0.10 -26.79 -26.79
1330 298.00 283.68 14.32 205.10 0.05 14.32 14.32
1345 326.00 296.57 29.43 866.25 0.09 29.43 29.43 1400 344.00 323.06 20.94 438.62 0.06 20.94 20.94
1415 373.00 341.91 31.09 966.86 0.08 31.09 31.09 1430 347.00 369.89 22.89 523.98 0.07 -22.89 -22.89
1445 353.00 349.29 3.71 13.77 0.01 3.71 3.71
1500 376.00 352.63 23.37 546.21 0.06 23.37 23.37 1515 353.00 373.66 20.66 426.96 0.06 -20.66 -20.66
1530 367.00 355.07 11.93 142.41 0.03 11.93 11.93 1545 334.00 365.81 31.81 1011.66 0.10 -31.81 -31.81
1600 321.00 337.18 16.18 261.81 0.05 -16.18 -16.18 1615 331.00 322.62 8.38 70.26 0.03 8.38 8.38

75
1630 278.00 330.16 52.16 2720.85 0.19 -52.16 -52.16
1645 289.00 283.22 5.78 33.45 0.02 5.78 5.78 1700 316.00 288.42 27.58 760.57 0.09 27.58 27.58
1715 301.00 313.24 12.24 149.87 0.04 -12.24 -12.24 1730 284.00 302.22 18.22 332.12 0.06 -18.22 -18.22
1745 276.00 285.82 9.82 96.48 0.04 -9.82 -9.82 1800 276.98 602.65 28373.65 2.11 181.09 181.09
26.20 1233.64 0.09 7.87
For α= 0.9 MAD 26.2
MSE 1,234 MAPE 9.0%
AVG. ER. 7.87
CFE 181.09
Trip Forecast for Targee Street Facility- Saturday Exponential Smoothing
Rounded
time trips Forecast ALPHA AVG. UF α MAD MSE MAPE ERROR CFE
1200 150.00 150.00 0.90 0.00 0.00 0.00 0.00 1215 223.00 150.00 73.00 5329.00 0.33 73.00 73.00
1230 213.00 215.70 2.70 7.29 0.01 -2.70 -2.70
1245 187.00 213.27 26.27 690.11 0.14 -26.27 -26.27 1300 208.00 189.63 18.37 337.57 0.09 18.37 18.37
1315 208.00 206.16 1.84 3.38 0.01 1.84 1.84 1330 190.00 207.82 17.82 317.42 0.09 -17.82 -17.82
1345 186.00 191.78 5.78 33.43 0.03 -5.78 -5.78 1400 197.00 186.58 10.42 108.61 0.05 10.42 10.42

76
1415 214.00 195.96 18.04 325.52 0.08 18.04 18.04
1430 182.00 212.20 30.20 911.79 0.17 -30.20 -30.20 1445 156.00 185.02 29.02 842.14 0.19 -29.02 -29.02
1500 179.00 158.90 20.10 403.93 0.11 20.10 20.10 1515 150.00 176.99 26.99 728.47 0.18 -26.99 -26.99
1530 146.00 152.70 6.70 44.88 0.05 -6.70 -6.70 1545 140.00 146.67 6.67 44.49 0.05 -6.67 -6.67
1600 135.00 140.67 5.67 32.11 0.04 -5.67 -5.67
1615 138.00 135.57 2.43 5.92 0.02 2.43 2.43 1630 160.00 137.76 22.24 494.77 0.14 22.24 22.24
1645 183.00 157.78 25.22 636.27 0.14 25.22 25.22 1700 106.00 180.48 74.48 5546.91 0.70 -74.48 -74.48
1715 113.00 113.45 0.45 0.20 0.00 -0.45 -0.45
1730 116.00 113.04 2.96 8.73 0.03 2.96 2.96 1745 123.00 115.70 7.30 53.22 0.06 7.30 7.30
1800 122.27 434.66 16906.15 2.71 -30.81 -30.81 18.90 735.05 0.12 -1.34
For α= 0.9 MAD 18.9
MSE 735
MAPE 12.0% AVG. ER. -1.34
CFE -30.81
Trip forecast for Warehouses - Rockaway Bl - Saturday Exponential Smoothing Rounded
time trips Forecast ALPHA AVG. UF α MAD MSE MAPE ERROR CFE
1200 256 268 0.9 12 0 0.046875 -12 1215 238 257.2 19.2 368.64 0.0806723 -19.2 -19.2

77
1230 264 239.92 24.08 579.8464 0.0912121 24.08 24.08 1245 254 261.592 7.592 57.638464 0.0298898 -7.592 -7.592 1300 253 254.7592 1.7592 3.0947846 0.0069534 -1.7592 -1.7592 1315 257 253.17592 3.82408 14.623588 0.0148797 3.82408 3.82408 1330 247 256.61759 9.617592 92.498076 0.0389376 -9.617592 -9.617592 1345 250 247.96176 2.0382408 4.1544256 0.008153 2.0382408 2.0382408 1400 251 249.79618 1.2038241 1.4491924 0.0047961 1.2038241 1.2038241 1415 222 250.87962 28.879618 834.03231 0.1300884 -28.879618 -28.879618 1430 248 224.88796 23.112038 534.16631 0.0931937 23.112038 23.112038 1445 222 245.6888 23.688796 561.15906 0.1067063 -23.688796 -23.688796 1500 210 224.36888 14.36888 206.4647 0.0684232 -14.36888 -14.36888 1515 217 211.43689 5.563112 30.948216 0.0256365 5.563112 5.563112 1530 215 216.44369 1.4436888 2.0842373 0.0067148 -1.4436888 -1.4436888 1545 199 215.14437 16.144369 260.64065 0.0811275 -16.144369 -16.144369 1600 211 200.61444 10.385563 107.85992 0.0492207 10.385563 10.385563 1615 247 209.96144 37.038556 1371.8547 0.1499537 37.038556 37.038556 1630 228 243.29614 15.296144 233.97203 0.0670884 -15.296144 -15.296144 1645 228 229.52961 1.5296144 2.3397203 0.0067088 -1.5296144 -1.5296144 1700 186 228.15296 42.152961 1776.8722 0.2266288 -42.152961 -42.152961 1715 210 190.2153 19.784704 391.43451 0.0942129 19.784704 19.784704 1730 190 208.02153 18.02153 324.77553 0.0948502 -18.02153 -18.02153 1745 184 191.80215 7.802153 60.873591 0.042403 -7.802153 -7.802153 1800 184.78022 346.52666 7821.4225 1.5653257 -80.466427 -80.466427
15.066377 340.06185 0.0680576 -3.4985403 For α= 0.9 MAD 15.07 MSE 340.06 MAPE 0.07 AVG. ER. -3.5 CFE -80.47
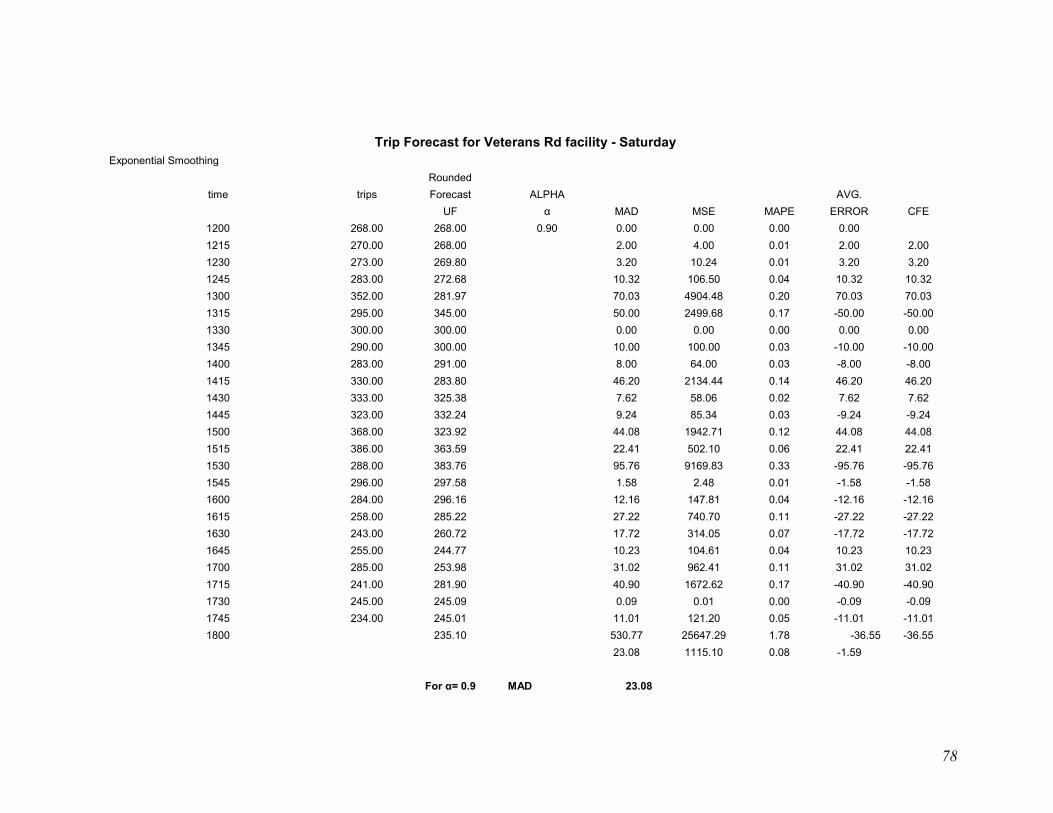
78
Trip Forecast for Veterans Rd facility - Saturday Exponential Smoothing Rounded
time trips Forecast ALPHA AVG. UF α MAD MSE MAPE ERROR CFE
1200 268.00 268.00 0.90 0.00 0.00 0.00 0.00 1215 270.00 268.00 2.00 4.00 0.01 2.00 2.00 1230 273.00 269.80 3.20 10.24 0.01 3.20 3.20 1245 283.00 272.68 10.32 106.50 0.04 10.32 10.32 1300 352.00 281.97 70.03 4904.48 0.20 70.03 70.03 1315 295.00 345.00 50.00 2499.68 0.17 -50.00 -50.00 1330 300.00 300.00 0.00 0.00 0.00 0.00 0.00 1345 290.00 300.00 10.00 100.00 0.03 -10.00 -10.00 1400 283.00 291.00 8.00 64.00 0.03 -8.00 -8.00 1415 330.00 283.80 46.20 2134.44 0.14 46.20 46.20 1430 333.00 325.38 7.62 58.06 0.02 7.62 7.62 1445 323.00 332.24 9.24 85.34 0.03 -9.24 -9.24 1500 368.00 323.92 44.08 1942.71 0.12 44.08 44.08 1515 386.00 363.59 22.41 502.10 0.06 22.41 22.41 1530 288.00 383.76 95.76 9169.83 0.33 -95.76 -95.76 1545 296.00 297.58 1.58 2.48 0.01 -1.58 -1.58 1600 284.00 296.16 12.16 147.81 0.04 -12.16 -12.16 1615 258.00 285.22 27.22 740.70 0.11 -27.22 -27.22 1630 243.00 260.72 17.72 314.05 0.07 -17.72 -17.72 1645 255.00 244.77 10.23 104.61 0.04 10.23 10.23 1700 285.00 253.98 31.02 962.41 0.11 31.02 31.02 1715 241.00 281.90 40.90 1672.62 0.17 -40.90 -40.90 1730 245.00 245.09 0.09 0.01 0.00 -0.09 -0.09 1745 234.00 245.01 11.01 121.20 0.05 -11.01 -11.01 1800 235.10 530.77 25647.29 1.78 -36.55 -36.55
23.08 1115.10 0.08 -1.59 For α= 0.9 MAD 23.08

79
MSE 1,115 MAPE 8.0% AVG. ER. -1.59 CFE -36.55

80
Facility Trip Estimations
Northern Blvd 23rd
Street Targee Street
Veterans Rd
Rockaway Blvd
WD Veh Sat Veh Sat Per Sat Veh Sat Veh Sat Veh
5:00 AM 24.7 16 5:15 AM 27.1 17.4 5:30 AM 29.8 18.9 5:45 AM 32.8 20.5 6:00 AM 36 22.3 7 44.9
6:15 AM 39.5 24.2 7.9 48.2
6:30 AM 52.5 26.4 9 51.9
6:45 AM 50 28.6 10.2 55.8
7:00 AM 69.5 31.1 17.3 11.6 60.0
7:15 AM 85.5 33.8 19 13.2 64.5
7:30 AM 90.5 36.8 20.9 15 69.3
7:45 AM 90 40 22.9 17.1 74.6
8:00 AM 124 43.5 25.2 19.4 70.6 80.2
8:15 AM 126.5 47.2 27.7 22 76.7 86.2
8:30 AM 140.5 51.3 30.4 25.1 83.4 92.7
8:45 AM 120 55.8 33.5 28.5 90.7 99.7
9:00 AM 144 60.7 36.8 32.4 98.5 107.2
9:15 AM 135.5 65.9 40.4 36.8 107.1 115.2
9:30 AM 148.5 71.7 44.4 41.8 116.4 123.9
9:45 AM 163 77.9 48.8 47.5 126.5 133.2
10:00 AM 171 84.7 53.6 53.9 137.5 143.3
10:15 AM 160.5 92 58.9 61.3 149.5 154.0
10:30 AM 167.5 100 64.7 69.7 162.5 165.6
10:45 AM 161.5 108.7 71.1 79.2 176.6 178.1
11:00 AM 181.5 118.2 78.2 90 192 191.5
11:15 AM 164.5 128.5 85.9 102.2 208.7 205.9
11:30 AM 150.5 139.7 94.4 116.2 226.8 221.4
11:45 AM 171.5 151.8 103.7 132 246.6 238.1
12:00 PM 166 165 114 150 268 256.0
12:15 PM 157.5 196 142 223 270 238.0
12:30 PM 168.5 242 223 213 273 264.0
12:45 PM 162.5 243 316 187 283 254.0
1:00 PM 162 221 308 208 352 253.0
1:15 PM 171.5 217 281 208 295 257.0
1:30 PM 172 241 298 190 300 247.0
1:45 PM 142.5 237 326 186 290 250.0
2:00 PM 146 212 344 197 283 251.0
2:15 PM 150 218 373 214 330 222.0
2:30 PM 145.5 195 347 182 333 248.0
2:45 PM 167.5 216 353 156 323 222.0
3:00 PM 128 217 376 179 368 210.0

81
3:15 PM 154 224 353 150 386 217.0
3:30 PM 153 216 367 146 288 215.0
3:45 PM 175 222 334 140 296 199.0
4:00 PM 133 221 321 135 284 211.0
4:15 PM 173.5 217 331 138 258 247.0
4:30 PM 155 195 278 160 243 228.0
4:45 PM 176 220 289 183 255 228.0
5:00 PM 155.5 170 316 106 285 186.0
5:15 PM 157.5 189 301 113 241 210.0
5:30 PM 151 147 284 116 245 190.0
5:45 PM 148.5 148 276 123 234 184.0
6:00 PM 161 136.16 251.2 108.2 215.3 171.1
6:15 PM 126.5 125.3 228.6 95.3 198.1 159.1
6:30 PM 151.5 115.2 208 83.8 182.2 148.0
6:45 PM 135.5 106 189.3 73.8 167.6 137.6
7:00 PM 174.5 97.5 172.2 64.9 154.2 128.0
7:15 PM 155 89.7 156.7 57.1 141.9 119.0
7:30 PM 142.5 82.6 142.6 50.3 130.5 110.7
7:45 PM 136 76 129.8 44.2 120.1 103.0
8:00 PM 140 69.9 118.1 95.8
8:15 PM 127.5 64.3 107.5 89.1
8:30 PM 124 59.1 97.8 82.8
8:45 PM 108.5 54.4 89 77.0
9:00 PM 112 50.1 71.6
9:15 PM 122 46.1 66.6
9:30 PM 88.5 42.4 62.0
9:45 PM 84 39 57.6
10:00 PM 76.44 35.9 53.6
10:15 PM 69.56 33 49.8
10:30 PM 63.3 30.4 46.3
10:45 PM 57.6 27.9 43.1
11:00 PM 11:15 PM 11:30 PM 11:45 PM
Total 9,186 8,084 10,120 5,629 10,563 10,164

82
E:\HLareau\HomeDepot\HDFinalSummary12.doc