triple net leased qsr investment offering in … · franchising system • signalized corner site...
TRANSCRIPT

For investment information contact:J. Tyson Glasser, CCIM • Investment Sales Director864.263.5427 o • 404.435.6312 c [email protected]
0.92 Acres · 3,212 Square Feet
TRIPLE NET LEASED QSR INVESTMENT OFFERING IN METRO ATLANTA1265 Powder Springs Road SW, Marietta, GA 30064
$2,717,000 · 6.0% Cap Rate
Representative Property

2
Click on page number to jump to page
Representative Property
TABLE OF CONTENTS
Property Cover 1
Table of Contents 2
Investment Highlights 3
Investment Summary 4
Tenant Profile 5
Site Plan 6
Location Map & Aerial 7
Market Profile 8 – 9
Demographics 10 –11
Contact Information 12
3
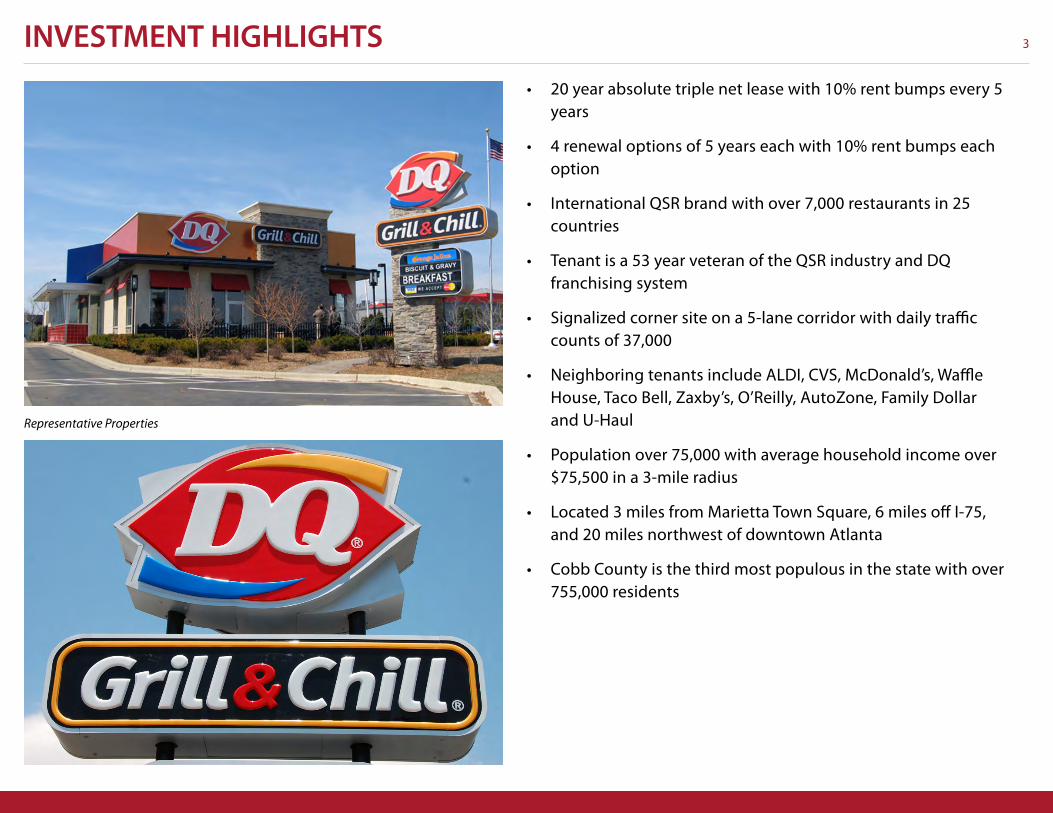
• 20 year absolute triple net lease with 10% rent bumps every 5 years
• 4 renewal options of 5 years each with 10% rent bumps each option
• International QSR brand with over 7,000 restaurants in 25 countries
• Tenant is a 53 year veteran of the QSR industry and DQ franchising system
• Signalized corner site on a 5-lane corridor with daily traffic counts of 37,000
• Neighboring tenants include ALDI, CVS, McDonald’s, Waffle House, Taco Bell, Zaxby’s, O’Reilly, AutoZone, Family Dollar and U-Haul
• Population over 75,000 with average household income over $75,500 in a 3-mile radius
• Located 3 miles from Marietta Town Square, 6 miles off I-75, and 20 miles northwest of downtown Atlanta
• Cobb County is the third most populous in the state with over 755,000 residents
INVESTMENT HIGHLIGHTS
Representative Properties

4INVESTMENT SUMMARYOFFERING DETAILS
Address 1265 Powder Springs Road SWMarietta, GA 30064
Purchase Price $2,717,000 (based on estimated rent)
Going In Cap Rate 6.0% (Years 1-5)
Average Cap Rate 6.96% (Years 1-20)
Land Size +/- 0.921 Acres or +/- 40,114 Square Feet
Building Size +/- 3,212 Square Feet
Building Age Construction Completed October 2018
Frontage +/- 200 Feet on Powder Springs Road+/- 185 Feet on Cunningham Road
Access 1 Point of Ingress/Egress on Powder Springs Road1 Point of Ingress/Egress on Cunningham Road
Parking 39 Total Spaces with 2 Handicap Spaces
Zoning CRC – Community Retail Commercial
Traffic Counts +/- 37,000 AADT on Powder Springs Road
DEMOGRAPHICS 1 Mile 3 Mile 5 Mile
Population 12,568 75,151 182,571
Households 3,617 25,851 65,700
Average HH Income $83,552 $75,514 $78,894
Median HH Income $56,133 $52,113 $55,263
LEASE DETAILS
Lease Type Fee Simple Absolute Triple Net
Lease Term 20 Years
Commencement Date November 1, 2018
Expiration Date October 31, 2038
Renewal Options 4 Options 5 Years Each
Estimated Annual Base Rent
$163,000.00 (Years 1-5)$179,300.00 (Years 6-10)$197,230.00 (Year 11-15)$216,953.00 (Years 16-20)
Rent Increases 10% Every 5 Years
Percentage Rent None
Tenant/Guarantor Silver Lodestone, Inc./LBS Group, Inc.
Right of First Refusal None
5
Mission: To create positive memories for all who touch DQ®
Vision: To be the world’s favorite quick-service restaurant
Brand Story There are few brands as iconic as the DQ® brand. The first Dairy Queen location opened in Joliet, Ill. in 1940. Since then, the innovative DQ food and treats along with the unique DQ restaurant concepts, have positioned International Dairy Queen as a leader in the quick-service restaurant industry both in the U.S. as well as internationally. Today, the DQ system is a $4.5 billion brand.
OwnershipDairy Queen® restaurants are franchised by American Dairy Queen Corporation, a Berkshire Hathaway company (NYSE: NRK.A and BRK.B). Restaurants in Canada are franchised through Dairy Queen Canada.
MenuThe Dairy Queen system offers a variety of treats and products including burgers, chicken strips, chicken sandwiches, artisan sandwiches and the famous DQ soft-serve that is part of a variety of unique treats only found at Dairy Queen restaurants.
Franchisees*U.S.: Approximately 2,351 unique franchisees with 4,503 stores Canada: Approximately 537 unique franchisees with 688 stores International: 43 unique franchisees with 1864 stores *Based on 2017 (Rolling 12 Months) stores that paid service fees
HeadquartersFranchisees throughout the world are supported by teams at the IDQ Franchisee Support Center in Minneapolis, Minnesota and the Franchisee Support Center in Burlington, Ontario, Canada.
Powder Springs LocationThe Powder Springs Road location is operated by Silver Lodestone, Inc. (SLS). The owner of SLS is industry veteran and longtime DQ franchisee B.A. “Bogey” Stoner. Bogey has been operating DQ restaurants for 53 years and currently has four (4) locations in the northwest Atlanta market with a fifth one in the planning stages. SLS is based in Marietta GA and its main office is less than two miles from the Powder Springs Road location. Contact broker for additional franchisee information.
TENANT PROFILE
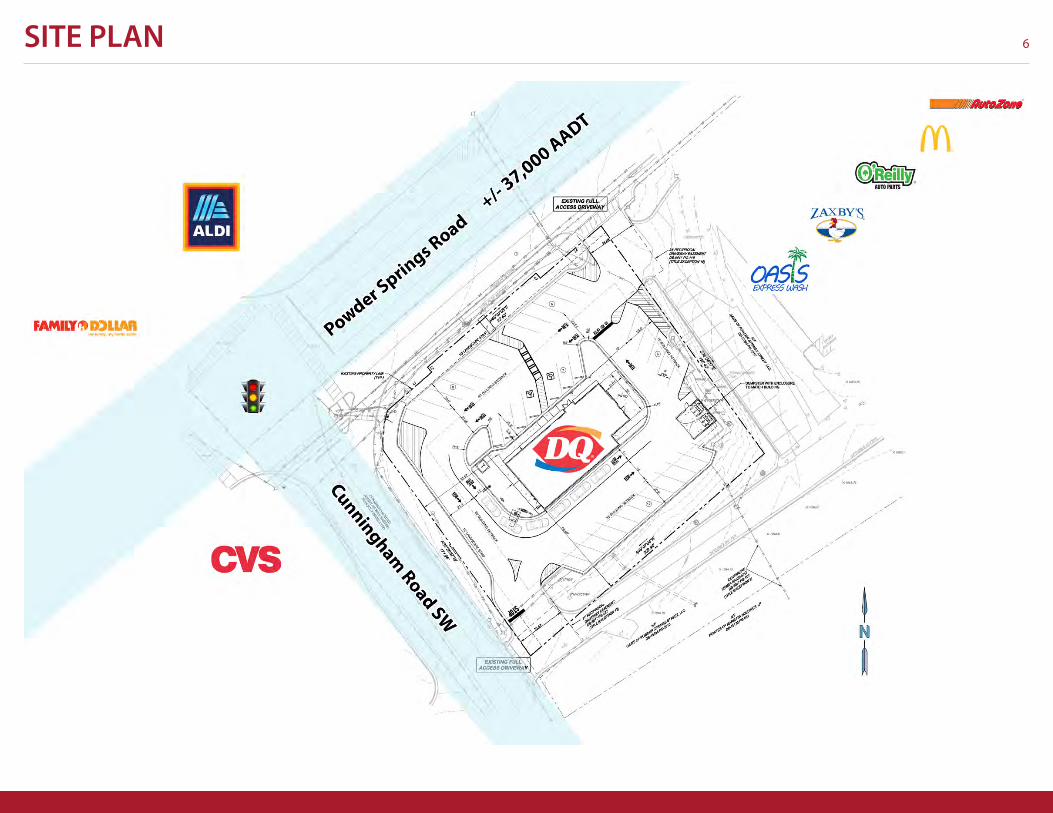
6SITE PLAN

7LOCATION MAP & AERIAL

8
What was once a stopping-off point for roaming hunters is now home to about 755,000 people, two thriving school systems and a rapidly growing economy.
Established in 1832, Cobb County takes its name from Thomas W. Cobb, a U.S. senator, state legislator and superior court judge.
It now includes six cities, Acworth, Austell, Kennesaw, Powder Springs, Smyrna and Marietta, which is the county seat. Cobb also includes several other communities that have not incorporated into cities, such as Mableton, Vinings, Cumberland and East Cobb.
The construction of the Western and Atlantic Railroad in 1832 saw more and more people come to the area. Thirty years later, that rail line also saw the celebrated Great Locomotive Chase, where a band of Union spies commandeered a locomotive in Big Shanty, today called Kennesaw, in an attempt to sabotage the line. They led Confederate troops on a chase all the way to Chattanooga before being captured.
After the war, the county’s economic fortunes changed when Bell Aircraft announced it was opening a factory in 1942. By 1945, over 28,000 workers were employed at the Bell Bomber plant pitching in for the war effort.
In 1951, ownership of the plant moved to the Lockheed Corporation, which is still a major fore in Cobb’s economy.
The military also remains a major presence in the county in the form of Dobbins Air Reserve Base. Constructed in 1941 as Rickenbacker Field, it is now the largest multi-service reserve training base in the world with more than 10,000 guardsmen and reservists from the Air Force, Army, Navy and Marines.
Today, Cobb County has become a thoroughly modern part of metropolitan Atlanta, the home of Home Depot, Lockheed and the Atlanta Braves. People here are on average wealthier and better educated than in the rest of the state or country. Cobb’s two public school districts are Cobb County Schools, which educates nearly 113,000
students, and Marietta City Schools, a smaller district within Marietta city limits.
The county is also home to the state’s third largest university, Kennesaw State University, as well as a multitude of private and charter schools.
Recently, Cobb has become a sports destination as well, hosting soccer team Atlanta United FC’s headquarters and the Braves’ Suntrust Park, which still has its new-stadium smell after opening in 2017. In addition to hosting its own college games, KSU’s Fifth Third Bank Stadium is also home to Major League Lacrosse’s Atlanta Blaze.
The county is governed by a five-member Board of Commissioners, consisting of a chairman and four district commissioners, while the cities are each governed by a major-city council system.
MARKET PROFILE
COBB COUNTY FACT BOX
Established 1832
Population 755,754 (est 2017)
Land Area 339.6 square miles
Cities Acworth, Austell, Kennesaw, Marietta, Powder Springs, Smyrna
Bachelor’s Degree or Higher 44.1%
Median Household Income $55,263 (2018 5-mile radius)
Mean Travel Time to Work 30.7 minutes

9MARKET PROFILECOBB COUNTY’S TOP 10 EMPLOYERS
COBB COUNTY SCHOOLS
18,031*LOCKHEED MARTIN AERONAUTICS
4,900
THE HOME DEPOT
12,000PUBLIX SUPERMARKETS
3,619
WELLSTAR HEALTH SYSTEM
11,596SIX FLAGS OVER GEORGIA
3,100*
KENNESAW STATE UNIVERSITY
5,980
BRAND ENERGY & INFRASTRUCTURE HOLDINGS, INC.
2,803
COBB COUNTY GOVERNMENT
5,378THE KROGER COMPANY
2,523
*Employee count includes full-time, part-time and temporary

10
Executive SummaryDQ Grill & Chill Prepared by Esri1265 Powder Springs St SE, Marietta, Georgia, 30064 Latitude: 33.92167Rings: 1, 3, 5 mile radii Longitude: -84.57762
1 mile 3 miles 5 milesPopulation
2000 Population 11,451 68,830 161,3672010 Population 11,515 69,644 165,9182018 Population 12,568 75,151 182,5712023 Population 13,208 79,533 193,8582000-2010 Annual Rate 0.06% 0.12% 0.28%2010-2018 Annual Rate 1.07% 0.93% 1.17%2018-2023 Annual Rate 1.00% 1.14% 1.21%2018 Male Population 55.4% 50.5% 49.5%2018 Female Population 44.6% 49.5% 50.5%2018 Median Age 33.4 34.2 34.9
In the identified area, the current year population is 182,571. In 2010, the Census count in the area was 165,918. The rate of change since 2010 was 1.17% annually. The five-year projection for the population in the area is 193,858 representing a change of 1.21% annually from 2018 to 2023. Currently, the population is 49.5% male and 50.5% female.
Median Age
The median age in this area is 33.4, compared to U.S. median age of 38.3.Race and Ethnicity
2018 White Alone 39.3% 47.5% 48.2%2018 Black Alone 46.5% 32.0% 33.6%2018 American Indian/Alaska Native Alone 0.3% 0.5% 0.4%2018 Asian Alone 2.3% 3.1% 3.4%2018 Pacific Islander Alone 0.1% 0.1% 0.0%2018 Other Race 8.0% 13.1% 10.6%2018 Two or More Races 3.6% 3.8% 3.7%2018 Hispanic Origin (Any Race) 19.6% 29.4% 23.8%
Persons of Hispanic origin represent 23.8% of the population in the identified area compared to 18.3% of the U.S. population. Persons of Hispanic Origin may be of any race. The Diversity Index, which measures the probability that two people from the same area will be from different race/ethnic groups, is 77.9 in the identified area, compared to 64.3 for the U.S. as a whole.
Households2000 Households 3,485 24,364 58,1182010 Households 3,303 24,211 60,0312018 Total Households 3,617 25,851 65,7002023 Total Households 3,836 27,330 69,6932000-2010 Annual Rate -0.53% -0.06% 0.32%2010-2018 Annual Rate 1.11% 0.80% 1.10%2018-2023 Annual Rate 1.18% 1.12% 1.19%2018 Average Household Size 2.78 2.79 2.70
The household count in this area has changed from 60,031 in 2010 to 65,700 in the current year, a change of 1.10% annually. The five-year projection of households is 69,693, a change of 1.19% annually from the current year total. Average household size is currently 2.70, compared to 2.68 in the year 2010. The number of families in the current year is 42,174 in the specified area.
Data Note: Income is expressed in current dollarsSource: U.S. Census Bureau, Census 2010 Summary File 1. Esri forecasts for 2018 and 2023. Esri converted Census 2000 data into 2010 geography.
September 06, 2018
©2018 Esri Page 1 of 2
DEMOGRAPHICS

11
Executive SummaryDQ Grill & Chill Prepared by Esri1265 Powder Springs St SE, Marietta, Georgia, 30064 Latitude: 33.92167Rings: 1, 3, 5 mile radii Longitude: -84.57762
1 mile 3 miles 5 milesMedian Household Income
2018 Median Household Income $56,133 $52,113 $55,2632023 Median Household Income $60,507 $56,403 $59,7042018-2023 Annual Rate 1.51% 1.59% 1.56%
Average Household Income
2018 Average Household Income $83,552 $75,514 $78,8942023 Average Household Income $94,982 $84,580 $88,6232018-2023 Annual Rate 2.60% 2.29% 2.35%
Per Capita Income2018 Per Capita Income $27,836 $26,690 $29,3022023 Per Capita Income $31,214 $29,722 $32,7702018-2023 Annual Rate 2.32% 2.18% 2.26%
Households by IncomeCurrent median household income is $55,263 in the area, compared to $58,100 for all U.S. households. Median household income is projected to be $59,704 in five years, compared to $65,727 for all U.S. households
Current average household income is $78,894 in this area, compared to $83,694 for all U.S. households. Average household income is projected to be $88,623 in five years, compared to $96,109 for all U.S. households
Current per capita income is $29,302 in the area, compared to the U.S. per capita income of $31,950. The per capita income is projected to be $32,770 in five years, compared to $36,530 for all U.S. households Housing
2000 Total Housing Units 3,594 25,525 60,8922000 Owner Occupied Housing Units 2,128 14,294 33,8892000 Renter Occupied Housing Units 1,357 10,070 24,2282000 Vacant Housing Units 109 1,161 2,775
2010 Total Housing Units 3,700 28,194 69,0992010 Owner Occupied Housing Units 1,866 13,715 35,0212010 Renter Occupied Housing Units 1,437 10,496 25,0102010 Vacant Housing Units 397 3,983 9,068
2018 Total Housing Units 3,979 29,485 73,7002018 Owner Occupied Housing Units 1,792 13,910 36,0522018 Renter Occupied Housing Units 1,825 11,941 29,6482018 Vacant Housing Units 362 3,634 8,000
2023 Total Housing Units 4,223 31,206 78,0412023 Owner Occupied Housing Units 1,971 15,298 39,5242023 Renter Occupied Housing Units 1,865 12,032 30,1692023 Vacant Housing Units 387 3,876 8,348
Currently, 48.9% of the 73,700 housing units in the area are owner occupied; 40.2%, renter occupied; and 10.9% are vacant. Currently, in the U.S., 56.0% of the housing units in the area are owner occupied; 32.8% are renter occupied; and 11.2% are vacant. In 2010, there were 69,099 housing units in the area - 50.7% owner occupied, 36.2% renter occupied, and 13.1% vacant. The annual rate of change in housing units since 2010 is 2.91%. Median home value in the area is $197,344, compared to a median home value of $218,492 for the U.S. In five years, median value is projected to change by 2.76% annually to $226,135.
Data Note: Income is expressed in current dollarsSource: U.S. Census Bureau, Census 2010 Summary File 1. Esri forecasts for 2018 and 2023. Esri converted Census 2000 data into 2010 geography.
September 06, 2018
©2018 Esri Page 2 of 2
DEMOGRAPHICS

12
©2018 RealtyLink, LLC. We have obtained the contained information from sources we believe are reliable. We have not, however, verified that all information is accurate and make no guarantee, warranty, or representation of it. The information is subject to the possibility of errors, omissions, change of price, rental, or other conditions, prior sale, lease or financing or withdrawal without notice, and it is not a substitute for a thorough due diligence investigation. We include opinions, projections, estimations and assumptions for example purposes only. This information may not represent current or future performance of the property. Seek legal advise and conduct due diligence if exact numbers are desired.
RealtyLink, LLC and the RealtyLink logo are trademarks of RealtyLink, LLC and/or its affiliates. All other logos or company materials displayed in these contents are the property of their respective owners.
J. TYSON GLASSER, CCIMInvestment Sales Director864.263.5427 o 404.435.6312 [email protected]
CONTACT INFORMATION
550 South Main Street, Suite 300Greenville, SC 29601
864.242.4008 p864.232.0160 f
www.realtylinkdev.com