triple p cimh program performance evaluation...
TRANSCRIPT

Todd Sosna, Ph.D.January 19, 2011
Los Angeles County PEITriple P Parenting
Program Performance Evaluation

Program Performance Evaluation
• Process, materials and support
• Role of program performance evaluation
• Reports

Process and Materials• Measures provided by DMH or CIMH• Evaluation guide provided by CIMH• Pre-formatted (Excel) data base provided by CIMH• Webinar training on measures and process
provided by CIMH• Practitioners administer and score measures• Agencies enter data• Data submitted by agencies twice each year• Analysis and reporting completed by CIMH• Aggregate and site specific reports intended for
supervisors and practitioners reviewed by agencies

2-Measure Approach
• General (common) measure– Completed at the start and end of Triple P Parenting– Youth Outcome Questionnaire © (YOQ)
• Completed by parent/caregiver– Youth Outcome Questionnaire-Self Report © (YOQ-SR)
• Completed by youth
• Treatment target (specific) measures– Completed at the start and end of Triple P Parenting– Eyberg Child Behavior Inventory (ECBI)
• Completed by parent/caregiver

What You Should Have to Start
• Data Dictionary (Word document)
– Triple P LA PEI Data Dictionary
– A guide for using the associated data entryshell
• Database (Excel file)
– Triple P LA PEI Data Entry Shell
– Holds all data for all children and familiesserved thru LA PEI Triple P

Triple P Data Submissions• Data submissions occur twice a year
– The end of June (reflecting children served thru May)
– The end of December (reflecting children served throughNovember)
– Note that this is the anticipated schedule; actual datasubmission dates may vary slightly
• An email notice is sent approximately one month inadvance of each data submission deadline
• After data are submitted, sites continue to enter new datainto the same database (always reflects an ongoing,historical record of children served)
• Every effort is made to distribute reports within twomonths of data submission– Aggregate and site-specific reports

Triple P Data Submissions
• Agencies may choose from among the followingmethods for submitting their Excel databases toCIMH:– Use YouSendIt to submit data electronically
• YouSendIt (www.YouSendIt.com) is a vendor that supportsthe secure transfer of electronic data (encrypted andpassword-protected)
– Mail a password-protected CD to CIMH and submitthe password separately (via email or phone)
– Email an encrypted, password-protected file(s) toCIMH and submit the password separately (via emailor phone)

Training and Support• Webinar
– Conducted periodically– Importance of evaluation– Clinical utility of measures– Administration and scoring– Data entry and submittal
• Recorded webinar– Available at www.cimh.org
• Individual assistance– Contact Cricket Mitchell, Ph.D.– Email: [email protected]– Cell phone: 858-220-6355

Clinical Utility & Program Improvement
• Assessment is the beginning of developinga relationship with the child and parents
– Demonstrates a desire to know what the childis experiencing
– By incorporating standardized measures offunctioning, the efficiency and thoroughness ofassessment is enhanced

Clinical Utility & Program Improvement
• Using standardized measures offunctioning…
– Assists in initial clinical impressions
– Provides valuable information to guidetreatment/interventions
– Assesses sufficiency of treatment delivered
– Demonstrates treatment-related improvementsin child functioning

Program Performance Reports• Entry rate (% referred who start)• Completion rates (% who start that finish)• Average age• Gender % and Ethnicity %• Diagnoses %• Average number of sessions, duration of
treatment• % change on relevant-sensitive measures• Entry, completion and change by gender,
ethnicity and diagnosis
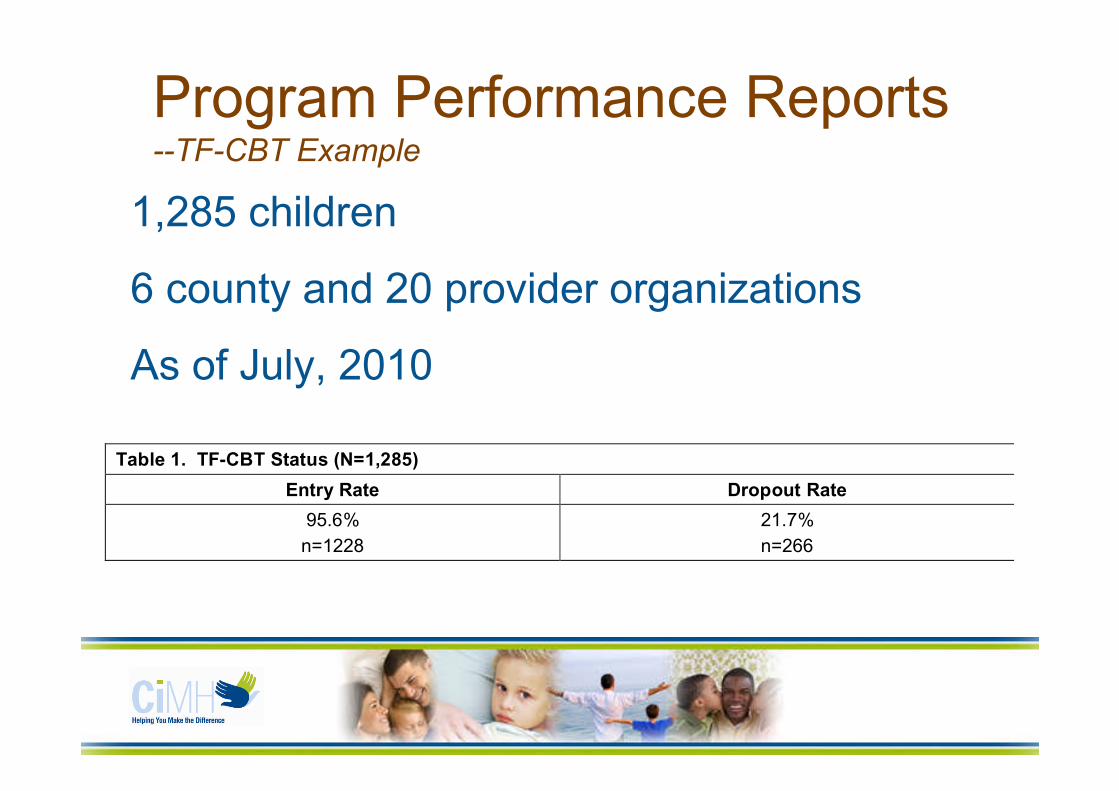
Program Performance Reports--TF-CBT Example
Table 1. TF-CBT Status (N=1,285)
Entry Rate Dropout Rate
95.6%
n=1228
21.7%
n=266
1,285 children
6 county and 20 provider organizations
As of July, 2010

Program Performance Reports
Table 2. Client Demographics – Children Who Entered TF-CBT (n=1,228)
Gender Ethnicity Primary Axis I Diagnosis
Ag
e(in
year
s)
Fem
ale
Mal
e
Afr
ican
-Am
eric
an
Asi
an/P
acif
icIs
lan
der
Cau
casi
an
His
pan
ic/L
atin
o
Oth
er
PT
SD
Oth
erA
nxi
ety/
Mo
od
/Ad
just
men
t
Oth
er
11.6
n=1213
60.3%n=740
39.7%n=488
19.7%n=242
0.7%n=9
18.5%n=227
56.3%n=691
4.7%n=57
33.4%n=410
46.4%n=570
20.0%n=245

Program Performance Reports
Table 3. Service Delivery Data ŠChildren Who Completed TF-CBT (n=392)
Average Length of Therapy Average Number of Sessions
26.3 weeks (+13.8)
n=382
19.0 (+9.0)
n=370

Program Performance Reports
Table 4. Outcome Data± ŠChildren Who Completed TF-CBT (n=392)
Percent Improvement From Pre TF-CBT to Post TF-CBT
Post-Traumatic Stress Disorder
Reaction Index (PTSD-RI)
Total PTSD Severity Score
Youth Outcome
Questionnaire
(YOQ and YOQ-SR)
Total Score
Parent/Caregiver
41.5%*
n=187
[pre=26.8]
45.4%*
n=187
[pre=57.1]
Child/Youth
44.3%*
n=213
[pre=28.4]
42.5%*
n=173
[pre=55.7]

Program Performance Reports

Program Performance Reports

Thank you!