trmm satellite data — applications to tropical cyclone analysis
TRANSCRIPT

TRMM SATELLITE DATA — APPLICATIONSTO TROPICAL CYCLONE ANALYSIS AND
FORECASTING
TRMM SATELLITE DATA — APPLICATIONSTRMM SATELLITE DATA — APPLICATIONSTO TROPICAL CYCLONE ANALYSIS ANDTO TROPICAL CYCLONE ANALYSIS AND
FORECASTINGFORECASTING
1NOAA/Hurricane Research Division2Tropical Prediction Center/National Hurricane Center
11NOAA/Hurricane Research DivisionNOAA/Hurricane Research Division22Tropical Prediction Center/National Hurricane CenterTropical Prediction Center/National Hurricane Center
Frank Marks1 and Stacy Stewart2Frank MarksFrank Marks11 and Stacy Stewart and Stacy Stewart22

TC FORECASTER’s DILEMMA• Lack of wind data over much of world’s
ocean areas• Inability to accurately assess location and
intensity of tropical cyclones (TC)• Poor position estimate results in bad track
forecast• Poor model initialization results in
unrealistic spinup/spindown of TCs• Poor quantitative precipitation forecasts
(QPF)

Satellite Wind and Rain Estimates• Multiple Sensors (passive):
• DMSP/SSMI - Defense MeteorologicalSatellite Program/Special SensorMicrowave Imager (U.S. Air Force)
• TRMM - Tropical Rainfall MeasuringMission Microwave Imager (MI) (NASA)
• Multiple Sensors (active):• ERS-2 - European Remote-Sensing Satellite
(5 GHz)• QuikSCAT - NASA Scatterometer (14 GHz)• TRMM Precipitation Radar (PR) (14 GHz)
(NASA)

Satellite Surface Wind Detection
• Microwave (passive) - obtained from threefrequencies: 19-, 22-, 37-GHz;
– 19-GHz resolutions: 15 km for TRMM and 34km for SSMI.
• Scatterometer (active) - microwave radarmeasures near-surface ocean backscatteredenergy generated by very small capillarywaves– Resolutions: 25 km QuikSCAT and 50 km ERS-2

Strengths of Remote Wind Sensing
• Global near-surface wind estimates overremote oceanic areas
• Improves numerical model initialization
• Provides quantitative information on TCstrength
• Provides quantitative information on thehorizontal extent of TC-wind radii (e.g.,17 m s-1 and 25 m s-1 winds)

Limitations of Remote Wind Sampling• Data coverage incomplete in time and
space• Data not in real-time (≤3 h old )• Passive winds limited to ≤20 m s-1; no wind
direction available.• Passive winds not available in presence of
rain and/or sidelobes near coastlines.• Scatterometer winds limited to ≤18 m s-1;
direction occasionally 180o out of phase;affected by heavy rain.

Benefits of TRMM
• TRMM in lower orbit than SSMI (350 kmvs. 800 km) -> higher horizontalresolution (5 km vs. 10 km) -> more detailof features in eyewall
• TRMM PR is only satellite radar -> givesvertical and horizontal structure
• TRMM in low-inclination orbit (vs. polarorbit). Covers tropical latitudes better (1in 8 orbits view a TC

Operational Use of TRMM Data
• 85- and 37-GHz channels “see” throughclouds to depict low- and mid-level featuresand allow TC center location
• Qualitatively assess TC intensity bydepicting eye obscured in VIS/IR imagery
• Qualitatively assess TC intensity trend bydepicting eyewall changes
• TRMM MI/PR rainfall algorithms for QPF• TRMM PR data has best horizontal
resolution for depicting TC features
37-GHz Microwave Data• Sensitive to rain.• Insensitive to most ice precipitation
particles that appear in and contaminatethe 85-GHz data.
• Can depict lowest rainbands (≤1.5 km)within a TC (~13 km resolution).
• Shows spatial variations of rain intensitynear center of the storm; such variationsoften do not appear in 85-GHz databecause attenuation by ice in convectiveclouds.

85-GHz Microwave Data• Deep convection (red) distinguished from
low-level clouds and warm rain (blue-green).• Blue-green regions traces non-precipitating
low-level cyclonic circulation.• Deep convection characterized by ice
precipitation above freezing-level (>4.5 km)and used to detect mid-level eye formation.
• If red areas increase (decrease) in size andmore (less) organized over time, means a TCis getting stronger (weaker).
• Compare to 37-GHz or radar to assess eye tilt.

TRMM Precipitation Radar (PR)for Rain Data
• Radar transmits at 14-GHz frequency• 5-km horizontal resolution at surface• 250 m vertical resolution;• 215 km swath width is ~1/4 size of
passive radiometer swath width• rainfall rate in mm h-1 based on 5 km
thick cloud layer and 0.5 km “bright”band


Goal:• Improve understanding of TC rainfall by
developing global TC rain climatology• Develop methodology to validate model
forecasts of TC rain.
DATA and METHOD:• R estimates from TRMM MI and PR.• 193 storms from December 1997 to
December 1999, yielding >1800 events,from storm to category 4 hurricane.
Develop TC Rain Climatology

50 100 150 200 250 300 350 400 450 5000
1
2
3
4
5
6
7
8
9
10
Range (km)
M EAN R AS FUNCTION OF TC I NTENSITY
>Cat 3
Cat 1-2
TD/TS
Mean

Unique to TPC/NHC• TRMM data available operationally only
since late 1999 season.• Operational aircraft reconnaissance
available in Atlantic (ATL) basin• Main use in fixing TCs without clear eye
when aircraft are unavailable (E of 50°Wor East Pacific basin-EPAC)
• See example for Hurricane Debby (2000)
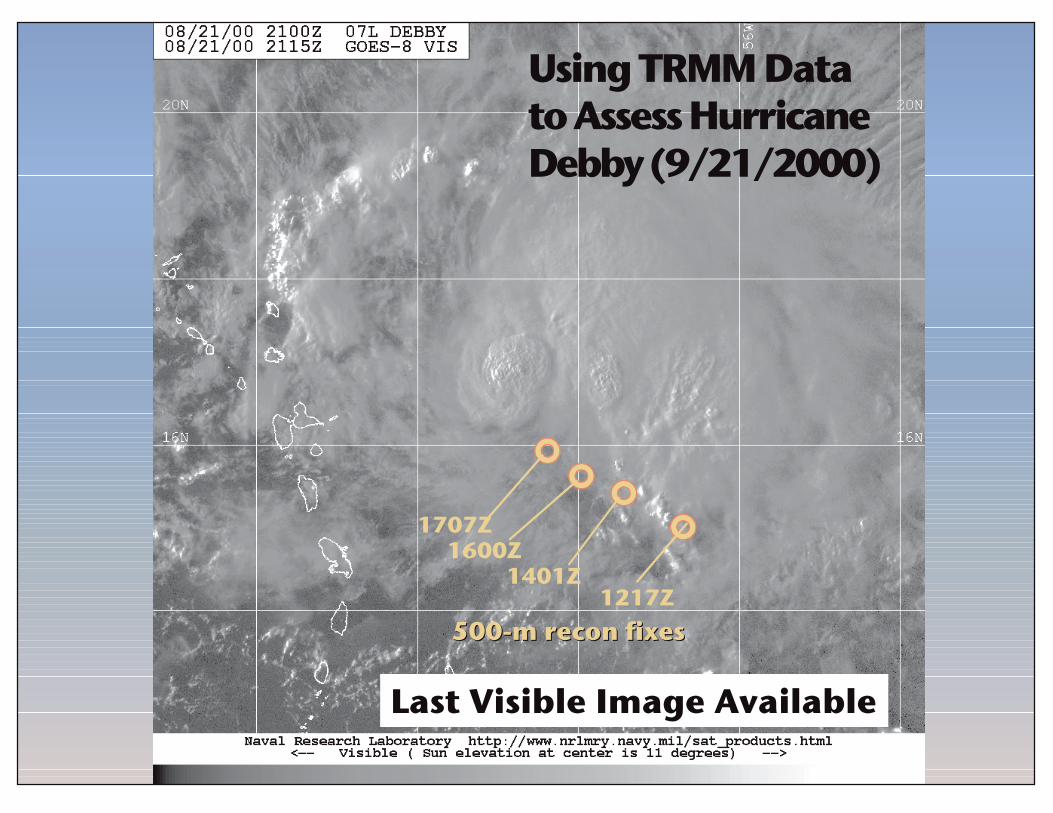
Last Visible Image Available
500-m recon fixes500-m recon fixes1217Z
1707Z
1401Z1600Z
Using TRMM Datato Assess HurricaneDebby (9/21/2000)

2345 UTC IR Image
2346Z 850 mb2346Z 850 mbrecon positionrecon position
500-m recon fixes500-m recon fixes1217Z
1707Z
1401Z1600Z

2333 UTC TRMM 37-H GHz Image
2346Z 850 mb2346Z 850 mbrecon positionrecon position
37 GHz low-level37 GHz low-levelcenter estimatecenter estimate

2333 UTC TRMM 37-V GHz Image
37 GHz low-level37 GHz low-levelcenter estimatecenter estimate
2346Z 850 mb2346Z 850 mbrecon positionrecon position

2333 UTC TMI Rainfall Image
2346Z 850 mb2346Z 850 mbrecon positionrecon position
TMI/rain low-levelTMI/rain low-levelcenter estimatecenter estimate

2333 UTC TRMM 85-GHz PCT Image
2346Z 850 mb2346Z 850 mbrecon positionrecon position
85 GHz PCT mid-level85 GHz PCT mid-levelcenter estimatecenter estimate

2333 UTC TRMM 85 GHzColor Composite Image
85 GHz color mid-level85 GHz color mid-leveleye position estimateeye position estimate
2346Z 850 mb2346Z 850 mbrecon positionrecon position
22/0130Z 850 mb22/0130Z 850 mbrecon fix; pressure fellrecon fix; pressure fell10 mb to 996 mb in10 mb to 996 mb in1.25 h1.25 h
500-m recon fixes500-m recon fixes
1217Z
1707Z
1401Z
1600Z

ZCZC MIATCDAT2 ALLTTAA00 KNHC DDHHMMTROPICAL STORM DEBBY DISCUSSION NUMBER 7NATIONAL WEATHER SERVICE MIAMI FL5 AM EDT MON AUG 21 2000
THE CENTER OF DEBBY IS STILL HARD TO LOCATE. RECENT SATELLITE FIXESNUDGE THE SYSTEM A LITTLE FURTHER WEST THAN THE PREVIOUSPACKAGE...AND NIGHTTIME MULTISPECTRAL IMAGERY HINTS THAT IT MIGHT EVEN BESOUTH OF 15N. IN VIEW OF THIS UNCERTAINTY...THIS PACKAGE CONTAINS ALOT OF CONTINUITY AND EXTRAPOLATION. SOME RE-LOCATION MAY BENECESSARY IN THE NEXT PACKAGE.
THE INITIAL MOTION IS ESTIMATED TO BE 285/16. ... NOTE THAT SOMEADJUSTMENT OF THE INITIAL INTENSITY IS POSSIBLE AFTER AN AIR FORCERESERVE HURRICANE HUNTER ARRIVES AT 12Z.
FORECASTER BEVEN
Ensuing TPC/NHC Discussion

TPC/NHC TRMM Usage• Every system in ATL and EPAC had at least
1 TRMM TC fix (>5% of the 715 advisoriesissued). Total: 37 TCs; 16% TD; 50% TS;34% HUR
• 11 TCs in ATL and EPAC had at least 1forecast package/position modified byTRMM data (note: more modified by SSMIdata because there are 3 DMSP satellites).

SUMMARY• TRMM/TMI 85- and 37-GHz microwave
channels “see” through thick clouds to permitdepiction of low- and mid-level clouds andassist in TC center identification
• TRMM data enables qualitative assessment ofTC strength by depiction of an “obscured” eye
• TRMM data enables a qualitative assessmentof TC intensity trend by analyzing eyewallpatterns
• TRMM MI and PR provide good quantitativeTC rain estimates