trophic relationships between insectivorous birds and
TRANSCRIPT
School of Doctoral Studies in Biological Sciences
University of South Bohemia in České Budějovice
Faculty of Science
Trophic relationships between insectivorous birds and
insect in Papua New Guinea
Ph.D. Thesis
Mgr. Kateřina Tvardíková
Supervisor: Prof. RNDr. Vojtěch Novotný, CSc. Department of Zoology, Faculty of Science, University of South Bohemia
Institute of Entomology, Biology Centre, Czech Academy of Sciences
České Budějovice 2013

This thesis should be cited as:
Tvardíková, K. 2013: Trophic relationships between insectivorous birds and insect in
Papua New Guinea. Ph.D. Thesis Series, No. 9. University of South Bohemia, Faculty
of Science, School of Doctoral Studies in Biological Sciences, České Budějovice,
Czech Republic, 184 pp.
Annotation The thesis describes diversity of birds along a complete altitudinal gradient and in
forest fragments in lowlands of Papua New Guinea. It focuses separately on the
diversity of different feeding guilds, and discusses their links to habitat and food
resources. More specifically, it focuses on forest insectivorous birds, their predation
pressure on arthropods, feeding specializations and preferences, and some of the ways
how insectivores search for food.
Declaration [in Czech] Prohlašuji, že svoji disertační práci jsem vypracovala samostatně pouze s použitím
pramenů a literatury uvedených v seznamu citované literatury. Prohlašuji, že v souladu
s § 47b zákona č. 111/1998 Sb. v platném znění souhlasím se zveřejněním své
disertační práce, a to v úpravě vzniklé vypuštěním vyznačených částí archivovaných
Přírodovědeckou fakultou elektronickou cestou ve veřejně přístupné části databáze
STAG provozované Jihočeskou univerzitou v Českých Budějovicích na jejích
internetových stránkách, a to se zachováním mého autorského práva k odevzdanému
textu této kvalifikační práce. Souhlasím dále s tím, aby toutéž elektronickou cestou
byly v souladu s uvedeným ustanovením zákona č. 111/1998 Sb. zveřejněny posudky
školitele a oponentů práce i záznam o průběhu a výsledku obhajoby kvalifikační práce.
Rovněž souhlasím s porovnáním textu mé kvalifikační práce s databází kvalifikačních
prací Theses.cz provozovanou Národním registrem vysokoškolských kvalifikačních
prací a systémem na odhalování plagiátů, provozovanou Národním registrem
vysokoškolských kvalifikačních prací a systémem na odhalováníplagiátů.
České Budějovice, 30.7.2013
.....................................
Kateřina Tvardíková

This thesis originated from a partnership of Faculty of Science, University of South
Bohemia, and Institute of Entomology, Biology Centre of the AS CR, v.v.i, supporting
doctoral studies in the Zoology study programme.
Entomologický
ústav
Institute
of Entomology
Financial support The studies were financially supported by the Czech Science Foundation Grants
206/09/0115 and 206/08/H044, Czech Ministry of Education ME09082, Grant Agency
of University of South Bohemia 04-136/2010/P, 04-156/2013/P and 04-048/2012/P,
US National Science Foundation DEB-0841885, and was a part of Center of
Excellence for Global Study of Biodiversity and Function of Forest Ecosystems, reg. n.
CZ.1.07/2.3.00/20.0064 co-financed by the European Social Fund and the Czech
Republic.
Acknowledgements I am very grateful to Vojtěch Novotný, the supervisor of my Ph.D. thesis, for giving
me an extraordinary opportunity to work in Papua New Guinea, and for his excellent
guidance. I am thankful to his support during my studies, fruitful discussions and ideas
that significantly improved all manuscripts included in the thesis. Further, I would like
to thank to David Storch, who advised on my ornithological data handling. I am also
glad for his visit in Papua New Guinea, where he has seen my work, and the habitats
where I work. He could therefore understand the conditions and habitats and advise
accordingly.
I am much obliged to all paraecologists at the New Guinea Binatang Research
Center, who greatly supported me during my stay in Papua New Guinea. They made it
possible to collect extensive material used only partly in the thesis, and to be published
during the next years. Especially Bonny Koane contributed extensively to all projects,
and Samuel Jeppy also shared his ornithological experiences, and helped us at the
beginning of the project. I am really thankful to Bonny also for his assistance in
communication with locals, advices on how to deal with problems and following me at
all study sites for long two years. Special thanks then go to the villagers of Kegesugl,
Bruno Sawmill, Sinopass, Bundi, Numba, Kausi, Baiteta, Baitabag, Ohu, Wanang and
Kotet for allowing me to work on their land, and for all the assistants and logistical
support during the projects. Without the help of hundreds of carriers from their
villages, I would not be even able to move my cargo and equipment around.
I am thankful to Jan Lepš for his great support, and for being the first and last
person calling whenever I came from or went to field, and also for his advices on
statistics. Jan Hrček, Tom Fayle and Philip Butterill advised on manuscripts, and on
use of large databases. Bruce Beehler, Eben Goodale and Jack Dumbacher helped with
identification of some birds and their sounds, and Bruce Beehler and Paul Igag
provided training in New Guinean bird vocalization in the field. Carsten Rahbek
advised on the manuscript about altitudinal gradient. I am also thankful to Irena
Klečková, Petr Vlašánek, Tom Fayle and Philip Butterill for friendly office
environment while I stayed in the Czech Republic.
Most importantly, I would like to thank to Legi Sam for his never ending
support, for advices on how to live in Papua New Guinea, for critical comments on my
work, and for being always the more optimistic and crazier half of us. Last, I would
like to thank my family for their love and patience.

List of papers and authors' contributions The thesis is based on the following papers (listed chronologically):
1. Predation on exposed and leaf-rolling artificial caterpillars in tropical forests of
Papua New Guinea. Tvardikova, K., Novotny, V. (2012) Journal of Tropical Ecology
00:1–11 (IF = 1.401)
[KT conceived the study, led fieldwork, analyzed the data and wrote the
manuscript with contributions by VN]
2. Herbivore damage increases avian and ant predation of caterpillars along an
altitudinal forest gradient in Papua New Guinea. Tvardikova, K., Novotny, V.
(Submitted manuscript)
[KT conceived the study, led fieldwork with a help from Bonny Koane, KT
analyzed the data and wrote the manuscript with contributions by VN]
3. Diet of land birds along an altitudinal gradient in Papua New Guinea. Tvardikova,
K., Koane, B., Jeppy, S., Sykorova, J., Novotny, V. (Submitted manuscript)
[KT conceived the study, KT, BK, SJ led fieldwork, KT, JS analyzed the food
samples with contribution of member of research team of VN, KT wrote the
manuscript with contributions by VN]
4. Species richness of birds along a complete rainforest altitudinal gradient in the
tropics. Tvardikova, K., Koane, B., Novotny, V. (Manuscript)
[KT, VN conceived the study, KT led the field work with contribution of BK,
and help from SJ, KT analyzed data with contribution by Carsten Rahbek and David
Storch, VN made comments on draft]
5. Disappearance of birds from forest fragments in Papua New Guinea. Tvardikova, K.,
Koane, B., Novotny, V. (Submitted manuscript)
[KT and VN conceived the study, KT led field work and analyzed the data, BK
contributed to field work, KT analyzed the data and wrote manuscript with
contribution of VN]
6. New avian records and range shifts of birds along altitudinal gradient of Mt.
Wilhelm, Papua New Guinea. Tvardikova, K. (Submitted manuscript)
[KT summarized the data and wrote the manuscript, data resulted from field
work along altitudinal gradient and observations were made by KT, BK, SJ]

Authors: Kateřina Tvardíková [KT] declares that she is the first and corresponding author of all
papers, and with major contributions as stated above. The other authors are:
Bonny Koane [BK] – assistant based at New Guinea Research Center, Papua New
Guinea, trained by KT in bird identification and insect sorting
Samuel Jeppy [SJ] – village assistant based in Wanang Conservation Area, skilled in
bird identification
Jana Sýkorová [JS] – student of Faculty of Science, University of South Bohemia,
trained by KT in food sample sorting, canopy openness photograph analyzes,
contributed also by literature data gathering
Vojtěch Novotný [VN] – supervisor
Co-author agreement: Vojtěch Novotný, the supervisor of Ph.D. thesis and co-author of all presented papers,
fully acknowledges the contribution of Kateřina Tvardíková as the first author and her
major contributions as stated above.
………………………………………
Prof. RNDr. Vojtěch Novotný, CSc.
Author’s other paper not included in the thesis, but related to the topic and cited throughout: Bird abundances in primary and secondary growth in Papua New Guinea: A
preliminary assessment. Tvardikova, K. (2010) Tropical Conservation Science 3(4):
373-388 (IF = 0.54)
CONTENT:
Introduction ....................................................................................................................................................................................................................................................l Materials and methods ....................................................................................................................................................................................................... 9 References .........................................................................................................................................................................................................................................................13 Chapter I ......................................................................................................................................................................................................................................................... 15
Tvardikova, K. , Koane, B., Novotny, V. Species richness of birds along a
complete rainforest altitudinal gradient in the tropics.
(Manuscript)
Chapter II ....................................................................................................................................................................................................................................................... 49 Tvardikova, K. , New avian records and range shifts of birds along altitudinal
gradient of Mt. Wilhelm, Papua New Guinea.
(Manuscript in review)
Chapter III ................................................................................................................................................................................................................................................... 71 Tvardikova, K. , Koane, B., Jeppy, S., Sykorova, J., Novotny, V. Diet of land
birds along an altitudinal gradient in Papua New Guinea.
(Manuscript in review)
Chapter IV ............................................................................................................................................................................................................................................... 107 Tvardikova, K. , Novotny, V. Herbivore damage increases avian and ant
predation of caterpillars along an altitudinal forest gradient in Papua New
Guinea
(Manuscript in review)
Chapter V ................................................................................................................................................................................................................................................... 129 Tvardikova, K., Koane, B., Novotny, V. Disappearance of birds from forest
fragments in Papua New Guinea
(Manuscript in review)
Chapter VI ..................................................................................................................................................................................................................................................161 Tvardikova, K. , Novotny, V. (2012) Predation on exposed and leaf-rolling
artificial caterpillars in tropical forests of Papua New Guinea. Journal of
Tropical Ecology 00:1–11 (IF = 1.4)
(Research paper)
Summary and Appendices ................................................................................................................................................................................... 175


Introduction
1
Trophic relationships between insectivorous birds and insect in Papua New Guinea
INTRODUCTION
Papua New Guinea and its avifauna New Guinea is the world's second largest island, after Greenland, covering a land area
of 922,000 km2. Located in the southwest Pacific Ocean, it lies geographically to the
east of the Malay Archipelago, with which it is sometimes included as part of a greater
Indo-Australian Archipelago. Geologically it is a part of the same tectonic plate as
Australia. When world sea levels were low, the two shared shorelines (which now lie
100 to 140 metres below sea level), combining with lands now inundated into the
tectonic continent of Sahul, also known as Greater Australia. New Guinea provides a
range of habitats from tropical rain forest to glaciers within distances of less than 16
kilometres, a range of altitudes of over 5000 meters, and an equatorial position. The
island is divided into southern and northern watersheds, separated by Central Range. In
addition, New Guinea has 19 outlying mountain ranges (5 of them off-shore) that vary
in size and distance from the Central Range (Diamond 1973). Mainland of New Guinea
is represented by the large lowland rainforest areas (44% of the land lies below 100 m
asl), as well as high mountain areas (27% of the land lies between 1000 to 4500 m asl).
The rugged topography, which isolates populations in adjacent valleys or on
adjacent mountains, has promoted speciation within small areas of a single land mass
by essentially the same mechanisms that underlie speciation on large continents (Hall
2002). The number of nonpelagic bird species on the mainland of New Guinea, 513, is
large enough to give rise to the complex interactions characteristic of continental
faunas, but not so large as to be overwhelming. One of the paradoxes of New Guinea’s
biota is the geographical affinities of the flora against the vertebrate fauna. Whereas
plant genera have closest affinities to Southeast Asia, ornitofauna is closer to
Australian (Beehler et al. 1986, Holt et al. 2013).
Papua New Guinea (PNG) is political Eastern half of the New Guinea island.
Besides the mainland (470,500 km2), PNG also encompasses over 600 small islands
and archipelagos. Mainland of PNG itself houses more than 465 bird species.
Chapters I, II, V and also Tvardikova (2010) represent studies of bird communities at
various sites in Papua New Guinea. Chapter I deals with bird species richness along
Introduction
2
altitudinal gradient in Central Range, chapter II focuses on altitudinal range
distribution of observed species along this gradient and describes some range
extensions and species new for the region. Chapter V and Tvardikova (2010) deal with
bird communities in various habitats in lowland forest.
Altitudinal gradient Mountains have long captivated mankind and have been considered sacred places in
many societies (Bernbaum and Gunnarson 1990), as well as popular destinations for
hiking, skiing and solace. By the nineteenth century, the first naturalists provided the
more detailed observations of how the natural world changes with altitude (Lomolino
2001). In their first voyages around the world, they noted that the types of habitats and
the number of species changed predictably with altitude. Several factors change
predictably with increasing altitude; the most obvious being temperature, decreasing
linearly approximately 0.6°C for each 100 m increase in altitude (Barry 1992).
Tropical mountains, due to higher temperatures at low latitudes, have warmer
temperatures at the base and therefore need to be much taller to reach the extreme cold
temperatures seen on temperate mountains. Other abiotic factors that vary predictably
with altitude are air pressure, which decreases with increasing altitude, and solar
radiation, which increases with increasing altitude. Other climatic and abiotic factors
vary along montane gradients but have a more complex relationship to altitude.
Probably most important of such factors is precipitation, which is in the form of rain,
snow and condensation from clouds. Tropical mountains show variable patterns, either
with highest precipitation at middle altitudes or monotonously increasing precipitation
with altitude. Some mountains show little variation in precipitation (Barry 1992). Most
altitudinal gradients have a more or less stable condensation zone (cloud zone) at a
certain level, especially conspicuous in the tropics, causing favourable conditions for
certain taxa (e.g. epiphytes at mid-altitudes, which in turn create microhabitats and
food for other taxa; Rahbek 1995).
Based on the first results from tropical regions in 1970s and 1980s, decreasing
altitudinal diversity became the accepted and assumed pattern for all taxonomic groups
for more than two decades (e.g. Brown and Lomolino 1998), and the unimodal
altitudinal patterns observed by few naturalist were largely forgotten (McCain 2010).
The uniformity of decreasing richness on altitudinal gradients was challenged by
Rahbek (1995). Rahbek (1995) and later McCain (2007, 2009, 2010) described the
main species richness patterns and presented series of studies showing possible causes.
Altitudinal patterns in species richness fall into four common patterns:
decreasing, low plateau, low plateau with a mid-altitudinal peak and mid-altitudinal

Introduction
3
peak (Figure 2 in McCain 2009). Rahbek (1995) concluded that species richness
patterns may differ between taxa as well as within taxa between different regions, and
within the same region, at least on a regional scale.
Large number of hypotheses has been proposed to explain trends in species
richness (Gaston 2000). Many of them are not mutually exclusive, while others hardly
offer more substantial explanation. Some of them seem to have high explanatory power
for plants, but lower for animals (Gaston 2000). While different taxa show various
patterns based on their ecological requirements, one could expect the same to be true
for different feeding guilds varying in their requirements and adaptations to habitats
and climatic conditions. I therefore found of interest to examine the patterns of species
richness of birds partitioned into trophically different groups.
Chapter I deals with overall bird species diversity patterns along a complete
altitudinal gradient in Central Range of Papua New Guinea, and focuses on the
patterns of trophically different guilds (insectivores, herbivores and omnivores).
Chapter II then reveals altitudinal range shifts and range extensions, and summarizes
list of species for the region.
Fragmentation in lowland areas Extensive lowland regions represent second dominant feature of New Guinea.
Fragmentation was a feature of lowland forests even before humans became a
predominant influence. Semi-permanent open spaces resulted from the dynamic
interactions of tree fall gaps provided by old aged trees, wind throw events, floods or
landslides. Permanent open spaces in the woodland cover were maintained along river
valleys, lakes, wetlands and cliffs (Dennis 1997).
Human influence has grown, and total forest cover declined during the last
centuries in most of the areas of the world. Land use change and habitat fragmentation
mainly caused by human activities exceeded natural limits. Population growth is often
used as a proxy for land use change (Kok 2004). The New Guinea is not an exception;
however the lowlands offer a different picture. The lowlands have the highest
incidence of human malaria outside of Africa, and malaria is probably the main factor
contributing to the low population density of ca 6 people/km2 (Riley 1983). The New
Guinea lowlands can thus be considered as ecologically marginal environment for
human habitation lacking access to comparatively advanced technology, and this
explains why they remain largely forested till today. The average size of traditional
garden resembled in size the natural gaps caused by landslides and wind throws. The

Introduction
4
limited damage done by forest-dwelling populations to lowland forests also appears to
be a consequence of technological impotence than of free choice.
The replacement of stone axes by steel ones, and these in turn by chainsaws,
has finally provided the lowland communities with the efficiency to pursue the
developmental trajectory already charted by their highland neighbours several
thousand years ago. ‘There is little robust evidence that . . . ‘‘traditional’’ societies . . .
have been natural conservationists. On the contrary, wherever people have had the
tools, techniques, and opportunities to exploit natural systems they have done so’
(Oates 1999). Human population growth in Papua New Guinea is very fast [from 2.3
million people in 1975 to 5.2 million in 2000 and to 7.1 million in 2012, National
Census Data, and Ningal et al. (2008)]. Since 85% of the population relies on
subsistence agriculture, population growth affects agricultural land use. Most new
agricultural land was taken from primary forest and the forest area decreased from 9.8
ha person-1 in 1975 to 4.4 ha person-1 in 2000.
Those activities turned the structure of Madang district lowland forest inside
out – from the extensive cover of primary lowland forest with occasional small-scale
gaps (natural or man made) into a large scale secondary growths and plantations with
fragments of primary forest. The changes happening in Madang lowlands are rather
fast. This fact could significantly influence the assemblages of organisms adapted to
more certain natural conditions. For example in forests, some species prefer the open
habitats created by the death of a tree or harvesting of trees, while the other avoid such
habitats. Some authors believe that the organisms originating in areas with relatively
low and small scale natural disturbance (which is the case for Madang lowlands) will
be much strongly dependent on closed undisturbed habitats than the species form areas
with severe and frequent habitat disturbances (e.g. hurricane disturbance in South
America, not so recent large-scale gardening and logging; Pickett 1985).
Forest fragmentation affects the composition of forest bird communities,
especially in the humid tropics where the rates of forest destruction are high and where
birds are generally more specialized in their foraging tactics, live in more specific
habitats, and need larger territories than in temperate forests (Stouffer and Bierregaard
1995, Hagan et al. 1996). Different bird species react differently to deforestation
(Hagan et al. 1996) and forest understory insectivores, in general, have high habitat
specificity, low mobility, and are more confined to forest interior than other forest
passerine guilds, especially in the tropics where forest fragmentation and its
consequences are most dramatic (Sekercioglu 2002, Sekercioglu et al. 2002). Other
authors reported also large frugivores to be sensitive to habitat change (Lees and Peres
2010, Sekercioglu 2012).
Introduction
5
Although over a dozen hypotheses have been proposed to explain the
disappearance of insectivorous bird species from forested habitats around the world
(Canaday 1996, Ford et al. 2001), four of these are particularly relevant: 1. The food
scarcity hypothesis states that small fragments are impoverished in prey preferred by
understory insectivores (Burke and Nol 1998, Zanette et al. 2000, Ford et al. 2001). 2.
The microclimate hypothesis proposes that these birds are particularly sensitive
physiologically to changes in microclimate associated with forest fragmentation (Karr
and Freemark 1983, Canaday 1996). 3. The habitat specificity hypothesis states that the
loss of some microhabitat elements (such as army ant swarms, curled leaves, and dead
trees) from fragments may affect many understory insectivores negatively (Canaday
1996, Ford et al. 2001). 4. According to the limited dispersal hypothesis, understory
insectivores may less likely disperse into more favourable habitats after forest
fragmentation because of their relatively sedentary habits and possible psychological
avoidance of clearings (Stouffer and Bierregaard 1995, Báldi 1996); and may therefore
disappear from fragments as a result of stochastic events and other negative
consequences of fragmentation.
In chapter V, I deal with the effect of forest fragmentation on avifauna in lowlands of
Papua New Guinea. I focus on patterns of trophically independent guilds (insectivores,
frugivores and omnivores), and more intensively on insectivores which seems to be the
most susceptible to habitat change (which can be seen also in chapter I and in
Tvardikova 2010). In chapter VI , I discuss the predation pressure of insectivorous
birds on herbivorous insect in different habitats in those lowland sites.
Insectivorous birds
Why should be insectivorous birds different? The answer to this question seems to be
compounded of several aspects. While the fruits and flowers can be carried on a plant
in only limited number of ways, insect can conceal themselves or escape by a great
variety of means. Diamond (1973) has shown that fruit-eating birds in south Pacific
sort mainly by size, while, in contrast, it is routine to find several like-sized
insectivores sharing the same habitat and segregating by subtle behavioural differences
and searching techniques. The simple fact, that most avifaunas contain much larger
numbers of insectivorous species and families, testify to the morphological
specialization that can be effectively employed in pursuit of insect prey (Terborgh
1977).
Terborgh (1977) reported that tropical avifauna can be fairly discretely
partitioned into three tropically distinct subdivisions: insectivores, frugivores

Introduction
6
(including granivores) and nectarivores, and that only minority of species feed on
nearly equal mixtures of insect and fruits, or fruit and nectar. The opposite seems to be
true, and many tropical species are reported to take much wider range of items. The
question about the specialism, generalism or plasticity of food preferences were always
of interest of avian ecologists. Many of them did not come with strong conclusions.
Not only do species differ in their use of resources through time and in different places,
but the extent to which they specialize or generalize in their use of resources may
change. Often these changes are associated with seasonal or local patterns of prey
abundance.
Some authors demonstrated that it was potentially misleading to characterize a
species as either a foraging specialist or generalist without defining the resources being
used, describing the spatial scale of the measurements made, and presenting some
measure of the degree of individual variation within the population studied.
The diet of tropical bird species, including species in New Guinea, is
particularly poorly known (Collins et al. 1990; Karr and Brawn 1990; Loiselle and
Blake 1990). The feeding preference for most tropical bird species is usually inferred
from a few individual observations; stomach contents of specimen collected for
museums, or are totally unknown. Quantitative data on their diet are nevertheless
important for the understanding of food webs in bird communities (Poulin et al.
1994a), and possible bird impact on their food (e.g. seed distribution) or prey (e.g.
pest) regulation.
In chapters III and V, I tried to identify food specialization of common bird species
occurring in Papua New Guinea, and get better insight into their food preferences and
food exploited in different habitats.
Insectivorous birds as predators of arthropods Insectivorous birds are common in ecosystems throughout the world, and numerous
studies have shown that they can affect the population sizes of insects and other small
arthropods (e.g. Holmes 1979; Fowler et al. 1991; Williams-Guillén et al. 2008). There
is a direct conflict between the need of insectivorous birds to feed upon arthropods, and
the need of arthropods to survive and feed themselves (mostly on plants). Arthropods
therefore use a range of defences to protect themselves against attacks (e.g. Schmidt
1990), and birds try to overcome them.
When first confronted with the huge complexity and magnitude of tropical
forest, I was wondering how the insectivorous birds deal with the primary condition of
their survival – to find the food (i.e. arthropods) there. Having in mind the relative
Introduction
7
scarcity of arthropods in tropical forest, I was also interested in the chances of
arthropod for their survival (or death in beaks of insectivorous birds). I experimentally
studied those questions in chapters IV and VI .
Possible ways for birds to detect arthropods The two primary sensory mechanisms that birds may use to detect plants carrying
herbivores are vision and olfaction. One hypothesis is that vision can be important in
detecting herbivores at both long and short distances, while use of olfaction may be
useful mainly closer to the damaged plants, but the mechanism is not well known.
Visual Birds can naturally use visible feeding marks in leaves or qualitative structural
differences as cues to find arthropods (Heinrich & Collins 1983; Mols & Visser 2002;
Boege & Marquis 2006; Müller et al. 2006; but see Bergelson & Lawton 1988), as
most of the arthropods are herbivores. Also non-herbivore arthropods (e.g. spiders) are
known to be attracted more to the leaves where the herbivory damage is going on, and
they can find there more food for themselves, but also risk higher exposition to own
predators. Visible marks of presence of arthropods could be herbivorous damage,
excrements, or changes in leaf reflectance.
In addition to their broad range of vision (315 – 700 nm), diurnal birds can
distinguish a large scale of chromatic variation; thus they see colours differently and
with more shades than humans (Cuthill 2006). This is because birds have four cone cell
types and colour-vision-enhancing oil droplets in their eyes, giving rise to a
tetrachromatic form of vision in which every perceived colour consists of red, green,
blue and ultraviolet (UV, 315 – 400 nm) components. In comparison, humans have
only three cone cell types and trichromatic vision, lacking the UV part visible to birds
(Cuthill 2006; Jones et al. 2007). The UV vision of birds may be a good candidate for
the mechanism behind the attraction of birds to plants suffering from herbivore
defoliation, as several bird species are known to use it for instance during foraging
(e.g. Church et al. 1998; Honkavaara et al. 2002; Viitala et al. 1995). Additionally,
insect herbivory induces the production of defence chemicals (Haukioja 2003), such as
flavonoids, which are visible in UV wavelengths (Valkama et al. 2003).
Olfaction In contrast to vision, the olfactory ability of most birds, including passerines, was long
thought to be negligible (Roper 1999). Recent studies, however, have shown that
passerines can make use of olfaction in many situations, such as in aromatising nests

Introduction
8
(Petit et al. 2002; Mennerat et al. 2005; Gwinner & Berger 2008; Mennerat 2008) and
in predator recognition (Amo et al. 2008; Roth et al. 2008). Many invertebrate
predators in tritrophic systems use VOCs produced by plants to detect and locate their
prey (Turlings et al. 1990; Dudareva et al. 2006). Novel VOCs emitted by herbivore-
damaged plants may be the first indicators of herbivore presence to predators. It is
therefore possible that olfaction may also be utilised by birds in receiving signals from
plants. Physiological and genetic evidence confirm the olfaction ability of birds.
Steiger et al. (2008) studied nine bird species (Blue Tit Cyanistes caeruleus, Black
Coucal Centropus grillii, Brown Kiwi Apteryx australis, Canary Serinus canaria,
Galah Eolophus roseicapillus, Red Junglefowl Gallus gallus, Kakapo Strigops
habroptilus, Mallard Anas platyrhynchos, and Snow Petrel Pagodroma nivea) and
found that they all had more active olfactory receptor genes than had previously been
assumed. It thus seems that birds can detect smells much better than has previously
been thought.
Aims of the thesis
In this thesis, I studied the factors driving distribution of birds across different habitats
in Papua New Guinea. First, I focused on a complete forest altitudinal gradient, and
aimed to describe patterns of bird species distribution, and further analyzed the factors
driving them. I approached the question both for all bird species as well as different
feeding guilds. Later, I focused on similar questions in forest fragments (and altered
habitats in Tvardikova 2010) in lowlands of Papua New Guinea. In both cases, I found
different patterns of diversity and abundance for insectivorous birds that for the other
feeding guilds. Namely, insectivores were more sensitive to microhabitat, and changes
in habitat structure. Therefore, I further focused on the insectivorous birds in more
detail, and analyzed food specializations of the common species of the birds observed
along altitudinal gradient and in forest fragments. My aim was to determine feeding
specializations of birds more precisely, analyze the food preferences, find out the most
important arthropods taken by insectivorous birds, and identify possible trend in food
specialization which could help me to understand the patterns in diversity observed
along altitudinal gradient. With the similar goal, I conducted predation experiments
along altitudinal gradient, where I studied predation pressure from insectivorous birds
(and other predators) on Lepidoptera larvae. In this experiment, I also studied whether
passerine birds are attracted to herbivore-damaged trees, or whether leaf-rolling
Lepidoptera larvae are better protected than free living individuals
Materials and methods
9
MATERIALS AND METHODS
In this chapter, I briefly introduce the methods used in the studies included in the thesis
(chapters I – VI ). Overview of the methods used in individual studies is summarized in
Table 1. More detailed accounts of the methods can be found in individual chapters.
All studies were carried out in Papua New Guinea. Studies I – IV were carried
along rainforest altitudinal gradient on the slopes of Mt Wilhelm (4509 m asl) in the
Central Range, spanning from the lowlands floodplains of the Ramu river (200 m asl,
S5° 44’ E145° 20’) to the tree line (3700 m asl, S5° 47’ E145° 03’). Studies V and VI
were carried out mainly in lowland rainforest of Madang province, in continuous forest
(Wanang 3 site), forest fragments of different size (Baiteta, Baitabag, Ohu sites),
secondary forest (Wanang 1 site), and primary forest at the altitude of 1700 m asl was
surveyed in study V.
Bird survey Bird communities were surveyed by 3 types of censuses at all experimental sites –
point counts, mist-netting and random walks through the area. Point counts were
always carried out at 16 points regularly spaced along a 2250 m transect (successive
points were 150 ± 5 m apart to avoid overlap). All birds seen or heard were recorded in
the following radial distance classes in meters: 0 - 10, 11 - 20, 22 – 30, 31 – 40, and 41
– 50. Birds estimated to be beyond 50 m were not recorded for analyzes, but noted for
complete checklists (chapter II ). We started censuses 15 min before the day break (to
standardize across altitudes, sites and seasons), at a randomly selected the starting point
and the direction of walk. Each count lasted 15 minutes so that all 16 points were
surveyed before 11 am.
Further, we mist-netted birds into 200 m long line of nets (using nets 2.5 m
high x 12-18 m long, mesh 16 mm) from 5:30 am to 5:30 pm daily, with regular checks
every 20 minutes. All mist-nets were moved to a new location (~300 m apart from first
location) after every 3 days.
Finally, we randomly walked (2 km-h) along point-count transects, and
surrounded area and recorded all individual birds seen or heard within 50 meters
radius.
Bird’s food sampling Food samples were obtained from mist-netted birds by administering tartar emetic
following method by Poulin et al. (Poulin et al. 1994b; Poulin et al. 1994c; Poulin and
Lefebvre 1995). Immediately after the capture, birds were given 0.8 cm3 of 1.5%
Materials and methods
10
antimony potassium tartar per 100g of body mass. I lowered the concentration from
1.5% to 1.0% for birds smaller than 10 g according to recommendations (Poulin and
Lefebvre 1995). The solution was given orally through a flexible plastic tube attached
to a 1-cc syringe. After administration, the birds were placed in a special “regurgit-
bowl” covered by dark cloth. I examined each food sample (defined as regurgitated
food of a single bird individual) under a dissecting scope. The number of arthropod
individuals per morphospecies was assembled from body parts found in the sample.
Most of the arthropods were fragmented, and their identification was thus based on the
least digestible and most characteristic parts (guide available online
http://tvardikova.weebly.com/downloads.html). Individual arthropods were identified
to morphospecies (i.e. morphologically identical prey categories assumed to represent
one species), and classified to orders or families where possible. Analyzes were also
based on the classification of arthropods into the higher taxa listed in original articles.
Caterpillar experiments I used artificial caterpillars exposed on the study trees to monitor attacks by natural
enemies. Caterpillars were made from natural-looking dark green colour modelling
clay (Koh-I-Noor Hardtmuth brand), which is malleable, oil-based and non-toxic. We
modelled artificial caterpillars by pressing the plasticine through a syringe to ensure
that each caterpillar had an absolutely smooth surface. Artificial caterpillars were 15
mm long and 3 mm in diameter, matching in body size locally common crambid and
tortricid caterpillars, and also matching the median caterpillar size in the entire
caterpillar community (Novotny and Basset 1999), as well as the size of caterpillar
most commonly taken by birds. Each experiment was conducted along a single 2250 m
long transect at each study site. Thirty sampling points, represented by individual trees,
were spaced at approximately 75 m intervals along transect. This spacing ensured that
the experimental trees could be considered independent. Artificial caterpillars were
placed on each tree, between 2.5 and 4 m above the ground. They were pinned on the
young leaves in various ways (see chapter IV and VI for more details). Each
caterpillar was inspected at 24-h intervals for five (or six) consecutive days and
carefully examined for characteristic bite marks (see Appendix 3 or
http://tvardikova.weebly.com/downloads.html for identification guide). Missing
caterpillars were excluded from the analyses as their status could not be ascertained.
All missing caterpillars and caterpillars with marks of attack were replaced by new
ones, pinned to approximately the same locations.

Materials and methods
11
Arthropod survey We sampled the arthropod communities from ten tree saplings at each site. Crowns of
ten tree sampling (DBH ~5 cm) were lowered above mosquito net, covered by net and
sprayed by commercial insecticide. All arthropods were collected and placed in 70%
alcohol. Arthropods were further identified into orders, counted and measured into
nearest 0.1 mm. All leaves were collected, weighted and leaf area was measured in leaf
frames, and arthropod abundances were related to leaf area or leaf weight.
We surveyed ant communities occurring on experimental trees by observation
and hand collection, as well as using tuna baits. Observation of ant activity was
performed prior to the exposure of caterpillars. The trunk of each tree was examined
for 10 minutes, all foraging ant individuals were counted and voucher specimens were
taken for identification. Commercial canned tuna was used in baits, which is a standard
method in the studies of foraging ant communities (Janda and Konečná 2011). One tea
spoon of tuna was placed as bait under a stripe of gauze at breast height at each
experimental tree. Baits were inspected one and three hours following their exposure.
All ants present were counted and voucher specimens for each species were collected
without disturbing the remaining ants.
Other arthropod data reported in studies were obtained by colleagues by
various methods described in individual chapters.
Vegetation survey At each point-count point, we measured the following variables according to methods
in Bibby et al. (1992) (all estimates made by KT): shrub and canopy height (3
measures per point, using laser pointer); shrub density (using scatter plots, 5 measures
per point); percentage of ground covered by grass, bare ground and litter (15 measures
in 1x1 m square per point); percentage of point covered by shrub (5 measures per
point); canopy openness (5 photos taken per point – analyzed in Gap Light Analyzer;
Frazer 1999, Frazer et al. 2001). In each site, we had data loggers (Comet System)
recording humidity and temperature every hour.
Study IV: In each site we conducted three 150 x 1 m lines (between points 3-4,
6-7, 12-13) where we counted all trees (DBH >1 cm), and categorized them into three
size classes based on diameter at breast height (dbh): trees ≤ 7 cm, trees > 7–15 cm,
and trees > 15 cm. We also categorized the leaf size of trees (as small, middle, large).
Study I: Botanical surveys were completed in three plots 20 x 20 meters at
each altitude, and all plants (DBH > 5 cm) were tagged and identified by team of
botanists (The New Guinea Binatang Research Center and PNG Forest Research
Institute Lae)
Materials and methods
12
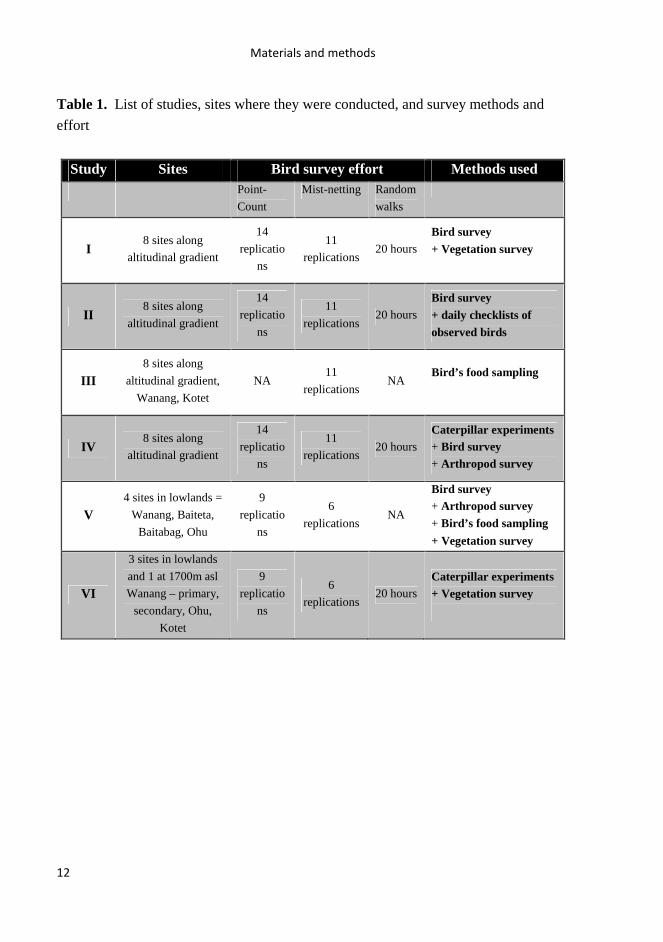
Table 1. List of studies, sites where they were conducted, and survey methods and
effort
Study Sites Bird survey effort Methods used Point-
Count
Mist-netting Random
walks
I 8 sites along
altitudinal gradient
14
replicatio
ns
11
replications 20 hours
Bird survey + Vegetation survey
II 8 sites along
altitudinal gradient
14
replicatio
ns
11
replications 20 hours
Bird survey + daily checklists of observed birds
III 8 sites along
altitudinal gradient,
Wanang, Kotet
NA 11
replications NA
Bird’s food sampling
IV 8 sites along
altitudinal gradient
14
replicatio
ns
11
replications 20 hours
Caterpillar experiments + Bird survey + Arthropod survey
V 4 sites in lowlands =
Wanang, Baiteta,
Baitabag, Ohu
9
replicatio
ns
6
replications NA
Bird survey
+ Arthropod survey
+ Bird’s food sampling
+ Vegetation survey
VI
3 sites in lowlands
and 1 at 1700m asl
Wanang – primary,
secondary, Ohu,
Kotet
9
replicatio
ns
6
replications 20 hours
Caterpillar experiments + Vegetation survey
References
13
References: Báldi, A. 1996. Edge effects in tropical versus temperate forest bird communities: three
alternative hypotheses for the explanation of differences. Acta Zoologica Academiae Scientarum Hungaricae 42:163-172.
Barry, R. G. 1992. Mountain weather & climate. Psychology Press. Beehler, B. M., T. K. Pratt, and D. A. Zimmerman. 1986. Birds of New Guinea.
Princeton University Press. Bernbaum, E. and L. Gunnarson. 1990. Sacred mountains of the world. Sierra Club
Books San Francisco. Bibby, C. J., Burgess, N. D., Hill, D. A., Mustoe, S. H. 1992. Bird census techniques.
Academic Press, London. Brown, J. and M. Lomolino. 1998. Biogeography. Sinauer. Sunderland, pp.624. Burke, D. M. and E. Nol. 1998. Influence of food abundance, nest-site habitat, and
forest fragmentation on breeding ovenbirds. The Auk: 96-104. Canaday, C. 1996. Loss of insectivorous birds along a gradient of human impact in
Amazonia. Biological Conservation 77:63-77. Dennis, P. 1997. Impact of forest and woodland structure on insect abundance and
diversity. Forests and insects 18:321. Diamond, J. M. 1973. Distributional Ecology of New Guinea Birds Recent ecological
and biogeographical theories can be tested on the bird communities of New Guinea. Science 179:759-769.
Ford, H. A., G. W. Barrett, D. A. Saunders, and H. F. Recher. 2001. Why have birds in the woodlands of Southern Australia declined? Biological Conservation 97:71-88.
Frazer, G. W., Canham, C. D., Lertzman, K. P. 1999. Gap Light Analyzer (GLA), Version 2.0. Pages Imaging software to extract canopy structure and gap light transmission indices from true-colour fisheye photographs, users manual and program documentation. Institute of Ecosystem Studies, Millbrook, New York., Burnaby, British Columbia.
Frazer, G. W., R. A. Fournier, J. A. Trofymow, and R. J. Hall. 2001. A comparison of digital and film fisheye photography for analysis of forest canopy structure and gap light transmission. Agricultural and Forest Meteorology 109:249-263.
Gaston, K. J. 2000. Global patterns in biodiversity. Nature 405:220-227. Hagan, J. M., V. Haegen, W. Matthew, and P. S. McKinley. 1996. The early
development of forest fragmentation effects on birds. Conservation Biology 10:188-202.
Hall, R. 2002. Cenozoic geological and plate tectonic evolution of SE Asia and the SW Pacific: computer-based reconstructions, model and animations. Journal of Asian Earth Sciences 20:353-431.
Holt, B. G., Lessard, J.-P., Borregaard, M. K., Fritz, S. A., Araújo, M. B., Dimitrov, D., Fabre, P.-H., Graham, C. H., Graves, G. R. & Jønsson, K. A. 2013. An update of Wallace’s zoogeographic regions of the world. Science 339:74-78.
Karr, J. R. and K. E. Freemark. 1983. Habitat selection and environmental gradients: dynamics in the" stable" tropics. Ecology: 1481-1494.
Kok, K. 2004. The role of population in understanding Honduran land use patterns. Journal of Environmental Management 72:73-89.

References
14
Lees, A. C. and C. A. Peres. 2010. Habitat and life history determinants of antbird occurrence in variable sized Amazonian forest fragments. BIOTROPICA 42:614-621.
Lomolino, M. V. 2001. Elevation gradients of species-density: historical and prospective views. Global Ecology and Biogeography 10:3-13.
McCain, C. M. 2007. Could temperature and water availability drive elevational species richness patterns? A global case study for bats. Glogal ecology and biogeography 16:1-13.
McCain, C. M. 2009. Global analysis of bird elevational diversity. Global Ecology and Biogeography 18:346-360.
McCain, C. M., Grytnes, J.-A. 2010. Elevational gradients in species richness.in J. W. Sons, editor. Encyclopedia of Life Sciences. John Wiley & Sons, Chichester.
Ningal, T., A. Hartemink, and A. Bregt. 2008. Land use change and population growth in the Morobe Province of Papua New Guinea between 1975 and 2000. Journal of Environmental Management 87:117-124.
Oates, J. F. 1999. Myth and reality in the rain forest: How conservation strategies are failing in West Africa. Univ of California Press.
Pickett, S. T. 1985. The ecology of natural disturbance and patch dynamics. Academic press.
Rahbek, C. 1995. The elevational gradient of species richness: a uniform pattern? Ecography 18:200-205.
Riley, I. D. 1983. Population change and distribution in Papua New Guinea: an epidemiological approach. Journal of Human Evolution 12:125-132.
Schmidt, J. O. 1990. Insect defenses: adaptive mechanisms and strategies of prey and predators. SUNY Press.
Sekercioglu, C. 2012. Bird functional diversity and ecosystem services in tropical forests, agroforests and agricultural areas. Journal of Ornithology 153:153-161.
Sekercioglu, C. H. 2002. Forest fragmentation hits insectivorous birds hard. Directions in Science 1:62-64.
Sekercioglu, C. H., P. R. Ehrlich, G. C. Daily, D. Aygen, D. Goehring, and R. F. Sandi. 2002. Disappearance of insectivorous birds from tropical forest fragments. Proceedings of the National Academy of Sciences of the United States of America 99:263-267.
Stouffer, P. C. and R. O. Bierregaard. 1995. Use of Amazonian forest fragments by understory insectivorous birds. Ecology 76:2429-2445.
Terborgh, J. 1977. Bird species diversity on an Andean elevational gradient. Ecology 58:1007-1019.
Tvardikova, K. 2010. Bird abundances in primary and secondary growths in Papua New Guinea: a preliminary assessment. Tropical Conservation Science 3:373-388.
Zanette, L, Doyle, P, Tremont, and M. S. 2000. Food shortage in small fragments : Evidence from an area-sensitive passerine. Ecology 81:1654-1666.
15
Chapter I Species richness of birds along a complete rainforest altitudinal gradient in
the tropics
Katerina Tvardikova, Bonny Koane, Vojtech Novotny
(manuscript)

Chapter I
16
Chapter I
17
Species richness of birds along a complete rainforest altitudinal gradient in the tropics
Katerina Tvardikova1,#, Bonny Koane2, Vojtech Novotny1
1 Faculty of Science, University of South Bohemia and Biology Center, Czech
Academy of Sciences, Institute of Entomology, Branisovska 31, 370 05 Ceske
Budejovice, Czech Republic 2 The New Guinea Binatang Research Center, Madang, Papua New Guinea #Corresponding author - Email: [email protected]
ABSTRACT
Aim We examine whether available area, regional species pool, mid-domain effect,
contemporary climate, or habitat complexity determine species richness of birds along
a complete, undisturbed forest altitudinal gradient in tropics. Further we investigate
whether patterns of species richness of herbivores, insectivores, and omnivores are the
same along the gradient.
Location Rainforest altitudinal gradient on the slopes of Mt. Wilhelm (4509 m a.s.l.)
in the New Guinea Central Range, spanning from the lowlands floodplains of the
Ramu river (200 m a.s.l., S5° 44’ E145° 20’) to the tree line (3700 m a.s.l., S5° 47’
E145° 03’).
Methods Data on bird communities were collected at eight sites during three
independent surveys – in dry and wet seasons during two years. Birds were recorded
by three standardized methods – point counts, mist-netting and random walks
throughout a standardized area. Five predictors of diversity were tested, including all
sets of their interactions. Habitat complexity (e.g. shrub density, tree height, plant
richness) and contemporary climate (local temperature and humidity), were locally
measured, area available at altitudinal belts was obtained using GIS software, regional
species pool was determined from literature and mid-domain effect was simulated from
empirical ranges.
Results Birds display monotonous decline in species richness with altitude. This
decline is driven by herbivorous birds, whose species richness decreases steeply
between 700 m and 1200 m a.s.l., while species richness of insectivorous birds exhibits
a plateau from 200 to 1700 m a.s.l. The observed patterns of species richness were best
explained by habitat complexity for all bird species and for insectivorous birds, whilst
climate was best predictor for herbivorous birds.
Main conclusion The avian species richness corresponded well to climate, habitat
complexity, and regional species pool. On the other hand, available area and mid-
Chapter I
18
domain effect both represent sources of error rather than mechanisms underlying these
avian diversity patterns.
Keywords
Avian, altitudinal gradient, diversity, humidity, temperature, species richness, climate,
mid-domain effect, indirect effect, habitat complexity
INTRODUCTION
Altitudinal gradients provide striking patterns in diversity, an attractive setting for
biodiversity studies, and serve as a heuristic tool and natural experiment in the study of
community ecology (Lomolino, 2001; Rahbek, 2005; Nogués-Bravo et al., 2008;
Sanders & Rahbek, 2011). Virtually all plant and animal taxa respond to altitudinal
gradients, but species richness patterns greatly vary among individual taxa, reflecting
their ecology (Rahbek, 1995; Gaston, 2000). Many individual patterns have been
variously defined and named but they cluster to four principal types: (i) declining
species richness with altitude, (ii) a plateau at low altitudes (< 300 m a.s.l.) followed by
decline, (iii) a plateau at low to middle altitudes followed by decline, and (iv) a mid-
altitude peak in species richness (Rahbek, 1995; Rahbek, 1997; McCain, 2007;
McCain, 2009; McCain, 2010). Rarely, species richness increases with altitude along
complete gradients (e.g. for salamanders and lichens; Martin, 1958; Wake et al., 1992;
Grytnes et al., 2006). Understanding such patterns and their underlying mechanisms is
critically important for conservation efforts (Hunter & Yonzon, 1993), especially in
montane regions which are likely to be especially threatened by climate change, and
regions that have been generally un- or under-explored by biologists.
Large number of hypotheses has been proposed as determinants of species
richness, and any of them are not mutually exclusive. Based on high correlations with
species richness, contemporary climate and energy variables (e.g. precipitation,
temperature and/or evapotranspiration) often explain spatial variation in species
richness better than any other, non-climatic, variables (Hawkins et al., 2003; Currie et
al., 2004; McCain, 2009). However, a number of other factors have been also
correlated with observed patterns of species richness, including habitat complexity and
foliage stratification (MacArthur & MacArthur, 1961), regional and evolutionary
history (e.g. Rahbek & Graves, 2001; Jetz & Rahbek, 2002), regionally available area
(Rahbek, 1997), regional species pool (Cornell & Lawton, 1992), mid-domain effect
(Colwell & Lees, 2000) or even sampling effort (McCain, 2010).
The relationships between species richness and contemporary climate are less
pronounced for animals than plants (Rahbek & Graves, 2001; Jetz & Rahbek, 2002).
Chapter I
19
Indirect effect of energy on animals through trophic interactions is a likely explanation,
instead of direct physiological limitations. This assumes that species richness of
animals is determined by the abundance, distribution and diversity of food resources,
i.e. plant biomass for herbivores, fruits for frugivores (Kissling et al., 2007), and
various prey for carnivores. However, trophically and ecologically different species
from the same taxon (e.g. carnivorous and herbivorous birds) are often combined
together in studies on species richness along altitudinal gradients while their response
to climate productivity or habitat characteristics could differ, obscuring thus the link
between diversity and contemporary climate.
In this study, we examine bird species richness along one of the few complete
rainforest undisturbed altitudinal gradients in the tropics, using constant sampling
effort at all altitudes. Present data comes from Mt. Wilhelm altitudinal gradient in
Papua New Guinea, a region surveyed poorly for birds in the past. We examine
whether the observed species richness pattern could be determined by available area,
regional species pool, mid-domain effect, contemporary climate, or habitat complexity.
To disentangle the effect of these factors on bird species with different ecologies, we
use species richness partitioned into three feeding guilds – insectivores, herbivores, and
omnivores.
MATERIALS AND METHODS
Our study was performed on the slopes of Mt. Wilhelm (4509 m a.s.l.) in the Central
Range of Papua New Guinea. The complete rainforest gradient spanned from the
lowland floodplains of the Ramu river (200 m a.s.l., S5° 44’ E145° 20’) to the
timberline (3700 m a.s.l., S5° 47’ E145° 03’; Fig. S1). The study was completed along
a 60 km long transect with eight sites, evenly spaced at 500 m altitudinal increments.
Average annual precipitation is 3288 mm (local meteorological station) in the
lowlands, rising to 4400 mm at 3700 m a.s.l., with a distinct condensation zone around
2500 – 2700 m a.s.l.. Mean annual temperature decreases from 27.4°C at the lowland
site to 8.37°C at the tree line at a constant rate of 0.54 °C per 100 altitudinal metres.
Gradient doesn’t have any obvious ecotones, and the typical species composition of
forest (Paijmans, 1976) and general climatic conditions (McAlpine et al., 1983) are
described elsewhere.
Bird sampling
Bird communities were surveyed by three methods at each altitudinal site – point
counts, mist-netting and random walks through the area. Point counts (PC) were
carried out at 16 points regularly spaced along a 2250 m transect (successive points
Chapter I
20
were 150 ± 5 m apart to avoid overlap). All birds seen or heard within radial distance 0
- 50 m were recorded. Point counts started at 5:45 am, and lasted 15 minutes, so that all
16 points were surveyed before 11 am. We completed 1792 point counts representing
448 hours counts during entirety of this study. Further, we mist-netted (MN) birds into
200 m long line of nets (2.5 m high x 12-18 m long, mesh 16 mm) from 5:30 am to
5:30 pm daily. We identified all mist-netted individuals into species, marked them by
color rings and released within 10 minutes. Finally, we randomly walked (RW, 2 km-h)
across the area (~80 ha), and continuously recorded all individual birds seen or heard
within 50 meters radius. Random walks started at 3 pm and lasted till 5 - 6 pm, later
standardized to 20 hours per site. All surveys were conducted by three observers (KT,
BK, SJ), in three teams of two observers with rotating membership. We also recorded
unclear voices during all surveys, for later identification. We adopted the species-level
taxonomy of Handbook of the birds of the world (Hoyo et al., 1992-2011).
The first survey was conducted between 9th April and 31th May 2010 (3 PC, 3
MN, 6 RW), the second between 26th July and 15th October 2010 (6 PC, 5 MN, 10
RW), and the third from 15th May to 15th July and from 1st August and 15th October
2012 (5 PC, 3 MN, 4 RW). In total, our data set for each site included 14 replications
of point count surveys, 11 mist-netting days and 20 hours of random walks. Recorded
birds were partitioned into three broad trophic guilds: insectivores, herbivores
(granivores + frugivores) and omnivores (with equal intake of different items), based
on dietary information in standard references (Peckover & Filewood, 1976; Beehler et
al., 1986; Hoyo et al., 1992-2011), and our data. Only forest species were included in
the analyses and all raptors and swifts were excluded (68 individuals of 15 species)
since it was difficult to sample them in a standardized manner from within forest
interior (Table S1 for list of species in analyzes and their feeding specialization).
Explanatory variables
We used surface area of altitudinal belts 200 m wide across the whole New Guinea
mainland (e.g. 100 – 300 m a.s.l. for 200 m a.s.l. study site) as the proxy of available
area. Surface area for each altitudinal site was measured in GIS software. Hypothetical
regional species pool of birds (and birds partitioned according to feeding
specialization) was determined from altitudinal distribution of all forest bird (excluding
raptors and swifts similarly to local datasets) distributed across New Guinea mainland
(using GBIF and New Guinea Birds database; and Hoyo et al. 1992-2011). Humidity
and temperature were recorded every hour for the duration of one year (April 2010 –
July 2011) by a data logger (Comet R3120) placed in forest interior at each site, and
used as climatic variables. For habitat, we measured (i) canopy height (using laser
Chapter I
21
pointer, 3 measures/point); (ii) shrub density (using scatter plots, 5 measures/point);
percentage of ground covered by (iii) litter (15 measures in 1x1 m square per point);
(iv) canopy openness (5 photos/point – analyzed in Gap Light Analyzer; Frazer, 1999;
Frazer et al., 2001) at each point. Botanical surveys were completed in three plots 20 x
20 meters at each altitude, and all plants (DBH > 5 cm) were tagged and identified by
team of botanists (The New Guinea Binatang Research Center and PNG Forest
Research Institute Lae). Botanical plots provided information about (v) tree genus
richness, (vi) tree basal area, and (vii) tree density.
Hypotheses and testing
Area: Area of regional altitudinal belts (generally larger at lowland than at higher
altitudes) can positively influence the number of species found there (Rahbek, 1997).
Especially at the large spatial scales, the regional diversity along the regional
altitudinal gradients may be highly influenced by area (i.e. direct effect of area -
Rahbek, 1997; Brown, 2001; McCain, 2005), whereas area could have less influence
on standardized sampling of local sites (i.e. indirect effect of area; Lomolino, 2001).
On the other hand, Romdal & Grytnes (2007) found that the indirect area effect has
also a considerable potential as basic influence of altitudinal diversity gradients. To test
the indirect affect of surrounding area on the avian diversity, we predicted that the
species richness increases according to the same species-area function across all
altitudinal sites (Prediction I).
Species pool: A local community is inevitably assembled from a regional pool,
and local richness may be directly proportional to regional richness, following a
proportional-sampling model (Prediction I). Alternatively, as regional richness
increases, local richness might attain a ceiling above which it does not rise despite
continued increases in regional richness because of niche saturation (Gaston, 2000).
The proportional relationships between local and regional richness would suggest the
regional species pool as a prime driver of local richness while saturation model implies
additional factors, limiting the number of coexisting species in highly diverse
communities.
Mid-domain effect (MDE): The MDE assumes that spatial boundaries (e.g. the
base and top of a mountain) cause higher overlap of species ranges toward the centre of
an area where many large- to medium-sized ranges must overlap but are less likely to
abut an edge of the area (Colwell et al., 2004; Colwell et al., 2005). On mountains,
MDE predicts a unimodal diversity curve and maximal diversity at the mid-point of the
mountain, and a strong, significant relationship between MDE fit and empirical species
richness (Prediction I). Deviations in maximum diversity away from the mid-point of
Chapter I
22
the mountain should be randomly distributed (Prediction II) if spatial constraints alone
drive elevational diversity (e.g. effect of regional species pool, productivity or habitat
heterogeneity is not directionally skewing the diversity peak away from the mid-point
of the mountain).
Climate: Contemporary climate (or productivity) has been strongly and
positively linked to diversity (Gaston, 2000; Kaspari et al., 2000; Hawkins et al.,
2003). Productivity can be measured with numerous metrics. One group of metrics
records the amount of solar energy, which is strongly positively correlated with
temperature, radiation and potential evapotranspiration. The second type of metric
measures actual evapotranspiration - the energy available for biota to convert into
biomass, thus combining water and heat availability (Evans et al., 2005). Species
richness is predicted to be positively related to a combination of the warmest and
wettest conditions (Prediction I). While temperature decreases with altitude on all
mountains, rainfall and water availability follow more complex relationships with
altitude depending on the local climate. On humid mountains like Mt. Wilhelm, water
availability is high across a broad base of lower altitudes and only decreases toward the
tops of the mountains, due to higher runoff. Therefore, bird species richness is
predicted to exhibit decreasing or low-plateau pattern on wet mountains (Prediction II).
Habitat complexity (heterogeneity): The ‘habitat heterogeneity hypothesis’ is
one of the classical diversity explanations (Simpson, 1949; MacArthur & Wilson,
1967). It assumes that structurally complex habitats provide more niches and ways of
exploiting the environmental resources and thus increase species diversity. For
example, for bird species diversity in forests, MacArthur (MacArthur & MacArthur,
1961; MacArthur et al., 1962a) showed that the physical structure (foliage height
stratification) of a plant community directly influences bird species richness. He
suggested that each species requires a "patch" of vegetation with a particular forest
stratum as its particular micro-habitat, and that the variety of "patches" of vegetation
within a habitat determines the variety of bird species breeding there. If habitat
complexity has power to determine species richness, a structurally complex habitats
will have higher species richness, and habitat structure will have higher explanatory
power than productivity itself (Prediction I and II). Especially for habitat sensitive
insectivorous species (Prediction III; Robinson & Holmes, 1982) which are influenced
by habitat complexity actually two times - directly via suitable living or nesting space
and indirectly via arthropods, which feed on plants and represent food resource for
birds.
In most habitats, plant communities determine the physical structure of the
environment, and have therefore a considerable influence on the distributions and
Chapter I
23
interactions of animals (Lawton, 1983; Bell et al., 1991; McCoy & Bell, 1991). The
assumption that the number of individual organisms increases with available energy
and total biomass may not apply to plants, for which there is an evidence that as
standing crop increases the numbers of adult individuals per unit area actually declines
(and their size increases), which should tend to reduce species richness rather than
increase it (Tilman & Pacala, 1993). Plant density and structure (i.e. growth form)
therefore do not have to correspond to available energy. The scale of measurements
also influences the resulting complexity. In large scales, lowland forest can be more
structured, is higher and has lianas. In smaller scales, the mountain forest has many
different epiphytes and mosses.
Statistical analyzes
Total number of species recorded at the standardized area and during the standardized
time by all three survey methods was used in all analyzes. Most of the species was
recorded during point-counts, while only few more species per site was recorded only
by other survey methods (Fig. 1A).
All climatic and habitat predictor variables were subjected to principal
component analysis (function princomp in R 2.15. software; R Core Team, 2012). For
climatic model, the first axis corresponded to mean temperature, and second axis
corresponded well to mean humidity, and all other measured variables (min, max
temperature, and minimal humidity) were redundant (Table 1). For habitat complexity
model, seven habitat variables (see Explanatory environmental variables) were
subjected to principal component analysis. Tree fist axis corresponded to canopy height
and to canopy openness, while the second axis corresponded to shrub density, and also
to tree density (Table 1). Kaiser-Guttman stopping rule (Jackson, 1993) was used in
both cases. Scores of the two axes were further used to predict the species richness for
both models.
For mid-domain effect, we used RangeModel 5 (Colwell, 2008) to predict
diversity based on Monte Carlo simulations and empirical diversity at each of sampled
altitude (discrete domain analysis for empirical ranges and fills, eight domains and 500
replications). Poisson distribution with identity link function was used in models, and
results were inspected for possible over dispersion with negative results. Area available
in individual belts was log-transformed prior to analysis. Finally, we fitted individual
regression models with all predictor variables (and their interactions) to empirical
species richness. The same procedures were followed to analyze data partitioned to
feeding specializations. We used ∆ AICc, Akaike weights (wi) and Evidence ratio (wi
/wj) or R2 to evaluate the models and their fits (Burnham & Anderson, 2002).

Chapter I
24
Table 1. Results of principal component analysis for climatic and habitat variables.
Climatic variables Factor 1 Factor 2 Cumulative Proportion 0.654 0.928 Mean Temperature -0.522 -0.237 Max Temperature -0.437 -0.425 Min Temperature -0.512 -0.206 Mean Humidity -0.299 0.703 Min Humidity -0.23 0.477
Habitat variables Cumulative Proportion 0.492 0.804 Tree Height -0.957 -0.215 Canopy Openness 0.891 -0.232 Litter Cover 0.881 0.271 Genus richness -0.815 0.486 Basal Area -0.06 0.573 Tree Density 0.537 0.733 Shrub Density 0.259 0.888
RESULTS
Our data are based on observation of 33,639 bird individuals of 238 species (Table S1)
recorded across eight altitudinal sites on the slope of Mt. Wilhelm. Altogether, 236
species and 25,240 individuals were recorded during point-counts, 1,354 individuals of
105 species were mist-netted, and 7,045 individuals of 200 species were observed
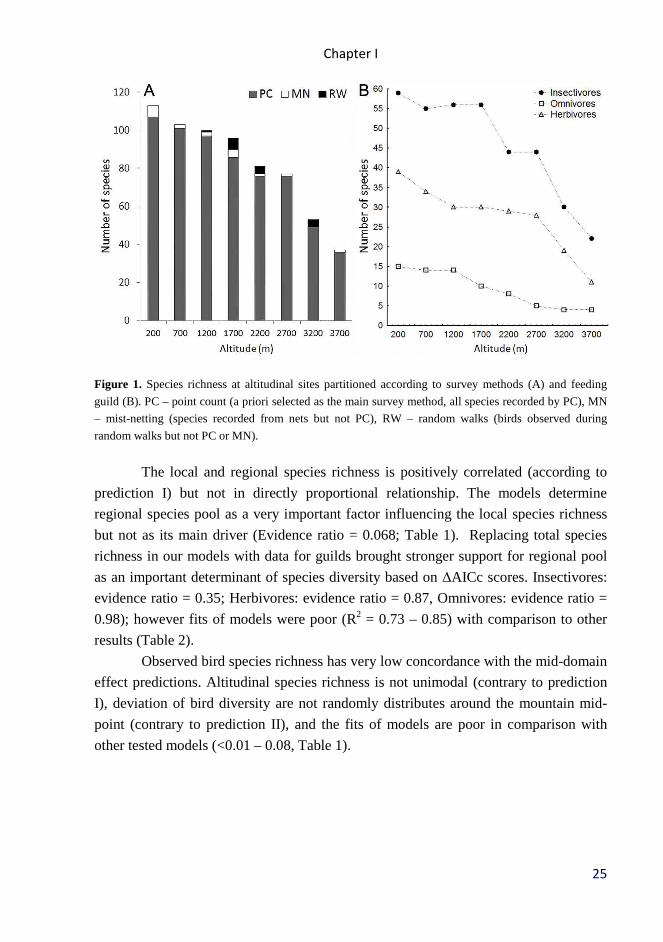
during random walks (Fig. 1A). Insectivores were represented by 129 species,
herbivores by 82 and omnivores by 27 species across the whole gradient.
Along the altitudinal gradients, the species richness of all birds decreased
nearly linearly from 113 bird species recorded at 200 m a.s.l. to 37 bird species at tree
line (Fig. 1A). The number of species in individual feeding guilds also decreased with
altitude, but the patterns differed between guilds (Fig. 1B).
Our data show that the surface area available per altitudinal belt is positively
correlated with species richness. However, fits of models were relatively poor (0.76 –
0.91) and ∆AICc scores higher than for the other models (Table 2).
Chapter I
25
Figure 1. Species richness at altitudinal sites partitioned according to survey methods (A) and feeding
guild (B). PC – point count (a priori selected as the main survey method, all species recorded by PC), MN
– mist-netting (species recorded from nets but not PC), RW – random walks (birds observed during
random walks but not PC or MN).
The local and regional species richness is positively correlated (according to
prediction I) but not in directly proportional relationship. The models determine
regional species pool as a very important factor influencing the local species richness
but not as its main driver (Evidence ratio = 0.068; Table 1). Replacing total species
richness in our models with data for guilds brought stronger support for regional pool
as an important determinant of species diversity based on ∆AICc scores. Insectivores:
evidence ratio = 0.35; Herbivores: evidence ratio = 0.87, Omnivores: evidence ratio =
0.98); however fits of models were poor (R2 = 0.73 – 0.85) with comparison to other
results (Table 2).
Observed bird species richness has very low concordance with the mid-domain
effect predictions. Altitudinal species richness is not unimodal (contrary to prediction
I), deviation of bird diversity are not randomly distributes around the mountain mid-
point (contrary to prediction II), and the fits of models are poor in comparison with
other tested models (<0.01 – 0.08, Table 1).
Chapter I
26
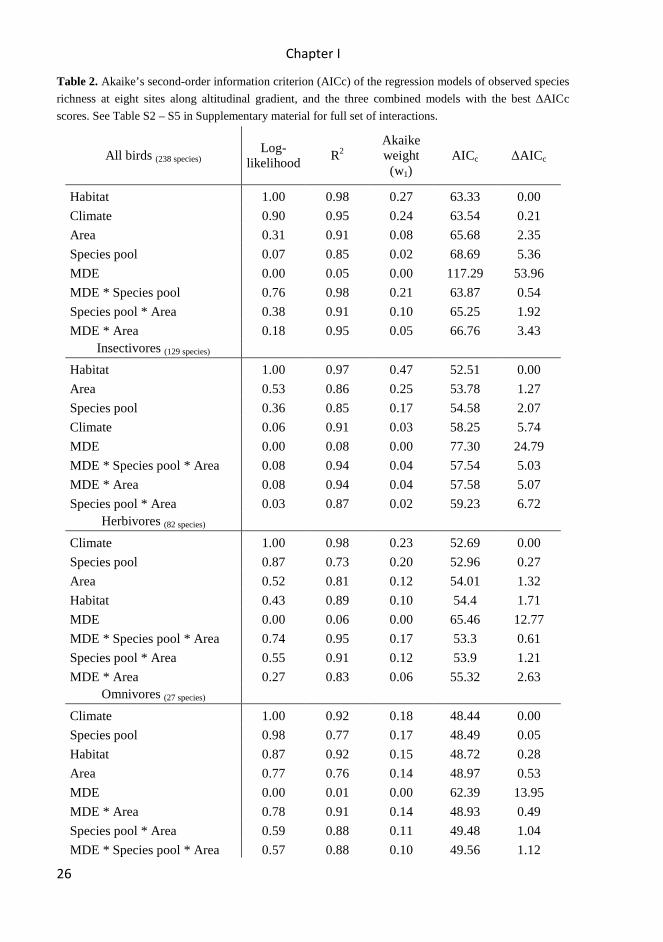
Table 2. Akaike’s second-order information criterion (AICc) of the regression models of observed species
richness at eight sites along altitudinal gradient, and the three combined models with the best ∆AICc
scores. See Table S2 – S5 in Supplementary material for full set of interactions.
All birds (238 species) Log-
likelihood R2
Akaike weight (w1)
AICc ∆AICc
Habitat 1.00 0.98 0.27 63.33 0.00
Climate 0.90 0.95 0.24 63.54 0.21
Area 0.31 0.91 0.08 65.68 2.35
Species pool 0.07 0.85 0.02 68.69 5.36
MDE 0.00 0.05 0.00 117.29 53.96
MDE * Species pool 0.76 0.98 0.21 63.87 0.54
Species pool * Area 0.38 0.91 0.10 65.25 1.92
MDE * Area 0.18 0.95 0.05 66.76 3.43 Insectivores (129 species)
Habitat 1.00 0.97 0.47 52.51 0.00
Area 0.53 0.86 0.25 53.78 1.27
Species pool 0.36 0.85 0.17 54.58 2.07
Climate 0.06 0.91 0.03 58.25 5.74
MDE 0.00 0.08 0.00 77.30 24.79
MDE * Species pool * Area 0.08 0.94 0.04 57.54 5.03
MDE * Area 0.08 0.94 0.04 57.58 5.07
Species pool * Area 0.03 0.87 0.02 59.23 6.72 Herbivores (82 species)
Climate 1.00 0.98 0.23 52.69 0.00
Species pool 0.87 0.73 0.20 52.96 0.27
Area 0.52 0.81 0.12 54.01 1.32
Habitat 0.43 0.89 0.10 54.4 1.71
MDE 0.00 0.06 0.00 65.46 12.77
MDE * Species pool * Area 0.74 0.95 0.17 53.3 0.61
Species pool * Area 0.55 0.91 0.12 53.9 1.21
MDE * Area 0.27 0.83 0.06 55.32 2.63 Omnivores (27 species)
Climate 1.00 0.92 0.18 48.44 0.00
Species pool 0.98 0.77 0.17 48.49 0.05
Habitat 0.87 0.92 0.15 48.72 0.28
Area 0.77 0.76 0.14 48.97 0.53
MDE 0.00 0.01 0.00 62.39 13.95
MDE * Area 0.78 0.91 0.14 48.93 0.49
Species pool * Area 0.59 0.88 0.11 49.48 1.04
MDE * Species pool * Area 0.57 0.88 0.10 49.56 1.12
Chapter I
27
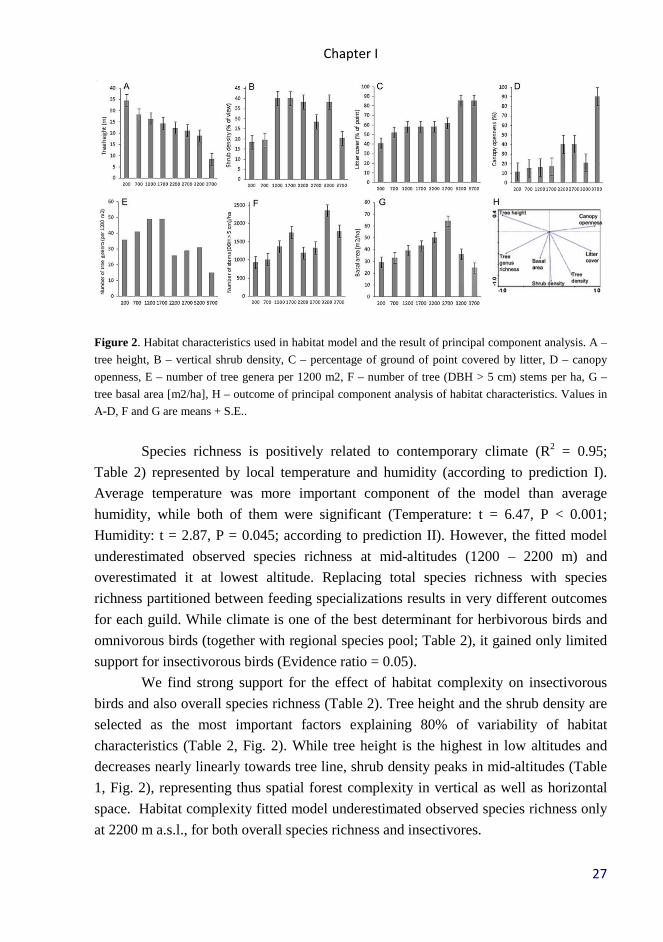
Figure 2. Habitat characteristics used in habitat model and the result of principal component analysis. A –
tree height, B – vertical shrub density, C – percentage of ground of point covered by litter, D – canopy
openness, E – number of tree genera per 1200 m2, F – number of tree (DBH > 5 cm) stems per ha, G –
tree basal area [m2/ha], H – outcome of principal component analysis of habitat characteristics. Values in
A-D, F and G are means + S.E..
Species richness is positively related to contemporary climate (R2 = 0.95;
Table 2) represented by local temperature and humidity (according to prediction I).
Average temperature was more important component of the model than average
humidity, while both of them were significant (Temperature: t = 6.47, P < 0.001;
Humidity: t = 2.87, P = 0.045; according to prediction II). However, the fitted model
underestimated observed species richness at mid-altitudes (1200 – 2200 m) and
overestimated it at lowest altitude. Replacing total species richness with species
richness partitioned between feeding specializations results in very different outcomes
for each guild. While climate is one of the best determinant for herbivorous birds and
omnivorous birds (together with regional species pool; Table 2), it gained only limited
support for insectivorous birds (Evidence ratio = 0.05).
We find strong support for the effect of habitat complexity on insectivorous
birds and also overall species richness (Table 2). Tree height and the shrub density are
selected as the most important factors explaining 80% of variability of habitat
characteristics (Table 2, Fig. 2). While tree height is the highest in low altitudes and
decreases nearly linearly towards tree line, shrub density peaks in mid-altitudes (Table
1, Fig. 2), representing thus spatial forest complexity in vertical as well as horizontal
space. Habitat complexity fitted model underestimated observed species richness only
at 2200 m a.s.l., for both overall species richness and insectivores.

Chapter I
28
None of the multiple regressions combining explanatory variables explained
substantially more variability than more simple models (Table S2 – S5). Only mid-
domain effect in interaction with regional species pool could be considered as suitable
determinant of local species richness (Table 2).
DISCUSSION
We observed a negative relationship between species richness of birds and altitude.
Most importantly, we document that observed species richness is positively correlated
and best fitted with habitat complexity. In agreement with many other studies, we
showed that such species richness pattern correlates also with contemporary climatic
conditions (McCain, 2007; McCain, 2009), and with regional species pool (Srivastava,
1999; Gaston, 2000) and available area.
Contemporary climate has been always strongly and positively linked to
diversity (Gaston, 2000; Kaspari et al., 2000; Hawkins et al., 2003). Greater energy
availability leads to greater biomass, which means more individual organisms, and thus
more species able to coexist at abundance maintaining viable populations (Gaston,
2000). The result is an increase in species richness with energy availability. However,
our data suggest that species richness responds to contemporary climate indirectly, via
its effects on habitat complexity.
MacArthur (MacArthur & MacArthur, 1961; MacArthur et al., 1962b) noted
that a competent birdwatcher can look at a habitat and correctly name the bird species
which will breed there in abundance. He suggested that vertical stratification and
patchiness within a habitat determines the variety of bird species breeding there. This
intuitively appealing conclusion that bird species diversity and foliage height diversity
are linearly related has not always been substantiated by subsequent work (Karr &
Roth, 1971; Willson, 1974), but seems to be supported by our data from Mt. Wilhelm
altitudinal gradient. Habitat model fitted the empirical richness of all species and insectivorous
birds much better than productivity. Horizontal (i.e. shrub and tree density) and vertical
(i.e. tree height) stratification of habitat was particularly marked as the determinants of
species richness. Lowland sites had very high and dense canopy layer, with low canopy
openness, therefore lower stratification in forest interior and lower shrub density
(Figure S2). Towards higher altitudes, the canopy was lower and more open, resulting
in dense growth in forest understory, more epiphytes and distinct moss growth. The
trees at uppermost altitudes were then very low, and most of the foliage was present in
lower strata – in shrubs and especially in high grass. The fact that climatic model
underestimates the species richness at altitudes, where shrub layer starts to be more
Chapter I
29
pronounced (and tree basal area is the highest), shows that habitat complexity play
important role for birds. Our data from insectivorous birds further support this
presumption.
Insectivorous birds have been shown to be very sensitive to habitat structure
(Sekercioglu, 2002) and changes in availability of microhabitat (Stratford & Stouffer,
2013). It is therefore not surprising that habitat complexity model gained in their case
much stronger support than in the case of other birds. Forest structure significantly
influence habitat selection of many bird species, and amount of understory foliage,
canopy closure, and tree basal area are usually among the significantly important
variables (Boves et al., 2013). Our habitat model fitted all altitudes very well, except
the site at 2200 m, where fitted values from habitat model were lower than already
unexpectedly decreased bird species richness. This site was close to open areas around
village Sinopass so that people could have disturbed the habitat by using the forest as
the source of fire wood or building materials in the past (see also Fig. 2 for habitat
characteristics of this site). Another explanation could be a natural dominance of
Pandanus trees at that site, which have extremely low insect herbivore loads (pers.
obs.) and as such seem to support fewer insectivorous birds also in other parts of New
Guinea (Bell, 1969).
Insectivorous birds are likely to be influenced by habitat characteristics also
indirectly via arthropods living and feeding on the foliage, and representing food
resources for birds. Ghosh-Harir & Price (2013) found that the species richness of
foliage gleaners along altitudinal gradient was limited by contemporary climate,
through the available food resources. Other authors also documented altitudinal
decrease in species richness of insectivorous birds due to disappearance of large insects
(Schoener, 1971), or decreased range of arthropod body sizes (Orians, 1969).
Insectivorous birds thus may be limited by either habitat complexity or food resources
as indirect effects of contemporary climate.
Empirical data on richness of herbivorous birds were best fitted by climatic
model, and habitat complexity did not seem to have strong effect. Their species
richness decreased steeply between 200 to 1700 m a.s.l., then followed a plateau, and
finally decreased very steeply from 2700 m a.s.l. towards the tree line. Species richness
of frugivores is likely to increase with increasing range of fruit sizes and morphologies
and/or with potentially higher production of fruit biomass (Ortiz‐Pulido & Rico‐Gray,
2000). Most herbivorous bird species do not specialize on the fruits (or seeds) of a
particular plant species (Herrera, 1998; Zamora, 2000; Herrera, 2002). In contrast,
some authors (Goodman & Ganzhorn, 1997; Kissling et al., 2007) proposed a strong
relationship between richness of Ficus trees and the entire guild of strict frugivores.

Chapter I
30
This could explain abrupt decrease in the number of herbivorous species above 2700 m
a.s.l., coincident with Ficus altitudinal range limits between 2700 m and 3200 m on the
slopes of Mt.Wilhelm. Abundances and species richness of Ficus species is decreasing
towards 1200 m a.s.l. (Sam, L., unpubl. data), which could correlate with the steep
decrease in species richness of frugivorous birds along our gradient. Most of the bird
species restricted to lowlands (200 m a.s.l.) were large-bodied pigeons, doves and
megapodes, which corresponds to the distribution of extremely large fruits, also
restricted to lowlands (Duivenvoorden et al., 2012). Alternately, large lowland areas
can provide food resources for herbivorous birds, which are usually good migrants
following abundant resources across large areas (Loiselle & Blake, 1991). We suggest
that food resources, controlled by climate, have strong effect on herbivorous birds
rather than habitat complexity.
The lowland forest covers the largest area of mainland (67% of area is below
500 m a.s.l.) in New Guinea, while the species richness gradient did not show such
pattern and species richness decrease much slowly towards the higher altitudes. The
indirect effect of area on altitudinal transects was, to our knowledge, first discussed by
Beehler (Beehler, 1981), who found that a linear decrease in New Guinean forest birds
on an altitudinal transect was paralleled by a decrease in regional area. Similarly, we
found a strong, but not perfect, correlation between area and local species richness,
pointing out the importance of other factors. Previous studies also found an indirect
effect of area on specie richness of birds (Romdal & Grytnes, 2007), which can be
lower in tropical areas with high available energy (Storch et al., 2005) and in large
forest areas (Romdal & Grytnes, 2007).
All local communities derive from regional species pools, which are thus
logical candidates as determinants of these communities. However, several authors
pointed out pitfalls in the interpretation on relationships between species pools and
communities (Srivastava, 1999; Gaston & Blackburn, 2000). In particular, regional
species pools should only include species capable of living in the studied habitats (as
was done in the present study). Further, Loreau (2000) and Ricklefs (2000) pointed out
that the relationship between local and regional species richness depends on the scale.
The `regional' should be defined on a significantly large scale than “local” so that a
large proportion of the regional heterogeneity is not sampled within a single site.
Further, a narrow definition of `local' makes it independent of regional diversity but
also more likely to include species saturation. The regional species pool has variously
been defined by a geographic region, or as a pool of species that are capable of
colonizing a particular site. We decided to include all birds occurring on the mainland
of New Guinea within a particular altitudinal range as a regional pool, based on the

Chapter I
31
knowledge of species distribution and history of the region (Norman et al., 2007;
Jønsson et al., 2011). Our decision was made simple by the fact that the island of New
Guinea represents a natural biogeographic unit.
Both proportional and dis-proportional sampling by local communities from
regional pools has been reported (Cornell & Lawton, 1992; Gaston, 2000). In the case
of our altitudinal gradient, a disproportional sampling was found (Type II response,
Gaston, 2000) and we sampled 46.8 – 49.7 % of regional avifauna at altitudes 200 –
1200 m, and then the proportion of sampling steeply increased from 61.5 to 100 % of
regional species richness.
The altitudinal ranges of species along the gradient are constrained physically
by the lowest available altitude and the top of a mountain. Colwell and Lees (2000)
suggested that MDE could be treated as a null model for gradients in species richness,
assuming that species’ geographic ranges are randomly placed over the domain in the
absence of environmental gradients. These spatial constraints have been shown in some
cases as a contributing factor to mid-elevational peaks in species richness (e.g. Colwell
et al., 2004, 2005; but see Hawkins et al., 2005; Zapata et al., 2005). In the case of our
gradient, none of the predictions of MDE were supported. Therefore we conclude that
other environmental determinants are present and cause the observed pattern in species
richness. The length of our gradient can also decrease the effect of spatial constraints
as only small proportion of birds is able to occupy whole altitudinal gradient.
Eastern slope of Mt Wilhelm represents wet tropical montane habitat, thus the
pattern of decreasing species richness was consistent with those found in other studies
on birds in wet tropics (Kikkawa & Williams, 1971; Diamond, 1972; Terborgh, 1977a;
Terborgh, 1977b; Goerck, 1999; Grytnes & Vetaas, 2002). In contrast to other studies,
we were not able to identify climatic variables as main direct drivers of species
richness. The present study rather supports indirect effect of climate via habitat
structure or possibly via food webs. In particular, habitat complexity played an
important role in shaping of local bird species richness.
ACKNOWLEDGEMENTS
I am in debt to Carsten Rahbek who suggested the main direction of analyzes, and
commented on the manuscript. I wish to thank to numerous field assistants from Kausi,
Numba, Bundi, Bruno Sawmill, Sinopass and Kegesugl for help in the field and
hospitality. The project was financially supported by the Czech Science Foundation
Grants 206/09/0115 and 206/08/H044, Czech Ministry of Education ME09082, Grant
Agency of University of South Bohemia 04-136/2010/P, US National Science
Foundation DEB-0841885, and was a part of Center of Excellence for Global Study of

Chapter I
32
Biodiversity and Function of Forest Ecosystems, reg. n. CZ.1.07/2.3.00/20.0064 co-
financed by the European Social Fund and the Czech Republic.
SUPPLEMENTARY MATERIAL:
Table S1. List of species recorded during standardized survey at eight altitudinal sites
of Mt. Wilhelm gradient.
Figure S1. Location of the study sites in Papua New Guinea
Table S2. Akaike’s second-order information criterion (AICc) of the regression models
for total bird species richness across eight sites along altitudinal gradient, and their
combinations.
Table S3. Akaike’s second-order information criterion (AICc) of the regression models
for species richness of insectivorous bird across eight sites along altitudinal gradient,
and their combinations.
Table S4. Akaike’s second-order information criterion (AICc) of the regression models
of species richness of frugivorous birds across eight sites along altitudinal gradient, and
their combinations.
Table S5. Akaike’s second-order information criterion (AICc) of the regression models
of species richness of omnivorous bird across eight sites along altitudinal gradient, and
their combinations.
Figure S2. Forest interior and canopy openness at altitudinal sites.
Chapter I
33
REFERENCES: Beehler, B. (1981) Ecological structuring of forest bird communities in New Guinea.
Monographiae Biologicae, 42, 837-861.
Beehler, B.M., Pratt, T.K. & Zimmerman, D.A. (1986) Birds of New Guinea. Princeton
University Press, .
Bell, H. (1969) Field notes on the birds of the Ok Tedi River drainage, New Guinea. Emu, 69,
193-211.
Bell, S.S., McCoy, E.D. & Mushinsky, H.R. (1991) Habitat structure: the physical
arrangement of objects in space. Chapman and Hall.
Boves, T.J., Buehler, D.A., Sheehan, J., Wood, P.B., Rodewald, A.D., Larkin, J.L., Keyser,
P.D., Newell, F.L., Evans, A. & George, G.A. (2013) Spatial variation in breeding
habitat selection by Cerulean Warblers (Setophaga cerulea) throughout the
Appalachian Mountains. The Auk, 130, 46-59.
Brown, J.H. (2001) Mammals on mountainsides: elevationalpatterns of diversity. Global
Ecology and Biogeography, 10, 101-109.
Burnham, K.P. & Anderson, D.R. (2002) Model selection and multi-model inference: a
practical information-theoretic approach. Springer Verlag.
Colwell, R.K. (2008) RangeModel: tools for exploring and assessing geometric constraints on
species richness (the mid‐domain effect) along transects. Ecography, 31, 4-7.
Colwell, R.K. & Lees, D.C. (2000) The mid-domain effect: geometric constraints on the
geography of species richness. Trends in Ecology & Evolution, 15, 70-76.
Colwell, R.K., Rahbek, C. & Gotelli, N.J. (2004) The Mid‐Domain Effect and Species Richness
Patterns: What Have We Learned So Far? The American Naturalist, 163, E1-E23.
Colwell, R.K., Rahbek, C. & Gotelli, N.J. (2005) The mid‐domain effect: There’s a baby in the
bathwater. The American Naturalist, 166, E149-E154.
Cornell, H.V. & Lawton, J.H. (1992) Species interactions, local and regional processes, and
limits to the richness of ecological communities: a theoretical perspective. Journal of
Animal Ecology, 1-12.
Currie, D.J., Mittelbach, G.G., Cornell, H.V., Field, R., Guégan, J.F., Hawkins, B.A., Kaufman,
D.M., Kerr, J.T., Oberdorff, T. & O'Brien, E. (2004) Predictions and tests of
climate‐based hypotheses of broad‐scale variation in taxonomic richness. Ecology
Letters, 7, 1121-1134.
Diamond, J.M. (1972 ) Avifauna of the eastern highlands of New Guinea. . Publications of the
Nuttall Ornithological Club, 12, 1-438.
Duivenvoorden, J.F., Cuello, A. & Nidia, L. (2012) Functional trait state diversity of Andean
forests in Venezuela changes with altitude. Journal of Vegetation Science, 23, 1105-
1113.
Evans, K.L., Warren, P.H. & Gaston, K.J. (2005) Species–energy relationships at the
macroecological scale: a review of the mechanisms. Biological Reviews, 80, 1-25.

Chapter I
34
Frazer, G.W., Fournier, R.A., Trofymow, J.A. & Hall, R.J. (2001) A comparison of digital and
film fisheye photography for analysis of forest canopy structure and gap light
transmission. Agricultural and Forest Meteorology, 109, 249-263.
Frazer, G.W., Canham, C.D.,Lertzman, K.P (1999) Gap Light Analyzer (GLA), Version 2.0.
Institute of Ecosystem Studies, Millbrook, New York.
Gaston, K.J. (2000) Global patterns in biodiversity. Nature, 405, 220-227.
Gaston, K.J. & Blackburn, T.M. (2000) Pattern and process in macroecology. Blackwell
Publishing, Oxford.
Ghosh-Harirar, M. & Price, T.D. (2013) A test for community saturation along the Himalayan
bird diversity gradient, based on within-species geographical variation. Journal of
Animal Ecology, accepted
Goerck, J.M. (1999 ) Distribution of birds along an elevational gradient in the Atlantic forest of
Brazil: implications for the conservation of endemic and endangered species. . Bird
Conservation International, 9, 235–253.
Goodman, S. & Ganzhorn, J. (1997) Rarity of figs (Ficus) on Madagascar and its relationship to
a depauperate frugivore community. Revue d'écologie, 52, 321-329.
Grytnes, J.A. & Vetaas, O.R. (2002) Species richness and altitude: A comparison between null
models and interpolated plant species richness along the Himalayan altitudinal
gradient, Nepal. The American Naturalist, 159, 294-305.
Grytnes, J.A., Heegaard, E. & Ihlen, P.G. (2006) Species richness of vascular plants,
bryophytes, and lichens along an altitudinal gradient in western Norway. Acta
Oecologica, 29
Hawkins, B.A., Porter, E.E. & Felizola Diniz-Filho, J.A. (2003) Productivity and history as
predictors of the latitudinal diversity gradient of terrestrial birds. Ecology, 84, 1608-
1623.
Herrera, C.M. (1998) Long-term dynamics of mediterranean frugivorous birds and fleshy fruits:
A 12-year study Ecological Monographs, 68, 511-538.
Herrera, C.M. (2002) Seed dispersal by vertebrates. Plant-animal interactions: an evolutionary
approach, 185, 208.
Hoyo, d.J., Elliott, J., Sargatal, J. & Christie, D.A. (eds.) (1992-2011) Handbook of the Birds of
the World (vol. 1-16). Lynx Editions, Barcelona, Spain.
Hunter, M.L. & Yonzon, P. (1993) Altitudinal distributions of birds, mammals, people, forests,
and parks in Nepal. Conservation Biology, 7, 420-423.
Jackson, D.A. (1993) Stopping rules in principal components analysis: A comparison of
heuristical and statistical approaches. Ecology, 74, 2204-2214.
Jetz, W. & Rahbek, C. (2002) Geographic range size and determinants of avian species
richness. Science, 297, 1548-1551.
Jønsson, K.A., Fabre, P.-H., Ricklefs, R.E. & Fjeldsa, J. (2011) Major global radiation of
corvoid birds originated in the proto-Papuan archipelago. Proceedings of the National
Academy of Sciences, 108, 2328-2333.
Chapter I
35
Karr, J.R. & Roth, R.R. (1971) Vegetation structure and avian diversity in several New World
areas. American Naturalist, 423-435.
Kaspari, M., O'Donnell, S. & Kercher, J.R. (2000) Energy, density, and constraints to species
richness: ant assemblages along a productivity gradient. The American Naturalist, 155,
280-293.
Kikkawa, J. & Williams, W.T. (1971) Altitudinal distribution of land birds in New Guinea.
Search, 2, 64-65.
Kissling, W.D., Rahbek, C. & Böhning-Gaese, K. (2007) Food plant diversity as broad-scale
determinant of avian frugivore richness. Proceedings of the Royal Society B:
Biological Sciences, 274, 799-808.
Lawton, J. (1983) Plant architecture and the diversity of phytophagous insects. Annual Review
of Entomology, 28, 23-39.
Loiselle, B.A. & Blake, J.G. (1991) Temporal variation in birds and fruits along an elevational
gradient in Costa Rica. Ecology, 180-193.
Lomolino, M.V. (2001) Elevation gradients of species-density: historical and prospective views.
Global Ecology and Biogeography, 10, 3-13.
Loreau, M. (2000) Are communities saturated? On the relationship between α, β and γ diversity.
Ecology Letters, 3, 73-76.
MacArthur, R.H. & MacArthur, J.W. (1961) On bird species diversity. Ecology, 42, 594-598.
MacArthur, R.H. & Wilson, E.O. (1967) The theory of island biogeography. Princeton
University Press.
MacArthur, R.H., MacArthur, J.W. & Preer, J. (1962a) On bird species diveristy II. Predictions
of bird census from habitat measurements. The American Naturalist, 96, 167-174.
MacArthur, R.H., MacArthur, J.W. & Preer, J. (1962b) On bird species diversity. II. Prediction
of bird census from habitat measurements. The American Naturalist, 96, 167-174.
Martin, P.S. (1958) A biogeography of reptiles and amphibians in the Gomez Farias region,
Tamaulipas, Mexico. Miscelaneous Publications of the Museum of Zoology, University
of Michigan 101
McAlpine, J.R., Keig, R. & Falls, R. (1983) Climate of Papua New Guinea. CSIRO and
Australian National University Press, Canberra,
McCain, C.M. (2005) Elevational gradients in diversity of small mammals. Ecology, 86, 366–
372.
McCain, C.M. (2007) Could temperature and water availability drive elevational species
richness patterns? A global case study for bats. Glogal ecology and biogeography, 16,
1-13.
McCain, C.M. (2009) Global analysis of bird elevational diversity. Global Ecology and
Biogeography, 18, 346-360.
McCain, C.M., Grytnes, J.-A. (2010) Elevational gradients in species richness. In: Encyclopedia
of Life Sciences (ed. J.W. Sons). John Wiley & Sons, Chichester.
McCoy, E. & Bell, S. (1991) Habitat structure: the evolution and diversification of a complex
topic. Habitat structure, pp. 3-27. Springer.
Chapter I
36
Nogués-Bravo, D., Araújo, M., Romdal, T. & Rahbek, C. (2008) Scale effects and human
impact on the elevational species richness gradients. Nature, 453, 216-219.
Norman, Janette, A., Rheindt, Frank, E., Rowe, Diane, L., Christidis & Les (2007) Speciation
dynamics in the Australo-Papuan Meliphaga honeyeaters. Molecular Phylogenetics
and Evolution, 42, 80-91.
Orians, G.H. (1969) The number of bird species in some tropical forests. Ecology, 50, 783-801.
Ortiz‐Pulido, R. & Rico‐Gray, V. (2000) The effect of spatio‐temporal variation in
understanding the fruit crop size hypothesis. Oikos, 91, 523-527.
Paijmans, K. (ed.) (1976) New Guinea Vegetation. National University Press, Canberra.
Peckover, W.S. & Filewood, L.W.C. (1976) Birds of New Guinea and Tropical Australia.
National Library of Australia, Sydney.
R Core Team (2012) R: A Language and Environment for Statistical Computing. R Foundation
for Statistical Computing.
Rahbek, C. (1995) The elevational gradient of species richness: a uniform pattern? Ecography,
18, 200-205.
Rahbek, C. (1997) The relationship among area, elevation, and regional species richness in
Neotropical birds. American Naturalist, 149, 875-902.
Rahbek, C. (2005) The role of spatial scale and the perception of large-scale species-richness
patterns. Ecology Letters, 8
Rahbek, C. & Graves, G.R. (2001) Multiscale assessment of patterns of avian species richness.
Proceedings of the National Academy of Sciences, 98, 4534-4539.
Robinson, S.K. & Holmes, R.T. (1982) Foraging Behavior of Forest Birds: The Relationships
Among Search Tactics, Diet, and Habitat Structure. Ecology, 63, 1918-1931.
Romdal, T.S. & Grytnes, J.A. (2007) An indirect area effect on elevational species richness
patterns. Ecography, 30, 440-448.
Sanders, N.J. & Rahbek, C. (2011) The patterns and causes of elevational diversity gradients.
Ecography, 35, 1-3.
Schoener, T.W. (1971) Large-billed insectivorous birds: a precipitous diversity gradient. The
Condor, 73, 154-161.
Sekercioglu, C.H. (2002) Forest fragmentation hits insectivorous birds hard. Directions in
Science, 1, 62-64.
Simpson, E.H. (1949) Measurement of diversity. Nature, 163, 688.
Srivastava, D.S. (1999) Using local–regional richness plots to test for species saturation: pitfalls
and potentials. Journal of Animal Ecology, 68, 1-16.
Storch, D., Evans, K.L. & Gaston, K.J. (2005) The species–area–energy relationship. Ecology
Letters, 8, 487-492.
Stratford, J.A. & Stouffer, P.C. (2013) Microhabitat associations of terrestrial insectivorous
birds in Amazonian rainforest and second‐growth forests. Journal of Field
Ornithology, 84, 1-12.
Terborgh, J. (1977a) Bird species diversity on an Andean elevational gradient. . Ecology, 58,
1007–1019.

Chapter I
37
Terborgh, J. (1977b) Bird species diversity on an Andean elevational gradient. Ecology, 58,
1007-1019.
Tilman, D. & Pacala, S. (1993) The maintenance of species richness in plant communities.
Species diversity in ecological communities, 13-25.
Wake, D.B., Papenfuss, T.J. & Lynch, J.F. (1992) Distribution of salamandres along elevational
transects in Mexico and Guatemala. Tulane Studies in Zoology & Botany, 1, 303-319.
Willson, M.F. (1974) Avian community organization and habitat structure. Ecology, 1017-1029.
Zamora, R. (2000) Functional equivalence in plant‐animal interactions: ecological and
evolutionary consequences. Oikos, 88, 442-447.

Chapter I – Supplementary material
38
SUPPLEMENTARY MATERIAL
Table S1. List of species recorded during standardized survey at eight altitudinal sites of Mt. Wilhelm
gradient. Guild: IN – insectivore, HE – herbivore, OM – omnivore, Food: In – insect, Ne – nectar, Fr –
fruit, Ca – vertebrates, Gr – grains/seeds.
Scientific name
GU
ILD
Food Altitude (m)
Primary Secondary 20
0
70
0
12
00
17
00
22
00
27
00
32
00
37
00
Acanthiza murina IN In Ne
X X X Aegotheles albertisi IN In
X
Aepypodius arfakianus HE Fr X
Ailuroedus buccoides OM Fr In X X X X
Ailuroedus melanotis OM Fr In
X
Alcedo azurea IN In Ve X X X
Alcedo pusilla IN In Ve X
Aleadryas rufinucha IN In
X X X X X Alisterus chloropterus HE Fr
X X X X X
Amalocichla incerta IN In
X
Amblyornis macgregoriae HE Fr
X X X
Anthus gutturalis IN In
X X Aplonis cantoroides OM Fr In X
Aplonis metallica OM Fr In X X
Arses insularis IN In X X X X
Artamus maximus IN In
X X X
Astrapia stephaniae HE Fr
X X X Cacatua galerita HE Fr X X X
Cacomantis castaneiventris IN In X X X X X X
Cacomantis flabelliformis IN In
X X X X X X Cacomantis variolosus IN In X X X X
Caliechthrus leucolophus IN In X X X
Campochaera sloetii OM Fr In X
X
Caprimulgus macrurus IN In X
Casuarius bennetti HE Fr
X
Centropus phasianinus IN In Ve X X
Ceyx lepidus IN In X X X
Chaetorhynchus papuensis IN In X X X X
Chalcophaps indica HE Fr X X
Chalcophaps stephani HE Fr X X X
Charmosyna papou HE Fr Ne
X X X X X
Charmosyna placentis HE Ne Fr X X
Charmosyna rubronotata HE Ne Fr X X
Charmosyna wilhelminae HE Fr
X X
Chlamydera lauterbachi OM Fr In
X
Chrysococcyx minutillus IN In X
Chrysococcyx ruficollis IN In
X X
Cicinnurus regius OM Fr In X X
Cinnyris jugularis OM Ne In X X X X
Clytoceyx rex IN In
X X Clytomyias insignis IN In
X X
Cnemophilus loriae HE Fr
X X X X
Cnemophilus macgregorii HE Fr
X X X X
Colluricincla megarhyncha IN In X X X X X
Columba vitiensis HE Fr X X

Chapter I – Supplementary material
39
Coracina boyeri OM Fr In X X X
Coracina caeruleogrisea IN In
X X X X X
Coracina incerta IN In X X
Coracina longicauda IN In X
Coracina melas IN In X
Coracina montana OM Fr In
X X X X
Coracina papuensis IN In X X X X
Coracina schisticeps OM Fr In
X X
Coracina tenuirostris IN In X X X
Corvus tristis HE Fr X X X X
Cracticus cassicus IN In Ve X X
Cracticus quoyi IN In X
Crateroscelis murina IN In X X X X
Crateroscelis nigrorufa IN In
X
Crateroscelis robusta IN In
X X X X X X X
Cyclopsitta diophthalma HE Fr Ne X X X X
Cyclopsitta gulielmitertii HE Fr X
Dacelo gaudichaud IN In Ve X X
Daphoenositta miranda IN In
X X X Dicaeum geelvinkianum HE Fr Ne X X X X X
Dicrurus bracteatus IN In X X
Diphyllodes magnificus HE Fr
X X X
Ducula chalconota HE Fr X X X
Ducula pinon HE Fr X
Ducula rufigaster HE Fr X
Ducula zoeae HE Fr X X X
Eclectus roratus HE Fr In X X X X
Epimachus fastuosus HE Fr
X X X X X
Epimachus meyeri HE Fr X X X X
Erythrura trichroa HE Fr
X X X X X
Euaegotheles insignis IN In
X
Eudynamys scolopaceus IN In X X
Eugerygone rubra IN In
X X X X X Eulacestoma nigropectus IN In
X
Eurystomus orientalis IN In X X
Gallicolumba beccarii HE Fr
X X
Gallicolumba jobiensis HE Fr
X
Garritornis isidorei IN In X
Geoffroyus geoffroyi HE Fr Ne X
Geoffroyus simplex HE Fr Ne X
Gerygone chloronota IN In X X X
Gerygone chrysogaster IN In X X
Gerygone cinerea IN In
X X X X
Gerygone palpebrosa IN In X
X
Gerygone ruficollis IN In
X X X X X Grallina bruijni IN In
X
Gymnophaps albertisii HE Fr X X X X X
Henicophaps albifrons HE Fr X X X
Ifrita kowaldi IN In
X X X X X Lalage atrovirens OM Fr In X
Leptocoma sericea OM Ne In X X X
Lichenostomus obscurus OM Ne In
X
Lichenostomus subfrenatus OM Ne In X X X X X
Loboparadisea sericea HE Fr
X

Chapter I – Supplementary material
40
Lonchura spectabilis HE Gr
X
Lonchura tristissima HE Gr X
Lophorina superba HE Fr X
Loriculus aurantiifrons HE Ne Fr X
Lorius lory HE Fr Ne X X X
Machaerirhynchus flaviventer IN In
X X X
Machaerirhynchus nigripectus IN In
X X X X
Macropygia amboinensis HE Fr X X X X X
Macropygia nigrirostris HE Fr
X
Malurus alboscapulatus IN In X X
Manucodia chalybatus HE Fr
X X
Megapodius decollates HE Fr X X
Melampitta lugubris IN In
X X X Melanocharis longicauda HE Fr
X
Melanocharis nigra OM Fr In X X X X X
Melanocharis striativentris HE Fr
X
X
Melanocharis versteri OM Fr In X X X X X
Melidectes belfordi IN In Fr
X X X X Melidectes fuscus IN In
X X X X
Melidectes princeps OM Ne In
X X Melidectes rufocrissalis IN In Ne
X
Melidectes torquatus IN In Ne
X X X
Melidora macrorrhina IN In Ve X X
Melilestes megarhynchus IN In Ne X X X X X
Meliphaga analoga IN In Fr X X X X
Meliphaga aruensis IN In Fr X X X
Meliphaga montana OM Fr In
X X
Meliphaga orientalis IN In Ne X X X
Melipotes fumigatus IN In
X X X X X X Merops ornatus IN In X X
Microdynamis parva HE Fr X
Microeca flavovirescens IN In X X X
Microeca griseoceps IN In
X
Microeca papuana IN In
X X X X
Micropsitta bruijnii HE Ne Fr X X
Micropsitta pusio HE Fr Ne X X
Mino anais HE Fr X X
Mino dumontii OM Fr In X X
Monachella muelleriana IN In X
Monarcha axillaris IN In
X X X X
Monarcha chrysomela IN In X X X
Monarcha frater IN In X X X
Monarcha guttula IN In X X X
Monarcha manadensis IN In X
Monarcha rubiensis IN In X
Myiagra alecto IN In Fr X X X X
Myzomela rosenbergii OM Ne In X X X X X X
Neopsittacus musschenbroekii HE Fr Ne
X X X X X
Neopsittacus pullicauda HE Ne Fr
X X X X X Oedistoma iliolophus OM In Ne
X X X
Oreocharis arfaki HE Fr
X X X X X
Oreopsittacus arfaki HE Ne Fr X X X X
Oreostruthus fuliginosus HE Gr X

Chapter I – Supplementary material
41
Oriolus szalayi OM Fr In X X
Otidiphaps nobilis HE Fr In
X
Pachycare flavogriseum IN In
X X X
Pachycephala hyperythra IN In X X X X
Pachycephala modesta IN In X X
Pachycephala schlegelii IN In
X X X X X
Pachycephala simplex IN In
X X
Pachycephala soror IN In
X X X
Pachycephalopsis poliosoma IN In
X X
Paradisaea minor OM Fr In X X X
Paramythia montium HE Fr X X X
Peltops blainvillii IN In X X
Peltops montanus IN In
X X X
Peneothello bimaculata IN In
X X X
Peneothello cyanus IN In
X X X
Peneothello sigillata IN In Fr X X X
Philemon buceroides HE Ne Fr X X
Philemon meyeri HE Fr Ne X X X
Phylloscopus poliocephalus IN In
X X X
Pitohui cristatus IN In
X
Pitohui dichrous IN Fr In
X X X
Pitohui ferrugineus IN In Fr X
Pitohui kirhocephalus IN In Fr X X X
Pitta erythrogaster IN In X X
Pitta sordida IN In X X
Podargus ocellatus IN In
X X X
Poecilodryas albispecularis IN In
X X X
Poecilodryas albonotata IN In X X X
Poecilodryas hypoleuca IN In X X X
Probosciger aterrimus HE Fr X X X
Pseudeos fuscata HE Fr X
X X X
Psittacella brehmii HE Fr Gr
X X
Psittacella picta HE Fr Fr
X X X
Psittaculirostris edwardsii HE Fr Ne X X X
Psitteuteles goldiei HE Ne Fr X X
Psittrichas fulgidus HE Fr
X
Pteridophora alberti OM Fr In
X
Ptilinopus coronulatus HE Fr X X X X
Ptilinopus iozonus HE Fr X
Ptilinopus magnificus IN Fr X X X
Ptilinopus ornatus HE Fr
X
Ptilinopus perlatus HE Fr X X
Ptilinopus pulchellus HE Fr X X X
Ptilinopus rivoli IN Fr
X X X X
Ptilinopus superbus IN Fr X X X
X
Ptiloprora guisei HE Fr X X X X
Ptiloprora perstriata IN In Fr
X X X X Ptiloris magnificus HE Fr In
X X
Ptilorrhoa caerulescens HE In X X X
Ptilorrhoa castanonota HE In
X
Ptilorrhoa leucosticta HE In
X X X
Pycnopygius ixoides OM Fr In X X X
Rallina forbesi IN In Fr
X X X
Reinwardtoena reinwardtii HE Fr X X X X X X X
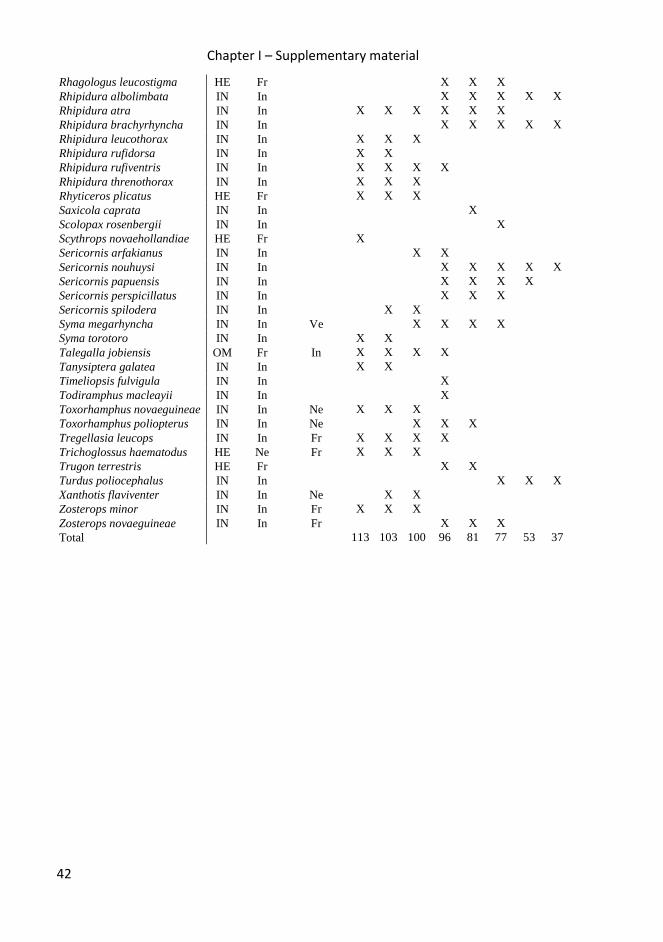
Chapter I – Supplementary material
42
Rhagologus leucostigma HE Fr
X X X
Rhipidura albolimbata IN In X X X X X
Rhipidura atra IN In X X X X X X
Rhipidura brachyrhyncha IN In
X X X X X Rhipidura leucothorax IN In X X X
Rhipidura rufidorsa IN In X X
Rhipidura rufiventris IN In X X X X
Rhipidura threnothorax IN In X X X
Rhyticeros plicatus HE Fr X X X
Saxicola caprata IN In
X
Scolopax rosenbergii IN In
X
Scythrops novaehollandiae HE Fr X
Sericornis arfakianus IN In
X X
Sericornis nouhuysi IN In
X X X X X Sericornis papuensis IN In
X X X X
Sericornis perspicillatus IN In
X X X
Sericornis spilodera IN In
X X
Syma megarhyncha IN In Ve
X X X X
Syma torotoro IN In X X
Talegalla jobiensis OM Fr In X X X X
Tanysiptera galatea IN In X X
Timeliopsis fulvigula IN In
X
Todiramphus macleayii IN In
X
Toxorhamphus novaeguineae IN In Ne X X X
Toxorhamphus poliopterus IN In Ne
X X X
Tregellasia leucops IN In Fr X X X X
Trichoglossus haematodus HE Ne Fr X X X
Trugon terrestris HE Fr
X X
Turdus poliocephalus IN In
X X X Xanthotis flaviventer IN In Ne
X X
Zosterops minor IN In Fr X X X
Zosterops novaeguineae IN In Fr
X X X
Total 113 103 100 96 81 77 53 37
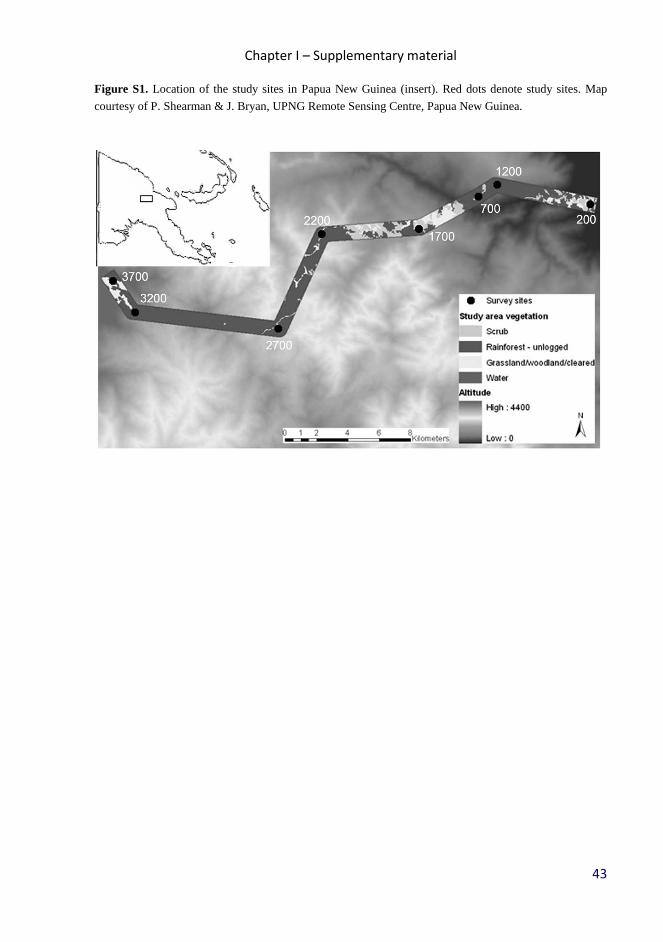
Chapter I – Supplementary material
43
Figure S1. Location of the study sites in Papua New Guinea (insert). Red dots denote study sites. Map
courtesy of P. Shearman & J. Bryan, UPNG Remote Sensing Centre, Papua New Guinea.
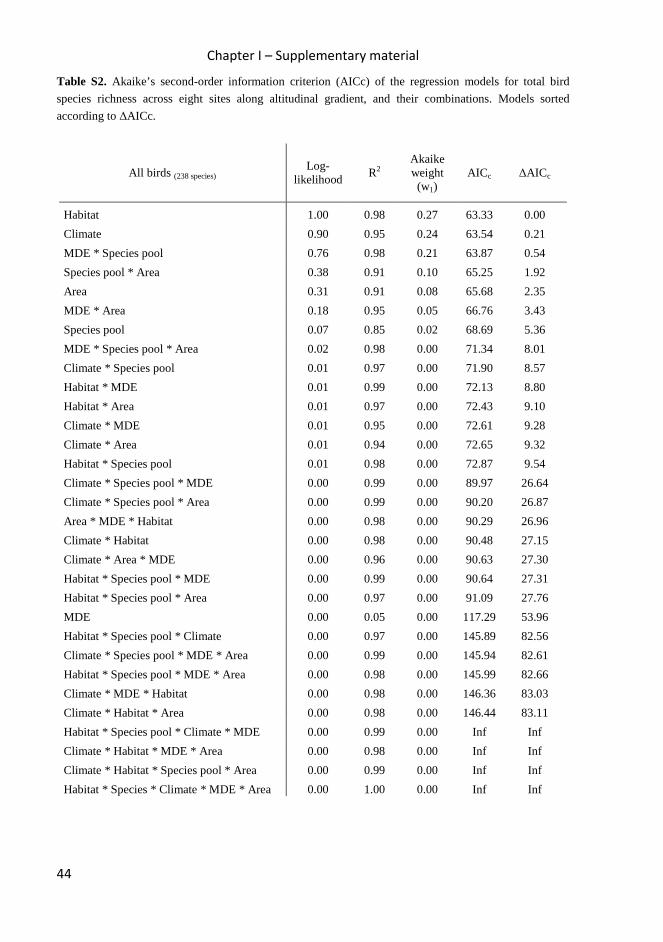
Chapter I – Supplementary material
44
Table S2. Akaike’s second-order information criterion (AICc) of the regression models for total bird
species richness across eight sites along altitudinal gradient, and their combinations. Models sorted
according to ∆AICc.
All birds (238 species) Log-
likelihood R2
Akaike weight (w1)
AICc ∆AICc
Habitat 1.00 0.98 0.27 63.33 0.00
Climate 0.90 0.95 0.24 63.54 0.21
MDE * Species pool 0.76 0.98 0.21 63.87 0.54
Species pool * Area 0.38 0.91 0.10 65.25 1.92
Area 0.31 0.91 0.08 65.68 2.35
MDE * Area 0.18 0.95 0.05 66.76 3.43
Species pool 0.07 0.85 0.02 68.69 5.36
MDE * Species pool * Area 0.02 0.98 0.00 71.34 8.01
Climate * Species pool 0.01 0.97 0.00 71.90 8.57
Habitat * MDE 0.01 0.99 0.00 72.13 8.80
Habitat * Area 0.01 0.97 0.00 72.43 9.10
Climate * MDE 0.01 0.95 0.00 72.61 9.28
Climate * Area 0.01 0.94 0.00 72.65 9.32
Habitat * Species pool 0.01 0.98 0.00 72.87 9.54
Climate * Species pool * MDE 0.00 0.99 0.00 89.97 26.64
Climate * Species pool * Area 0.00 0.99 0.00 90.20 26.87
Area * MDE * Habitat 0.00 0.98 0.00 90.29 26.96
Climate * Habitat 0.00 0.98 0.00 90.48 27.15
Climate * Area * MDE 0.00 0.96 0.00 90.63 27.30
Habitat * Species pool * MDE 0.00 0.99 0.00 90.64 27.31
Habitat * Species pool * Area 0.00 0.97 0.00 91.09 27.76
MDE 0.00 0.05 0.00 117.29 53.96
Habitat * Species pool * Climate 0.00 0.97 0.00 145.89 82.56
Climate * Species pool * MDE * Area 0.00 0.99 0.00 145.94 82.61
Habitat * Species pool * MDE * Area 0.00 0.98 0.00 145.99 82.66
Climate * MDE * Habitat 0.00 0.98 0.00 146.36 83.03
Climate * Habitat * Area 0.00 0.98 0.00 146.44 83.11
Habitat * Species pool * Climate * MDE 0.00 0.99 0.00 Inf Inf
Climate * Habitat * MDE * Area 0.00 0.98 0.00 Inf Inf
Climate * Habitat * Species pool * Area 0.00 0.99 0.00 Inf Inf
Habitat * Species * Climate * MDE * Area 0.00 1.00 0.00 Inf Inf
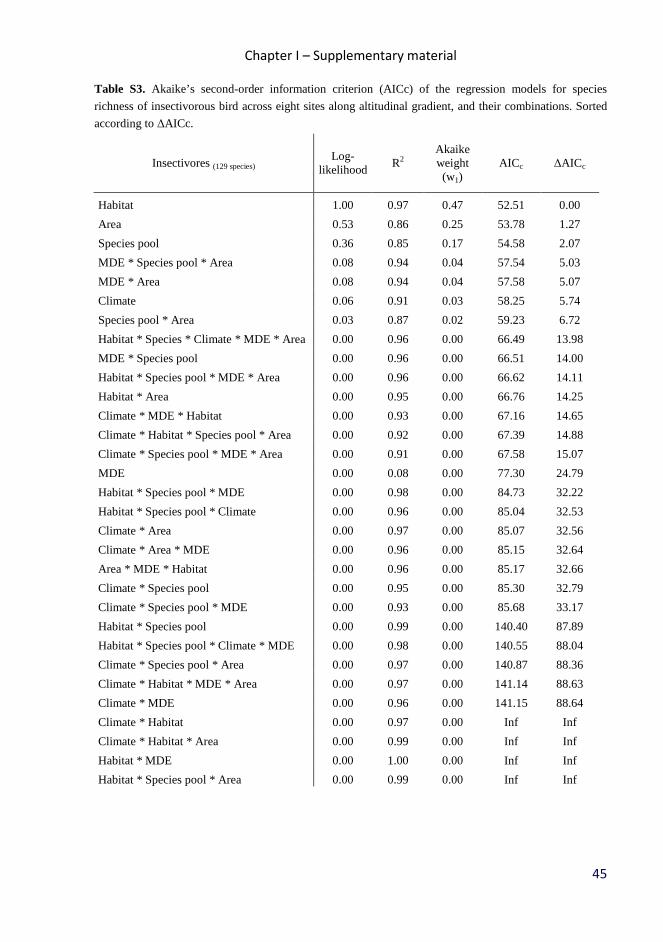
Chapter I – Supplementary material
45
Table S3. Akaike’s second-order information criterion (AICc) of the regression models for species
richness of insectivorous bird across eight sites along altitudinal gradient, and their combinations. Sorted
according to ∆AICc.
Insectivores (129 species) Log-
likelihood R2
Akaike weight (w1)
AICc ∆AICc
Habitat 1.00 0.97 0.47 52.51 0.00
Area 0.53 0.86 0.25 53.78 1.27
Species pool 0.36 0.85 0.17 54.58 2.07
MDE * Species pool * Area 0.08 0.94 0.04 57.54 5.03
MDE * Area 0.08 0.94 0.04 57.58 5.07
Climate 0.06 0.91 0.03 58.25 5.74
Species pool * Area 0.03 0.87 0.02 59.23 6.72
Habitat * Species * Climate * MDE * Area 0.00 0.96 0.00 66.49 13.98
MDE * Species pool 0.00 0.96 0.00 66.51 14.00
Habitat * Species pool * MDE * Area 0.00 0.96 0.00 66.62 14.11
Habitat * Area 0.00 0.95 0.00 66.76 14.25
Climate * MDE * Habitat 0.00 0.93 0.00 67.16 14.65
Climate * Habitat * Species pool * Area 0.00 0.92 0.00 67.39 14.88
Climate * Species pool * MDE * Area 0.00 0.91 0.00 67.58 15.07
MDE 0.00 0.08 0.00 77.30 24.79
Habitat * Species pool * MDE 0.00 0.98 0.00 84.73 32.22
Habitat * Species pool * Climate 0.00 0.96 0.00 85.04 32.53
Climate * Area 0.00 0.97 0.00 85.07 32.56
Climate * Area * MDE 0.00 0.96 0.00 85.15 32.64
Area * MDE * Habitat 0.00 0.96 0.00 85.17 32.66
Climate * Species pool 0.00 0.95 0.00 85.30 32.79
Climate * Species pool * MDE 0.00 0.93 0.00 85.68 33.17
Habitat * Species pool 0.00 0.99 0.00 140.40 87.89
Habitat * Species pool * Climate * MDE 0.00 0.98 0.00 140.55 88.04
Climate * Species pool * Area 0.00 0.97 0.00 140.87 88.36
Climate * Habitat * MDE * Area 0.00 0.97 0.00 141.14 88.63
Climate * MDE 0.00 0.96 0.00 141.15 88.64
Climate * Habitat 0.00 0.97 0.00 Inf Inf
Climate * Habitat * Area 0.00 0.99 0.00 Inf Inf
Habitat * MDE 0.00 1.00 0.00 Inf Inf
Habitat * Species pool * Area 0.00 0.99 0.00 Inf Inf
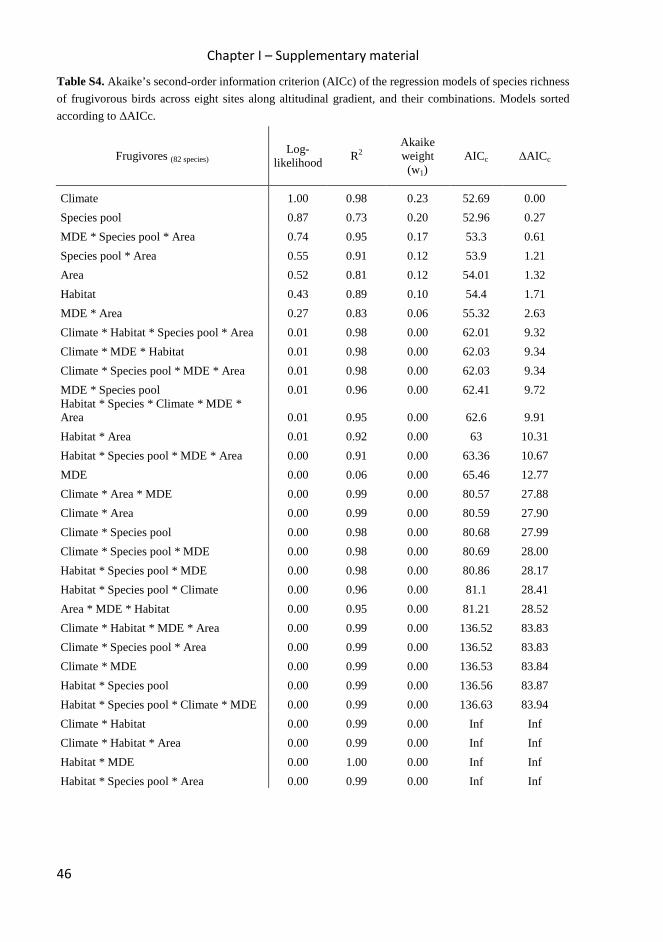
Chapter I – Supplementary material
46
Table S4. Akaike’s second-order information criterion (AICc) of the regression models of species richness
of frugivorous birds across eight sites along altitudinal gradient, and their combinations. Models sorted
according to ∆AICc.
Frugivores (82 species) Log-
likelihood R2
Akaike weight (w1)
AICc ∆AICc
Climate 1.00 0.98 0.23 52.69 0.00
Species pool 0.87 0.73 0.20 52.96 0.27
MDE * Species pool * Area 0.74 0.95 0.17 53.3 0.61
Species pool * Area 0.55 0.91 0.12 53.9 1.21
Area 0.52 0.81 0.12 54.01 1.32
Habitat 0.43 0.89 0.10 54.4 1.71
MDE * Area 0.27 0.83 0.06 55.32 2.63
Climate * Habitat * Species pool * Area 0.01 0.98 0.00 62.01 9.32
Climate * MDE * Habitat 0.01 0.98 0.00 62.03 9.34
Climate * Species pool * MDE * Area 0.01 0.98 0.00 62.03 9.34
MDE * Species pool 0.01 0.96 0.00 62.41 9.72 Habitat * Species * Climate * MDE * Area 0.01 0.95 0.00 62.6 9.91
Habitat * Area 0.01 0.92 0.00 63 10.31
Habitat * Species pool * MDE * Area 0.00 0.91 0.00 63.36 10.67
MDE 0.00 0.06 0.00 65.46 12.77
Climate * Area * MDE 0.00 0.99 0.00 80.57 27.88
Climate * Area 0.00 0.99 0.00 80.59 27.90
Climate * Species pool 0.00 0.98 0.00 80.68 27.99
Climate * Species pool * MDE 0.00 0.98 0.00 80.69 28.00
Habitat * Species pool * MDE 0.00 0.98 0.00 80.86 28.17
Habitat * Species pool * Climate 0.00 0.96 0.00 81.1 28.41
Area * MDE * Habitat 0.00 0.95 0.00 81.21 28.52
Climate * Habitat * MDE * Area 0.00 0.99 0.00 136.52 83.83
Climate * Species pool * Area 0.00 0.99 0.00 136.52 83.83
Climate * MDE 0.00 0.99 0.00 136.53 83.84
Habitat * Species pool 0.00 0.99 0.00 136.56 83.87
Habitat * Species pool * Climate * MDE 0.00 0.99 0.00 136.63 83.94
Climate * Habitat 0.00 0.99 0.00 Inf Inf
Climate * Habitat * Area 0.00 0.99 0.00 Inf Inf
Habitat * MDE 0.00 1.00 0.00 Inf Inf
Habitat * Species pool * Area 0.00 0.99 0.00 Inf Inf
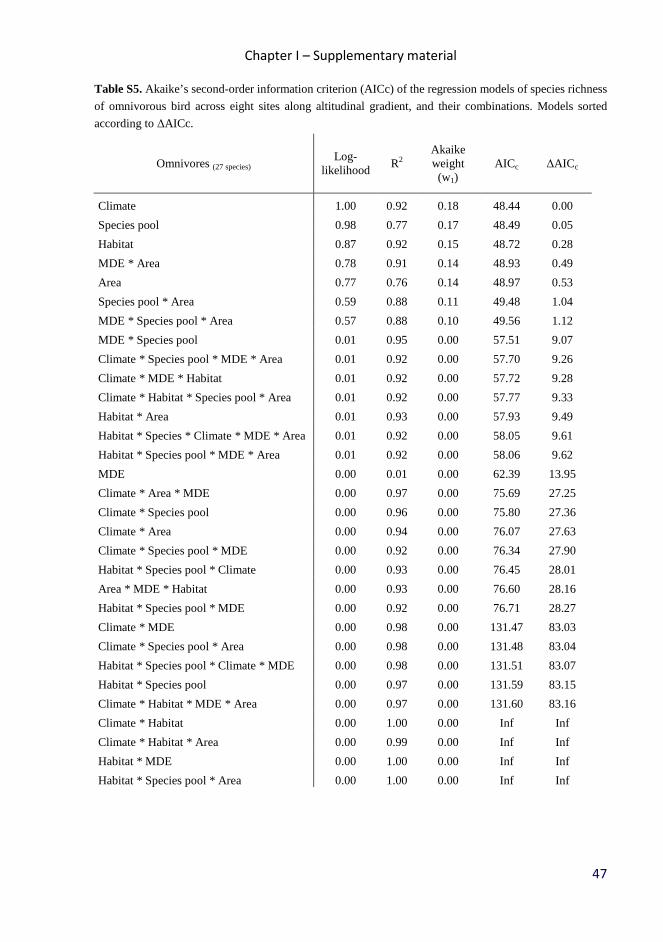
Chapter I – Supplementary material
47
Table S5. Akaike’s second-order information criterion (AICc) of the regression models of species richness
of omnivorous bird across eight sites along altitudinal gradient, and their combinations. Models sorted
according to ∆AICc.
Omnivores (27 species) Log-
likelihood R2
Akaike weight (w1)
AICc ∆AICc
Climate 1.00 0.92 0.18 48.44 0.00
Species pool 0.98 0.77 0.17 48.49 0.05
Habitat 0.87 0.92 0.15 48.72 0.28
MDE * Area 0.78 0.91 0.14 48.93 0.49
Area 0.77 0.76 0.14 48.97 0.53
Species pool * Area 0.59 0.88 0.11 49.48 1.04
MDE * Species pool * Area 0.57 0.88 0.10 49.56 1.12
MDE * Species pool 0.01 0.95 0.00 57.51 9.07
Climate * Species pool * MDE * Area 0.01 0.92 0.00 57.70 9.26
Climate * MDE * Habitat 0.01 0.92 0.00 57.72 9.28
Climate * Habitat * Species pool * Area 0.01 0.92 0.00 57.77 9.33
Habitat * Area 0.01 0.93 0.00 57.93 9.49
Habitat * Species * Climate * MDE * Area 0.01 0.92 0.00 58.05 9.61
Habitat * Species pool * MDE * Area 0.01 0.92 0.00 58.06 9.62
MDE 0.00 0.01 0.00 62.39 13.95
Climate * Area * MDE 0.00 0.97 0.00 75.69 27.25
Climate * Species pool 0.00 0.96 0.00 75.80 27.36
Climate * Area 0.00 0.94 0.00 76.07 27.63
Climate * Species pool * MDE 0.00 0.92 0.00 76.34 27.90
Habitat * Species pool * Climate 0.00 0.93 0.00 76.45 28.01
Area * MDE * Habitat 0.00 0.93 0.00 76.60 28.16
Habitat * Species pool * MDE 0.00 0.92 0.00 76.71 28.27
Climate * MDE 0.00 0.98 0.00 131.47 83.03
Climate * Species pool * Area 0.00 0.98 0.00 131.48 83.04
Habitat * Species pool * Climate * MDE 0.00 0.98 0.00 131.51 83.07
Habitat * Species pool 0.00 0.97 0.00 131.59 83.15
Climate * Habitat * MDE * Area 0.00 0.97 0.00 131.60 83.16
Climate * Habitat 0.00 1.00 0.00 Inf Inf
Climate * Habitat * Area 0.00 0.99 0.00 Inf Inf
Habitat * MDE 0.00 1.00 0.00 Inf Inf
Habitat * Species pool * Area 0.00 1.00 0.00 Inf Inf
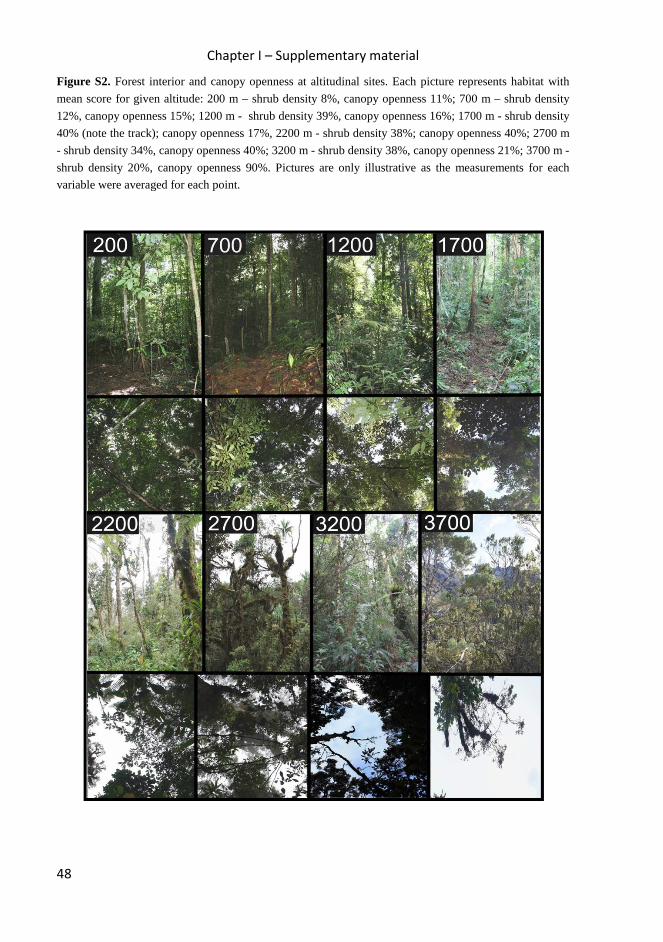
Chapter I – Supplementary material
48
Figure S2. Forest interior and canopy openness at altitudinal sites. Each picture represents habitat with
mean score for given altitude: 200 m – shrub density 8%, canopy openness 11%; 700 m – shrub density
12%, canopy openness 15%; 1200 m - shrub density 39%, canopy openness 16%; 1700 m - shrub density
40% (note the track); canopy openness 17%, 2200 m - shrub density 38%; canopy openness 40%; 2700 m
- shrub density 34%, canopy openness 40%; 3200 m - shrub density 38%, canopy openness 21%; 3700 m -
shrub density 20%, canopy openness 90%. Pictures are only illustrative as the measurements for each
variable were averaged for each point.
Chapter II
49
Chapter II New avian records and range shifts of birds along altitudinal gradient of
Mt.Wilhelm, Papua New Guinea
Katerina Tvardikova
(manuscript in review)

Chapter II
50

Chapter II
51
New avian records and range shifts of birds along altitudinal gradient of Mt. Wilhelm, Papua New Guinea
by Katerina Tvardikova
Faculty of Science, University of South Bohemia and Biology Center, and Academy of
Sciences, Institute of Entomology, Branisovska 31, 370 05 Ceske Budejovice, Czech
Republic
Email: [email protected]
SUMMARY - East slopes of Mt. Wilhelm, the highest peak of Papua New Guinea,
provide continuous rainforest altitudinal gradient ranging from 200 m to the tree
line at 3,700 m. Based on the field work conducted in 2010 – 2012 and three
expeditions along the Mt. Wilhelm altitudinal gradient; we present novel
distributional information for 52 bird species. This includes range extensions,
demographic data and altitudinal range shifts. We recorded 29 bird species with
upwards range shifts compared to previously published literature, and tentatively
conclude that upward (but not downward) range extensions and shifts are
probably real, rather than resulting from poor quality of previous information.
Complete list of species recorded during our work at eight altitudinal study sites
includes 259 species.
The island of New Guinea has a complex geologic and tectonic history (Hall 2002) that
has accounted for its complicated biogeography. Although birds are globally well
known taxonomically, field research on New Guinea continues to uncover taxa new to
science and complex biogeographical patterns (Diamond 1985; Beehler et al. 2007;
Beehler and Prawiradilaga 2010). The island is divided into southern and northern
watersheds by the comparatively well-explored Central Range (Diamond 1985).
However, most of the Central Range was visited by Western ornithologists much later
than smaller ranges, for example Fakfak region (1986 – by Doherty and Schadler from
Rotschild and Leided Museums; Rheindt 2012) or Adalbert Mountains (Beehler et al.
1986). Despite its relatively good exploration, and improved access to the Central
Range, ornithological exploration has been slow in the last decades. Recent expeditions
were notable exceptions, and resulted in many discoveries, including up to four bird
taxa new to science (Beehler et al. 2007; Beehler and Prawiradilaga 2010 ).
To our knowledge, there has been no intensive ornithological survey on the
eastern slopes of Mt. Wilhelm. Usually, only the upper most altitudes are visited by
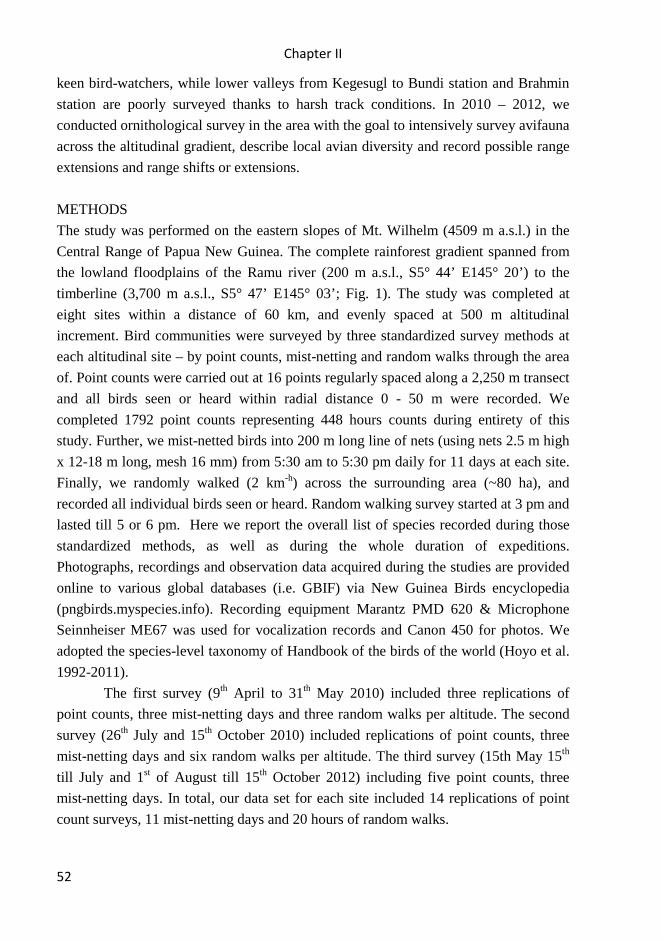
Chapter II
52
keen bird-watchers, while lower valleys from Kegesugl to Bundi station and Brahmin
station are poorly surveyed thanks to harsh track conditions. In 2010 – 2012, we
conducted ornithological survey in the area with the goal to intensively survey avifauna
across the altitudinal gradient, describe local avian diversity and record possible range
extensions and range shifts or extensions.
METHODS
The study was performed on the eastern slopes of Mt. Wilhelm (4509 m a.s.l.) in the
Central Range of Papua New Guinea. The complete rainforest gradient spanned from
the lowland floodplains of the Ramu river (200 m a.s.l., S5° 44’ E145° 20’) to the
timberline (3,700 m a.s.l., S5° 47’ E145° 03’; Fig. 1). The study was completed at
eight sites within a distance of 60 km, and evenly spaced at 500 m altitudinal
increment. Bird communities were surveyed by three standardized survey methods at
each altitudinal site – by point counts, mist-netting and random walks through the area
of. Point counts were carried out at 16 points regularly spaced along a 2,250 m transect
and all birds seen or heard within radial distance 0 - 50 m were recorded. We
completed 1792 point counts representing 448 hours counts during entirety of this
study. Further, we mist-netted birds into 200 m long line of nets (using nets 2.5 m high
x 12-18 m long, mesh 16 mm) from 5:30 am to 5:30 pm daily for 11 days at each site.
Finally, we randomly walked (2 km-h) across the surrounding area (~80 ha), and
recorded all individual birds seen or heard. Random walking survey started at 3 pm and
lasted till 5 or 6 pm. Here we report the overall list of species recorded during those
standardized methods, as well as during the whole duration of expeditions.
Photographs, recordings and observation data acquired during the studies are provided
online to various global databases (i.e. GBIF) via New Guinea Birds encyclopedia
(pngbirds.myspecies.info). Recording equipment Marantz PMD 620 & Microphone
Seinnheiser ME67 was used for vocalization records and Canon 450 for photos. We
adopted the species-level taxonomy of Handbook of the birds of the world (Hoyo et al.
1992-2011).
The first survey (9th April to 31th May 2010) included three replications of
point counts, three mist-netting days and three random walks per altitude. The second
survey (26th July and 15th October 2010) included replications of point counts, three
mist-netting days and six random walks per altitude. The third survey (15th May 15th
till July and 1st of August till 15th October 2012) including five point counts, three
mist-netting days. In total, our data set for each site included 14 replications of point
count surveys, 11 mist-netting days and 20 hours of random walks.
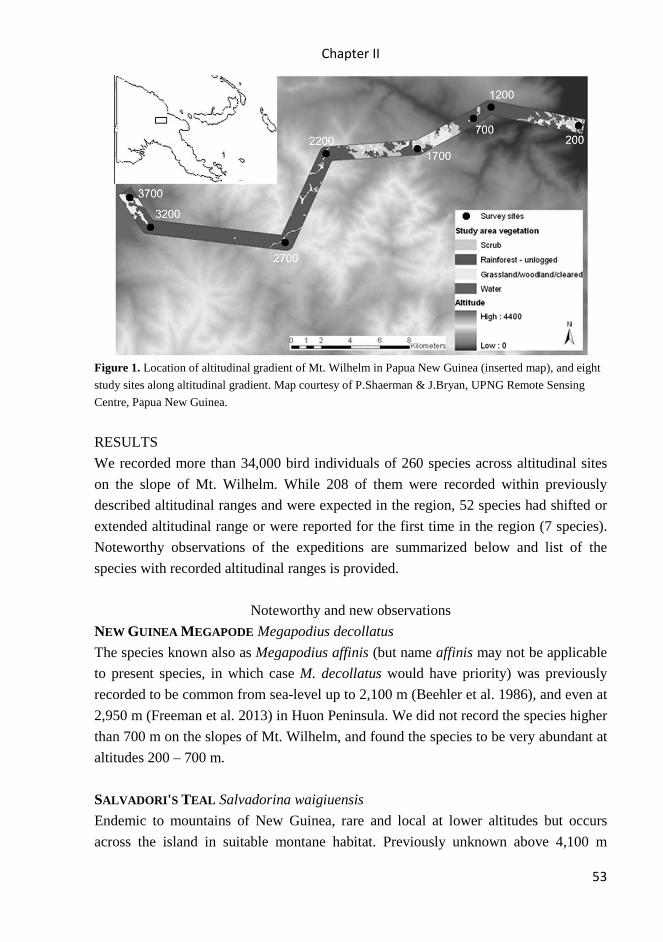
Chapter II
53
Figure 1. Location of altitudinal gradient of Mt. Wilhelm in Papua New Guinea (inserted map), and eight
study sites along altitudinal gradient. Map courtesy of P.Shaerman & J.Bryan, UPNG Remote Sensing
Centre, Papua New Guinea.
RESULTS
We recorded more than 34,000 bird individuals of 260 species across altitudinal sites
on the slope of Mt. Wilhelm. While 208 of them were recorded within previously
described altitudinal ranges and were expected in the region, 52 species had shifted or
extended altitudinal range or were reported for the first time in the region (7 species).
Noteworthy observations of the expeditions are summarized below and list of the
species with recorded altitudinal ranges is provided.
Noteworthy and new observations
NEW GUINEA MEGAPODE Megapodius decollatus
The species known also as Megapodius affinis (but name affinis may not be applicable
to present species, in which case M. decollatus would have priority) was previously
recorded to be common from sea-level up to 2,100 m (Beehler et al. 1986), and even at
2,950 m (Freeman et al. 2013) in Huon Peninsula. We did not record the species higher
than 700 m on the slopes of Mt. Wilhelm, and found the species to be very abundant at
altitudes 200 – 700 m.
SALVADORI 'S TEAL Salvadorina waigiuensis
Endemic to mountains of New Guinea, rare and local at lower altitudes but occurs
across the island in suitable montane habitat. Previously unknown above 4,100 m

Chapter II
54
(Coates and Peckover 2001), we report observations at 4,500 m. Two individuals
active early morning were observed in 2010.
GREAT-BILLED HERON Ardea sumatrana
Beehler et al. (1986) considered this a scarce resident throughout New Guinea’s
lowlands. Previously unknown from the region, we report the species at c. 300 m, on
the river banks close to Brahmin station.
FOREST BITTERN Zonerodius heliosylus
Reported to occur at 100 - 300 m above sea level, but occasionally recorded up to 1430
m (Beehler et al. 1986). Here report the species at c. 1,650 m, close by Bundi Station,
from the region without previous records.
BLACK -WINGED K ITE Elanus caeruleus
The hunting attempt above shrubby area in the valley between 3,200 and 3,700 m were
observed in 2011. Such observation is higher than expected altitudinal ranges (Beehler
et al. 1986), and even higher than current report on upper limit of distribution from Mt.
Hagen (GBIF records). The species seems to be rare in the surveyed region.
BRAHMINY K ITE Haliastur indus
Previously unknown above 1,700 m (Coates and Peckover 2001), here we report
species to be regular visitor at 2,200 m.
BLACK -MANTLED GOSHAWK Accipiter melanochlamys
Previously unknown above 3,000 m (Coates and Peckover 2001), and reported up to
2420 in Huon Peninsula (Freeman et al. 2013) we report the species regularly from c.
3500 m, overflying the valley to 3,200 m, both in 2010 and 2012.
MEYER'S GOSHAWK Accipiter meyerianus
Previously assumed to occur from sear sea-level to at least to 2,700 m (Beehler et al.
1986), we did not find the species above 2,200 m. However the species was recently
observed in Mt. Hagen region, our records may be the first from the area on the eastern
slopes of Mt. Wilhelm.
L ITTLE EAGLE Hieraaetus morphnoides
On 26th September 2012, we made the one record of the species in this region. The
species expected to occur all around New Guinea seems to be rare resident in the

Chapter II
55
region, with more observation reported from south and west side of the Central Range,
and the closest previous observation from Mt. Hagen.
FORBES'S FOREST RAIL Rallina forbesi
Bird was previously known from range 1,000 – 3,000 m (Coates and Peckover 2001),
we reported to be quite common at altitudes between 2,200 – 3,200 m, and the most
abundant at 2,700 m where we also mist-netted two individuals.
BARE-EYED RAIL Gymnocrex plumbeiventris
First observation of the bird in the region, recorded outside of the survey areas at 1,300
m, 20th September 2012. Previously reported altitudinal range is from sea-level to
1,200 m (Beehler et al. 1986), but with maximum up to 1,600 m in east New Guinea.
NEW GUINEA WOODCOCK Scolopax saturate
Known to occur in New Guinea mountains between 1,500 and 3,000 m (Beehler et al.
1986), here we report an observation from 2,700 m from region without previous
records, but where the species was expected to occur (Beehler et al. 1986).
WHITE -THROATED PIGEON Columba vitiensis
Here we describe extension of altitudinal range, and report the species to be regularly
seen at 2,700 m in 2010, and rarely in 2012. Commonly seen also at 2,200 m. Peckover
and Filewood (1976) reported a mist-netted individual at 2,700 m, while Mayr (1941)
considered the pigeon to be a lowland species with distribution up to 1,400 m.
BROWN CUCKOO-DOVE Macropygia amboinensis
In Papua New Guinea known to occur in mainland from sea level up to 1800, locally to
2100 m (Beehler et al. 1986). We report the species to be very common at all altitudes
from 200 to 2,200 m, having similar abundances at all surveyed sites, while only
slightly more abundant at 200 m.
BLACK -BILLED CUCKOO-DOVE Macropygia nigrirostris
The species is well known from the region, expected to occur from sea-level up to
2,600 m (Beehler et al. 1986), but we report the species only at 2,700 m. Macropygia
amboinensis, a bird with similar vocalization is more common in the region, calling
slowly, with more pronounced “whu” sylabes, while Macropygia nigrirostris has a
rapidly descending higher pitched series of muted “kwok” notes decreasing in volume.
Chapter II
56
THICK -BILLED GROUND PIGEON Trugon terrestris
Known to inhabit rain forest and monsoon forest and lowlands and hills up to 640 m
(Coates and Peckover 2001), but previously unknown from the region. Villagers killed
one specimen at c. 1,100 m, but seen at sites 700 m.
PHEASANT PIGEON Otidiphaps nobilis
The previous highest-elevation record was 1,900 m (Beehler et al. 1986), and sound
heard 2,050 m in Huon Peninsula (Freeman et al. 2013). We have seen 1 individual at
1,700 m in 2010 and three individuals at 2,200 m in 2010 and 2012. The species seems
to be scarce throughout the region, similarly to situation in other ranges (Diamond
1985).
CORONETED FRUIT DOVE Ptilinopus coronulatus
While previously known up to 1,200 m (Beehler et al. 1986), we recorded the species
at all altitudinal sites from 200 – 1,700 m. The observed individuals were identified as
subspecies quadrigeminus.
ORNATE FRUIT DOVE Ptilinopus ornatus
Previously found primarily within altitude range of 200-1,350 m, but suspected to be
apparently nomadic up to 2,500 m (Beehler et al. 1986). We confirm eight individuals
from 2,200 m in 2010.
SHINING IMPERIAL PIGEON Ducula chalconota
Primary montane forest, generally at altitude range of 1,400 – 2,500 m, though
occasionally down to 1100 m (Beehler et al. 1986). We have seen the species regularly
between 1,700 – 2,700 m.
PESQUET'S PARROT Psittrichas fulgidus
The species is threatened by hunting, with a handful of records up to 2000 m (Beehler
et al. 1986), and altitudinal range from 600 to 2,420 along Huon Peninsula (Freeman et
al. 2013). We observed only two individuals at 2,200 m, confirming thus higher
altitudinal range.
DUSKY LORY Pseudeos fuscata
With records up to 2,400 m (Beehler et al. 1986), we report altitudinal range extension,
and species being very common at altitudes 2,200 m and 2,700 m, but present at 200,
and from 1,700 to 2,700 m.
Chapter II
57
GOLDIE 'S LORIKEET Psitteuteles goldiei (2,700 – 3,200 m)
Previously reported range up to 2,800 m (Beehler et al. 1986), and uncommon
observations at 1,330 m and 1,600 m from Huon Peninsula (Freeman et al. 2013). We
species to be common at 2,700 m and observed flock of seven individuals in two
successive days at 3,200 m on a flowering tree together with Astrapia stephaniae.
PYGMY LORIKEET Charmosyna wilhelminae (700 – 1,200 m)
Uncommon and possibly overlooked species (Beehler et al. 1986) of mountain forest
frequently descending into lowland forest at bases of mountains or at sea level, found
from 1,000 to 2,200 m. We reported most of the individuals at 1,200 m but also some
descending to 700 m.
RED-FRONTED LORIKEET Charmosyna rubronotata (200 m)
However previously reported only from north-western extremity of New Guinea, we
observed individuals of genus Charmosyna with distinct red forecrown, and blue ear
coverts (not blue coverts and red lores, cheeks and upper throat). The species was
never observed together in flocks with Charmosyna placensis but once in mixed flock
with Lorius lory.
BREHM 'S TIGER PARROT Psittacella brehmii (2,200 – 2,700 m)
Previously reported to be resident from 1,500 to 2,600 in Central Range (Beehler et al.
1986), and inhabiting higher altitudinal range in Huon Peninsula from 1,700 m to at
least 3,050 m, and being abundant at 2,700 – 3,050 m (Freeman et al. 2013). We report
species present 2,200 – 2,700 m in Central Range, with two individuals mist-netted at
2,700 m.
CHESTNUT-BREASTED CUCKOO Cacomantis castaneiventris
A resident of hill forest at 500 – 2,300 m (Beehler et al. 1986), reported to range as low
as 300 m in Huon Peninsula (Freeman et al. 2013). We mist-netted one individual at
200 m, and species was very common at altitudes 1,700 – 2,200 m, with only 3
individuals recorded at 2,700 m.
RUFOUS-THROATED BRONZE CUCKOO Chrysococcyx ruficollis
Previously was the species expected in montane forest and forest edges in highlands;
mainly at 1,800 – 2,600 m, vagrant individuals up to 3,350 m (Beehler et al. 1986), and
newly was reported from Huon Peninsula from 2,100, 2850 and 3,000 m (Freeman et
al. 2013). We observed the species uncommonly at sites 2,700 and 3,200 m.
Chapter II
58
RUFOUS OWL Ninox rufa
This lowland species was known to occur only below 2,000 m (Marks et al. 1999). We
observed few individuals active till 6 am, and associated the species with low-pitched
double hoot, soft “hu-hu” at 1,700 m, which is possibly duet call of a pair.
BARKING OWL Ninox connivens
Their dog-like barking common at altitudes around Bundi village c. 1,500 m. Species
is believed to predict a death in the village, in the direction from where the bird call.
Altitudinal distribution of species in New Guinea is not known, but our observation
higher than all other available records. All available records from New Guinea are
scatter across eastern Highlands, Sepik, Karkar and Manam.
JUNGLE HAWK -OWL Ninox theomacha
Species known to occur up to c. 2,500 m, reported at 2,000 – 2,100 m by Frank
Lambert, and at 30 m by Nick Anthas (Xeno-canto 2013). We report the species to be
common from 200 - 2,200 m.
MARBLED FROGMOUTH Podargus ocellatus
Species expected to be mainly in lowlands, but recorded up to 800 m in Australia and
to 1,500 m in New Guinea (Coates and Peckover 2001). We recorded the species at
1,200 – 2,200 m, and mist-netted at 1,700 m.
PACIFIC SWIFT Apus pacificus
Pacific swift is Asian species wintering in New Guinea and Australia. Similarly to
previous records from Huon Peninsula (Freeman et al. 2013), we recorded this winter
migrant till early June 2010 at 200 m, but only till April 2012 at the same sites. This
would suggest that some populations stay in New Guinea instead of returning to Asia
for breeding. Beehler et al. (1986) previously reported the bird only in southern
watersheds and western Vogelkop.
MOUNTAIN K INGFISHER Syma megarhyncha
Previously reported from range 1,200 – 2,200 m (Beehler et al. 1986), we heard the
species at 2,700 m and saw one individual along the track at c. 2,600 m. In most of the
New Guinean mountains, S. megarhyncha replaces S.torotoro at altitude 1,000 m
(Beehler et al. 1986). Despite our effort, we failed to record S. torotoro higher than 200
m, while our observations of S. megarhyncha would lead us to conclusion that the
species was possibly overlooked. Given the difficulties with identification and
Chapter II
59
observation of kingfishers in the field, further research would be needed to reveal
possible presence of S. torotoro in the region, and altitudinal ranges of two species.
RAINBOW BEE-EATER Merops ornatus
Species is widespread in east Guinea and Australia, with main wintering ground for
Australian birds in New Guinea, with some populations obviously resident all year
round. We thus support those assumptions by observation of the species at 200 m
during all surveys, throughout all years. Merops philippinus was not confirmed from
the sites and all observed individuals had yellow-orange foreheads (not greenish), and
broad black eye stripe, bordered with narrow blue line above (not white).
PAPUAN HORNBILL Rhyticeros plicatus
The species was recorded regularly from 200 to 1,200 m during censuses. One pair
seen overfly Bundi station, and confirmed by villagers that species regularly come to
their gardens at c. 1,500 – 1,600 m.
PAPUAN TREECREEPER Cormobates placens
The subspecies steini is known from west and central New Guinea from Weyland Mts.
east through Hindenburg Range to Tari Gap area. The subspecies meridionalis is
known from mountains of south-east New Guinea (east from Aseki area, Mt. Kaindi
and Herzog Mts.). Two more recent records come from Tari Valley (Nick Anthas,
Xeno-canto 2013). The species is known to occur between 1,250 – 2,600 m. We
recorder the species at 2,630 m, outside of it’s know range, but we were not able
identify subspecies.
OBSCURE HONEYEATER Lichenostomus obscurus
We may report first record of the species for the region from 1,200 m. The subspecies
obscurus was previously known to be patchily distributed on lower slopes of N, C &
SE New Guinea east from Weyland Mts. (Hoyo et al. 1992-2011), from altitudes
between 200 m and 1,100 m, occasionally as high as 1,400 m (Coates and Peckover
2001).
HILL -FOREST HONEYEATER Meliphaga orientalis
Mostly lower and middle mountains, from 550 m to c. 2,100 m, and only member of
genus common (or present) above 1,400 (Beehler et al. 1986). We mist-netted the birds
quite commonly at altitudinal sites from 1,700 to 2,700 m (seven individuals).
Chapter II
60
LONG-BEARDED HONEYEATER Melidectes princeps
The species endemic to few valleys on Mt. Giluwe, Mt. Hagen, and Kubor Range,
known mainly from 3,000 – 3,800 m, but recently recorded to 4,200 m and extends as
low as 2,750 m (Coates and Peckover 2001). On Mt. Wilhelm, reported to occur
mainly above 3,050 m (Coates and Peckover 2001). We observed the species to be
very abundant between 3,200 and 3,700 m at Mt.Wilhelm. Despite the effort, no
individuals were reported in denser forest growths, and species seems to follow
scattered trees along the tree line. While range restricted species endemic to small areas
(the population at Mt. Wilhelm covers c. 200 ha) the species is one of the most
common bird species recorded in the region. Specific relationship between locally
endemic mites observed on local flowering Rhododendrons were observed, and needs
to be further investigated.
CINNAMON -BREASTED HONEYEATER Melidectes torquatus
The species inhabits lower and middle montane forest, forest edges. Typically prefers
semi-open habitats from 950 m to 1,900 m, and 1,200-1,700 in Central Range (Hoyo et
al. 1992-2011). Along the gradient, we observed species to be common at sites 1,200
and 1,700 m, but indentified seven individuals also at 2,200 m. This can be due to very
suitable conditions and many open areas along the tracks from Bundi station (1,700 m)
to Sinopass (2,200 m), where many flowering trees were present along the road and
adjacent gardens.
OLIVE -STREAKED HONEYEATER Ptiloprora meekiana
A resident of Saruwaged Mt.s (Huon Peninsula), Herzog Mts. and mountains of upper
Mambare range and Mt. Tafa-Efogi. We bring the first record for its (subspecies
meekiana) presence at c.2500 m. The birds were seen on along the track in May 2012,
foraging on flowering tree. Call is non-distinctive “chip” or “schip“.
BICOLOURED MOUSE WARBLER Crateroscelis nigrorufa
The species is patchily distributed throughout foothill forest of New Guinea, with very
restricted altitudinal range (Beehler et al. 1986). We found the species to e abundant at
1,700 m, and even more individuals singing uphill around 1,770 – 1,790 m. The
surprising local abundance of this species with restricted range, in comparison, there
are just 38 specimen records in ORNIS database from anywhere around Papua New
Guinea (Freeman et al. 2013).
Chapter II
61
BUFF-FACED SCRUBWREN Sericornis perspicillatus (1,700 – 2,700 m)/ PAPUAN
SCRUBWREN Sericornis papuensis (1,700 – 3,200 m)
Two similar species (S. perspicillatus and papuensis), differ strongly in its vocalization
and could be easily distinguished in the forest while singing. In hand, Papuan
Scrubwren posses dark subterminal tail-band (95%, N = 64), and brownish-buff crown
and forecrown. Buff-faced Scrubwren has crown grey and subterminal tail-band was
not observed in individuals inspected by K.Tvardikova (~70%, N = 73). Along the
gradient, S. perspicillatus was very abundant at altitudes 1,700 – 2,200 m with
abundances decreasing towards 2,700, while S. papuensis was getting more abundant
towards upper range limits at 3,200 m.
STOUT-BILLED CUCKOO-SHRIKE Coracina caeruleogrisea
In New Guinea was known mainly in lowlands, hill forest and lower mountains,
present from sea-level up to 1,700 m, rarely up to 2,450 m (Beehler et al. 1986).
Species was recorded also at Tari gap at 2500 m in 1990 by Niels Poul Dreyer (Xeno-
canto 2013). We observed individuals feeding at 2,700 m in September 2012, and
heard the distinctive sound often at all sites between 700 to 2,700 m, and mist-netted
male at 2,200 m.
GOLDEN CUCKOO-SHRIKE Campochaera sloetii
The species was previously known only from Arfak Mts. and east to Wawak area
(subspecies sloetii) and from south New Guinea lowlands from Range Mimika east to
Moroka, and foothills of Owen Stanley Range (subspecies flaviceps) (Hoyo et al.
1992-2011), but we made observations at altitudinal sites 200 and 1,200 m. Also our
other surveys across Madang lowlands confirmed the species to be rare resident
patchily distributed along Ramu river.
BLACK SICKLEBILL Epimachus fastuosus (1,200 – 2,700 m)/BROWN SICKLEBILL
Epimachus meyeri (1,700 – 3,200 m)
Sicklebills are known from middle montane primary forest, more rarely in adjacent
second growth and garden edges. E. fastuosus were previously described from 1,280 –
2,550 m, mainly in narrow elevational zone of 1,800 - 1,500 m; and predominate at
lower elevation than E. meyeri. We observed the ranges to be broadly overlapped, with
E. meyeri very abundant and E. fastuosus observed only in few individuals.
Chapter II
62
RUFOUS-COLLARED MONARCH Arses insularis
Previously known to have altitudinal range from 230 – 1,200 m (Beehler et al. 1986;
Freeman et al. 2013), we observed and mist-netted the species often at sites from 200
to 1,700 m.
BLACK SITTELLA Daphoenositta miranda
We present first records for the species, which was previously, known for the same
altitudes from Snow Mts, Kubor Range, Mt. Giluwe, Mt. Tafa, Mt. Scratchley and Mt.
Albert Edward (Hoyo et al. 1992-2011). The species is rare resident between 2,700 and
3,700 m of the gradient.
TREEFERN GERYGONE Gerygone ruficollis
This montane species was previously recorded from 1100 upwards, to c. 3300 m in
Snow Mts. and south-east New Guinea; being the most common at lower and middle
altitudes. Recently found to be abundant at 1300 m in Fakfak mountains (Rheindt
2012). Despite the effort, we failed to confirm the presence lower than 1,700 m, but
reported range extensions up to tree line at 3,700 m.
VARIABLE PITOHUI Pitohui kirhocephalus (200 – 1,200 m)/HOODED PITOHUI
Pitohui dichrous (700 – 1,700 m)
Those sister species (Dumbacher et al. 2008) appear to replace each other altitudinally
over most of the New Guinea ranges (Beehler et al. 1986). We confirm P.
kirhocephalus to be lowland species, while P.dichorus inhabits higher altitudes. On the
other hand, we can’t confirm strictly exclusive ranges. At site 1,200 m, both species
were seen in syntopy (recorded to have exactly the same abundances), and sometimes
recorded at the same point. The abundance patters do not suggest that species are
widely sympatric; rather our locality may lie at an altitude where species are in narrow
contact. The zone of transition is however much higher than previously reported in
Fakfak Mts. (Rheindt 2012).
The list of 208 recorded species with observed altitudinal distribution: DWARF CASSOWARY Casuarius bennetti (2,700 m) WATTLED BRUSH TURKEY Aepypodius arfakianus (1,700 m) BROWN-COLLARED BRUSH TURKEY Talegalla jobiensis (1,200 m) PACIFIC BLACK DUCK Anas superciliosa (3500 m) LONG-TAILED BUZZARD Henicopernis longicauda (200 – 700 m) BLACK KITE Milvus migrans (200 – 1700 m) WHISTLING KITE Haliastur sphenurus (200 – 700 m) GREY GOSHAWK Accipiter novaehollandiae (700 m) PAPUAN HARPY EAGLE Harpyopsis novaeguineae (200 – 1200 m, 2200 – 3200 m) GREAT CUCKOO-DOVE Reinwardtoena reinwardtii (200 - 3,200 m)
Chapter II
63
EMERALD DOVE Chalcophaps indica (200 - 700 m) STEPHAN'S DOVE Chalcophaps stephani (200 – 1,200 m) NEW GUINEA BRONZEWING Henicophaps albifrons (200 – 1,200 m) WHITE-BIBBED GROUND DOVE Gallicolumba jobiensis (2,200 m) BRONZE GROUND DOVE Gallicolumba beccarii (1,200 – 1,700 m) WOMPOO FRUIT DOVE Ptilinopus magnificus (700 – 1,200 m) PINK-SPOTTED FRUIT DOVE Ptilinopus perlatus (200 – 700 m) SUPERB FRUIT DOVE Ptilinopus superbus (200 – 2,200 m) BEAUTIFUL FRUIT DOVE Ptilinopus pulchellus (200 – 1,200 m) WHITE-BIBBED FRUIT DOVE Ptilinopus rivoli (1,700 – 3,200 m) ORANGE-BELLIED FRUIT DOVE Ptilinopus iozonus (200 m) PURPLE-TAILED IMPERIAL PIGEON Ducula rufigaster (200 m) PINON'S IMPERIAL PIGEON Ducula pinon (200 m) ZOE'S IMPERIAL PIGEON Ducula zoeae (200 – 1,200 m) PAPUAN MOUNTAIN PIGEON Gymnophaps albertisii (1,700 – 3,700 m) ORANGE-FRONTED HANGING PARROT Loriculus aurantiifrons (200 m) BUFF-FACED PYGMY PARROT Micropsitta pusio (200 – 700 m) RED-BREASTED PYGMY PARROT Micropsitta bruijnii (700 – 1,200 m) PALM COCKATOO Probosciger aterrimus (200 – 1,200 m) SULPHUR-CRESTED COCKATOO Cacatua galerita (200 – 1,200 m) RAINBOW LORIKEET Trichoglossus haematodus (200 – 1,200 m) BLACK-CAPPED LORY Lorius lory (200 – 1,200 m) RED-FLANKED LORIKEET Charmosyna placentis (200 – 700 m) PAPUAN LORIKEET Charmosyna papou (1,700 – 3,700 m) PLUM-FACED LORIKEET Oreopsittacus arfaki (1,700 – 3,700 m) YELLOW-BILLED LORIKEET Neopsittacus musschenbroekii (1,200 – 3,200 m) ORANGE-BILLED LORIKEET Neopsittacus pullicauda (1,700 – 3,700 m) PAINTED TIGER PARROT Psittacella picta (2,700 – 3,700 m) RED-CHEEKED PARROT Geoffroyus geoffroyi (200 m) BLUE-COLLARED PARROT Geoffroyus simplex (700 m) ECLECTUS PARROT Eclectus roratus (200 – 1,200 m) PAPUAN KING PARROT Alisterus chloropterus (700 – 2,700 m) ORANGE-BREASTED FIG PARROT Cyclopsitta gulielmitertii (200 m) DOUBLE-EYED FIG PARROT Cyclopsitta diophthalma (200 – 1,700 m) EDWARDS'S FIG PARROT Psittaculirostris edwardsii (200 – 1,200 m) BRUSH CUCKOO Cacomantis variolosus (200 – 1,700 m) FAN-TAILED CUCKOO Cacomantis flabelliformis (1,200 - 3,700 m) LITTLE BRONZE CUCKOO Chrysococcyx minutillus (200 m) WHITE-CROWNED KOEL Caliechthrus leucolophus (200 – 1,200 m) DWARF KOEL Microdynamis parva (200 m) COMMON KOEL Eudynamys scolopaceus (200 – 1,200 m) CHANNEL-BILLED CUCKOO Scythrops novaehollandiae (200 m – winter migrant) PHEASANT-COUCAL Centropus phasianinus (200 – 700 m) LARGE-TAILED NIGHTJAR Caprimulgus macrurus (200 m) FELINE OWLET-NIGHTJAR Euaegotheles insignis (2,700 m) MOUNTAIN OWLET-NIGHTJAR Aegotheles albertisi (2,200 m) GLOSSY SWIFTLET Collocalia esculenta (200, 1,500 – 2,700 m) MOUNTAIN SWIFTLET Aerodramus hirundinaceus (3,700 m) DOLLARBIRD Eurystomus orientalis (200 – 700 m) HOOK-BILLED KINGFISHER Melidora macrorrhina (200 – 700 m) COMMON PARADISE KINGFISHER Tanysiptera galatea (200 – 700 m) SHOVEL-BILLED KOOKABURRA Clytoceyx rex (1,700 – 2,200 m) RUFOUS-BELLIED KOOKABURRA Dacelo gaudichaud (200 – 700 m) FOREST K INGFISHER Todiramphus macleayii (1,700 m) YELLOW-BILLED KINGFISHER Syma torotoro (200 m) VARIABLE DWARF KINGFISHER Ceyx Lepidus (200 – 1,200 m) AZURE K INGFISHER Alcedo azurea (200 – 1,200 m)

Chapter II
64
LITTLE KINGFISHER Alcedo pusilla (200 m) RED-BELLIED PITTA Pitta erythrogaster (200 – 700 m) HOODED PITTA Pitta sordida (200 – 700 m) WHITE-EARED CATBIRD Ailuroedus buccoides (200 – 1,700 m) BLACK-EARED CATBID Ailuroedus melanotis (2,200 m) MACGREGOR'S BOWERBIRD Amblyornis macgregoriae (2,200 – 3,200 m) YELLOW-BREASTED BOWERBIRD Chlamydera lauterbachi (2,200 m) WHITE-SHOULDERED FAIRY-WREN Malurus alboscapulatus (1,700 – 2,200 m) ORANGE-CROWNED WREN Clytomyias insignis (2,700 - 3,200 m) TAWNY-BREASTED HONEYEATER Xanthotis flaviventer (700 – 1,200 m) BLACK-THROATED HONEYEATER Lichenostomus subfrenatus (1,700 – 3,700 m) WHITE-MARKED FOREST HONEYEATER Meliphaga montana (700 – 1,200 m) MIMIC HONEYEATER Meliphaga analoga (200 – 1,700 m) PUFF-BACKED HONEYEATER Meliphaga aruensis (200 – 1,200 m) PLAIN HONEYEATER Pycnopygius ixoides (200 – 1,200 m) MEYER'S FRIARBIRD Philemon meyeri (200 – 1,200 m) HELMETED FRIARBIRD Philemon buceroides (200 – 700 m) SMOKY HONEYEATER Melipotes fumigatus (1,200 – 3,700 m) SOOTY HONEYEATER Melidectes fuscus (2,200 – 3,700 m) YELLOW-BROWED HONEYEATER Melidectes rufocrissalis (1,700 m) BELFORD'S HONEYEATER Melidectes belfordi (2,200 – 3,700 m) RUFOUS-BACKED HONEYEATER Ptiloprora guisei (1,700 – 3,200 m) BLACK-BACKED HONEYEATER Ptiloprora perstriata (2,200 – 3,700 m) LONG-BILLED HONEYEATER Melilestes megarhynchus (200 – 2,200 m) RED-COLLARED HONEYEATER Myzomela rosenbergii (1,200 – 3,700 m) OLIVE STRAIGHT-BILL Timeliopsis fulvigula (1,700 m) GREEN-BACKED HONEYEATER Timeliopsis fallax (700 m) LOWLAND MOUSE WARBLER Crateroscelis murina (200 – 1,700 m) MOUNTAIN MOUSE WARBLER Crateroscelis robusta (1,200 – 3,700 m) PALE-BILLED SCRUBWREN Sericornis spilodera (700 – 1,200 m) GREY-GREEN SCRUBWREN Sericornis arfakianus (1,200 – 1,700 m) LARGE SCRUBWREN Sericornis nouhuysi (1,700 – 3,700 m) YELLOW-BELLIED GERYGONE Gerygone chrysogaster (200 – 700 m) GREY GERYGONE Gerygone cinerea (1,700 – 3,200 m) GREEN-BACKED GERYGONE Gerygone chloronota (200 - 1,200 m) FAIRY GERYGONE Gerygone palpebrosa (200, 1,200 m) PAPUAN THORNBILL Acanthiza murina (2,700 – 3,700 m) ISIDORE'S RUFOUS BABBLER Garritornis isidorei (200 m) LORIA'S CNEMOPHILUS Cnemophilus loriae (1,700 – 3,200 m) CRESTED CNEMOPHILUS Cnemophilus macgregorii (2,200 – 3,700 m) YELLOW-BREASTED CNEMOPHILUS Loboparadisea sericea (1,700 m) BLACK BERRYPECKER Melanocharis nigra (200 - 1,200 m) LEMON-BREASTED BERRYPECKER Melanocharis longicauda (1,700 m) FAN-TAILED BERRYPECKER Melanocharis versteri (1,700 – 3,700 m) STREAKED BERRYPECKER Melanocharis striativentris (1,700, 2,700 m) PLUMED LONGBILL Oedistoma iliolophus (700 – 1,700 m) YELLOW-BELLIED LONGBILL Toxorhamphus novaeguineae (200 – 1,200 m) SLATY -CHINNED LONGBILL Toxorhamphus poliopterus (1,200 – 2,200 m) TIT-BERRYPECKER Oreocharis arfaki (2,200 – 3,700 m) CRESTED BERRYPECKER Paramythia montium (2,700 – 3,700 m) SPOTTED JEWEL-BABBLER Ptilorrhoa leucosticta (1,700 – 2,700 m) BLUE JEWEL-BABBLER Ptilorrhoa caerulescens (200 – 1,200 m) CHESTNUT-BACKED JEWEL-BABBLER Ptilorrhoa castanonota (1,200 m) YELLOW-BREASTED BOATBILL Machaerirhynchus flaviventer (200 – 1,200 m) BLACK-BREASTED BOATBILL Machaerirhynchus nigripectus (1,700 – 3,200 m) BLACK BUTCHERBIRD Cracticus quoyi (200 m) HOODED BUTCHERBIRD Cracticus cassicus (200 – 700 m)
Chapter II
65
LOWLAND PELTOPS Peltops blainvillii (200 – 700 m) MOUNTAIN PELTOPS Peltops montanus (1,700 – 2,700 m) GREAT WOODSWALLOW Artamus maximus (2,700 – 3,700 m) BOYER'S CUCKOO-SHRIKE Coracina boyeri (200 – 1,200 m) WHITE-BELLIED CUCKOO-SHRIKE Coracina papuensis (200 – 1,700 m) HOODED CUCKOO-SHRIKE Coracina longicauda (2,700 m) CICADABIRD Coracina tenuirostris (200 – 1,200 m) BLACK-SHOULDERED CUCKOO-SHRIKE Coracina incerta (200 – 700 m) NEW GUINEA CUCKOO-SHRIKE Coracina melas (200 m) BLACK-BELLIED CUCKOO-SHRIKE Coracina montana (1,200 – 2,700 m) BLACK-BROWNED TRILLER Lalage atrovirens (200 m) WATTLED PLOUGHBILL Eulacestoma nigropectus (2,700 m) GOLDENFACE Pachycare flavogriseum (1,200 – 2,200 m) MOTTLED WHISTLER Rhagologus leucostigma (1,700 – 2,700 m) RUFOUS-NAPED WHISTLER Aleadryas rufinucha (1,700 – 3,700 m) RUSTY-BREASTED WHISTLEr Pachycephala hyperythra (200 – 1,700 m) BROWN-BACKED WHISTLER Pachycephala modesta (2,700 – 3,200 m) GREY WHISTLER Pachycephala simplex (700 – 1,200 m) SCLATER'S WHISTLER Pachycephala soror (1,200 – 2,200 m) REGENT WHISTLER Pachycephala schlegelii (1,700 – 3,700 m) BROWN ORIOLE Oriolus szalayi (200 – 700 m) LITTLE SHRIKE-THRUSH Colluricincla megarhyncha (200 – 2,200 m) RUSTY PITOHUI Pitohui ferrugineus (200 m) CRESTED PITOHUI Pitohui cristatus (1,200 m) BLACK PITOHUI Pitohui nigrescens (1,700 – 2,200 m) PYGMY DRONGO Chaetorhynchus papuensis (200 – 1,700 m) SPANGLED DRONGO Dicrurus bracteatus (200 – 700 m) NORTHERN FANTAIL Rhipidura rufiventris (200 – 1,700 m) SOOTY THICKET FANTAIL Rhipidura threnothorax (200 – 1,200 m) WHITE-BELLIED THICKET FANTAIL Rhipidura leucothorax (200 – 1,200 m) BLACK FANTAIL Rhipidura atra (200 – 2,700 m) FRIENDLY FANTAIL Rhipidura albolimbata (1,700 – 3,700 m) DIMORPHIC FANTAIL Rhipidura brachyrhyncha (1,200 – 3,700 m) RUFOUS-BACKED FANTAIL Rhipidura rufidorsa (200 – 700 m) BLACK MONARCH Monarcha axillaris (1,200 – 2,700 m) RUFOUS MONARCH Monarcha rubiensis (200 m) BLACK-WINGED MONARCH Monarcha frater (200 – 1,200 m) SPOT-WINGED MONARCH Monarcha guttula (200 – 1,200 m) HOODED MONARCH Monarcha manadensis (200 m) GOLDEN MONARCH Monarcha chrysomela (200 – 1,200 m) SHINING FLYCATCHER Myiagra alecto (200 – 1,700 m) GREY CROW Corvus tristis (200 – 1,700 m) LESSER MELAMPITTA Melampitta lugubris (2,700 – 3,700 m) BLUE-CAPPED IFRIT Ifrita kowaldi (1,700 – 3,700 m) CRINKLE-COLLARED MANUCODE Manucodia chalybatus (700 – 1,200 m) PRINCESS STEPHANIE'S ASTRAPIA Astrapia stephaniae (2,700 – 3,700 m) SUPERB BIRD-OF-PARADISE Lophorina superba (1,700 m) MAGNIFICENT RIFLEBIRD Ptiloris magnificus (200 – 700 m) MAGNIFICENT BIRD-OF-PARADISE Diphyllodes magnificus (700 – 1,700 m) KING BIRD-OF-PARADISE Cicinnurus regius (200 – 700 m) LESSER BIRD-OF-PARADISE Paradisaea minor (200 – 1,200 m) ASHY ROBIN Poecilodryas albispecularis (1,200 – 1,700 m) BLACK-SIDED ROBIN Poecilodryas hypoleuca (200 – 1,200 m) BLACK-BIBBED ROBIN Poecilodryas albonotata (2,200 – 3,200 m) WHITE-WINGED ROBIN Peneothello sigillata (2,700 – 3,700 m) BLUE-GREY ROBIN Peneothello cyanus (1,700 – 2,700 m) WHITE-RUMPED ROBIN Peneothello bimaculata (700 – 1,700 m)
Chapter II
66
WHITE-FACED ROBIN Tregellasia leucops (200 – 1,700 m) WHITE-EYED ROBIN Pachycephalopsis poliosoma (1,200 – 1,700 m) MONTANE FLYCATCHER Microeca papuana (1,700 – 3,200 m) TORRENT FLYCATCHER Monachella muelleriana (200 m) YELLOW-LEGGED FLYCATCHER Microeca griseoceps (1,200 m) OLIVE-YELLOW FLYCATCHER Microeca flavovirescens (200 – 1,200 m) GARNET ROBIN Eugerygone rubra (1,700 – 3,700 m) LESSER GROUND ROBIN Amalocichla incerta (1,700 m) PACIFIC SWALLOW Hirundo tahitica (200 – 2,200 m) ISLAND LEAF WARBLER Phylloscopus poliocephalus (1,200 – 2,200 m) BLACK-FRONTED WHITE-EYE Zosterops minor (200 – 1,200 m) NEW GUINEA WHITE-EYE Zosterops novaeguineae (1,700 – 2,700 m) SHINING STARLING Aplonis metallica (200 – 700 m) SINGING STARLING Aplonis cantoroides (200 m) YELLOW-FACED Myna Mino dumontii (200 – 700 m) ISLAND THRUSH Turdus poliocephalus (2,700 – 3,700 m) PIED BUSHCHAT Saxicola caprata (2,200 m) RED-CAPPED FLOWERPECKER Dicaeum geelvinkianum (200 – 2,200 m) BLACK SUNBIRD Leptocoma sericea (200 – 1,200 m) OLIVE-BACKED SUNBIRD Cinnyris jugularis (200 – 1,700 m) STREAK-HEADED MANNIKIN Lonchura tristissima (200 m) BLUE-FACED PARROTFINCH Erythrura trichroa (1,700 – 3,700 m) HOODED MANNIKIN Lonchura spectabilis (2,200 m) ALPINE PIPIT Anthus gutturalis (3,200 – 3,700 m) MOUNTAIN FIRETAIL Oreostruthus fuliginosus (3,700 m) DISCUSSION
Mountains of Central Range are considered to be among the more ornithologicaly
explored regions (unlike outlying mountain ranges and some parts of lowlands
(Rheindt 2012). Despite several months spend along altitudinal gradient of Mt.
Wilhelm in years 2010 – 2011, our further survey in the area in 2012 resulted into
addition of 11 species. Altogether, our work added at least seven new species to the
avifauna of the region on the east slopes of Mt. Wilhelm. (at least Daphoenositta
miranda, Campochaera sloetii, Ptiloprora meekiana, Lichenostomus obscurus,
Cormobates placens, Charmosina rubronata, Ardae sumatrana, and possibly also
Zonerodius heliosylus, Accipiter meyerianus and Trugon terrestris). Many of those
species were previously observed only in other parts of Central Range, or lowlands in
Sepik basin (Beehler et al. 1986; Coates and Peckover 2001). Despite our effort, we
did not record some specie we regularly find in other regions along Ramu river and
Madang lowlands. Those were Northern Cassowary Cassuarius unappendiculatus,
Victoria Crowned Pigeon Goura victoria. We also reported populations of two
migratory species (Apus pacificus, Merops ornatus) to be resident in the area all year
round. More importantly, we observed numerous (minimum of 29 species which
represent 11 % of bird species) shifts and extensions of altitudinal ranges. This
discovery is especially surprising, taking into account the altitudinal distance of 500 m
between study sites, resulting in significant underestimation of range limits at the

Chapter II
67
altitudes in between, and by fact that we did not consider shifts up to 100 m altitudinal
to be significant.
Shifts in geographic ranges are common in temperate regions, where species
may respond to a climate warming by moving to higher latitudes or elevations. The
few studies that refer to elevation range extensions for tropical birds (Pounds et al.
1999; Peh 2007) rely on indirect evidence, derived from community changes in census
plots (Pounds et al. 1999) or changes in elevation limits inferred from bird lists (Peh
2007). Baseline information on the abundance of species along elevation gradients is
however essential to determine whether species shift in elevation and, if so, by how
much (Shoo et al. 2006). It is worth to mention that we observed mostly (29) upward
shifts or extensions of ranges, while only two species were reported lower than
expected (downward shift of Charmosyna wilhelminae, and range extension of
Cacomantis castaneiventris) based on the previously published information. We are
aware that previously reported ranges may include mistakes, may not be exact or may
be specific to a particular geographic region. It is however unlikely that the historical
information would systematically underestimate only upper altitudinal limits. In
concordance with previous studies (Forero-Medina et al. 2011), we also found more
altitudinal shifts in frugivorous birds (16 species) than in insectivores (7 species).
Other caveats may be that many frugivorous species are good altitudinal
migrants and could seasonally follow the resources – flowering or fruiting trees
(Loiselle and Blake 1990). On the other hand, the observed shifts seem to be repeated
throughout three independent surveys during years, and we repeatedly observed some
species at higher than expected altitudes. Although the results should be considered
with caution, they do indicate a consistent pattern of upward direction of the range
shifts.
Acknowledgements
I wish to thank to numerous field assistants from Kausi, Numba, Bundi, Bruno
Sawmill, Sinopass and Kegesugl for help in the field and hospitality. I am most in debt
to Bonny Koane and Samuel Jeppy, whose observation skills allowed me to see the
birds I would hardly find for myself. The project was financially supported by the
Czech Science Foundation Grants 206/09/0115 and 206/08/H044, Czech Ministry of
Education ME09082, Grant Agency of University of South Bohemia 04-136/2010/P,
US National Science Foundation DEB-0841885, and was a part of Center of
Excellence for Global Study of Biodiversity and Function of Forest Ecosystems, reg. n.
CZ.1.07/2.3.00/20.0064 co-financed by the European Social Fund and the Czech
Republic.
Chapter II
68
References:
Hall, R. 2002. Cenozoic geological and plate tectonic evolution of SE Asia and the SW Pacific: computer-based reconstructions, model and animations. Journal of Asian Earth Sciences 20:353-431.
Diamond, J. 1985. New distributional records and taxa from the outlying mountain ranges of New Guinea. Emu 85:65-91.
Beehler, B. M., D. M. Prawiradilaga, Y. de Fretes, N. Kemp, and N. Sodhi. 2007. A new species of smoky honeyeater (Meliphagidae: Melipotes) from western New Guinea. The Auk 124:1,000-1009.
Beehler, B. M., and D. M. Prawiradilaga. 2010 New taxa and new records of birds from the north coastal ranges of New Guinea. Bulletin of British Ornithologist's Club 130:277–285.
Rheindt, F. E. 2012. New avian recorde from little-explored Fakfak Mountains on the Onion Peninsula (West Papua). Bulletin of British Ornithologist's Club 132:102 - 115.
Beehler, B. M., T. K. Pratt, and D. A. Zimmerman. 1986. Birds of New Guinea. Princeton University Press, .
Hoyo, d. J., J. Elliott, J. Sargatal, and D. A. Christie [eds.]. 1992-2011. Handbook of the Birds of the World (vol. 1-16). Lynx Editions, Barcelona, Spain.
Freeman, B. G., A. Class, J. Mandeville, S. Tomassi, and B. M. Beehler. 2013. Ornithological survey of the mountains of the Huon Peninsula, Papua New Guinea. Bulletin of British Ornithologist's Club 133.
Coates, B. J., and W. S. Peckover. 2001. Birds of New Guinea and the Bismarck Archipelago: A photographic guide. Dove Publications Pty. Ltd.,, Alderley, Queensland, Australia
Peckover, W. S., and L. W. C. Filewood. 1976. Birds of New Guinea and Tropical Australia. National Library of Australia, Sydney.
Mayr, E. 1941. List of New Guinea Birds: a systematic and faunal list of the birds of New Guinea and adjacent islands. American Museum of Natural History New York.
Marks, J. S., R. J. Cannings, and H. Mikkola [eds.]. 1999. Family Strigidae (typical owls), del Hoyo, J., Elliott, A., Sargatal, J. Handbook of the birds of the world, . Lynx Edicions, Barcelona
Xeno-canto 2013. xeno-canto: Sharing bird sounds from around the world. Dumbacher, J. P., K. Deiner, L. Thompson, and R. C. Fleischer. 2008. Phylogeny of
the avian genus Pitohui and the evolution of toxicity in birds. Molecular Phylogenetics and Evolution 49:774-781.
Pounds, J. A., M. P. Fogden, and J. H. Campbell. 1999. Biological response to climate change on a tropical mountain. Nature 398:611-615.
Peh, K. S. 2007. Potential effects of climate change on elevational distributions of tropical birds in Southeast Asia. The Condor 109:437-441.
Shoo, L. P., S. E. Williams, and J. HERO. 2006. Detecting climate change induced range shifts: Where and how should we be looking? Austral Ecology 31:22-29.
Forero-Medina, G., J. Terborgh, S. J. Socolar, and S. L. Pimm. 2011. Elevational ranges of birds on a tropical montane gradient lag behind warming temperatures. PLoS ONE 6:e28535.

Chapter II
69
Loiselle, B. A., and J. G. Blake. 1990. Diets of understory fruit-eating birds in Costa Rica: seasonality and resource abundance. Studies in avian biology 13.

Chapter II
70

71
Chapter III Diet of land birds along an altitudinal gradient in Papua New Guinea
Katerina Tvardikova, Bonny Koane, Samuel Jeppy, Jana Sykorova, Vojtech
Novotny
(manuscript in review)

Chapter III
72
Chapter III
73
Diet of land birds along altitudinal gradient in Papua New Guinea
Katerina Tvardikova1,2,‡, Bonny Koane3, Samuel Jeppy3, Jana Sykorova1, Vojtech
Novotny1,2
1University of South Bohemia, Faculty of Science, Branisovska 31, 370 05 Ceske
Budejovice, Czech Republic 2Biology Centre AS CR, Institute of Entomology, Branisovska 31, 370 05 Ceske
Budejovice, Czech Republic 3The New Guinea Binatang Research Center, PO Box 604 Madang, Papua New
Guinea
‡Corresponding author: Katerina Tvardikova, Faculty of Sciences, University of South
Bohemia, and Biology Center, Czech Academy of Science, Institute of Entomology,
Branisovska 31, 370 05 Ceske Budejovice, Czech Republic, E-mail:
Abstract
We studied feeding specialization of birds in Papua New Guinea along a complete
rainforest altitudinal gradient from 200 to 3700 m a.s.l. We classified bird species to
feeding guilds by cluster analysis based on the composition of food samples
regurgitated from mist-netted birds during a 12-month study. The proportion of
insectivores decreased from 75% of all species, based on data from the literature, to
42% based on our data, as many presumably insectivorous species also fed partly on
fruits or nectar. Diversity of food items taken decreased with altitude, and both the
relative importance of arthropods and their size differed between habitats for individual
bird species. The abundance of all invertebrates and Hymenoptera per food sample
decreased with altitude; that of Hemiptera and Lepidoptera did not change with
altitude, whilst the abundance of Coleoptera and Diptera followed a hump-shaped
distribution with the maximum abundance being found at mid-altitudes. Coleoptera
were the most exploited arthropods, followed by Araneae, Hymenoptera and
Lepidoptera (caterpillars). This reflects both opportunism with respect to food items
and the relative importance of individual arthropod groups for bird diet in this tropical
forest. The mean body weight of the arthropods taken by birds decreased with the
altitude and was positively correlated with mean body weight in bird communities. The
mean body weight of birds also decreased with altitude. However, there was no
Chapter III
74
correlation between the mean weight of arthropod individuals in the diet and the
weight of individual birds within bird species.
Key words: altitude, arthropod, bird diet, feeding guilds, opportunism, regurgitation,
tartar emetic
INTRODUCTION
Diets of land birds are rarely directly examined by avian ecologists, and this is
especially true for entire bird communities (Rosenberg and Cooper 1990a). Existing
information is usually based on samples from a few individuals per species only (Hoyo
et al. 1992-2011), detailed knowledge of bird diets is critical to our understanding of
avian ecology and the importance of birds as predators, herbivores and seed dispersers.
The diet of tropical species, including species in New Guinea, is particularly poorly
known (Collins et al. 1990; Karr and Brawn 1990; Loiselle and Blake 1990). The
feeding preference for most tropical bird species is usually inferred from a few
individual observations, or is totally unknown. Quantitative data on their diet are
nevertheless important for the understanding of food webs in bird communities (Poulin
et al. 1994a).
A large proportion of existing diet data has been obtained destructively by
dissecting stomachs of birds in museum collections (e.g. (Dumbacher et al. 2004),
(Rosenberg and Cooper 1990b)). The analysis of fecal samples (Loiselle and Blake
1990), forced flushing (Moody 1970; Laursen 1978) and forced regurgitation are the
most frequently used non-destructive methods for investigating the diets of passerines.
Forced regurgitation has been performed with water (Ford et al. 1982; Majorr 1990)
and several emetics (Prys-Jones et al. 1974; Radke and Frydendall 1974). Different
methods for obtaining food samples are described and their advantages and limitations
discussed by Rosenberg and Cooper (1990a). Most studies have used antimony
potassium tartar, which has proved to be a successful emetic in many bird families
(Prys-Jones et al. 1974; Robinson and Holmes 1982; Poulin et al. 1994a, b; Poulin et
al. 1994c; Poulin and Lefebvre 1995; Sekercioglu et al. 2002). Poulin (1994c) proved
the efficiency of antimony potassium tartrate (tartar emetic) on a large sample of
tropical and migrant land birds.
Biologists have quantified bird diets in diverse ways. The key parameters
include diet breadth (Yoshikawa and Isagi 2012), overlap (Sekercioglu et al. 2002;
Auer and Martin 2012), and spatial (Robinson and Holmes 1982; Sekercioglu et al.
2002) and temporal (Burger et al. 2012) fluctuation. Observed diet has also been
related to food availability (Raley and Anderson 1990). Several studies have identified
Chapter III
75
body size of prey as an important factor of prey choice by birds (Janes 1994;
Woodward et al. 2005; Brose et al. 2006; Philpott et al. 2009; Brose et al. 2012). In
particular, body size of birds is positively correlated with body size of their prey
(Bédard 1969; Cohen et al. 1993), including in insectivorous birds (Hespenheide
1971). Consequently the species composition and size distribution of prey may
influence the distribution and survival of birds and therefore affect the structure of
avian guilds in different habitats (Holmes et al. 1979; Janes 1994); but see
(Sekercioglu 2012), (Champlin et al. 2009). The importance of prey choice and prey
size distribution in different habitats by avian species has attracted relatively little
attention.
To redress these gaps, we used emetic tartar to estimate the diet of birds across
different forest habitats on a large geographic scale, including an altitudinal gradient, in
Papua New Guinea. We analyzed four dietary parameters: prey type (used to estimate
the diet similarity of bird species), diversity of prey types (to measure diet breadth),
relative abundance of prey morphospecies within food samples (to assess prey
dispersion), and prey size distribution (to correlate the size of predator and prey across
different habitats). Based on these dietary parameters, we discuss four general
questions: (1) What food is taken by individual species? (2) Are tropical birds diet
opportunists or specialists? (3) Are there trends in opportunism and specialization
along altitudinal gradient? (4) How does bird diet differ along a complete altitudinal
gradient?
METHODS
The study was carried out at 10 study sites in Papua New Guinea. Eight study sites
were regularly spaced, from 200 to 3700 m a.s.l. with 500 m altitudinal increments,
along an altitudinal gradient at Mt. Wilhelm (-5. 44, 145.20; -5. 47, 145. 03). The other
areas were located in the Saruwaged Mts. (Kotet: 1700m a.s.l., -5.87, 146.37) and in
Madang district (Wanang 3: 159 m a.s.l., -5.22, 145.08). Data from Wanang were
combined with site 200m a.s.l. at altitudinal gradient for some of the analyzes focused
on altitudinal patterns. Similarly, data from Kotet were combined with the Mt.
Wilhelm 1700 m a.s.l. data.
We mist-netted birds (under license CZ1062) at 10 sites throughout the years
2010 and 2011 using 200 meters (2.5 x 18 or 12 m, 16 mm mesh) of nets per site. At
each study site we had mist-nets open for three days (from 05:30 to 17:30 Standard
time, mist-nets visited in 20-min intervals) during wet season, and three days in dry
season. Only the Kotet site was surveyed in two three-day periods, which were
separated by only 20 days due to poor accessibility. At all sites, birds were captured,
Chapter III
76
weighed, measured, identified to species and sex (where possible), banded with a
colorful ring and forced to regurgitate. Three people performed these procedures (KT,
BK, SJ). All birds were released within 10 minutes.
Food samples were obtained by administering tartar emetic following method
by Poulin et al. (Poulin et al. 1994b; Poulin et al. 1994c; Poulin and Lefebvre 1995).
Immediately after capture, birds were given 0.8 cm3 of 1.5% antimony potassium tartar
per 100g of body mass. We lowered the concentration from 1.5% to 1.0% for birds
smaller than 10 g according to recommendations (Poulin and Lefebvre 1995). The
solution was given orally through a flexible plastic tube attached to a 1-cc syringe.
After administration, the birds were placed in a special “regurgit-bowl” covered by
dark cloth. The bowl formed the base and the cloth formed a bag that was accessible
from the upper part (similar way to classical mist-netting bags. This allowed us to
handle birds quickly and safely. The bottom of “regurgit-bowl” was cleaned with water
and detergent, and toilet tissue after each bird. Regurgitated food items were preserved
in absolute ethanol. Weak individuals found in the net and breeding females were not
used for the study. All individuals were sampled only once, and were released
immediately after recapture.
We (KT, JS) examined each food sample (defined as regurgitated food of a
single bird individual) under a dissecting scope. The number of arthropod individuals
per morphospecies was assembled from body parts found in the sample (minimal
number of individuals rule). Most of the arthropods were fragmented, and their
identification was thus based on the least digestible and most characteristic parts (guide
available online http://tvardikova.weebly.com/downloads.html). Individual arthropods
were identified to morphospecies (i.e., morphologically identical prey categories
assumed to represent one species), and classified to orders or families where possible.
Further analyzes were also based on the classification of arthropods into the higher
taxa listed in Table 3. We used published information (Tatner 1983; Ralph et al. 1985),
and the insect collections of our team as reference. We measured the length of each
arthropod individual or body part to the nearest 0.1 mm. We estimated the body length
according to the published order-specific equations using the lengths of different body
parts (Calvemr and Woolledd 1982; Diaz and Diaz 1990; Hodar 1997). We used body
length to estimate body weight for arthropods according to Ganihar (1997). Presence or
absence of nectar, and its relative volume in sample, was evaluated through the
presence of pollen grains using microscope. Similarly, percentage of plant material was
estimated from the length or volume of plant parts.
We classified bird species represented by more than four samples into feeding
guilds by cluster analysis (using abundances of arthropod taxa listed in Table 3,
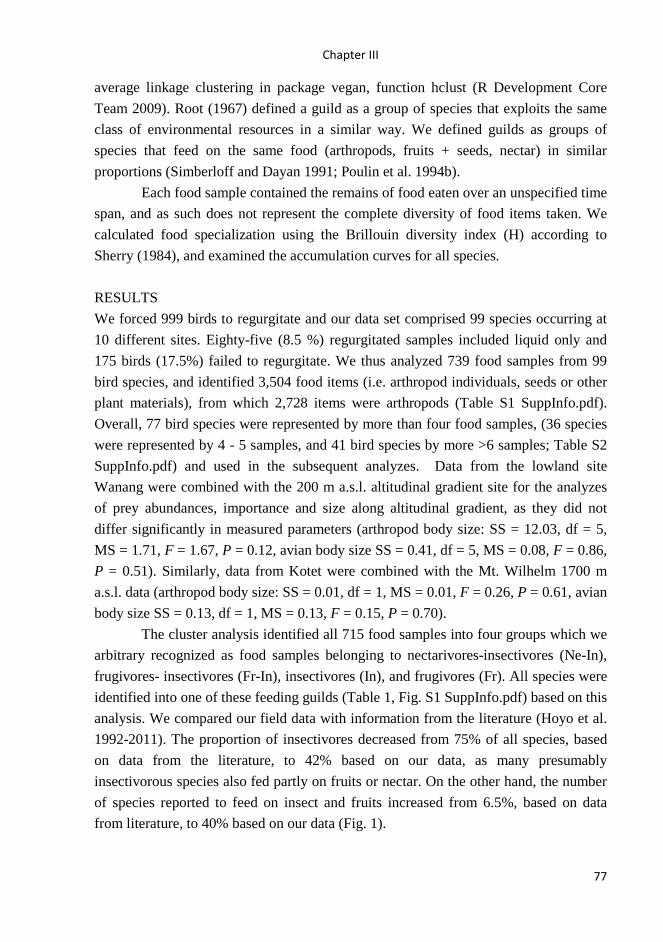
Chapter III
77
average linkage clustering in package vegan, function hclust (R Development Core
Team 2009). Root (1967) defined a guild as a group of species that exploits the same
class of environmental resources in a similar way. We defined guilds as groups of
species that feed on the same food (arthropods, fruits + seeds, nectar) in similar
proportions (Simberloff and Dayan 1991; Poulin et al. 1994b).
Each food sample contained the remains of food eaten over an unspecified time
span, and as such does not represent the complete diversity of food items taken. We
calculated food specialization using the Brillouin diversity index (H) according to
Sherry (1984), and examined the accumulation curves for all species.
RESULTS
We forced 999 birds to regurgitate and our data set comprised 99 species occurring at
10 different sites. Eighty-five (8.5 %) regurgitated samples included liquid only and
175 birds (17.5%) failed to regurgitate. We thus analyzed 739 food samples from 99
bird species, and identified 3,504 food items (i.e. arthropod individuals, seeds or other
plant materials), from which 2,728 items were arthropods (Table S1 SuppInfo.pdf).
Overall, 77 bird species were represented by more than four food samples, (36 species
were represented by 4 - 5 samples, and 41 bird species by more >6 samples; Table S2
SuppInfo.pdf) and used in the subsequent analyzes. Data from the lowland site
Wanang were combined with the 200 m a.s.l. altitudinal gradient site for the analyzes
of prey abundances, importance and size along altitudinal gradient, as they did not
differ significantly in measured parameters (arthropod body size: SS = 12.03, df = 5,
MS = 1.71, F = 1.67, P = 0.12, avian body size SS = 0.41, df = 5, MS = 0.08, F = 0.86,
P = 0.51). Similarly, data from Kotet were combined with the Mt. Wilhelm 1700 m
a.s.l. data (arthropod body size: SS = 0.01, df = 1, MS = 0.01, F = 0.26, P = 0.61, avian
body size SS = 0.13, df = 1, MS = 0.13, F = 0.15, P = 0.70).
The cluster analysis identified all 715 food samples into four groups which we
arbitrary recognized as food samples belonging to nectarivores-insectivores (Ne-In),
frugivores- insectivores (Fr-In), insectivores (In), and frugivores (Fr). All species were
identified into one of these feeding guilds (Table 1, Fig. S1 SuppInfo.pdf) based on this
analysis. We compared our field data with information from the literature (Hoyo et al.
1992-2011). The proportion of insectivores decreased from 75% of all species, based
on data from the literature, to 42% based on our data, as many presumably
insectivorous species also fed partly on fruits or nectar. On the other hand, the number
of species reported to feed on insect and fruits increased from 6.5%, based on data
from literature, to 40% based on our data (Fig. 1).
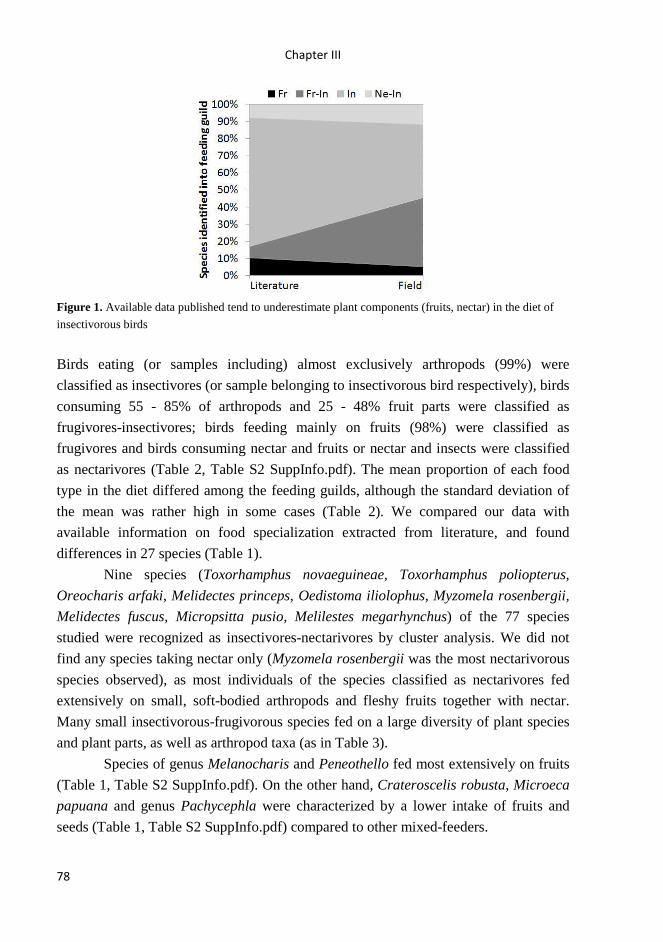
Chapter III
78
Figure 1. Available data published tend to underestimate plant components (fruits, nectar) in the diet of
insectivorous birds
Birds eating (or samples including) almost exclusively arthropods (99%) were
classified as insectivores (or sample belonging to insectivorous bird respectively), birds
consuming 55 - 85% of arthropods and 25 - 48% fruit parts were classified as
frugivores-insectivores; birds feeding mainly on fruits (98%) were classified as
frugivores and birds consuming nectar and fruits or nectar and insects were classified
as nectarivores (Table 2, Table S2 SuppInfo.pdf). The mean proportion of each food
type in the diet differed among the feeding guilds, although the standard deviation of
the mean was rather high in some cases (Table 2). We compared our data with
available information on food specialization extracted from literature, and found
differences in 27 species (Table 1).
Nine species (Toxorhamphus novaeguineae, Toxorhamphus poliopterus,
Oreocharis arfaki, Melidectes princeps, Oedistoma iliolophus, Myzomela rosenbergii,
Melidectes fuscus, Micropsitta pusio, Melilestes megarhynchus) of the 77 species
studied were recognized as insectivores-nectarivores by cluster analysis. We did not
find any species taking nectar only (Myzomela rosenbergii was the most nectarivorous
species observed), as most individuals of the species classified as nectarivores fed
extensively on small, soft-bodied arthropods and fleshy fruits together with nectar.
Many small insectivorous-frugivorous species fed on a large diversity of plant species
and plant parts, as well as arthropod taxa (as in Table 3).
Species of genus Melanocharis and Peneothello fed most extensively on fruits
(Table 1, Table S2 SuppInfo.pdf). On the other hand, Crateroscelis robusta, Microeca
papuana and genus Pachycephla were characterized by a lower intake of fruits and
seeds (Table 1, Table S2 SuppInfo.pdf) compared to other mixed-feeders.

Chapter III
79
Table 1. Classification of bird species into feeding guilds, and number of samples from individual birds in
each species species identified into feeding guilds according to cluster analysis. Bird species represented
by ≥4 food samples (n = 77 bird species) are included, and their feeding specialization is compared to
information extracted from literature (Hoyo et al. 1992-2011). Bird species where our data on food differ
from the information extracted from literature are marked by asterisk. Fr = Frugivores, In = Insectivores,
Fr-In = Frugivores-insectivores, Ne-In = Nectarivores - insectivores. See tables S1 and S2. in
Supplementary Information for details on food items taken.
Species
Food according to literature
Number of samples identified into feeding guild acording to
our data
Species feeding guild Primary Secondary Fr In Fr-In Ne-In
Total
Acanthiza murina In Ne 1 2 1 4 Fr-In Alcedo azurea In Ca 10 10 In Aleadryas rufinucha In 4 4 In Amalocichla incerta* In 4 2 1 7 Fr-In Arses insularis* In 1 4 5 Fr-In Ceyx lepidus In 3 1 4 In Clytomyias insignis In 3 1 4 In Colluricincla megarhyncha In 3 10 3 1 17 In Coracina melas In 3 1 4 In Coracina montana* Fr In 8 2 10 In Crateroscelis murina In 8 3 11 In Crateroscelis robusta* In 3 9 9 1 22 Fr-In Dacelo gaudichaud In Ca 4 4 In Gallicolumba beccarii* Fr 4 4 Fr-In Garritornis isidorei In 10 10 In Gerygone chrysogaster In 3 1 4 In Chalcophaps stephani Fr 5 5 Fr Ifrita kowaldi In 4 4 In Lonchura tristissima Fr 3 1 4 Fr Melanocharis nigra Fr In 7 7 5 1 20 Fr-In Melanocharis striativentris Fr 6 3 9 Fr Melanocharis versteri Fr In 12 3 19 1 35 Fr-In Melidectes belfordi* In 4 4 Fr-In Melidectes fuscus* In 3 8 3 14 Ne-In Melidectes princeps* Ne In 8 5 13 Ne-In Melilestes megarhynchus In Ne 3 1 1 5 Ne-In Meliphaga analoga* In Fr 5 4 8 1 18 Fr-In Melipotes fumigatus* In 2 2 4 8 Fr-In Microeca papuana* In 6 5 11 Fr-In Micropsitta pusio Fr Ne 10 10 Ne-In Monarcha axillaris In 4 2 6 In Monarcha guttula* In 9 5 14 Fr-In Monarcha manadensis In 3 1 4 In Myiagra alecto In Fr 9 1 10 In Myzomela rosenbergii Ne In 1 3 4 Ne-In Oedistoma iliolophus In Ne 2 1 1 4 Ne-In Pachycephala hyperythra* In 3 5 8 Fr-In Pachycephala modesta In 3 1 4 In
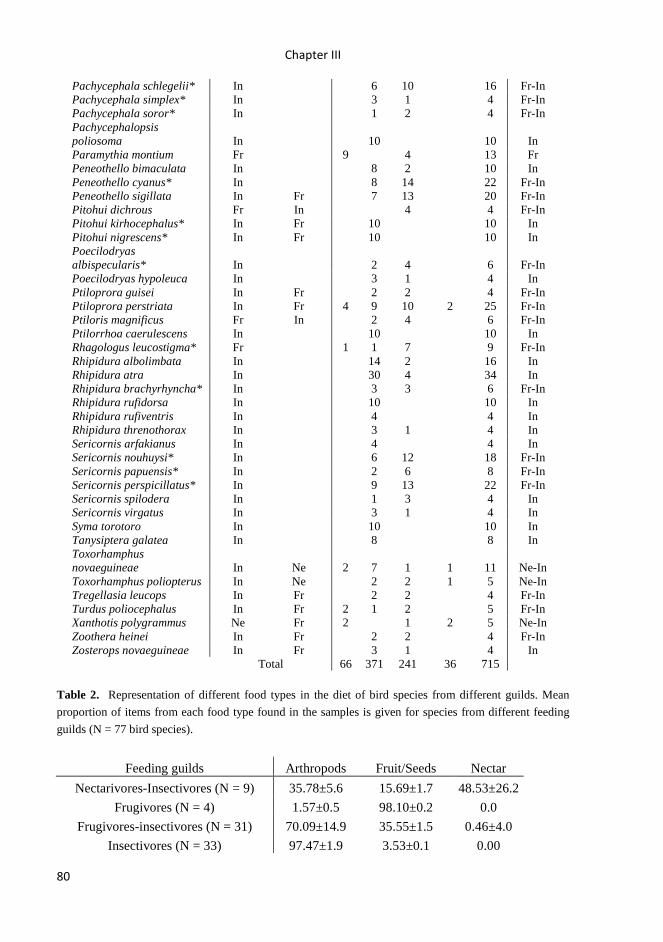
Chapter III
80
Pachycephala schlegelii* In 6 10 16 Fr-In Pachycephala simplex* In 3 1 4 Fr-In Pachycephala soror* In 1 2 4 Fr-In Pachycephalopsis poliosoma In 10 10 In Paramythia montium Fr 9 4 13 Fr Peneothello bimaculata In 8 2 10 In Peneothello cyanus* In 8 14 22 Fr-In Peneothello sigillata In Fr 7 13 20 Fr-In Pitohui dichrous Fr In 4 4 Fr-In Pitohui kirhocephalus* In Fr 10 10 In Pitohui nigrescens* In Fr 10 10 In Poecilodryas albispecularis* In 2 4 6 Fr-In Poecilodryas hypoleuca In 3 1 4 In Ptiloprora guisei In Fr 2 2 4 Fr-In Ptiloprora perstriata In Fr 4 9 10 2 25 Fr-In Ptiloris magnificus Fr In 2 4 6 Fr-In Ptilorrhoa caerulescens In 10 10 In Rhagologus leucostigma* Fr 1 1 7 9 Fr-In Rhipidura albolimbata In 14 2 16 In Rhipidura atra In 30 4 34 In Rhipidura brachyrhyncha* In 3 3 6 Fr-In Rhipidura rufidorsa In 10 10 In Rhipidura rufiventris In 4 4 In Rhipidura threnothorax In 3 1 4 In Sericornis arfakianus In 4 4 In Sericornis nouhuysi* In 6 12 18 Fr-In Sericornis papuensis* In 2 6 8 Fr-In Sericornis perspicillatus* In 9 13 22 Fr-In Sericornis spilodera In 1 3 4 In Sericornis virgatus In 3 1 4 In Syma torotoro In 10 10 In Tanysiptera galatea In 8 8 In Toxorhamphus novaeguineae In Ne 2 7 1 1 11 Ne-In Toxorhamphus poliopterus In Ne 2 2 1 5 Ne-In Tregellasia leucops In Fr 2 2 4 Fr-In Turdus poliocephalus In Fr 2 1 2 5 Fr-In Xanthotis polygrammus Ne Fr 2 1 2 5 Ne-In Zoothera heinei In Fr 2 2 4 Fr-In Zosterops novaeguineae In Fr 3 1 4 In Total 66 371 241 36 715
Table 2. Representation of different food types in the diet of bird species from different guilds. Mean
proportion of items from each food type found in the samples is given for species from different feeding
guilds (N = 77 bird species).
Feeding guilds Arthropods Fruit/Seeds Nectar
Nectarivores-Insectivores (N = 9) 35.78±5.6 15.69±1.7 48.53±26.2
Frugivores (N = 4) 1.57±0.5 98.10±0.2 0.0
Frugivores-insectivores (N = 31) 70.09±14.9 35.55±1.5 0.46±4.0
Insectivores (N = 33) 97.47±1.9 3.53±0.1 0.00
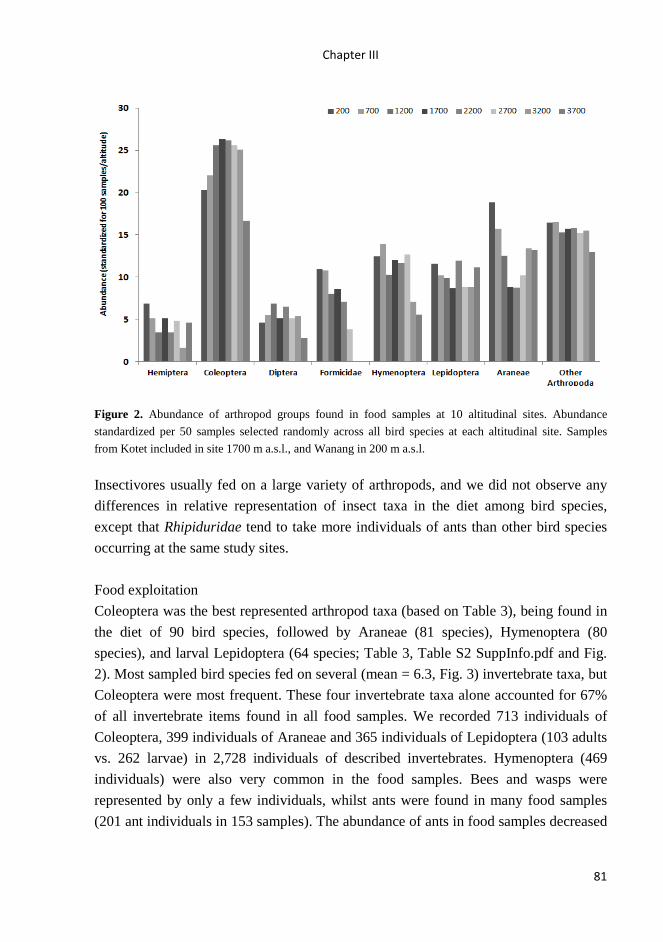
Chapter III
81
Figure 2. Abundance of arthropod groups found in food samples at 10 altitudinal sites. Abundance
standardized per 50 samples selected randomly across all bird species at each altitudinal site. Samples
from Kotet included in site 1700 m a.s.l., and Wanang in 200 m a.s.l.
Insectivores usually fed on a large variety of arthropods, and we did not observe any
differences in relative representation of insect taxa in the diet among bird species,
except that Rhipiduridae tend to take more individuals of ants than other bird species
occurring at the same study sites.
Food exploitation
Coleoptera was the best represented arthropod taxa (based on Table 3), being found in
the diet of 90 bird species, followed by Araneae (81 species), Hymenoptera (80
species), and larval Lepidoptera (64 species; Table 3, Table S2 SuppInfo.pdf and Fig.
2). Most sampled bird species fed on several (mean = 6.3, Fig. 3) invertebrate taxa, but
Coleoptera were most frequent. These four invertebrate taxa alone accounted for 67%
of all invertebrate items found in all food samples. We recorded 713 individuals of
Coleoptera, 399 individuals of Araneae and 365 individuals of Lepidoptera (103 adults
vs. 262 larvae) in 2,728 individuals of described invertebrates. Hymenoptera (469
individuals) were also very common in the food samples. Bees and wasps were
represented by only a few individuals, whilst ants were found in many food samples
(201 ant individuals in 153 samples). The abundance of ants in food samples decreased

Chapter III
82
with altitude, and ants were not present in food samples from 3200 and 3700 m a.s.l.
(Fig. 2). Table 3. The importance of different invertebrate taxa in the birds’ diet quantified as the number of items
(i.e., individual body fragments) and species from various taxa, and the number of samples (each from one
individual bird) where they were present. First (and second) choice within arthropod taxa was identified as
taxa presented by maximum (and second maximum) number of individuals, but only if this value is higher
than 2*Mean number of individuals per invertebrate taxon.
Invertebrates Number of bird species
Nu
mb
er of
ind
ividuals
Nu
mb
er of sam
ples
with
taxa presen
t
Ind
ividuls/S
amp
le
taking
taxon
taking
taxon as
first cho
ice
taking
taxon as
secon
d ch
oice
Araneae 399 291 1.37 81 8 2 Chilopoda 17 9 1.89 11 Coleoptera 713 430 1.66 90 25 10 Dermaptera 21 17 1.24 17 Diplopoda 9 5 1.80 6 Diptera 137 100 1.37 53 Gastropoda 15 9 1.67 10 Neuroptera 24 26 0.92 15 Odonata 16 15 1.07 7 Orthoptera 40 35 1.14 22 1 Ricinulei 11 11 1.00 11 Hemiptera 141 174 0.81 51 2 2 Lepidoptera adult 103 126 0.82 41 1 Lepidoptera larvae 262 202 1.30 64 3 3 Hymenoptera: ants 201 153 1.31 62 1 1 Hymenoptera: others 249 170 1.46 63 2 1 Hymenoptera: bees 6 5 1.20 5 Hymenoptera: wasps 13 10 1.30 10 Insect egg 189 87 2.17 47 3 1 Insect larvae 24 22 1.09 13 Insect pupae 138 92 1.50 24 1 2 Total 2728

Chapter III
83
Figure 3. Average number of arthropod taxa taken by bird species (A) and proportional abundance of
arthropod taxa in food samples of birds represented by more than four samples (B).
Most of the birds also fed on vegetable material. Only five of the 77 species
analyzed did not have any plant material in food samples, including three kingfishers
(Alcedo azurea, Dacelo gaudichaud, Syma torotoro), and Coracina montana and
Rhipidura rufidorsa. The proportion (% of sample volume) of plant material in food
samples increased with altitude (y = 3.0*x + 15.19, R² = 0.06, F1,556 = 16.67, P < 0.001;
Fig. 1) and the proportion of arthropods in food samples decrease accordingly (y = -
1.62*x + 35.64, R² = 0.08, F1,556 = 4.49, P = 0.03; Fig. 4). The abundance of some taxa
(Hemiptera and Lepidoptera) in food samples was constant across all altitudes, other
decreased nearly linearly with altitude (Formicidae, Hymenoptera), whilst for other
taxa there did not appear to be a simple linear relationship between abundance and
altitude. The Coleoptera and Diptera are a case in point, with the abundance appearing
to have hump-shaped distribution along altitudinal gradient (Fig. 2).
Variation, heterogeneity and patchiness
We explained most of the variability in food items in samples by bird species,
furthermore our cluster analysis grouped most of the samples from one bird species
together. Cluster analysis, run for samples of the four most common species
(Colluricincla megarhyncha, Crateroscelis robusta, Melanocharis versteri and
Sericornis perspicillatus, Fig. S2 SuppInfo.pdf) collected at different sites showed that
species were largely clustered together, with some exceptions. In three species we
could analyze samples from at least three different altitudes. In two of these species,
the diet from adjacent altitudes was more similar than from attitudinally more distant
sites (Fig.S2 SuppInfo.pdf).

Chapter III
84
Figure 4. Relative importance of arthropods and plant material in individual food samples along
altitudinal gradient. Samples from Kotet included in site 1700 m a.s.l., and from Wanang in 200 m a.s.l.
Figure 5. Brillouin diversity index (H) of invertebrate species in the diet of insectivorous bird species
along Mt. Wilhelm altitudinal gradient and in Kotet (dotted line at 1700 m a.s.l.) and Wanang (dotted line
at 200 m a.s.l.).
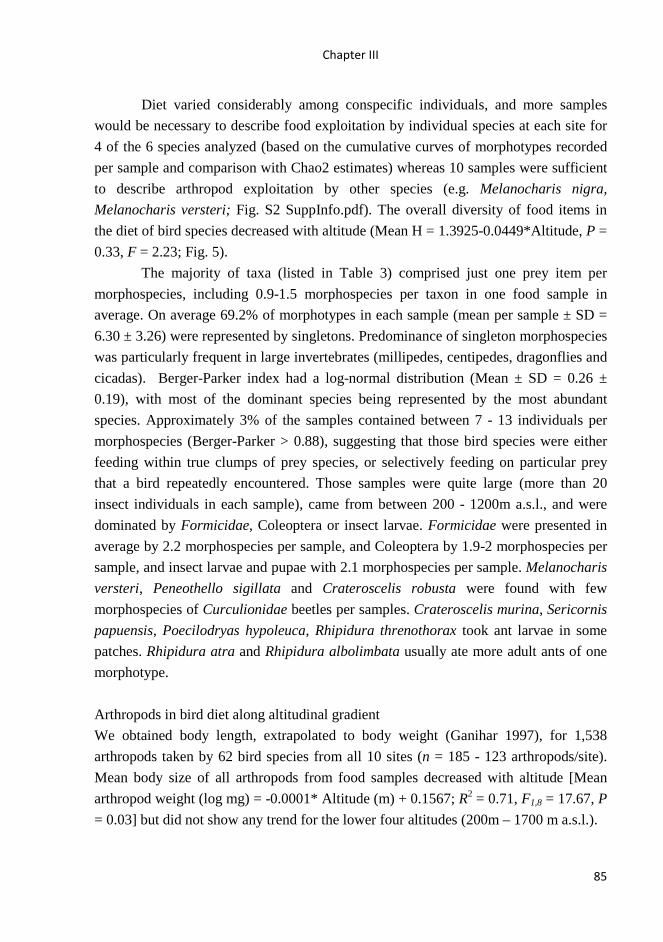
Chapter III
85
Diet varied considerably among conspecific individuals, and more samples
would be necessary to describe food exploitation by individual species at each site for
4 of the 6 species analyzed (based on the cumulative curves of morphotypes recorded
per sample and comparison with Chao2 estimates) whereas 10 samples were sufficient
to describe arthropod exploitation by other species (e.g. Melanocharis nigra,
Melanocharis versteri; Fig. S2 SuppInfo.pdf). The overall diversity of food items in
the diet of bird species decreased with altitude (Mean H = 1.3925-0.0449*Altitude, P =
0.33, F = 2.23; Fig. 5).
The majority of taxa (listed in Table 3) comprised just one prey item per
morphospecies, including 0.9-1.5 morphospecies per taxon in one food sample in
average. On average 69.2% of morphotypes in each sample (mean per sample ± SD =
6.30 ± 3.26) were represented by singletons. Predominance of singleton morphospecies
was particularly frequent in large invertebrates (millipedes, centipedes, dragonflies and
cicadas). Berger-Parker index had a log-normal distribution (Mean ± SD = 0.26 ±
0.19), with most of the dominant species being represented by the most abundant
species. Approximately 3% of the samples contained between 7 - 13 individuals per
morphospecies (Berger-Parker > 0.88), suggesting that those bird species were either
feeding within true clumps of prey species, or selectively feeding on particular prey
that a bird repeatedly encountered. Those samples were quite large (more than 20
insect individuals in each sample), came from between 200 - 1200m a.s.l., and were
dominated by Formicidae, Coleoptera or insect larvae. Formicidae were presented in
average by 2.2 morphospecies per sample, and Coleoptera by 1.9-2 morphospecies per
sample, and insect larvae and pupae with 2.1 morphospecies per sample. Melanocharis
versteri, Peneothello sigillata and Crateroscelis robusta were found with few
morphospecies of Curculionidae beetles per samples. Crateroscelis murina, Sericornis
papuensis, Poecilodryas hypoleuca, Rhipidura threnothorax took ant larvae in some
patches. Rhipidura atra and Rhipidura albolimbata usually ate more adult ants of one
morphotype.
Arthropods in bird diet along altitudinal gradient
We obtained body length, extrapolated to body weight (Ganihar 1997), for 1,538
arthropods taken by 62 bird species from all 10 sites (n = 185 - 123 arthropods/site).
Mean body size of all arthropods from food samples decreased with altitude [Mean
arthropod weight (log mg) = -0.0001* Altitude (m) + 0.1567; R2 = 0.71, F1,8 = 17.67, P
= 0.03] but did not show any trend for the lower four altitudes (200m – 1700 m a.s.l.).
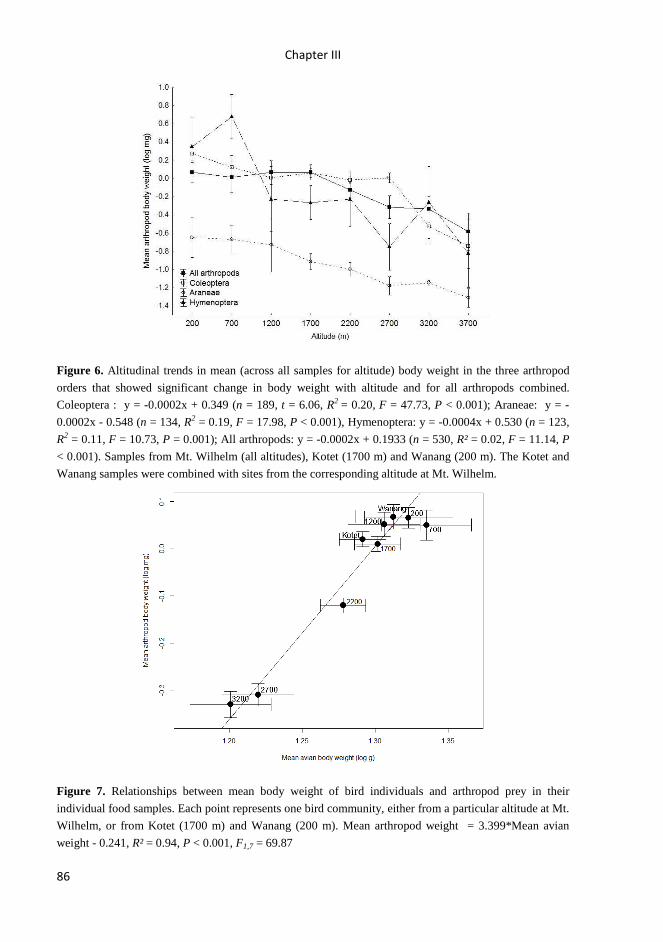
Chapter III
86
Figure 6. Altitudinal trends in mean (across all samples for altitude) body weight in the three arthropod
orders that showed significant change in body weight with altitude and for all arthropods combined.
Coleoptera : y = -0.0002x + 0.349 (n = 189, t = 6.06, R2 = 0.20, F = 47.73, P < 0.001); Araneae: y = -
0.0002x - 0.548 (n = 134, R2 = 0.19, F = 17.98, P < 0.001), Hymenoptera: y = -0.0004x + 0.530 (n = 123,
R2 = 0.11, F = 10.73, P = 0.001); All arthropods: y = -0.0002x + 0.1933 (n = 530, R² = 0.02, F = 11.14, P
< 0.001). Samples from Mt. Wilhelm (all altitudes), Kotet (1700 m) and Wanang (200 m). The Kotet and
Wanang samples were combined with sites from the corresponding altitude at Mt. Wilhelm.
Figure 7. Relationships between mean body weight of bird individuals and arthropod prey in their
individual food samples. Each point represents one bird community, either from a particular altitude at Mt.
Wilhelm, or from Kotet (1700 m) and Wanang (200 m). Mean arthropod weight = 3.399*Mean avian
weight - 0.241, R² = 0.94, P < 0.001, F1,7 = 69.87
Chapter III
87
The trend was caused mainly by body weights of Araneae, Coleoptera and
Hymenoptera (without Formicidae) whose body weights decreased significantly with
increasing altitude when we tested individual arthropods orders separately (Fig. 6).
Other orders (Neuroptera, Hemiptera and Diptera) did not show any trend, did not
occur in samples at higher altitudes (ants), or occurred only scarcely in samples (n <
100 individuals, or n < 5 individual/site). The mean body weight of insectivorous bird species declined with increasing altitude
from 21.03 g at 200 m a.s.l. to 15.88 g at 3200m a.s.l., and 21.1 g at 3700 m a.s.l. [Mean
bird weight (log g) = -0.0004*Altitude (m) + 1.342, R² = 0.86, F1,8 = 43.21, P <
0.001]. Finally, the mean weight of insectivorous birds and their insect prey were
correlated between altitudes 200 – 3200 m asl. (n = 9, R2 = 0.91, F1,7 = 67.83, P <
0.001, Fig. 7). Inclusion of the data from 3700m asl. made the correlation non-
significant (n = 10, R2 = 0.18, F1,7 = 1.13, P = 0.33). The body weight of all mist-netted
birds also correlated with the size of food items taken (n = 1538, R2 = 0.04, F1,1536 =
44.27, P < 0.001). There was no significant correlation (p > 0.05) between food items
and size of individual bird species (n = 23 species with individuals mist-netted at 3 and
more altitudes), however 10 species (e.g. both males and females Melanocharis nigra,
Alcedo azurea) had bigger individuals at altitudes separated by 1000m altitudinal
DISCUSSION
This study is the first to have tested regurgitation methods in birds from Papua New
Guinea and found it successful, reasonably harmless, and easy to use in field
conditions. However, the dosage and concentration of administered emetic are very
important (Lederer and Crane 1978). We based our doses on the method and
recommendations published elsewhere (Tomback 1975; Poulin et al. 1994c; Poulin and
Lefebvre 1995). Our chosen method appeared to provide good results with minimum
damage to the birds. Bird mortality was only 0.5% (i.e., two individual deaths during
handling). Birds smaller than 5 g do not occur in Papua New Guinea; our results are
therefore not relevant to the use of emetic tartar in such small birds. We did not
observe any significant differences in mark-recapture rates between sites when emetics
were used and those at which they were not.
The number of food samples needed to represent the diet of a species at one
locality depends mostly on the number of items per sample, the diversity of prey types
taken by species, and the heterogeneity of food samples from different individuals. All
these parameters varied among the species studied, and more (usually more than 10)
food samples were needed to record the diversity of prey types that some species eat.
Based on this knowledge and the material available, we compromised and used only

Chapter III
88
species represented by more than four food samples in our analyses. Incompleteness of
the information on food item variability has to be taken into account when we interpret
the results. The data presented here represent food taken by mist-netted birds only, i.e.
those occurring and foraging mostly in understory and mid-story of tropical forests, but
not those concentrated in the forest canopy. However, our data from 99 bird species
represents a large proportion of entire bird communities, including 257 bird species
across all study sites (KT, unpublished data).
Our results suggest that the regurgitation method is useful for determining the
diet of terrestrial birds with a variety of feeding specializations. Information on bird
diets is largely missing from literature, as only a few quantitative data sets reporting
the relative importance of arthropods, nectar and fruits in the diets of tropical birds
exist (Collins et al. 1990). Most insectivorous species occurring at our study sites fed
on a variety of arthropod taxa, suggesting that dietary specialization of insectivores
was not prevalent in tropical habitats. Many tropical bird species were assumed to be
food specialists (Poulin et al. 1994a); however other studies from various tropical
habitats have reported birds to be opportunistic (Kaspari and Joern 1993). A variety of
models based on short-term diet optimization have predicted that organisms should
broaden their diets during periods of food scarcity and narrow them, using the most
rewarding food, when food is abundant (review in Pyke et al. 1977). Chronically low
arthropod abundance within the rainforest interior (Basset et al. 1992; Novotny et al.
2006) may therefore require broad diets for some birds to persist there. The current
study supports the hypothesis that birds are mainly opportunists: consuming prey in
proportion to its relative abundance in habitat.
The fact that beetles were the most abundant food item followed by spiders,
Hymenoptera and caterpillars reflects diet opportunism and the situation in tropical
forest, where these three groups were most abundant (Basset et al. 2012). In contrast,
other studies have found Hymenoptera to be nearly as abundant as Coleoptera
(Lamarre et al. 2012). Coleoptera was the most abundant taxon caught by flight
intercept traps in Lamington National Park in Australia followed by Diptera,
Hymenoptera and Araneae (Boulter et al. 2011). Coleoptera was also the most
abundant arthropod taxon (followed by spiders and caterpillars) found on mid-story
and under-story growth in our lowland site (Tvardikova - unpublished data obtained by
complete quantitative collection of arthropods from 20 3 - 4 m high saplings, which
were cut down in Wanang site), where most of the sampled bird species presumably
hunt. Slightly different relative abundances were found in the canopy of ten fogged
lowland Bornean trees where Diptera was the most abundant taxon followed by
Formicidae, Coleoptera, Hemiptera, Hymenoptera and Arachnida (Stork and

Chapter III
89
Blackburn 1993). Our results on abundances of arthropod taxa in food samples are
similar to findings from Venezuela (Poulin et al. 1994a) and Australia (Razeng and
Watson 2012). The predominance of beetles, spiders, and caterpillars also suggests
that most bird species foraged by gleaning, and that is what we observed during our
surveys. Therefore, the lower abundances of flying insects (Diptera, Hymenoptera)
found in food samples do not have to reflect their abundance in rain forest.
The most well studied bird species differed in the variety and proportion of
insect morphospecies in their diet, despite the opportunism observed for bird species in
general. This allowed us to assign species into feeding guilds by a cluster analysis
based on the proportion of the different food types found in their regurgitated samples.
Our results for the most abundant species sampled from 10 sites show that variability
in food items taken can be explained by bird species. Relatively low variability within
bird species food samples is likely determined by micro-habitat (i.e. substrate, forest
strata), where birds forage and bird species specific foraging techniques. However
some spatial differences do occur. Birds of the same species from different localities
tend to fall into the same cluster, which shows that individual species tend to take same
proportion of different food items at different sites. This may be due to conservation of
the foraging techniques used by birds, which seems to be a function of the
morphological and perceptual traits of each species. Robinson and Holmes (1982)
demonstrated a relationship between the search tactics used by birds foraging for
insects among forest foliage and the kinds of prey captured. Yet these behaviours are
not totally fixed or stereotyped. The foraging tactics of some species are known to vary
between habitats, between sexes and even from one year to another within the same
habitat (Morse 1971; Robinson and Holmes 1982; Cale 1994; Morse 2008). A different
approach (Ricklefs 2012) to feeding specialization shows that passerine birds are
clustered toward the centre of their morphological space, and most species seem to
have a generalized morphology suited to a variety of foraging substrates and
movements, as well as prey items.
Indeed, we found food exploitation to be quite variable within many species
with, most of the arthropod morphospecies found being represented by a single food
item in each sample. This result leads us to the conclusion that most birds sampled in
this study forage opportunistically, rather than concentrating on a particular prey
species. This pattern is particularly striking considering that arthropod species are often
aggregated in tropical forests (Basset 2001). The morphospecies accounting for the
highest aggregation in food samples were morphospecies of Hymenoptera, especially
wasps, ants, and ant eggs. Not a single bird species seems to be specialized on
particular taxa, except Rhipiduridae that fed on ants and Curculionidae more often
Chapter III
90
than other bird species. Some curculonid beetles found in our samples in many
morphotypes (mainly Zygopinae, Cryptorrhynchinae) are reported to occur in higher
aggregations in tropical forests (Dyer et al. 2012). We believe that this pattern resulted
from feeding on aggregations of these species in time in our sites, and not from
specialization of birds. The presence of ants in food samples reflects the distribution of
ants along altitudinal gradients, and their steep decrease in abundances with altitude
(Boulter et al. 2011; Yusah et al. 2012). Based on pitfall trapping (Fayle and Moses,
unpubl. data) and tuna baits (Tvardikova and Moses, unpubl.data), ants were highly
abundant at low altitudes but became scarce at 2200 m a.s.l. and reached the upper
limit of their distribution at 2700 m a.s.l. Birds feeding on ants were observed to search
mainly on the ground, and in the understory. This corresponds to the presence of ant
workers (95 %) in food samples, while reproductive stages of ants (5%) were nearly
missing. Our observation corresponds with findings of Sherry (1984), who used
frequencies of aerial vs. non-aerial foraging tactics to determine whether flying
(reproductive) or non-flying (primarily worker) ants were eaten by Neotropical
Flycatchers.
Most of the frugivorous species also included arthropods in their diets, several
typically insectivorous species fed at least occasionally on fruits. We recorded partial
frugivory or extensive intake of fruits for some birds species previously considered to
take insects only (Crateroscelis robusta, Crateroscelis murina, Gerygone
chrysogaster, Ifrita kowaldi, Microeca papuana, Monarcha axillaris, Pachycephala
hyperythra, Pachycephala Schlegelii, Peneothello bimaculata and Peocylodrias
albispecularis). On the other hand, we also recorded insects in a few samples of bird
species considered fully frugivorous (Cnemophylus macgregorii, Melanocharis
striativentris, Paramythia montinum, Rhagologus leucostigma). Overall, the diversity
of food items decreased with altitude, and the proportion of species feeding upon plant
items became larger. We believe that this trend reflects general decrease in the
diversity and abundance of arthropods with increasing altitude (Olson 1994; Guevara
and Aviles 2007; Larsen et al. 2011). Orians (1969) found that certain insectivorous
specialists disappeared with increasing altitude, as the diversity and abundance of some
insect groups decreased, and birds could not specialize on them. Several major groups
including ants and termites disappear altogether above 2,500 m, while others (larval
Lepidoptera, Orthoptera, Diptera, Coleoptera, Hymenoptera) are notable for their rarity
at higher altitudes (Terborgh 1977).
Mean body size of insectivorous species decreased with increasing altitude on
Mt. Wilhelm, and correlated positively with mean body size of arthropods decreasing
towards cooler and higher altitudes. A general decrease in the mean size of species
Chapter III
91
within insect communities with increasing altitude was observed in different arthropod
taxa (Janzen et al. 1976; Guevara and Aviles 2007). The combination of all arthropod
taxa sampled using different collecting techniques show that, on average, insects in the
Ecuadorian lowland rain forest are larger than insects found in adjacent high-altitude
cloud forest habitats (Hodkinson 2005). These results are comparable to three previous
studies (Janzen et al. 1976; Powers and Avilés 2007) that also found a decrease in the
average insect size at higher altitudes.
The body size of individual birds is correlated with the size of the insect taken.
A similar pattern was previously (Janes 1994) suggested for avian guilds dependent
directly or indirectly upon arthropods, but not for other guilds independent of
arthropods. A general relationship between predator size and prey size has been
observed among a variety of insectivorous birds dependent on free living insects
(Hespenheide 1971; Janes 1994). Our data did not confirm the correlation between
body size of bird and prey within individual bird species; however we recorded
significantly heavier bird individuals in higher altitudes. We also observed relatively
large bodied birds taking relatively small insects at the tree line (3700 m a.s.l.). None
of those species is purely insectivorous, and most of them feed on nectar and fruits, and
forage mainly in the forest canopy. Such a guild was generally missing from our mist-
nets at lower altitudes, where nets do not reach to the top of canopy. At the same time,
the large-bodied insects are rare at the tree line site, and small insects seem to be taken
opportunistically together with nectar or fruits. We believe that those two facts
explained the mismatch between bird and prey body sizes at 3700 m a.s.l.
Although an exact assessment of bird diet would be a difficult task, our study
brings the first report on food preferences of birds from Papua-New Guinea using a
non-destructive method. Our data are consistent with the hypothesis that most of the
bird species feed opportunistically on wide range of food items. We show that the
diversity of food items taken by birds decreases towards higher altitudes, and that the
disappearance of some insect taxa as diet items corresponds with their disappearance
from the available food resources. Our findings support the notion that the body-sizes
of insectivores are to some extent determined by the insect size composition of their
environments. To our knowledge, no previous study has detailed the food preference of
variety of bird species along a complete altitudinal gradient.
ACKNOWLEDGMENTS
We are thankful to field assistants from Kausi, Numba, Bundi, Bruno Sawmill,
Sinopass and Kegesugl for help in the field and hospitality. We are thankful to Jimmy
Moses, Tom Fayle, Peter Klimeš, Jan Hrček and Martin Volf who helped with insect

Chapter III
92
identification or provided data from their ant surveys. The project was financially
supported by the Czech Science Foundation Grants 206/09/0115 and 206/08/H044,
Czech Ministry of Education ME09082, Grant Agency of University of South
Bohemia 156/2013/P, US National Science Foundation DEB-0841885, and was also
created as a part of Center of Excellence for Global Study of Biodiversity and Function
of Forest Ecosystems, reg. n. CZ.1.07/2.3.00/20.0064 co-financed by the European
Social Fund and the state budget of the Czech Republic.
SUPPLEMENTARY MATERIAL
Table S1. Number of invertebrate individuals and fruits/seeds, and presence or absence
of nectar found in food samples from all bird species surveyed (N = 99 bird species).
Table S2. Relative representation and diversity of different food types in the diet of
individual bird species. Only species represented by ≥4 food samples are included (N =
77 birds, 715 food samples).
Figure S1. Cluster analysis of species according to their diet based on identification
into higher taxa listed in Table 3.
Figure S2. Cluster diagram of diet composition for four common bird species
(Colluricincla megarhyncha, Crateroscelis robusta, Melanocharis versteri and
Sericornis perspicillatus) sampled at the altitude 200, 700, 1200, 2200, 2700, 3200, and
3700 m asl. of Mt Wilhelm altitudinal gradient and at 1700 m asl. in Kotet (1700K).
Diet identification is based on identification into higher taxa listed in Table 3.
Figure S3. Randomised species accumulation curves for three selected species (with
N ≥ 9 from the same altitude). Sample = regurgitated food from an individual bird.
LITERATURE CITED
Auer, S. K., and T. E. Martin. 2012. Climate change has indirect effects on resource
use and overlap among coexisting bird species with negative consequences for their
reproductive success. Global Change Biology 19:411-419.
Basset, Y. 2001. Invertebrates in the canopy of tropical rain forests: How much do we
really know? Plant Ecology 153:87-107.
Basset, Y., H. P. Aberlenc, and G. Delvare. 1992. Abundance and stratification of
foliage arthropods in a lowland rain forest of Cameroon. Ecological Entomology
17:310-318.
Chapter III
93
Basset, Y., L. Cizek, P. Cuénoud, R. K. Didham, F. Guilhaumon, O. Missa, V.
Novotny, F. Ødegaard, T. Roslin, and J. Schmidl. 2012. Arthropod diversity in a
tropical forest. Science 338:1481-1484.
Bédard, J. 1969. Adaptive radiation in Alcinidae. Ibis 111:189-198.
Boulter, S., C. L. Lambkin, and N. T. Starick. 2011. Assessing the abundance of seven
major arthropod groups along an altitudinal gradient and across seasons in
subtropical rainforest. Austral Ecology 30: 281-297.
Brose, U., J. A. Dunne, J. M. Montoya, O. L. Petchey, F. D. Schneider, and U. Jacob.
2012. Climate change in size-structured ecosystems. Philosophical Transactions of
the Royal Society B: Biological Sciences 367:2903-2912.
Brose, U., T. Jonsson, E. L. Berlow, P. Warren, C. Banasek-Richter, L.-F. Bersier, J. L.
Blanchard, T. Brey, S. R. Carpenter, M.-F. C. Blandenier, L. Cushing, H. A. Dawah,
T. Dell, F. Edwards, S. Harper-Smith, U. Jacob, M. E. Ledger, N. D. Martinez, J.
Memmott, K. Mintenbeck, J. K. Pinnegar, B. C. Rall, T. S. Rayner, D. C. Reuman, L.
Ruess, W. Ulrich, R. J. Williams, G. Woodward, and J. E. Cohen. 2006. Consumer-
Resource Body-Size Relationships in Natural Food Webs. Ecology 87:2411-2417.
Burger, C., E. Belskii, T. Eeva, T. Laaksonen, M. Mägi, R. Mänd, A. Qvarnström, T.
Slagsvold, T. Veen, M. E. Visser, K. L. Wiebe, C. Wiley, J. Wright, and C. Both.
2012. Climate change, breeding date and nestling diet: how temperature differentially
affects seasonal changes in pied flycatcher diet depending on habitat variation.
Journal of Animal Ecology 81:926-936.
Cale, P. 1994. Temporal Changes in the foraging behavior of insectivorous birds in a
sclerophyll forest in Tasmania. Emu 94:116-126.
Calvemr, C., and D. Woolledd. 1982. A technique for assessing the taxa, length, dry
weight and energy content of the arthropod prey of birds. Australian Wildlife
Research 9:293-301.
Champlin, T. B., J. C. Kilgo, and C. E. Moorman. 2009. Food abundance does not
determine bird use of early-successional habitat. Ecology 90:1586-1594.
Cohen, J. E., S. L. Pimm, P. Yodzis, and J. Saldaña. 1993. Body sizes of animal
predators and animal prey in food webs. Journal of Animal Ecology 62:67-78.
Collins, B. G., J. Grey, and S. McNee. 1990. Foraging and nectar use in nectarivorous
bird communities. Studies in avian biology 13:110-121.
Diaz, J. A., and M. Diaz. 1990. Estimas de tamaños y biomasas de artrópodos
aplicables al estudio de la alimentación de vertebrados insectívoros. Doñana Acta
Vertebratologia 17:67-74.
Dicke, M., and M. W. Sabelis. 1987. How plants obtain predatory mites as bodyguards.
Netherlands Journal of Zoology 38:148-163.
Chapter III
94
Dumbacher, J. P., A. Wako, S. R. Derrickson, A. Samuelson, T. F. Spande, and J. W.
Daly. 2004. Melyrid beetles (Choresine): A putative source for the batrachotoxin
alkaloids found in poison-dart frogs and toxic passerine birds. Proceedings of the
National Academy of Sciences of the United States of America 101:15857-15860.
Dyer, L. A., W. P. Carson, and E. G. Leigh Jr. 2012. Insect outbreaks in tropical
forests: Patterns, mechanisms, and consequences. P. 219-245. In Barbosa, P., D. K.
Letourneau, and A. A. Agrawal [EDS.], Insect Outbreaks Revisited, Blackwell
Publishing LtD., Oxford, UK.
Ford, H. A., N. Forde, and S. Harrington. 1982. Non-destructive methods to determine
the diets of birds. Corella 6:6-10.
Ganihar, S. R. 1997. Biomass estimates of terrestrial arthropods based on body length.
Journal of Bioscience 22:219-224.
Guevara, J., and L. Aviles. 2007. Multiple techniques confirm elevational differences
in insect size that may influence spider sociality. Ecology 88:2015-2023.
Hespenheide, H. A. 1971. Food preference and the extent of overlap in some
insectivorous birds, with special reference to the Tyrannidae. Ibis 113:59-72.
Hodar, J. A. 1997. The use of regression equations for estimation of prey length and
biomass in diet studies of insectivore vertebrates. Miscelania Zoologica 20.
Hodkinson, I. D. 2005. Terrestrial insects along elevation gradients: species and
community responses to altitude. Biological Reviews 80:489-513.
Holmes, R. T., R. E. J. Bonney, and S. W. Pacala. 1979. Guid structure of the Hubbard
Brook bird community: a multivariate approach. Ecology 60:512-520.
Hoyo, d. J., J. Elliott, J. Sargatal, and D. A. Christie [EDS.]. 1992-2011. Handbook of
the Birds of the World (vol. 1-16). Lynx Editions, Barcelona, Spain.
Janes, S. W. 1994. Variation in the species composition and mean body size of an
avian foliage-gleaning guild along an elevational gradient: correlation with arthropod
body size. Oecologia 98:369-378.
Janzen, D. H., M. Ataroff, M. Fariñas, S. Reyes, N. Rincon, A. Soler, P. Soriano, and
M. Vera. 1976. Changes in the Arthropod Community along an Elevational Transect
in the Venezuelan Andes. Biotropica 8:193-203.
Karr, J. R., and J. D. Brawn. 1990. Food resources of understory birds in central
Panama: quantification and effects on avian populations. Studies in avian biology
13:58-64.
Kaspari, M., and A. Joern. 1993. Prey choice by three insectivorous grassland birds:
reevaluating opportunism. Oikos 68:414-430.
Chapter III
95
Lamarre, G. P. A., Q. Molto, P. V. A. Fine, and C. Baraloto. 2012. A comparison of
two common flight interception traps to survey tropical arthropods. ZooKeys 216:43-
55.
Larsen, T. H., F. Escobar, and I. Armbrecht. 2011. Insects of the Tropical Andes:
diversity patterns, processes and global change. Climate Change and Biodiversity in
the Tropical Andes. Inter-American Institute of Global Change Research (IAI) and
Scientific Committee on Problems of the Environment (SCOPE), São José dos
Campos and Paris:228-244.
Laursen, K. 1978. Interspecificr elationships between some insectivorous passerine
species, illustrated by their diet during spring migration. Ornis Scandinavica 9:178-
192.
Lederer, R. J., and R. Crane. 1978. The effects of emetics on wild birds. North
American Bird Bander 3:3-5.
Loiselle, B. A., and J. G. Blake. 1990. Diets of understory fruit-eating birds in Costa
Rica: seasonality and resource abundance. Studies in avian biology 13:91-103.
Majorr, E. 1990. Stomach flushing of an insectivorous bird. An assessment of
differential digestibility of prey and the risk to the birds. Australian Wildlife
Research 17:674-657.
Moody, D. T. 1970. A method for obtaining food samples from insectivorous birds.
Auk 87:579.
Morse, D. H. 1971. The insectivorous bird as an adaptive strategy. Annual Review of
Ecology and Systematics:177-200.
Morse, D. H. 2008. Structure and foraging patterns of flocks of tits and associated
species in an English woodland during the winter. Ibis 120:298-312.
Novotny, V., P. Drozd, S. E. Miller, M. Kulfan, M. Janda, Y. Basset, and G. D.
Weiblen. 2006. Why are there so many species of herbivorous insects in tropical
rainforests? Science 313:1115-1118.
Olson, D. M. 1994. The distribution of leaf litter invertebrates along a Neotropical
altitudinal gradient. Journal of Tropical Ecology 10:129-150.
Orians, G. H. 1969. The number of bird species in some tropical forests. Ecology
50:783-801.
Philpott, S. M., O. Soong, J. H. Lowenstein, A. L. Pulido, D. T. Lopez, D. F. B. Flynn,
and F. DeClerck. 2009. Functional richness and ecosystem services: Bird predation
on arthropods in tropical agroecosystems. Ecological Applications 19:1858-1867.
Poulin, B., and G. t. Lefebvre. 1995. Additional Information on the Use of Tartar
Emetic in Determining the Diet of Tropical Birds. Condor 97:897-902.

Chapter III
96
Poulin, B., G. Lefebvre, and R. McNeil. 1994a. Diets of Land Birds from Northeastern
Venezuela. Condor 96:354-367.
Poulin, B., G. Lefebvre, and R. McNeil. 1994b. Characteristics of feeding guilds and
variation in diets of bird species of three adjacent tropical sites. Biotropica 26:187-
197.
Poulin, B., G. Lefebvre, and R. McNeil. 1994c. Effect and Efficiency of Tartar Emetic
in Determining the Diet of Tropical Land Birds. Condor 96:98-104.
Powers, K. S., and L. Avilés. 2007. The role of prey size and abundance in the
geographical distribution of spider sociality. Journal of Animal Ecology 76:995-
1003.
Prys-Jones, R. P., L. Schiffererly, and D. W. MacDonald. 1974. The use of an emetic
in obtaining food samples from passerines. Ibis 116:90-94.
Pyke, G. H., H. R. Pulliam, and E. L. Charnov. 1977. Optimal foraging: a selective
review of theory and tests. Quarterly Review of Biology 137-154.
R Development Core Team. 2009. R 2.10.1: A programming environment for data
analysis and graphics, R Development Core Team.
Radke, W., and M. J. Frydendall. 1974. A survey of emetics for use in stomach
contents recovery in the House Sparrow. American Midl Naturalist 92:164-172.
Raley, C. M., and S. H. Anderson. 1990. Availability and use of arthropod food
resources by Wilson's Warblers and Lincoln's Sparrows in Southeastern Wyoming.
Condor 92:141-150.
Ralph, C., S. Nagata, and J. Ralph. 1985. Analysis of droppings to describe diets of
small birds. Journal of Field Ornithology 56:165-174
Razeng, E., and D. M. Watson. 2012. What do declining woodland birds eat? A
synthesis of dietary records. Emu 112:149-156.
Ricklefs, R. E. 2012. Species richness and morphological diversity of passerine birds.
Proceedings of the National Academy of Sciences 109:14482-14487.
Robinson, S. K., and R. T. Holmes. 1982. Foraging behavior of forest birds: The
relationships among search tactics, diet, and habitat structure. Ecology 63:1918-1931.
Root, R. B. 1967. The niche exploitation pattern of the blue-gray gnatcatcher.
Ecological Monographs 37:317-350.
Rosenberg, K. V., and R. J. Cooper. 1990a. Approaches to avian diet analysis. Studies
in avian biology 13:80-90.
Rosenberg, K. V., and R. J. Cooper. 1990b. Approaches to avian diet analysis. Cooper
Ornithological Society, California.
Sekercioglu, C. 2012. Bird functional diversity and ecosystem services in tropical
forests, agroforests and agricultural areas. Journal of Ornithology 153:153-161.
Chapter III
97
Sekercioglu, C. H., P. R. Ehrlich, G. C. Daily, D. Aygen, D. Goehring, and R. F. Sandi.
2002. Disappearance of insectivorous birds from tropical forest fragments.
Proceedings of the National Academy of Sciences of the United States of America
99:263-267.
Sherry, T. W. 1984. Comparative dietary ecology of sympatric, insectivorous
neotropical Flycatchers (Tyrannidae). Ecological Monographs 54:313-338.
Simberloff, D., and T. Dayan. 1991. The guild concept and the structure of ecological
communities. Ennual Reviews of Ecological Systems 22:115 - 143.
Stork, N. E., and T. M. Blackburn. 1993. Abundance, body size and biomass of
arthropods in tropical forest. Oikos 483-489.
Tatner, P. 1983. The diet of urban Magpies Pica pica. Ibis 125:97-107.
Terborgh, J. 1977. Bird Species Diversity on an Andean Elevational Gradient. Ecology
58:1007-1019.
Tomback, D. F. 1975. An emetic technique to investigate food preferences. Auk
92:581-583.
Woodward, G., B. Ebenman, M. Emmerson, J. M. Montoya, J. M. Olesen, A. Valido,
and P. H. Warren. 2005. Body size in ecological networks. Trends in Ecology
Evolution 20:402-409.
Yoshikawa, T., and Y. Isagi. 2012. Dietary breadth of frugivorous birds in relation to
their feeding strategies in the lowland forests of central Honshu, Japan. Oikos
121:1041-1052.
Yusah, K. M., E. C. Turner, B. E. Yahyz, and T. M. Fayle. 2012. An elevational
gradient in litter-dwelling ant communities in Imbak Canyon, Sabah, Malaysia.
Journal of Tropical Biology and Conservation 9:192 - 199.
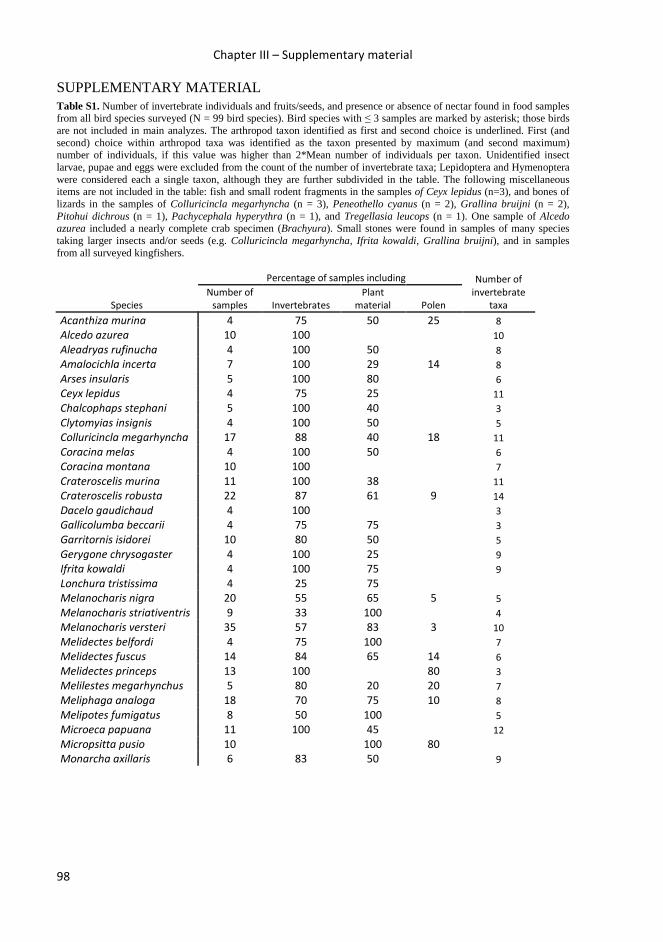
Chapter III – Supplementary material
98
SUPPLEMENTARY MATERIAL Table S1. Number of invertebrate individuals and fruits/seeds, and presence or absence of nectar found in food samples from all bird species surveyed (N = 99 bird species). Bird species with ≤ 3 samples are marked by asterisk; those birds are not included in main analyzes. The arthropod taxon identified as first and second choice is underlined. First (and second) choice within arthropod taxa was identified as the taxon presented by maximum (and second maximum) number of individuals, if this value was higher than 2*Mean number of individuals per taxon. Unidentified insect larvae, pupae and eggs were excluded from the count of the number of invertebrate taxa; Lepidoptera and Hymenoptera were considered each a single taxon, although they are further subdivided in the table. The following miscellaneous items are not included in the table: fish and small rodent fragments in the samples of Ceyx lepidus (n=3), and bones of lizards in the samples of Colluricincla megarhyncha (n = 3), Peneothello cyanus (n = 2), Grallina bruijni (n = 2), Pitohui dichrous (n = 1), Pachycephala hyperythra (n = 1), and Tregellasia leucops (n = 1). One sample of Alcedo azurea included a nearly complete crab specimen (Brachyura). Small stones were found in samples of many species taking larger insects and/or seeds (e.g. Colluricincla megarhyncha, Ifrita kowaldi, Grallina bruijni), and in samples from all surveyed kingfishers.
Species
Percentage of samples including Number of
invertebrate
taxa
Number of
samples Invertebrates
Plant
material Polen
Acanthiza murina 4 75 50 25 8
Alcedo azurea 10 100 10
Aleadryas rufinucha 4 100 50 8
Amalocichla incerta 7 100 29 14 8
Arses insularis 5 100 80 6
Ceyx lepidus 4 75 25 11
Chalcophaps stephani 5 100 40 3
Clytomyias insignis 4 100 50 5
Colluricincla megarhyncha 17 88 40 18 11
Coracina melas 4 100 50 6
Coracina montana 10 100 7
Crateroscelis murina 11 100 38 11
Crateroscelis robusta 22 87 61 9 14
Dacelo gaudichaud 4 100 3
Gallicolumba beccarii 4 75 75 3
Garritornis isidorei 10 80 50 5
Gerygone chrysogaster 4 100 25 9
Ifrita kowaldi 4 100 75 9
Lonchura tristissima 4 25 75
Melanocharis nigra 20 55 65 5 5
Melanocharis striativentris 9 33 100 4
Melanocharis versteri 35 57 83 3 10
Melidectes belfordi 4 75 100 7
Melidectes fuscus 14 84 65 14 6
Melidectes princeps 13 100 80 3
Melilestes megarhynchus 5 80 20 20 7
Meliphaga analoga 18 70 75 10 8
Melipotes fumigatus 8 50 100 5
Microeca papuana 11 100 45 12
Micropsitta pusio 10 100 80
Monarcha axillaris 6 83 50 9
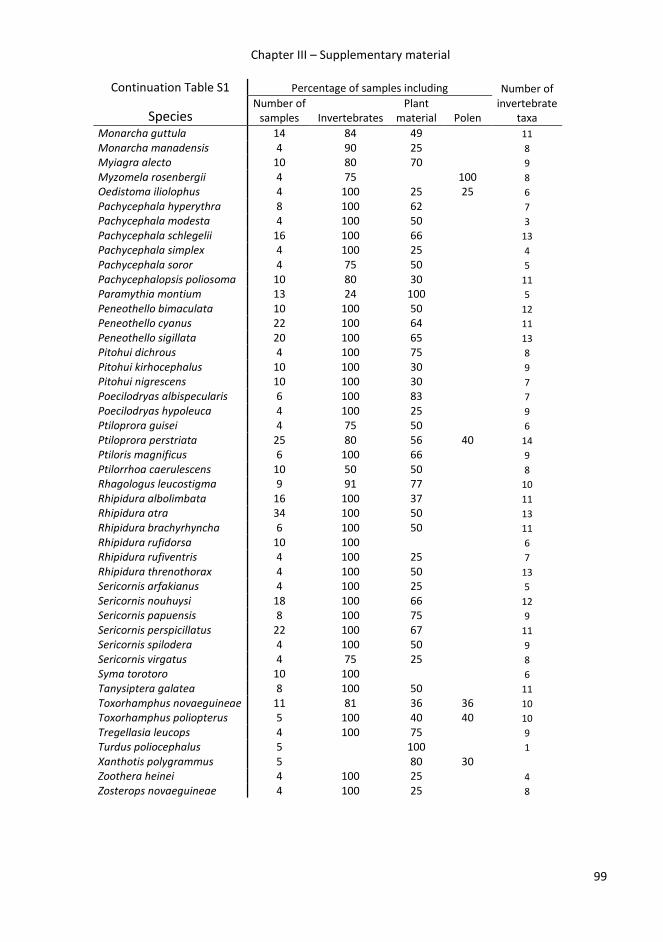
Chapter III – Supplementary material
99
Continuation Table S1 Percentage of samples including Number of
invertebrate
taxa Species Number of
samples Invertebrates
Plant
material Polen
Monarcha guttula 14 84 49 11
Monarcha manadensis 4 90 25 8
Myiagra alecto 10 80 70 9
Myzomela rosenbergii 4 75 100 8
Oedistoma iliolophus 4 100 25 25 6
Pachycephala hyperythra 8 100 62 7
Pachycephala modesta 4 100 50 3
Pachycephala schlegelii 16 100 66 13
Pachycephala simplex 4 100 25 4
Pachycephala soror 4 75 50 5
Pachycephalopsis poliosoma 10 80 30 11
Paramythia montium 13 24 100 5
Peneothello bimaculata 10 100 50 12
Peneothello cyanus 22 100 64 11
Peneothello sigillata 20 100 65 13
Pitohui dichrous 4 100 75 8
Pitohui kirhocephalus 10 100 30 9
Pitohui nigrescens 10 100 30 7
Poecilodryas albispecularis 6 100 83 7
Poecilodryas hypoleuca 4 100 25 9
Ptiloprora guisei 4 75 50 6
Ptiloprora perstriata 25 80 56 40 14
Ptiloris magnificus 6 100 66 9
Ptilorrhoa caerulescens 10 50 50 8
Rhagologus leucostigma 9 91 77 10
Rhipidura albolimbata 16 100 37 11
Rhipidura atra 34 100 50 13
Rhipidura brachyrhyncha 6 100 50 11
Rhipidura rufidorsa 10 100 6
Rhipidura rufiventris 4 100 25 7
Rhipidura threnothorax 4 100 50 13
Sericornis arfakianus 4 100 25 5
Sericornis nouhuysi 18 100 66 12
Sericornis papuensis 8 100 75 9
Sericornis perspicillatus 22 100 67 11
Sericornis spilodera 4 100 50 9
Sericornis virgatus 4 75 25 8
Syma torotoro 10 100 6
Tanysiptera galatea 8 100 50 11
Toxorhamphus novaeguineae 11 81 36 36 10
Toxorhamphus poliopterus 5 100 40 40 10
Tregellasia leucops 4 100 75 9
Turdus poliocephalus 5 100 1
Xanthotis polygrammus 5 80 30
Zoothera heinei 4 100 25 4
Zosterops novaeguineae 4 100 25 8
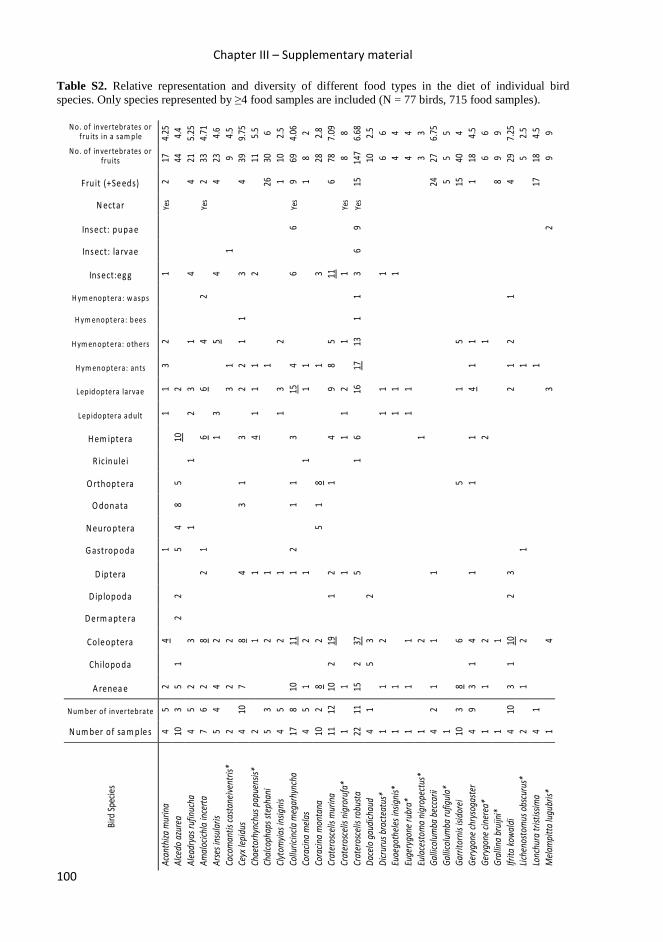
Chapter III – Supplementary material
100
Table S2. Relative representation and diversity of different food types in the diet of individual bird species. Only species represented by ≥4 food samples are included (N = 77 birds, 715 food samples).
Bir
d S
peci
es
N um ber of sa m ple s
N um ber of in vertebrate
A renea e
Chilopo da
Coleoptera
D erm apte ra
D ip lopoda
D iptera
G astrop oda
N euro ptera
O donata
O rthopt era
R icinulei
H em iptera
L epidoptera ad ult
L epid optera larvae
H ym eno ptera: ants
H ym en opt era: oth ers
H ym enopt era: b ees
H ym enopt era: w asp s
Insect:eg g
Insect: la rvae
Insect: pupa e
N ectar
Fruit (+Se eds)
N o. of in vertebrates o r fru its
N o. of in vertebrates o r fru its in a sam p le
Aca
nthi
za m
urin
a 4
5
2
4
1
1 1
3 2
1
Yes
2 17
4.
25
Alc
edo
azur
ea
10
3 5
1
2 2
5 4
8 5
10
2
44
4.4
Ale
adry
as r
ufin
ucha
4
5
2
3
1
1
2 3
1
4
4 21
5.
25
Am
aloc
ichl
a in
cert
a 7
6
2
8
2 1
6
6
4
2
Yes
2 33
4.
71
Ars
es in
sula
ris
5
4 4
2
1 3
5
4
4 23
4.
6
Caco
man
tis
cast
anei
vent
ris*
2
2
2
3 1
1
9 4.
5
Ceyx
lepi
dus
4
10
7
8
4
3 1
3
2 2
1 1
3
4 39
9.
75
Chae
torh
ynch
us p
apue
nsis
* 2
1
1
4 1
1 1
2
11
5.5
Chal
coph
aps
step
hani
5
3
2
1
1
26
30
6
Clyt
omyi
as in
sig
nis
4
5
2
1
1 3
2
1 10
2.
5
Collu
rici
ncla
meg
arhy
ncha
17
8
10
11
1 2
1 1
3
15
4
6
6 Ye
s 9
69
4.06
Cora
cina
mel
as
4
5 1
2
1
1
1 1
1 8
2
Cora
cina
mon
tana
10
2
8
2
5 1
8
1
3
28
2.8
Crat
eros
celis
mur
ina
11
12
10
2 19
1 2
1
4
9 8
5
11
6 78
7.
09
Crat
eros
celis
nig
roru
fa*
1
1
1
1 1
2
1
1
Yes
8 8
Crat
eros
celis
ro
bust
a 22
11
15
2
37
5
1 6
16
17
13
1 1
3 6
9 Ye
s 15
14
7 6.
68
Dac
elo
gaud
icha
ud
4
1
5 3
2
10
2.5
Dic
ruru
s br
acte
atus
* 1
1
2
1 1
1
6 6
Euae
goth
eles
insi
gnis
* 1
1
1 1
1
4 4
Euge
rygo
ne r
ubra
* 1
1
1
1 1
4 4
Eula
cest
om
a ni
grop
ectu
s*
1
2
1
3 3
Gal
licol
umba
bec
cari
i 4
2
1
1
1
24
27
6.75
Gal
licol
umba
ruf
igul
a*
1
5 5
5
Gar
rito
rnis
isid
orei
10
3
8
6
5
1
5
15
40
4
Ger
ygon
e ch
ryso
gast
er
4
9 3
1 4
1
1
1
4 1
1
1 18
4.
5
Ger
ygon
e ci
nere
a*
1
1
2
2
1
6 6
Gra
llina
bru
ijni*
1
1
8 9
9
Ifri
ta k
owal
di
4
10
3 1
10
2 3
2 1
2
1
4 29
7.
25
Lich
enos
tom
us o
bscu
rus*
2
1
2
1
1
5 2.
5
Lonc
hura
tri
stis
sim
a
4
1
1
17
18
4.5
Mel
ampi
tta
lugu
bris
* 1
4
3
2
9 9

Chapter III – Supplementary material
101
Bir
d S
pec
ies
Number of sa mples
Num ber of invertebrate
Arenea e
Chilopoda
Coleoptera
Dermaptera
Diplopoda
Diptera
Gastropoda
Neuroptera
Odonata
Orthoptera
Ricinulei
Hemiptera
Lepidoptera adult
Lepidoptera larvae
Hym enoptera: ants
Hym enoptera: others
Hym enoptera: bees
Hym enoptera: wasps
Insect:egg
Insect: larvae
Insect: pupa e
Nectar
Fruit (+Seeds)
No. of invertebrates or
fruits
No. of invertebrates or
fruits in a sam ple
Mel
an
och
ari
s n
igra
2
0
6
25
1
2
2
2
Yes
58
9
0
4.5
Mel
an
och
ari
s n
igra
* 1
5
6
1
3
3
3
2
6
Yes
26
5
5
55
Mel
an
och
ari
s st
ria
tive
ntr
is
9
3
2
1
1
4
28
3
6
4
Mel
an
och
ari
s ve
rste
ri
35
8
1
4
10
4
2
3
3
4
4
6
6
Yes
56
1
12
3.2
Mel
idec
tes
bel
ford
i 4
6
1
2
1
1
2
2
3
2
14
3
.5
Mel
idec
tes
fusc
us
14
6
1
0
7
1
2
5
3
Yes
10
3
8
2.7
1
Mel
idec
tes
pri
nce
ps
13
2
5
3
1
Yes
29
2
.23
Mel
ilest
es m
ega
rhyn
chu
s 5
7
1
7
4
1
1
2
6
6
Yes
5
42
8
.4
Mel
iph
ag
a a
nal
og
a 1
8
5
14
5
1
1
4
2
1
5
Yes
40
7
3
4.0
6
Mel
iph
ag
a a
ruen
sis*
1
1
1
Yes
2
2
Mel
iph
ag
a m
on
tan
a*
1
1
7
4
1
1
4
1
4
3
6
6
Mel
ipo
tes
fum
iga
tus
8
5
3
2
1
1
1
14
2
2
2.7
5
Mic
roec
a p
ap
ua
na
11
1
0
4
21
3
1
1
1
9
6
9
9
1
8
6
79
7
.18
Mic
rop
sitt
a p
usi
o 1
0
Yes
24
2
4
2.4
Mo
na
rch
a a
xilla
ris
6
6
3
7
2
1
1
3
2
4
6
3
32
5
.33
Mo
na
rch
a f
rate
r*
1
1
1
1
1
4
4
Mo
na
rch
a g
utt
ula
1
4
8
16
20
1
1
8
1
9
4
4
5
5
10
8
4
6
Mo
na
rch
a m
an
ad
ensi
s 4
7
2
2
1
1
2
2
2
3
1
16
4
Myi
ag
ra a
lect
o 1
0
7
1
1
5
2
1
2
1
1
3
3
20
2
Myi
ag
ra c
yan
ole
uca
* 1
2
2
1
2
1
1
9
9
Myz
om
ela
ro
sen
ber
gii
4
7
3
4
1
1
1
4
1
2
Yes
17
4
.25
Oed
isto
ma
ilio
lop
hu
s 4
5
3
3
1
1
2
5
Yes
2
17
4
.25
Pa
chyc
eph
ala
hyp
eryt
hra
8
6
4
11
1
2
2
2
5
7
34
4
.25
Pa
chyc
eph
ala
mo
des
ta
4
10
1
4
1
1
1
3
1
1
1
2
1
2
19
4
.75
Pa
chyc
eph
ala
sch
leg
elii
16
1
2
10
23
1
3
1
1
1
4
7
10
5
6
16
17
1
05
6.5
6
Pa
chyc
eph
ala
sim
ple
x 4
4
1
2
1
1
1
6
1.5
Pa
chyc
eph
ala
so
ror
4
4
1
5
4
1
4
3
18
4
.5
Pa
chyc
eph
alo
psi
s p
olio
som
a
10
0
1
1
3
22
2
7
2.7
Pa
ram
yth
ia m
on
tiu
m
13
4
1
2
1
1
2
19
2
6
2
Pen
eoth
ello
bim
acu
lata
1
0
11
4
1
1
9
1
6
1
4
6
7
1
1
6
6
63
6
.3
Pen
eoth
ello
cya
nu
s 2
2
8
6
31
1
2
1
1
2
5
8
10
4
18
8
9
4.0
5
Pen
eoth
ello
sig
illat
a 2
0
11
1
7
1
35
1
6
1
1
2
1
24
1
3
1
13
1
07
5.3
5
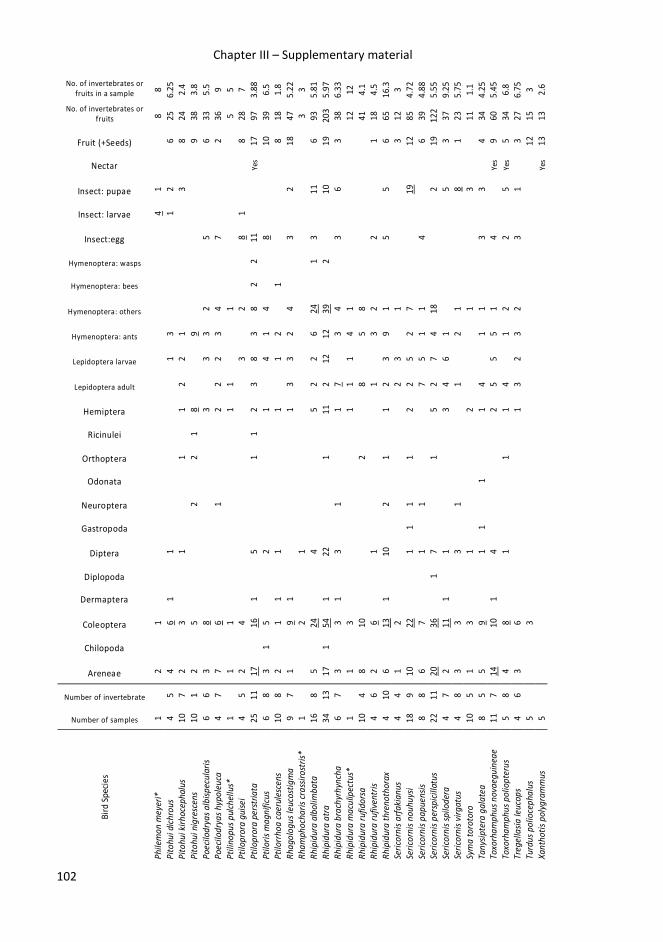
Chapter III – Supplementary material
102
Bir
d S
pe
cie
s
Number of samples
Number of invertebrate
Areneae
Chilopoda
Coleoptera
Dermaptera
Diplopoda
Diptera
Gastropoda
Neuroptera
Odonata
Orthoptera
Ricinulei
Hemiptera
Lepidoptera adult
Lepidoptera larvae
Hymenoptera: ants
Hymenoptera: others
Hymenoptera: bees
Hymenoptera: wasps
Insect:egg
Insect: larvae
Insect: pupae
Nectar
Fruit (+Seeds)
No. of invertebrates or
fruits
No. of invertebrates or
fruits in a sample
Ph
ile
mo
n m
eye
ri*
1
2
1
4
1
8
8
Pit
oh
ui
dic
hro
us
4
5
4
6
1
1
1
3
1
2
6
25
6
.25
Pit
oh
ui
kirh
oce
ph
alu
s 1
0
7
2
3
1
1
1
2
2
1
3
8
24
2
.4
Pit
oh
ui
nig
resc
en
s 1
0
1
2
5
2
2
1
8
9
9
38
3
.8
Po
eci
lod
rya
s a
lbis
pe
cula
ris
6
6
3
8
3
3
3
2
5
6
33
5
.5
Po
eci
lod
rya
s h
ypo
leu
ca
4
7
7
6
1
2
2
2
3
4
7
2
36
9
Pti
lin
op
us
pu
lch
ell
us*
1
1
1
1
1
1
5
5
Pti
lop
rora
gu
ise
i 4
5
2
4
3
2
8
1
8
28
7
Pti
lop
rora
pe
rstr
iata
2
5
11
1
7
16
1
5
1
1
2
3
8
3
8
2
2
11
Ye
s 1
7
97
3
.88
Pti
lori
s m
ag
nif
icu
s 6
8
3
1
5
2
1
4
1
4
8
10
3
9
6.5
Pti
lorr
ho
a c
ae
rule
sce
ns
10
8
2
1
1
1
1
1
2
1
8
18
1
.8
Rh
ag
olo
gu
s le
uco
stig
ma
9
7
1
9
1
1
3
3
2
4
3
2
18
4
7
5.2
2
Rh
am
ph
och
ari
s cr
ass
iro
stri
s*
1
2
1
3
3
Rh
ipid
ura
alb
oli
mb
ata
1
6
8
5
24
4
5
2
2
6
24
1
3
11
6
93
5
.81
Rh
ipid
ura
atr
a
34
1
3
17
1
5
4
1
22
1
11
2
1
2
12
3
9
2
10
19
2
03
5
.97
Rh
ipid
ura
bra
chyr
hyn
cha
6
7
3
3
1
3
1
1
7
3
4
3
6
3
38
6
.33
Rh
ipid
ura
ma
culip
ect
us*
1
1
3
1
1
1
4
1
12
1
2
Rh
ipid
ura
ru
fid
ors
a
10
4
8
10
2
8
5
8
41
4
.1
Rh
ipid
ura
ru
five
ntr
is
4
6
2
6
1
1
3
2
2
1
18
4
.5
Rh
ipid
ura
th
ren
oth
ora
x 4
1
0
6
13
1
10
2
1
1
2
3
9
1
5
5
6
65
1
6.3
Seri
corn
is a
rfa
kia
nu
s 4
4
1
2
2
3
1
3
12
3
Seri
corn
is n
ou
hu
ysi
18
9
1
0
22
1
1
1
1
2
2
5
2
7
19
12
8
5
4.7
2
Seri
corn
is p
ap
ue
nsi
s 8
8
6
7
1
1
7
5
1
1
4
6
39
4
.88
Seri
corn
is p
ers
pic
illa
tus
22
1
1
20
36
1
7
1
5
2
7
4
18
2
19
1
22
5
.55
Seri
corn
is s
pil
od
era
4
7
2
11
1
1
3
4
6
1
5
3
37
9
.25
Seri
corn
is v
irg
atu
s 4
8
3
3
3
1
1
2
1
8
1
23
5
.75
Sym
a t
oro
toro
1
0
5
1
3
1
2
1
3
11
1
.1
Ta
nys
ipte
ra g
ala
tea
8
5
5
9
1
1
1
1
4
1
1
3
3
4
34
4
.25
To
xorh
am
ph
us
no
vae
gu
ine
ae
11
7
1
4
10
1
4
2
5
5
5
1
4
Ye
s 9
6
0
5.4
5
To
xorh
am
ph
us
po
lio
pte
rus
5
8
4
8
1
1
1
4
1
2
2
5
Ye
s 5
3
4
6.8
Tre
ge
lla
sia
le
uco
ps
4
6
3
6
1
3
2
3
2
3
1
3
27
6
.75
Tu
rdu
s p
oli
oce
ph
alu
s 5
3
12
1
5
3
Xa
nth
oti
s p
oly
gra
mm
us
5
Y
es
13
1
3
2.6

Chapter III – Supplementary material
103
Bir
d Sp
ecie
s
N um ber of sam ples
N u m b er o f in vertebrate
A renea e
Chilo po da
Co le op tera
D erm a pte ra
D ip lop oda
D iptera
G a strop od a
N euro ptera
O do na ta
O rtho pt era
R icinu le i
H em iptera
L ep id op tera adu lt
L ep id op tera la rvae
H ym en op tera : an ts
H ym eno ptera : oth ers
H ym eno ptera : b ees
H ym en op tera : w asps
In s ect:eg g
In s ect: la rva e
Ins ect: pu pa e
N ecta r
Fru it (+Se eds)
N o. o f in vertebrates or f ru its
N o. o f in vertebrates or f ru its in a sam ple
Zoot
hera
hei
nei
4 3
1
1
1
1
1 5
1.25
Zost
erop
s no
vaeg
uine
ae
4 5
1
3
1
1 2
1 1
1
1 12
3
Nu
mb
er o
f art
hrop
ods,
frui
ts
397
17
711
21
9 13
7 15
24
16
40
10
14
1 10
1 26
1 20
0 24
8 6
13
189
23
138
766
No
. of
bird
spe
cies
tak
ing
foo
d
80
11
88
17
6 53
10
15
7
22
10
51
39
63
61
62
5 10
47
12
24
74
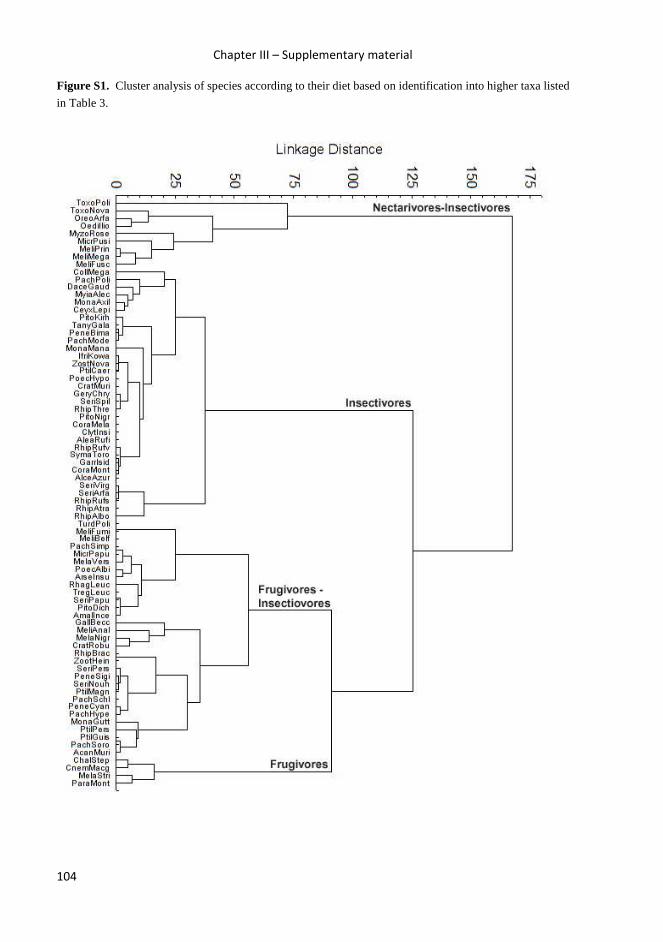
Chapter III – Supplementary material
104
Figure S1. Cluster analysis of species according to their diet based on identification into higher taxa listed
in Table 3.

Chapter III – Supplementary material
105
Figure S2. Cluster diagram of diet composition for four common bird species (Colluricincla megarhyncha, Crateroscelis robusta, Melanocharis versteri and Sericornis perspicillatus) sampled at the altitude 200, 700, 1200, 2200, 2700, 3200, and 3700 m asl. of Mt Wilhelm altitudinal gradient and at 1700 m asl. in Kotet (1700K). Diet identification is based on identification into higher taxa listed in Table 3.
Figure S3. Randomised species accumulation curves for three selected species (with N ≥ 9 from the same altitude). Sample = regurgitated food from an individual bird. CollMega = Colluricincla megarhyncha, 200m; MelaNigr = Melanocharis nigra, 700m; CratRobu = Crateroscelis robusta, 2700m; MelaVers = Melanocharis versteri, 1700m; SeriPers = Sericornis perspicillatus, 2700m; RhipAtra = Rhipidura atra.

106
107
Chapter IV Herbivore damage increases avian and ant predation of caterpillars along
altitudinal forest gradient in Papua New Guinea
Katerina Tvardikova, Vojtech Novotny
(manuscript in review)

Chapter IV – Supplementary material
108

Chapter IV
109
Herbivore damage increases avian and ant predation of caterpillars on trees along a
complete altitudinal forest gradient in Papua New Guinea
Katerina Tvardikova1, Vojtech Novotny
Faculty of Science, University of South Bohemia and Biology Center, Czech Academy
of Sciences, Institute of Entomology, Branisovska 31, 370 05 Ceske Budejovice,
Czech Republic 1Corresponding author: [email protected]
Abstract Signals from plants to the predators that are attacked by herbivores may provide
exciting examples of co-evolution among multiple trophic levels. We examined
whether signals from damaged trees attract predators of insects along a complete
altitudinal rainforest gradient in tropical region. We studied attacks by ants and birds,
as the main predators of herbivorous insect, on artificial caterpillars. The predation rate
decreased with altitude from 10% day-1 at 200 m asl to 1.8% day-1 at 3700 m asl.
Constant predator-prey ratio and decreasing predation rate with altitude supports
prediction of a higher incidence of anti-predatory defences, and aposematic signals in
lowlands. Ants were relatively more important predators in the lowlands, while birds
became dominant predators above 1700 m asl. Caterpillars exposed on trees with
herbivorous damage were attacked significantly more than caterpillars exposed on trees
without damage. The herbivory attracted both ants and birds, but its effect was stronger
for ants.
Key Words: clay caterpillars, cry for help, Lepidoptera, predation, trophic interaction
Plants suffering from an attack by herbivores can actively reduce the number of
herbivorous insects by attracting predators; this phenomenon, known as ‘‘plants crying
for help’’, is due to a tritrophic interaction, in which the damaged plants are more
attractive for natural enemies of herbivores. There is some evidence that plants have
evolved to attract predators, but it is also possible to explain this as predators evolving
to detect herbivores. Such a response has been documented for caterpillars and their
parasitic wasps (De Moraes et al. 1998; Hoballah and Turlings 2001; Turlings et al.
1990). There are also reports on the increased attraction of predatory nematodes
(Rasmann 2005), mites (Takabayashi and Dicke 1996; Vet and Dicke 1992), flies
(Hulcr et al. 2005), true bugs (Mochizuki and Yano 2007) and thrips (Shimoda et al.
1997) to plants suffering from herbivory.

Chapter IV
110
Recently, aviary behavioural experiments showed that birds could use visible
feeding marks on plant leaves, or changes in reflectance as cues to find insect
herbivores (Boege 2006; Heinrich and Collins 1983; Mäntylä et al. 2004; Mäntylä et
al. 2007; Müller et al. 2006). Even if they could not see the herbivores or the defoliated
plant parts, birds could discriminate herbivore-rich trees through olfactory detection of
plant volatile compounds (Mäntylä et al. 2008). This is a relevant results since
insectivorous birds are thought to be even more readily beneficial than insects to plants
since avian predators can respond quickly and can considerably reduce herbivore load
or damage to plants (Mooney et al. 2010; Van Bael et al. 2003; Van Bael et al. 2008).
Ants are recognized as another important predator of herbivorous insect in
many ecosystems, tropical forests particularly (Hölldobler and Wilson 1990; Stamp
and Bowers 1991). Their recruitment by damage-induced volatile compounds is known
to increase rapidly following an attack by herbivorous insects on a host plant (Agrawal
1998; Fiala et al. 1989). These examples involved ants that had obligate relationships
with their host plants and were thus more effective protectors than more common,
opportunistic ants having facultative mutualistic relationships with plants (Heil and
McKey 2003).
Both insectivorous birds and ants are important predators in most terrestrial
communities, and the overall predation of caterpillars is determined to a large extent by
their combined effects (Mooney 2007). Yet the strength of trophic cascades between
plants, herbivores and ant or bird predators with ants or birds as predators can be quite
variable both within (e.g. Mooney and Linhart 2006) and among communities (e.g.
Shurin et al. 2002). The predation pressure experienced by a herbivore is thus a
combined result of the local abundance of predators and their preferences for particular
herbivores and/or their particular host plants (Barlow et al. 2006; Perfecto and
Vandermeer 1996; Richards and Coley 2007; Richards and Phyllis D. C. 2008;
Trollope et al. 2009; Zanette et al. 2000).
The altitudinal diversity and abundance gradient is one of the most striking
biogeographic patterns on Earth (Rahbek 1995), and the role of multitrophic biotic
interactions is a pervasive theme in efforts to understand these altitudinal gradients
(Schemske et al. 2009). Altitudinal trends in predation pressure are poorly known in
the tropics since most of the studies have focused on lowland forest (Novotny and
Basset 2005), and relatively few studies have investigated biotic interactions along the
entire altitudinal gradient (Schemske et al. 2009). Only few studies describe how
predators, prey, and their interactions vary with altitude (Hodkinson 1999; Rodríguez-
Castañeda 2012; Samson et al. 1997; Sivinski et al. 2000; Tvardikova and Novotny
2012).
Chapter IV
111
Previously, we found that the frequency of bird attacks on artificial caterpillars
increased from lowlands (200 m asl) to higher altitude (1700m asl, Tvardikova and
Novotny 2012). To our knowledge, predation rate by ants or birds has not been studied
along an comparable altitudinal gradient in the tropics. However, we expect decreasing
predation rate in higher altitudes, as ants are generally thermophilic, and their diversity
rapidly decreases with increasing distance from the equator and with increasing
altitude (e.g. Dunn et al. 2007; Yusah et al. 2012). On the other hand, homoeothermic
birds do not show such rapid decrease in diversity towards higher altitudes (McCain
2009). This means that they could become key predator at the higher altitudes, where
ants are less abundant; however, we need replicated studies of predation rates across
long or preferably complete altitudinal tropical gradients to test this hypothesis.
Direct studies of predation rates are scarce, particularly in comparison to the
studies of herbivory or parasitism, because predation is momentary event that is
particularly difficult to observe in tropical forests. Therefore, predation has also been
documented by stomach content analysis, using both morphological and molecular
methods of analysis (Symons and Beccaloni 1999). Alternately, predation pressure can
be inferred from attack rates on baits, such as tuna baits for ant predation, or artificial
caterpillars for bird predation (Howe et al. 2009; Posa et al. 2007).
Here we use artificial caterpillars exposed on plants across a complete tropical
altitudinal gradient (200 – 3700 m asl) in Papua New Guinea to investigate predation
pressure by two key predatory groups, ants and birds, and study their response to 1)
simulated herbivory on tropical trees, 2) altitude , and 3) abundance of ants and birds
in the studied forests.
Methods Our study was performed along an altitudinal transect on the slopes of Mt. Wilhelm
(4509 m asl) in the Central Range of the Papua New Guinea. The complete tropical
altitudinal gradient spanned from the lowland floodplains of the Ramu River (200 m
asl, S5 ° 44’ E145 ° 20’) to the timberline (3700 m asl, S5° 47’ E145° 03’). The
transect comprised eight study sites, starting from 200 m asl and evenly spaced at 500
m altitudinal increments. The experiments were conducted in the wet season (April-
June and September-October 2012) to eliminate possible changes in rainfall regime
that can affect biotic interactions (Connahs et al. 2011; Preisser and Strong 2004;
Stenseth et al. 2002).
Prior to the experiment, we selected 30 experimental trees from 2 - 3 locally
common species at each altitude (listed in Table S1) which had at least 30 saplings 2.5
– 4 m high, which did not produce any exudate, did not have any ant nests, and were
Chapter IV
112
growing new leaves, largely without herbivore damage. We used either 10 saplings
from each of three species, or 15 saplings from two species at each altitude. We tried to
find trees with low herbivory damage on old leaves, and avoided trees with damage on
young trees.
We used artificial caterpillars exposed on the study trees to monitor attacks by
natural enemies. Caterpillars were made from natural-looking dark green colour
modelling clay (Koh-I-Noor Hardtmuth brand), which is malleable, oil-based and non-
toxic. We modelled artificial caterpillars by pressing the plasticine through a syringe to
ensure that each caterpillar had an absolutely smooth surface. Artificial caterpillars
were 15 mm long and 3 mm in diameter, matching in body size locally common
crambid and tortricid caterpillars, and also matching the median caterpillar size in the
entire caterpillar community (Novotny and Basset 1999), as well as the size of
caterpillar most commonly taken by birds (Tvardikova, unpubl. data). This method has
been successfully used in previous study (Tvardikova and Novotny 2012).
Each experiment was conducted along a single 2250 m long transect at each
study site. Thirty sampling points, represented by individual trees, were spaced at
approximately 75 m intervals along transect. This spacing ensured that the
experimental trees could be considered independent, as the phenomenon of
transmission of volatile compounds between two plants requires air contact, and was
detectable up to 60 cm in the field conditions (Karban 2007). Ten artificial caterpillars
were placed on each tree, between 2.5 and 4 m above the ground. Artificial caterpillars
were pinned on the distal half of young leaves such that the head of pin was hidden in
modelling clay. Actual caterpillars present on sapling were removed from the trees
prior to experiment so they did not bias the herbivore density. A subset of leaves on
every second experimental tree were cut by scissors so that 5 % of original leaf area
was damaged and removed, simulating herbivory. The damage by scissors was
repeated daily (resulting in 5% of leaf area removed every 24 hours from each tree) to
ensure that potential attraction of leaf damage to predators remained constant for the
duration of experiment. The overall experimental damage to leaves was thus increasing
from 5 to 25 % of leaf area in the course of the experiment. Previous studies showed
that only fresh leaf damage attracted ants (Karban 2007). Leaves for experimental
herbivory were randomly selected from the entire sapling.
We exposed 10 artificial caterpillars per tree, i.e. a total of 300 caterpillars
along the transect at each study site, including 150 placed on trees with artificial
herbivory damage and 150 on undamaged trees. Each caterpillar was inspected at 24-h
intervals for five consecutive days and carefully examined for characteristic bite marks
or signs of parasitism (Tvardikova and Novotny 2012). Caterpillars attacked by two

Chapter IV
113
different predators (N = 23) in same day were treated as two independently attacked
caterpillars. Missing caterpillars were excluded from the analyses as their status could
not be ascertained. All missing caterpillars and caterpillars with marks of attack were
replaced by new ones, pinned to approximately the same locations (Koh and Menge
2006; Posa et al. 2007; Tvardikova and Novotny 2012).
Bird sampling
We surveyed bird communities by two types of census at each altitude – point counts
and mist-netting. Point counts were carried out at 16 points regularly spaced along the
2175 m long transect. We conducted five point-count surveys during the duration of
experiment with caterpillars. Further, we mist-netted birds (under license CZ-1062)
into a 200 m long line of nets for 3 days (using nets 2.5 m high x 12 - 18 m long, mesh
16 mm) from 5:30 am to 5:30 pm daily, with regular checks every 20 minutes. We
classified all recoded species into feeding guilds and strategies, and used the number of
insectivorous species occurring in understory and mid-story at each altitude for the
analysis.
Ant sampling
We surveyed ant communities occurring on experimental trees by observation and
hand collection, as well as using tuna baits. Observation of ant activity was performed
prior to the exposure of caterpillars. The trunk of each tree was examined for 10
minutes, all foraging ant individuals were counted and voucher specimens were taken
for identification. Commercial canned tuna was used in baits, which is a standard
method in the studies of foraging ant communities (Janda and Konečná 2011). One tea
spoon of tuna was placed as bait under a stripe of gauze at breast height at each
experimental tree. Baits were inspected one and three hours following their exposure.
All ants present were counted and voucher specimens for each species were collected
without disturbing the remaining ants. We used combination of two methods, to
eliminate for known fact, that not all ant species are attracted to bait (e.g. Véle et al
2009).
Statistical analyses The data across five experimental days (from 1 to 5) were clumped together, because
daily number of attack was low and did not differ between days (H4 = 7.05, P = 0.13 –
n = 150 - H4 = 9.26, P = 0.06, n = 150). Prior to analyses, we excluded all unidentified
attack attempts (1 %) and lost caterpillars (2 %) from the analysis. The effect of
altitude and herbivory on the incidence of attacks was tested by ANOVA with nested
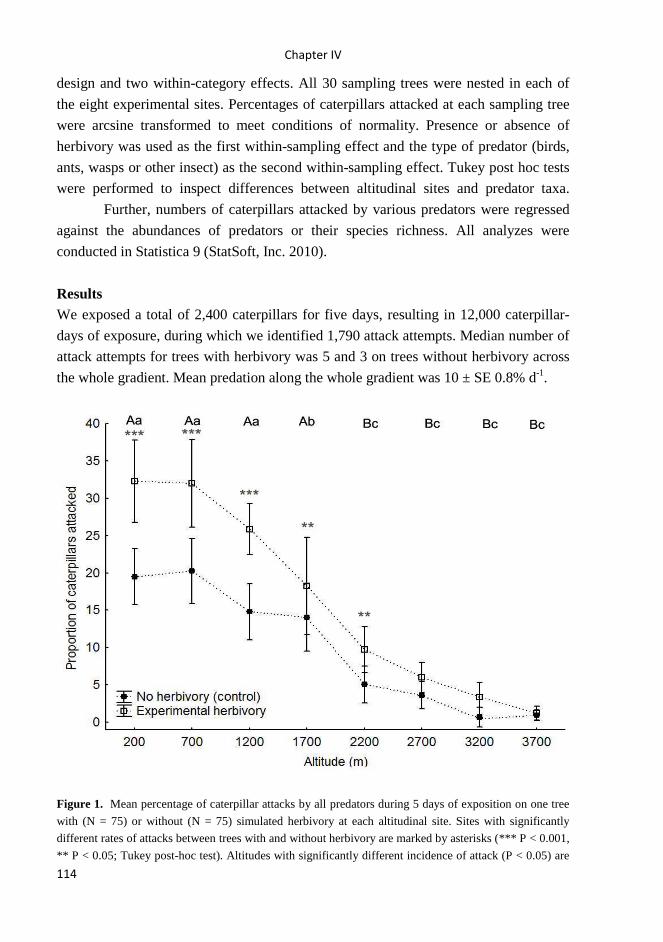
Chapter IV
114
design and two within-category effects. All 30 sampling trees were nested in each of
the eight experimental sites. Percentages of caterpillars attacked at each sampling tree
were arcsine transformed to meet conditions of normality. Presence or absence of
herbivory was used as the first within-sampling effect and the type of predator (birds,
ants, wasps or other insect) as the second within-sampling effect. Tukey post hoc tests
were performed to inspect differences between altitudinal sites and predator taxa.
Further, numbers of caterpillars attacked by various predators were regressed
against the abundances of predators or their species richness. All analyzes were
conducted in Statistica 9 (StatSoft, Inc. 2010).
Results We exposed a total of 2,400 caterpillars for five days, resulting in 12,000 caterpillar-
days of exposure, during which we identified 1,790 attack attempts. Median number of
attack attempts for trees with herbivory was 5 and 3 on trees without herbivory across
the whole gradient. Mean predation along the whole gradient was 10 ± SE 0.8% d-1.
Figure 1. Mean percentage of caterpillar attacks by all predators during 5 days of exposition on one tree
with (N = 75) or without (N = 75) simulated herbivory at each altitudinal site. Sites with significantly
different rates of attacks between trees with and without herbivory are marked by asterisks (*** P < 0.001,
** P < 0.05; Tukey post-hoc test). Altitudes with significantly different incidence of attack (P < 0.05) are
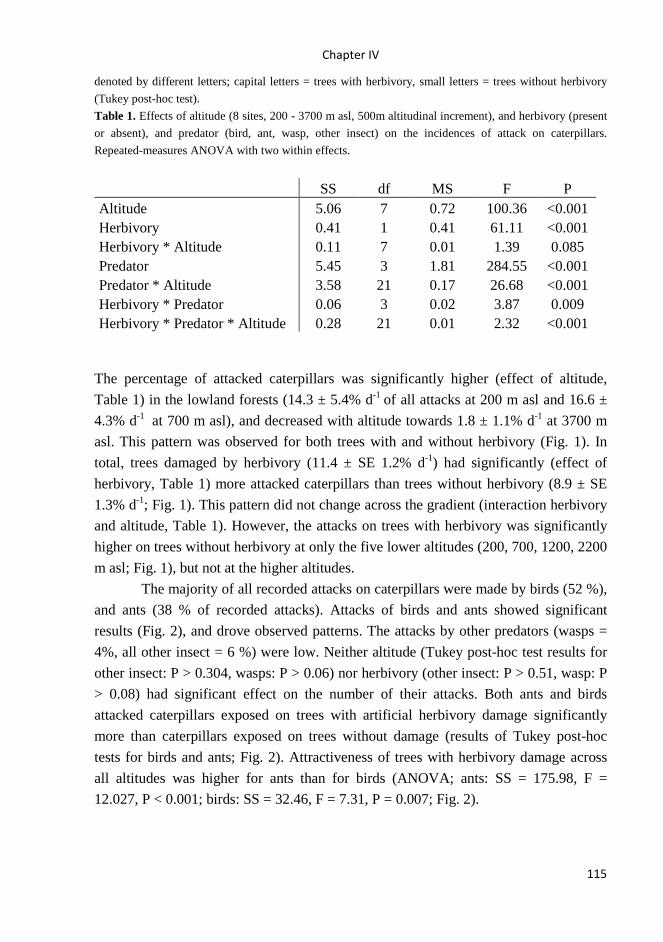
Chapter IV
115
denoted by different letters; capital letters = trees with herbivory, small letters = trees without herbivory
(Tukey post-hoc test).
Table 1. Effects of altitude (8 sites, 200 - 3700 m asl, 500m altitudinal increment), and herbivory (present
or absent), and predator (bird, ant, wasp, other insect) on the incidences of attack on caterpillars.
Repeated-measures ANOVA with two within effects.
SS df MS F P Altitude 5.06 7 0.72 100.36 <0.001 Herbivory 0.41 1 0.41 61.11 <0.001 Herbivory * Altitude 0.11 7 0.01 1.39 0.085 Predator 5.45 3 1.81 284.55 <0.001 Predator * Altitude 3.58 21 0.17 26.68 <0.001 Herbivory * Predator 0.06 3 0.02 3.87 0.009 Herbivory * Predator * Altitude 0.28 21 0.01 2.32 <0.001
The percentage of attacked caterpillars was significantly higher (effect of altitude,
Table 1) in the lowland forests (14.3 ± 5.4% d-1 of all attacks at 200 m asl and 16.6 ±
4.3% d-1 at 700 m asl), and decreased with altitude towards 1.8 ± 1.1% d-1 at 3700 m
asl. This pattern was observed for both trees with and without herbivory (Fig. 1). In
total, trees damaged by herbivory (11.4 ± SE 1.2% d-1) had significantly (effect of
herbivory, Table 1) more attacked caterpillars than trees without herbivory (8.9 ± SE
1.3% d-1; Fig. 1). This pattern did not change across the gradient (interaction herbivory
and altitude, Table 1). However, the attacks on trees with herbivory was significantly
higher on trees without herbivory at only the five lower altitudes (200, 700, 1200, 2200
m asl; Fig. 1), but not at the higher altitudes.
The majority of all recorded attacks on caterpillars were made by birds (52 %),
and ants (38 % of recorded attacks). Attacks of birds and ants showed significant
results (Fig. 2), and drove observed patterns. The attacks by other predators (wasps =
4%, all other insect = 6 %) were low. Neither altitude (Tukey post-hoc test results for
other insect: P > 0.304, wasps: P > 0.06) nor herbivory (other insect: P > 0.51, wasp: P
> 0.08) had significant effect on the number of their attacks. Both ants and birds
attacked caterpillars exposed on trees with artificial herbivory damage significantly
more than caterpillars exposed on trees without damage (results of Tukey post-hoc
tests for birds and ants; Fig. 2). Attractiveness of trees with herbivory damage across
all altitudes was higher for ants than for birds (ANOVA; ants: SS = 175.98, F =
12.027, P < 0.001; birds: SS = 32.46, F = 7.31, P = 0.007; Fig. 2).
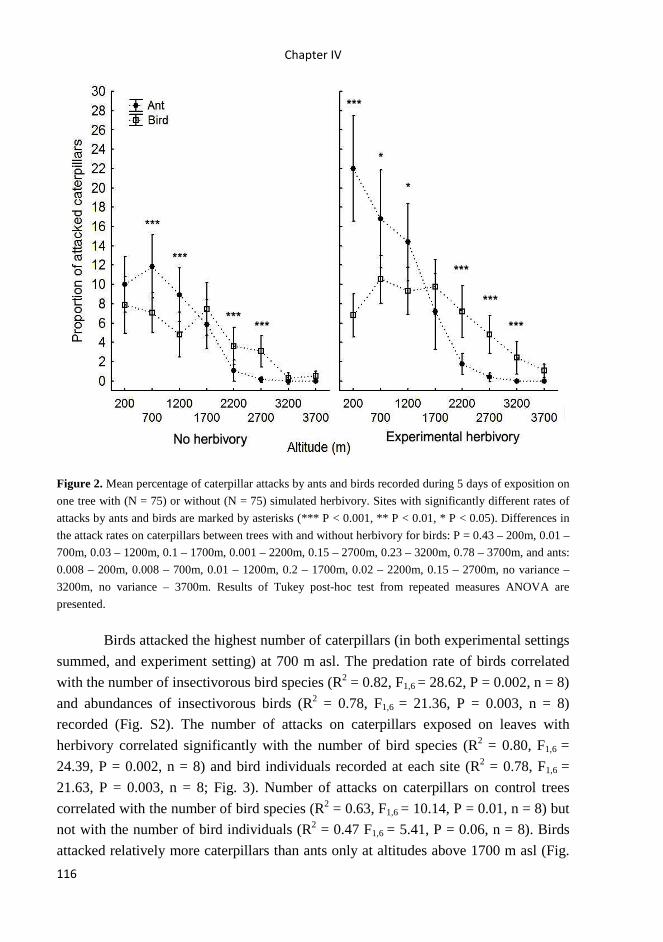
Chapter IV
116
Figure 2. Mean percentage of caterpillar attacks by ants and birds recorded during 5 days of exposition on
one tree with (N = 75) or without (N = 75) simulated herbivory. Sites with significantly different rates of
attacks by ants and birds are marked by asterisks (*** P < 0.001, ** P < 0.01, * P < 0.05). Differences in
the attack rates on caterpillars between trees with and without herbivory for birds: P = 0.43 – 200m, 0.01 –
700m, 0.03 – 1200m, 0.1 – 1700m, 0.001 – 2200m, 0.15 – 2700m, 0.23 – 3200m, 0.78 – 3700m, and ants:
0.008 – 200m, 0.008 – 700m, 0.01 – 1200m, 0.2 – 1700m, 0.02 – 2200m, 0.15 – 2700m, no variance –
3200m, no variance – 3700m. Results of Tukey post-hoc test from repeated measures ANOVA are
presented.
Birds attacked the highest number of caterpillars (in both experimental settings
summed, and experiment setting) at 700 m asl. The predation rate of birds correlated
with the number of insectivorous bird species (R2 = 0.82, F1,6 = 28.62, P = 0.002, n = 8)
and abundances of insectivorous birds (R2 = 0.78, F1,6 = 21.36, P = 0.003, n = 8)
recorded (Fig. S2). The number of attacks on caterpillars exposed on leaves with
herbivory correlated significantly with the number of bird species (R2 = 0.80, F1,6 =
24.39, P = 0.002, n = 8) and bird individuals recorded at each site (R2 = 0.78, F1,6 =
21.63, P = 0.003, n = 8; Fig. 3). Number of attacks on caterpillars on control trees
correlated with the number of bird species (R2 = 0.63, F1,6 = 10.14, P = 0.01, n = 8) but
not with the number of bird individuals (R2 = 0.47 F1,6 = 5.41, P = 0.06, n = 8). Birds
attacked relatively more caterpillars than ants only at altitudes above 1700 m asl (Fig.
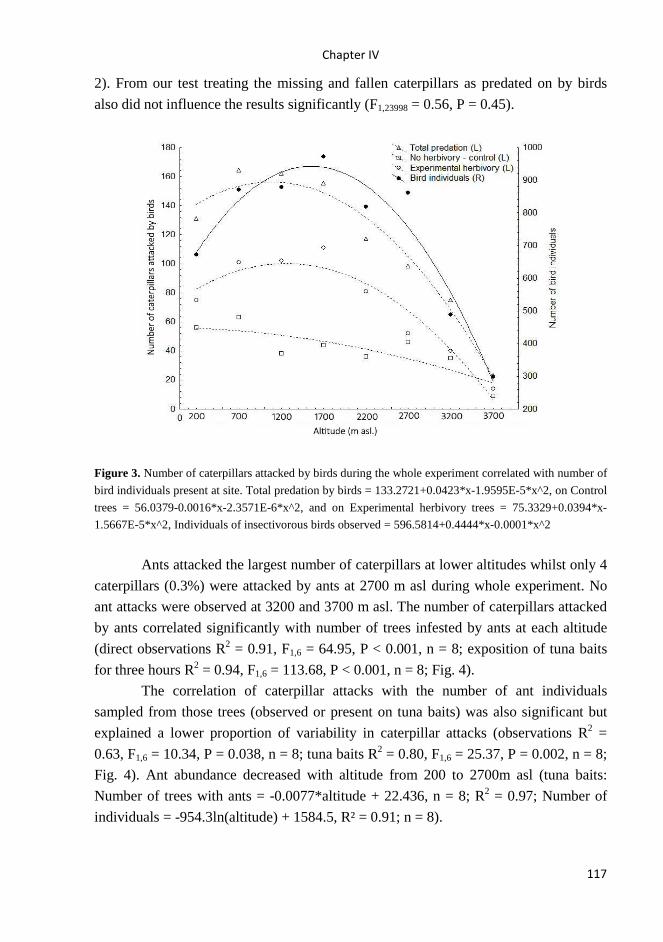
Chapter IV
117
2). From our test treating the missing and fallen caterpillars as predated on by birds
also did not influence the results significantly (F1,23998 = 0.56, P = 0.45).
Figure 3. Number of caterpillars attacked by birds during the whole experiment correlated with number of
bird individuals present at site. Total predation by birds = 133.2721+0.0423*x-1.9595E-5*x^2, on Control
trees = 56.0379-0.0016*x-2.3571E-6*x^2, and on Experimental herbivory trees = 75.3329+0.0394*x-
1.5667E-5*x^2, Individuals of insectivorous birds observed = 596.5814+0.4444*x-0.0001*x^2
Ants attacked the largest number of caterpillars at lower altitudes whilst only 4
caterpillars (0.3%) were attacked by ants at 2700 m asl during whole experiment. No
ant attacks were observed at 3200 and 3700 m asl. The number of caterpillars attacked
by ants correlated significantly with number of trees infested by ants at each altitude
(direct observations R2 = 0.91, F1,6 = 64.95, P < 0.001, n = 8; exposition of tuna baits
for three hours R2 = 0.94, F1,6 = 113.68, P < 0.001, n = 8; Fig. 4).
The correlation of caterpillar attacks with the number of ant individuals
sampled from those trees (observed or present on tuna baits) was also significant but
explained a lower proportion of variability in caterpillar attacks (observations R2 =
0.63, F1,6 = 10.34, P = 0.038, n = 8; tuna baits R2 = 0.80, F1,6 = 25.37, P = 0.002, n = 8;
Fig. 4). Ant abundance decreased with altitude from 200 to 2700m asl (tuna baits:
Number of trees with ants = -0.0077*altitude + 22.436, n = 8; R2 = 0.97; Number of
individuals = -954.3ln(altitude) + 1584.5, R² = 0.91; n = 8).
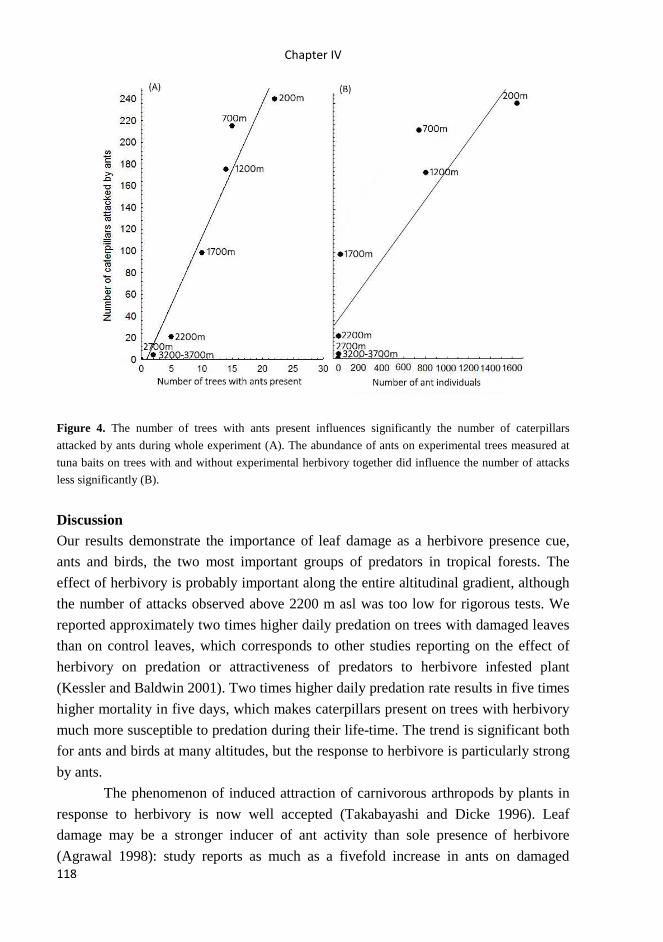
Chapter IV
118
Figure 4. The number of trees with ants present influences significantly the number of caterpillars
attacked by ants during whole experiment (A). The abundance of ants on experimental trees measured at
tuna baits on trees with and without experimental herbivory together did influence the number of attacks
less significantly (B).
Discussion Our results demonstrate the importance of leaf damage as a herbivore presence cue,
ants and birds, the two most important groups of predators in tropical forests. The
effect of herbivory is probably important along the entire altitudinal gradient, although
the number of attacks observed above 2200 m asl was too low for rigorous tests. We
reported approximately two times higher daily predation on trees with damaged leaves
than on control leaves, which corresponds to other studies reporting on the effect of
herbivory on predation or attractiveness of predators to herbivore infested plant
(Kessler and Baldwin 2001). Two times higher daily predation rate results in five times
higher mortality in five days, which makes caterpillars present on trees with herbivory
much more susceptible to predation during their life-time. The trend is significant both
for ants and birds at many altitudes, but the response to herbivore is particularly strong
by ants.
The phenomenon of induced attraction of carnivorous arthropods by plants in
response to herbivory is now well accepted (Takabayashi and Dicke 1996). Leaf
damage may be a stronger inducer of ant activity than sole presence of herbivore
(Agrawal 1998): study reports as much as a fivefold increase in ants on damaged

Chapter IV
119
leaves 12 minutes after herbivorous damage, and twofold increase in ants on damaged
leaves after 24 hours, compare to simple undamaged control leaves. Similarly, Romero
(2004) reported three times more ants on young leaves with damage compare to
undamaged leaves.
Decreasing predation rate with altitude leads to the prediction of a higher
incidence of anti-predatory defences, such as chemical or behavioural, in the lowlands,
particularly against ants (Agrawal and Rutter 1998; Schmidt 1990). Further, the
frequency of aposematic signals is expected to decrease with altitude. The linear
relationship between the abundance of predators and the attack rate on caterpillars
suggests that predator/prey ratio remains approximately constant along the altitudinal
gradient. Further, it implies that the efficiency of predators in finding their prey does
not change with altitude, despite the decrease in vegetation complexity with altitude
(Tvardikova, unpubl. data). Šipoš and Kindlmann (2012) conclude that even with a
constant predator-to-prey ratio, increasing vegetation complexity may lower attack rate
on prey. This was not the case in our study, possibly because it was limited to the
understory of primary forest.
The results of experiments with artificial caterpillars have to be interpreted
with caution, as clay caterpillars provide only visual cues to their natural enemies;
hence it does not test for predators react to defensive or deterrent behaviours (Gentry
and Dyer 2002). Further, insect feeding on plants under natural conditions leaves other
traces that could reveal them to natural enemies (Gentry and Dyer 2002; Murakami
1999; Vet and Dicke 1992; Weiss et al. 2004). Such clues could be very different for
individual natural enemies and, and likely different enemy taxa handle live insect prey
in different ways (Dyer 1997; Dyer 2002; Hölldobler and Wilson 1990). The method
used could therefore lead to the exclusion of important specialist predators.
The design is undoubtedly biased towards generalist predators that queue out
on visual and mechanical plant damage. However, the incidence of attack on our
artificial caterpillars (exposed on leaves with and without herbivory) per 24 hours was
similar to incidence of attack measured on genuine exposed caterpillars in exclosure
experiments (7.5% ± 6.7%, median = 5.8%, nine studies from both tropical and
temperate habitats (Remmel et al. 2011); and consistent with the results from our
previous study which used the same artificial caterpillars (Tvardikova and Novotny
2012). Manipulative studies using artificial caterpillars recorded similar daily attack
rates of 11.1% (Richards and Coley 2007) in a lowland seasonal forest in Panama,
13.7% in semi evergreen lowland dipterocarp forest in the Philippines (Posa et al.
2007), and 5.8% - 52.4% in three studies from various tropical areas (Remmel et al.
2011).

Chapter IV
120
Experimental damage on leaves in our study attracted ants, which are
chemically oriented predators, as well as mainly visually oriented birds. We used
mechanical damage to simulate herbivory on foliage and this may be a less efficient
cue to predators than the damage done by herbivores feeding, therefore
underestimating the significant effect of predators observed in this study. From the
literature it is unclear for how long would a tree with high leaf damage remain
attractive to predators. Bolter (1997) reported that wounds healed rapidly after cutting,
and their attractiveness to herbivores disappeared shortly after cutting the leaves. In
other experiments, emissions of compounds that attracted predators and parasitoids
waned within minutes after mechanical clipping, but remained 1 – 3 days after actual
chewing damage or application of insect regurgitant (Steinberg et al. 1993; Turlings et
al. 1995). In contrast, Karban (2007) reported that mechanically clipped shoots
attracted predators for up to 6 days following clipping. In order to compensate for
lower efficiency of mechanical damage, we decided to repeat it daily during our
experiments. We expected that response to damage is systemic, and undamaged leaves
of injured plants also emit terpenoids based signals (Turlings and Tumlinson 1992).
Future studies of how ants respond to volatile compounds released by damaged plants
across elevation are needed to understand what influences predation by ants across
altitude.
It is worth noting that a daily mortality rate of 1%, 5% and 20% over the 3-
weeks caterpillar lifespan would produce overall mortality of respectively 19%, 66%
and 99%. We assume that the predation rate observed in this study is plausible since it
corresponds to what is available from the literature in both temperate 78% in Kentucky
(Choate and Rieske 2005) and tropics 68% in Campinas, Sao Paulo (Gomes-Filho
2003). Further, even if our experiments using models of caterpillars did not provide an
estimate of natural predation rates, the relative number of predation incidents should be
comparable among habitats (Brodie 1993) for individual species of generalist
predators.
Schwenk et al. (2010) did not find any effect of altitude on bird predation of
arthropods between 290 and 780 m asl, while we found higher predation rate at 1700 m
than at 200 m asl (Tvardikova and Novotny 2012). This was consistent with the pattern
observed in the present study, where the highest predation by birds was in mid-
altitudes (700 – 1700 m asl). The higher abundances of insectivorous birds in mid-
altitudes, and the relatively gradual decrease of their abundances have been observed in
many other studies (McCain 2009). These suggest that birds drive the predation rates
of caterpillars at altitudes, where ants are relatively rare (i.e. 1700 m asl; Fig. 2). Thus,
relative importance of predation of ants is more important towards the lowland forests

Chapter IV
121
(200 – 1700 m asl) and it decreases with altitude; whereas bird predation become more
important at mid-altitudes (1700 – 2700 m asl).
We observed a dramatic drop in abundance of ants at high altitudes which
correlated with the predation rate observed. This result substantiated previous studies
which observed markedly reduced species richness and abundance of ants at higher
altitudes (Bito et al. 2011; Bruehl et al. 1999; Samson et al. 1997; Yusah et al. 2012),
most likely resulting in a decrease in predation pressure on herbivorous insect. The
number of trees and baits occupied by ants proved to be better correlated with
predation rates than the total abundance of ants in the samples. It appeared that
abundance of ant individuals influences only the number of bites into one caterpillar,
and not the number of predated caterpillars.
In conclusion, our study demonstrates (i) the large importance of plant damage
as a cue of herbivore presence for predators (particularly true for ants but also observed
in birds) (ii) decreasing attack rate of predators with increasing altitudes in tropical
forests, and (iii) a transition in predator dominance from ants in the lowland forests to
birds at the mid to high altitudes. Further, the change in dominant predator group with
altitude could lead to dramatic changes in anti-predation strategies of herbivores, and
the structure of local food webs, along altitudinal gradient.
ACKNOWLEDGEMENTS
We are thankful to field assistants from Kausi, Numba, Bundi, Bruno Sawmill,
Sinopass and Kegesugl for help in the field and hospitality. We are thankful to Bonny
Koane and Jimmy Moses for help during bird and ant surveys, and to Petr Klimeš and
Tom Fayle who provided critical comments on manuscript. The project was financially
supported by the Czech Science Foundation Grants 206/09/0115 and 206/08/H044,
Czech Ministry of Education ME09082, Grant Agency of University of South
Bohemia 04-136/2010/P, US National Science Foundation DEB-0841885, and was
also created as a part of Center of Excellence for Global Study of Biodiversity and
Function of Forest Ecosystems, reg. n. CZ.1.07/2.3.00/20.0064 co-financed by the
European Social Fund and the state budget of the Czech Republic.
Chapter IV
122
SUPPLEMENTARY MATERIAL
Table S1. Tree species used in experiments at each altitudinal site
Figure S1. The number of bird species (A) and individuals (B) per study site had
significant effect on the number of caterpillars on trees with experimental herbivory
attacked by birds.
REFERENCES
Agrawal AA (1998) Leaf damage and associated cues induce aggressive ant
recruitment in a neotropical ant-plant. Ecology 79:2100–2112
Agrawal AA, Rutter MT (1998) Dynamic anti-herbivore defense in ant-plants: the role
of induced responses. Oikos:227-236
Barlow J, Peres CA, Henriques LMP, Stouffer PC, Wunderle JM (2006) The responses
of understorey birds to forest fragmentation, logging and wildfires: An
Amazonian synthesis. Biological Conservation 128:182-192
Bito D, Novotny V, Burwell CJ, Nakamura A, Kitching RL, Ødegaard F (2011)
Predator pressure, herbivore abundance and plant damage along a subtropical
altitudinal gradient. Memoirs of the Queensland Museum 55
Boege K, Marquis, RJ, (2006) Plant quality and predation risk mediated by plant
ontogeny: consequences for herbivores and plants. Oikos 115:559–572
Bolter CJ, Dicke M, Van Loon JJA, Visser JH, Posthumus MA (1997) Attraction of
Colorado Potato beetle to herbivore-damaged plants during herbivory and
after its termination. Journal of Chemical Ecology 23:1003-1023
Brodie ED (1993) Differential avoidance of coral snake banded patterns by free-
ranging avian predators in Costa Rica. Evolution 47:227-235
Bruehl CA, Mohamed M, Linsenmair KE (1999) Altitudinal distribution of leaf litter
ants along a transect in primary forests on Mount Kinabalu, Sabah, Malaysia.
Journal of Tropical Ecology 15:265-277
Choate B, Rieske L (2005) Life history and age-specific mortality of eastern tent
caterpillar (Lepidoptera: Lasiocampidae). Annals of the Entomological Society
of America 98:496-502
Connahs H, Aiello A, Van Bael S, Rodríguez-Castañeda G (2011) Caterpillar
abundance and parasitism in a seasonally dry versus wet tropical forest of
Panama. Journal of Tropical Ecology 27:51-58
De Moraes CM, Lewis WJ, Pare PW, Alborn HT, Tumlinson JH (1998) Herbivore-
infested plants selectively attract parasitoids. Nature 393:570-573
Chapter IV
123
Dunn RR, Parker CR, Sanders NJ (2007) Temporal patterns of diversity: assessing the
biotic and abiotic controls on ant assemblages. Biological Journal of the
Linnean Society 91:191-201
Dyer L (1997) Effectiveness of caterpillar defenses against three species of
invertebrate predators Journal of Research on the Lepidoptera 34:48-68
Dyer LA (2002) A quantification of predation rates, indirect positive effects on plants,
and foraging variation of the giant tropical ant, Paraponera clavata. Journal of
Insect Science 2:1-7
Fiala B, Maschwitz U, Pong TY, Helbig AJ (1989) Studies of a south east Asian ant-
plant association: protection of Macaranga trees by Crematogaster borneensis.
Oecologia 79:463-470
Gentry GL, Dyer LA (2002) On the conditional nature of neotropical caterpillar
defenses against their natural enemies. Ecology 83:3108-3119
Gomes-Filho A (2003) Seasonal fluctuation and mortality schedule for immatures of
Hypna clytemnestra (Butler), an uncommon neotropical butterfly
(Nymphalidae: Charaxinae). Journal of Research on the Lepidoptera 37:37-45
Heil M, McKey D (2003) Protective ant–plant interactions as model systems in
ecological and evolutionary research. Annual Review of Ecology and
Systematics 34:425–453
Heinrich B, Collins SL (1983) Caterpillar leaf damage, and the game of hide-and-seek
with birds. Ecology 64:592-602
Hoballah MEF, Turlings TCJ (2001) Experimental evidence that plants under
caterpillar attack may benefit from attracting parasitoids. Evolutionary
Ecology Research 3:553-565
Hodkinson ID (1999) Species Response to global environmental change or why
ecophysiological models are important: A reply to davis et al. Journal of
Animal Ecology 68:1259-1262
Hölldobler B, Wilson EO (1990) The Ants Springer Berlin
Howe A, Lövei GL, Nachman G (2009) Dummy caterpillars as a simple method to
assess predation rates on invertebrates in a tropical agroecosystem.
Entomologia Experimentalis et Applicata 131:325-329
Hulcr J, Pollet M, Ubik K, Vrkoc J (2005) Exploitation of kairomones and synomones
by Medetera spp. (Diptera: Dolichopodidae), predators of spruce bark beetles.
European Journal of Entomology 102:655–662
Janda M, Konečná M (2011) Canopy assemblages of ants in a New Guinea rain forest.
Journal of Tropical Ecology 27:83-91
Chapter IV
124
Karban R (2007) Damage to sagebrush attracts predators but this does not reduce
herbivory. Entomologia Experimentalis et Applicata 125:71-80
Kessler A, Baldwin IT (2001) Defensive function of herbivore-induced plant volatile
emissions in nature. Science 291:2141-2144
Koh LP, Menge DNL (2006) Rapid assessment of Lepidoptera predation rates in
Neotropical forest fragments. Biotropica 38:132-134
Mäntylä E et al. (2008) From plants to birds: Higher avian predation rates in trees
responding to insect herbivory. PLoS ONE 3:e2832
Mäntylä E, Klemola T, Haukioja E (2004) Attraction of willow warblers to sawfly-
damaged mountain birches: novel function of inducible plant defences?
Ecology Letters 7:915-918
Mäntylä E, Klemola T, Sirkia P, Laaksonen T (2007) Low light reflectance may
explain the attraction of birds to defoliated trees. Behavioral Ecology 19:325-
330
McCain CM (2009) Global analysis of bird elevational diversity. Global Ecology and
Biogeography 18:346-360
Mochizuki M, Yano E (2007) Olfactory response of the anthocorid predatory bug
Orius sauteri to thrips-infested eggplants. Entomologia Experimentalis et
Applicata 123:57-62
Mooney KA (2007) Tritrophic effects of birds and ants on a canopy food web, tree
growth, and phytochemistry. Ecology 88:2005-2014
Mooney KA, Gruner DS, Barber NA, Van Bael SA, Philpott SM, Greenberg R (2010)
Interactions among predators and the cascading effects of vertebrate
insectivores on arthropod communities and plants. Proceedings of the National
Academy of Sciences
Mooney KA, Linhart YB (2006) Contrasting cascades: insectivorous birds increase
pine but not parasitic mistletoe growth. Journal of Animal Ecology 75:350–
357
Müller MS, McWilliams SR, Podlesac D, Donaldson JR, Bothwell HM, Lindroth RL
(2006) Tri-trophic effects of plant defenses: chickadees consume caterpillars
based on host leaf chemistry. Oikos 114:507–517
Murakami M (1999) Effect of avian predation on survival of leaf-rolling lepidopterous
larvae. Researches on Population Ecology 41:135-138
Novotny V, Basset Y (1999) Body size and host plant specialisation: a relationship
from a community of herbivorous insects from New Guinea. Journal of
Tropical Ecology 15:315-328
Chapter IV
125
Novotny V, Basset Y (2005) Host specificity of insect herbivores in tropical forests.
Proceedings of the Royal Society B: Biological Sciences 272:1083–1090
Perfecto I, Vandermeer J (1996) Microclimatic changes and the indirect loss of ant
diversity in a tropical agroecosystem. Oecologia 108:577-582
Posa MRC, Sodhi NS, Koh LP (2007) Predation on artificial nests and caterpillar
models across a disturbance gradient in Subic Bay, Philippines. Journal of
Tropical Ecology 23:27-33
Preisser EL, Strong DR (2004) Climate affects predator control of an herbivore
outbreak. American Naturalist 163:754–762
Rahbek C (1995) The elevational gradient of species richness: a uniform pattern?
Ecography 18:200-205
Rasmann S, Kollner TG, Degenhardt J, Hiltpold I, Toepfer S, Kuhlmann U,
Gershenzon J, Turlings TCJ (2005) Recruitment of entomopathogenic
nematodes by insect-damaged maize roots. Nature 434:732–737
Remmel T, Davison J, Tammaru T (2011) Quantifying predation on folivorous insect
larvae: the perspective of life-history evolution. Biological Journal of the
Linnean Society 104:1-18
Richards LA, Coley PD (2007) Seasonal and habitat differences affect the impact of
food and predation on herbivores: a comparison between gaps and understory
of a tropical forest. Oikos 116:31-40
Richards LA, Phyllis DC (2008) Combined effects of host plant quality and predation
on a tropical Lepidopteran: A comparison between treefall gaps and the
understory in Panama. Biotropica 40:736-741
Rodríguez-Castañeda G (2012) The world and its shades of green: a meta-analysis on
trophic cascades across temperature and precipitation gradients. Global
Ecology and Biogeography 22:118-130
Romero GQ, Izzo TJ (2004) Leaf damage induces ant recruitment in the Amazonian
ant-plant Hirtella myrmecophila. Journal of Tropical Ecology 20:675-682
Samson DA, Rickart EA, Gonzales PC (1997) Ant diversity and abundance along an
elevational gradient in the Philippines. BIOTROPICA 29:349-363
Schemske DW, Mittelbach GG, Cornell HV, Sobel JM, Roy K (2009) Is there a
latitudinal gradient in the importance of biotic interactions? Annual Review of
Ecology, Evolution, and Systematics 40:245-269
Schmidt JO (1990) ed. Insect defenses: adaptive mechanisms and strategies of prey and
predators. SUNY Press
Chapter IV
126
Schwenk WS, Strong AM, Sillett TS (2010) Effects of bird predation on arthropod
abundance and tree growth across an elevational gradient. Journal of Avian
Biology 41:367-377
Shimoda T, Takabayashi J, Ashihara W, Takafuji A (1997) Response of predatory
insect Scolothrips takahashii toward herbivore-induced plant volatiles under
laboratory and field conditions. Journal of Chemical Ecology:2033–2048
Shurin JB et al. (2002) A cross-ecosystem comparison of the strength of trophic
cascades. Ecology Letters 5:785–791
Šipoš J, Kindlmann P (2012) Effect of the canopy complexity of trees on the rate of
predation of insects. Journal of Applied Entomology
Sivinski J, Piñero J, Aluja M (2000) The Distributions of Parasitoids (Hymenoptera) of
Anastrepha Fruit Flies (Diptera: Tephritidae) along an Altitudinal Gradient in
Veracruz, Mexico. Biological Control 18:258-269
Stamp NE, Bowers MD (1991) Indirect effect on survivorship of caterpillars due to
presence of invertebrate predators. Oecologia 88:325-330
StatSoft, Inc. (2010). STATISTICA (data analysis software system), version 9.1.
www.statsoft.com.
Steinberg S, Dicke M, Vet LM (1993) Relative importance of infochemicals from first
and second trophic level in long-range host location by the larval parasitoid
Cotesia glomerata. Journal of Chemical Ecology 19:47-59
Stenseth NC, Mysterud A, Ottersen G, Hurrell JW, Chan K-S, Lima M (2002)
Ecological effects of climate fluctuations. Science 297:1292–1296
Symons FB, Beccaloni GW (1999) Phylogenetic indices for measuring the diet
breadths of phytophagous insects. Oecologia 119:427-434
Takabayashi J, Dicke M (1996) Plant–carnivore mutualism through herbivore-induced
carnivore attractants. Trends in Plant Science:109-113
Trollope ST, White JG, Cooke R (2009) The response of ground and bark foraging
insectivorous birds across an urban-forest gradient. Landscape and Urban
Planning 93:142-150
Turlings TC, Humlington JH, Lewis WJ (1990) Exploitation of herbivore-induced
plant odors by host-seeking parasite wasps. Science 250
Turlings TC, Loughrin JH, McCall PJ, Röse US, Lewis WJ, Tumlinson JH (1995)
How caterpillar-damaged plants protect themselves by attracting parasitic
wasps. Proceedings of the National Academy of Sciences of the United States
of America 92:4169-4174
Turlings TC, Tumlinson JH (1992) Systemic release of chemical signals by herbivore-
injured corn. Proceedings of the National Academy of Sciences 89:8399-8402
Chapter IV
127
Tvardikova K, Novotny V (2012) Predation on exposed and leaf-rolling articial
caterpillars in tropical forests of Papua New Guinea. Journal of Tropical
Ecology 00:1-11
Van Bael SA, Brawn JD, Robinson SK (2003) Birds defend trees from herbivores in a
Neotropical forest canopy. Proceedings of the National Academy of Sciences
of the United States of America 100:8304-8307
Van Bael SA et al. (2008) Birds as predators in tropical agroforestry systems. Ecology
89:928-934
Véle A, Holuša J, Frouz J (2009) Sampling for ants in different-aged spruce forests: a
comparison of methods. European Journal of Soil Biology 45: 301-305.
Vet LEM, Dicke M (1992) Ecology of infochemical use by natural enemies in a
tritrophic context. Annual Reviews of Entomology 37:141-172
Weiss MR, Wilson EE, Castellanos I (2004) Predatory wasps learn to overcome the
shelter defences of their larval prey. Animal Behaviour 68:45-54
Yusah KM, Turner EC, Yahyz BE, Fayle TM (2012) An elevational gradient in litter-
dwelling ant communities in Imbak Canyon, Sabah, Malaysia. Journal of
Tropical Biology and Conservation 9:192 - 199
Zanette, L, Doyle, P, Tremont, S M (2000) Food shortage in small fragments :
Evidence from an area-sensitive passerine. Ecology 81:1654-1666
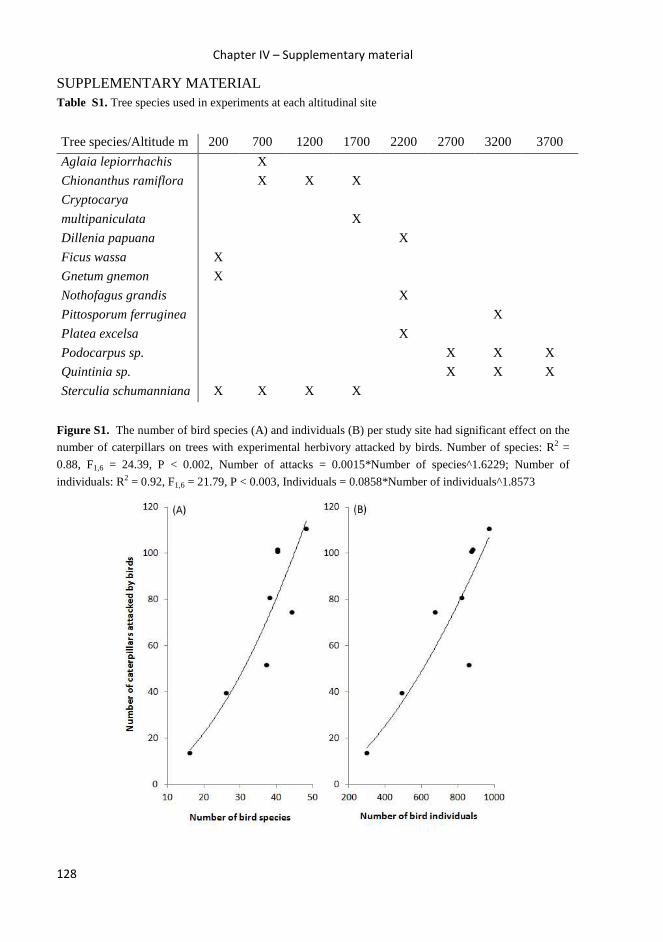
Chapter IV – Supplementary material
128
SUPPLEMENTARY MATERIAL Table S1. Tree species used in experiments at each altitudinal site
Tree species/Altitude m 200 700 1200 1700 2200 2700 3200 3700
Aglaia lepiorrhachis X
Chionanthus ramiflora X X X
Cryptocarya
multipaniculata X
Dillenia papuana X
Ficus wassa X
Gnetum gnemon X
Nothofagus grandis X
Pittosporum ferruginea X
Platea excelsa X
Podocarpus sp. X X X
Quintinia sp. X X X
Sterculia schumanniana X X X X
Figure S1. The number of bird species (A) and individuals (B) per study site had significant effect on the
number of caterpillars on trees with experimental herbivory attacked by birds. Number of species: R2 =
0.88, F1,6 = 24.39, P < 0.002, Number of attacks = 0.0015*Number of species^1.6229; Number of
individuals: R2 = 0.92, F1,6 = 21.79, P < 0.003, Individuals = 0.0858*Number of individuals^1.8573
129
Chapter V Disappearance of birds from forest fragments in Papua New Guinea
Katerina Tvardikova, Bonny Koane,Vojtech Novotny
(manuscript in review)

Chapter V
130
Chapter V
131
Disappearance of birds from forest fragments in Papua New Guinea
Katerina Tvardikova1*, Bonny Koane2, Samuel Jeppy2, Vojtech Novotny1
1 Faculty of Science, University of South Bohemia and Biology Center, Czech
Academy of Sciences, Institute of Entomology, Branisovska 31, 370 05 Ceske
Budejovice, Czech Republic 2 The New Guinea Binatang Research Center, Madang, Papua New Guinea
* Corresponding author: [email protected]
Abstract
Tropical forests worldwide are being fragmented at a rapid rate, causing a tremendous
loss of biodiversity. Determining the impacts of forest disturbance and fragmentation
on tropical biotas is therefore a central goal of conservation biology. Here we focus on
bird communities in forest fragments (300, 600 and 1,200 ha) in the lowlands of Papua
New Guinea and compare them with bird communities in continuous forest. Size of
forest fragments did not prove to have a significant effect on the number of locally
recorded birds, and we recorded 80, 82 and 84 forest bird species in fragments and 107
in continuous forest. We show that large bodied frugivores and understory insectivores
are particularly sensitive to habitat fragmentation. We did not find strong support for
the food scarcity hypothesis which states that the decline of insectivorous birds in
forest fragments is caused by an impoverished invertebrate prey base. Neither have we
found significant difference in microclimate in forest interiors. Rather, we show that
the microhabitats preferred by sensitive birds were scarce in forest fragments, but
common in continuous forest. Our results thus support the hypothesis that changes in
microhabitats make forest fragments unsuitable for certain, sensitive species. Although
none of the studied forest fragments was large enough to sustain complete bird
communities found in primary forest, they housed large numbers of bird species, and
they are easily protected on village basis in the conditions of Papua New Guinea.
Keywords
food limitation, habitat selection, insectivorous birds, forest fragmentation, frugivorous
birds, microhabitat, tropical forest, rainforest conservation, species loss, local
extinction

Chapter V
132
Lowland forests of the wet tropics support the most species rich communities of
terrestrial birds. Unfortunately, they are under intense threat of disturbance by selective
logging and conversion to plantations (Barlow et al., 2006), which leads to
fragmentation of the initially continuous forest cover found in many tropical areas.
Unfortunately, forest fragmentation almost always leads to local loss of species
(Turner, 1996). Recent research has focused mainly on Neotropical forest conversion
(Komar, 2006) and fragmentation (Sekercioglu et al., 2002). More information on the
impacts of this process from other tropical forest systems is needed, particularly from
Africa (Newmark, 1991) and Pacific Ocean islands (Marsden et al., 2006), where the
deforestation is intensifying (Shearman et al., 2008).
Our previous work in primary and secondary forest in Papua New Guinea
(Tvardikova, 2010) demonstrated high sensitivity of lowland insectivorous birds and
canopy frugivores to forest disturbance. Other authors have also reported large
frugivorous and terrestrial and understory insectivorous birds to be sensitive to habitat
change (Stouffer and Bierregaard, 1995, Sekercioglu, 2002, Sekercioglu et al., 2002,
Kattan et al., 2004, Lees and Peres, 2010). Insectivores have generally low mobility
and are more confined to forest interior than other forest passerine guilds. They are
usually more specialized in their foraging techniques and use narrower habitats and
microhabitats (Terborgh et al., 1990, Stouffer and Bierregaard, 1995). Insectivores
seem to be more sensitive to subtle habitat changes because, unlike fruits, flowers, and
seeds, invertebrates actively avoid insectivores and, as a result, insectivorous birds
have evolved into many specialized niches and seek prey in certain microhabitats.
Over a dozen of hypotheses have been proposed to explain the disappearance
of insectivorous bird species from forested habitats around the world (Canaday, 1996,
Ford et al., 2001). Four of these are particularly relevant to the decline of understory
insectivores: The food scarcity hypothesis states that small fragments are impoverished
in prey preferred by understory insectivores (Ford et al., 2001, Burke and Nol, 1998,
Zanette et al., 2000). The microclimate hypothesis proposes that these birds are
particularly sensitive physiologically to changes in microclimate associated with forest
fragmentation (Karr and Freemark, 1983, Canaday, 1996). The habitat specificity
hypothesis states that the loss of some microhabitat elements (such as army ant
swarms, dead trees) from fragments may affect many understory insectivores
(Canaday, 1996, Ford et al., 2001). Finally, according to the limited dispersal
hypothesis, understory insectivores, because of their relatively sedentary habits and
possible behavioural avoidance of clearings and altered habitats (Stouffer and
Bierregaard, 1995, Báldi, 1996, Sekercioglu, 2002), may be less likely to disperse into

Chapter V
133
more favourable habitats after forest fragmentation and may disappear from fragments
as a result of stochastic events.
Our objective was to quantitatively describe bird communities and their
response to forest fragmentation in lowland tropical forest in Papua New Guinea and
test the above hypotheses on the causes of species loss. Papua New Guinea forests are
continuous over large areas and they represent one of the last three tropical wilderness
areas along with Amazonian and Congo forest (Mittermeier et al., 1998). However,
they are presently under increasing threat from logging (Shearman et al. 2008). The
response by birds to forest fragmentation in Papua New Guinea has received little
attention. We focused on birds in a continuous forest (>10,000 ha) and forest fragments
of different sizes (300, 600 and 1,200 ha), in order to identify the size of forest
fragments which would be sufficient to maintain local species richness and functions
similar to continuous forest, and to determine which of the four proposed hypotheses
might explain declines in understory insectivores.
Methods
Research Sites Field work was conducted in June 2010, October 2010 and January
2011 in primary forest and forest fragments in the lowlands of Madang province,
Papua New Guinea (PNG). The study sites were (1.) continuous forest (5° 13.5' S, 145°
04.9' E, 120 m a.s.l.) situated in the middle of >10,000 ha of continuous lowland
primary forest in Wanang Conservation Area, which itself is embedded within
~100,000 ha of selectively logged, but largely contiguous lowland rainforest; (2.) a
large fragment (5° 01.73' S, 145° 46.01' E, 100 m a.s.l.) – 1200 ha fragment of forest
near villages Rempi and Baiteta; (3.) a mid-sized fragment (5° 07.99' S, 145° 45.47' E,
100 m a.s.l.) - 600 ha forest fragment near village Baitabag, (4.) a small fragment
(5°16.2' S, 145°41.1' E, 170 m a.s.l.) - 300 ha fragment of lowland primary forest near
Ohu village. All fragments are located in relatively densely settled and intensely
farmed landscape around Madang town, 15 – 24 km from each other, and 67- 76 km
from the site in continuous forest (Fig. 1). The fragments have been increasingly
isolated since the 1980s as the original mosaic of primary and secondary forests around
villages changed into a more intensely managed landscape with slash-and-burn food
gardens, young secondary forest growing on abandoned gardens, deforested village
settlements, and plantations. All fragments have been preserved as village-based
protected areas, where logging and hunting is forbidden. The village landowners
supervise the forest preservation. Likewise, the continuous forest has been declared by
village landowners as a conservation area with no logging and hunting
(www.entu.cas.cz/png/wanang).
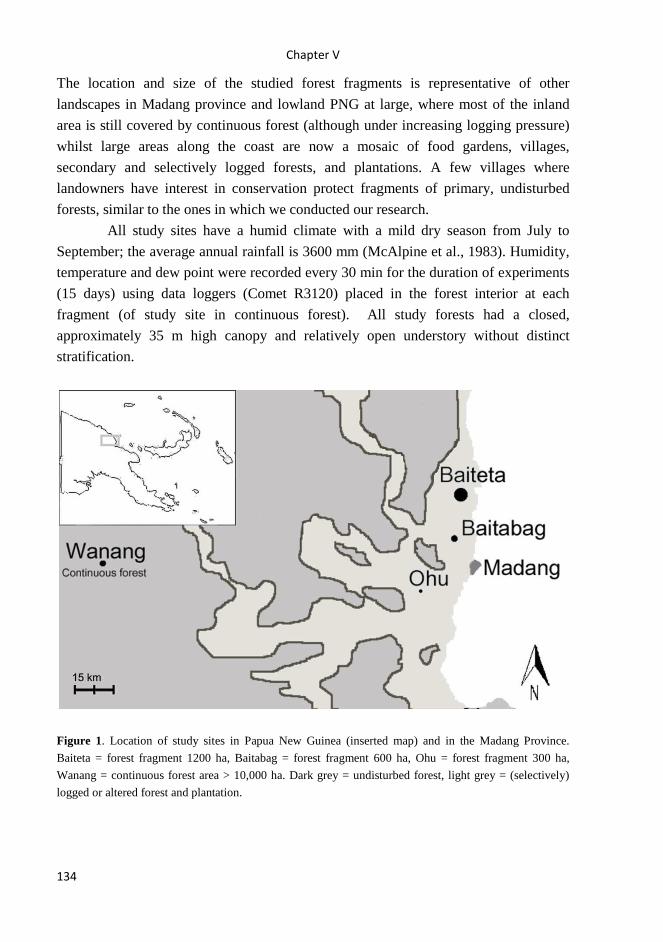
Chapter V
134
The location and size of the studied forest fragments is representative of other
landscapes in Madang province and lowland PNG at large, where most of the inland
area is still covered by continuous forest (although under increasing logging pressure)
whilst large areas along the coast are now a mosaic of food gardens, villages,
secondary and selectively logged forests, and plantations. A few villages where
landowners have interest in conservation protect fragments of primary, undisturbed
forests, similar to the ones in which we conducted our research.
All study sites have a humid climate with a mild dry season from July to
September; the average annual rainfall is 3600 mm (McAlpine et al., 1983). Humidity,
temperature and dew point were recorded every 30 min for the duration of experiments
(15 days) using data loggers (Comet R3120) placed in the forest interior at each
fragment (of study site in continuous forest). All study forests had a closed,
approximately 35 m high canopy and relatively open understory without distinct
stratification.
Figure 1. Location of study sites in Papua New Guinea (inserted map) and in the Madang Province.
Baiteta = forest fragment 1200 ha, Baitabag = forest fragment 600 ha, Ohu = forest fragment 300 ha,
Wanang = continuous forest area > 10,000 ha. Dark grey = undisturbed forest, light grey = (selectively)
logged or altered forest and plantation.

Chapter V
135
Bird surveys Bird communities were surveyed by three types of census – point counts,
mist-netting and random walks. Point counts were carried out at 16 points regularly
spaced along a 2250 m transect (successive points were 150 ± 5 m apart to avoid
overlap). All birds seen or heard were recorded in the following radial distance classes
in meters: 0 - 10, 11 - 20, 22 – 30, 31 – 40, and 41 – 50. We started censuses 15 min
before day break, at a randomly selected point. Each counts lasted 15 minutes so that
all 16 points were surveyed before 11:00. We conducted nine replications at all points,
resulting into 36 hr of observation at each site. All point-counts represented
heterogeneity of lowland forest habitats in similar way (i.e. survey points included hill
ridges, creeks, natural canopy openings, etc.). Further, we mist-netted birds into 200 m
long line of nets for 6 days (using nets 2.5 m high x 12-18 m long, mesh 16 mm), from
05:30 to 17:30, with checks every 20 min. We identified all mist-netted individuals
into species, marked them individually by colour rings, and released within 10 min.
Finally, we walked along the tracks and throughout the area and constructed
continuous list of species during the random walks. Walks lasted 2 – 3 hr day-1
(starting at 15:00), and were standardized to 20 hr site-1. All surveys were conducted
by three observers (KT, BK, a local guide familiar with avifauna), who had previous
experience with ornithological surveys in Papua New Guinea. We also recorded whole
15 min of point counts and unclear voices during random walks, to enable later
identification (using recorder Marantz PMD 620 & Microphone Seinnheiser ME67).
Observed birds were partitioned into four broad trophic guilds, namely insectivores
(taking invertebrates as main food), frugivores (fruit and seed eaters), omnivores
(taking plant material and invertebrates in similar ratio) and nectarivores, based on
dietary information in standard references (Hoyo et al., 1992-2011, Beehler et al.,
1986, Peckover and Filewood, 1976). Raptors, swifts and non-forest bird species
passing through the sites were excluded from analyses. See Table S1 in Supplementary
material for list of observed species, species included in analyses and their habitat and
feeding preferences.
Bird diet We obtained diet samples from insectivorous and omnivorous birds by using
nonlethal 1.5% potassium antimony tartarate, based on established protocols (Poulin
and Lefebvre, 1995, Mestre et al., 2010). The first author examined each regurgitate
under a stereo microscope and estimated the number and length of prey items eaten
based on a reference collection and published order specific regressions of weight on
length (Tatner, 1983, Ralph et al., 1985). Invertebrates were identified into orders. The
food analyses are based on examination of prey items in 120 regurgitated samples: five
from each bird species present in all study sites (i.e. Arses insularis, Colluricincla

Chapter V
136
megarhyncha, Meliphaga analoga, Melilestes megarhynchus, Monarcha guttula,
Pitohui kirhocephalus). Other bird species either did not occur in all sites or we did not
manage to get the minimum of five samples thought to offer adequate representation of
the diet of a species within a given time period (Sekercioglu et al., 2002). Twenty-two
prey categories were identified, including 10 insect groups (Coleoptera, Diptera,
Dermatoptera, Neuroptera, Odonata, Orthoptera, Hemiptera, Lepidoptera (adult),
Hymenoptera were split into Formicidae, and others), Chilopoda, Lepidotera larvae,
insect larvae, pupae, eggs, Araneae, Gastropoda, and vertebrates (small lizard, frog).
Habitat At each point-count point, we measured the following variables according to
methods in Bibby et al. (1992): canopy height, shrub height (3 measures per point
using laser measuring device); shrub foliage density (5 measures per point using scatter
plot estimates; Creagh et al., 2004); percentage of ground covered by grass, bare
ground and litter (15 measures in 1x1 m square per point); canopy openness (3 photos
taken per point – analyzed in Gap Light Analyzer (Frazer, 1999, Frazer et al., 2001),
presence/absence of fruiting trees at each point.
At each study site, we delineated three 150 x 2 m lines (between points 3-4, 6-
7, 12-13) where we counted all plant stems (DBH >1 cm), and categorized them
according to size (1 – 2 cm, 2 – 5 cm, and > 5 cm DBH), and leaf size (small, mid-size,
large). Trees were scored as for the presence or absence of epiphytes and termite nests.
Further, we counted dead logs or dead standing trees within the lines.
Prey availability survey We sampled the leaf-dwelling arthropod communities from
tree saplings at all study sites. Crowns of ten tree saplings (DBH ~5 cm) were lowered
above mosquito net, covered by net and sprayed with commercial insecticide. All
arthropods were collected, placed in 70% alcohol and identified into the same groups
as the invertebrates in food samples. All leaves were collected, weighed and their leaf
area was measured using ImageJ software analysis of their digital images. Further, the
mean abundance of ants was counted on 30 tuna baits (and 25 in continuous forest)
placed at tree samplings after 60 minutes from exposure (J. Moses and P. Klimes,
unpubl. data). Finally, abundances of butterflies were surveyed along three 300 meters
long transects in all study sites. Each transect was walked slowly for 30 min, and walks
were replicated ten times (P. Vlasanek, unpubl. data).
Statistical analyses We used all three survey methods to identify local species
richness and bird abundances. We examined microhabitat characteristics of all sites,
and eliminated those without significant differences between study sites. Namely,
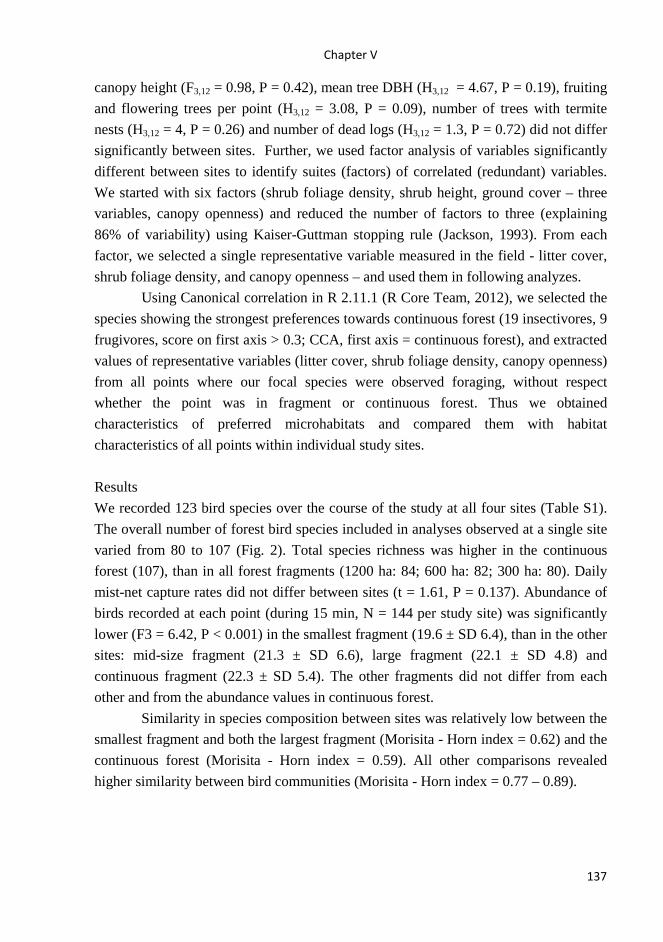
Chapter V
137
canopy height (F3,12 = 0.98, P = 0.42), mean tree DBH (H3,12 = 4.67, P = 0.19), fruiting
and flowering trees per point (H3,12 = 3.08, P = 0.09), number of trees with termite
nests (H3,12 = 4, P = 0.26) and number of dead logs (H3,12 = 1.3, P = 0.72) did not differ
significantly between sites. Further, we used factor analysis of variables significantly
different between sites to identify suites (factors) of correlated (redundant) variables.
We started with six factors (shrub foliage density, shrub height, ground cover – three
variables, canopy openness) and reduced the number of factors to three (explaining
86% of variability) using Kaiser-Guttman stopping rule (Jackson, 1993). From each
factor, we selected a single representative variable measured in the field - litter cover,
shrub foliage density, and canopy openness – and used them in following analyzes.
Using Canonical correlation in R 2.11.1 (R Core Team, 2012), we selected the
species showing the strongest preferences towards continuous forest (19 insectivores, 9
frugivores, score on first axis > 0.3; CCA, first axis = continuous forest), and extracted
values of representative variables (litter cover, shrub foliage density, canopy openness)
from all points where our focal species were observed foraging, without respect
whether the point was in fragment or continuous forest. Thus we obtained
characteristics of preferred microhabitats and compared them with habitat
characteristics of all points within individual study sites.
Results
We recorded 123 bird species over the course of the study at all four sites (Table S1).
The overall number of forest bird species included in analyses observed at a single site
varied from 80 to 107 (Fig. 2). Total species richness was higher in the continuous
forest (107), than in all forest fragments (1200 ha: 84; 600 ha: 82; 300 ha: 80). Daily
mist-net capture rates did not differ between sites (t = 1.61, P = 0.137). Abundance of
birds recorded at each point (during 15 min, N = 144 per study site) was significantly
lower (F3 = 6.42, P < 0.001) in the smallest fragment (19.6 ± SD 6.4), than in the other
sites: mid-size fragment (21.3 ± SD 6.6), large fragment (22.1 ± SD 4.8) and
continuous fragment (22.3 ± SD 5.4). The other fragments did not differ from each
other and from the abundance values in continuous forest.
Similarity in species composition between sites was relatively low between the
smallest fragment and both the largest fragment (Morisita - Horn index = 0.62) and the
continuous forest (Morisita - Horn index = 0.59). All other comparisons revealed
higher similarity between bird communities (Morisita - Horn index = 0.77 – 0.89).

Chapter V
138
Figure 2. (A) Number of species recorded by individual survey techniques at each site (PC – point count -
selected a priori as the main survey technique, MN – species recorded in mist-nets but not PC, RW –
species recorded during random walks only). (B) Number of species partitioned into feeding guilds, in
continuous forest (Cont.), fragment 1200 ha (Fr.1200), fragment 600 ha (Fr.600), fragment 300 ha
(Fr.300) large.
The number of insectivorous bird species (35 sp.) found in the smallest
fragment was lower than in continuous forest (44 sp.). Fragments of 600 and 1200 ha
housed similar numbers of insectivores (37 and 39 sp.). Species richness of frugivores
in continuous forest (21 sp.) was significantly higher than in all other forest fragments
(1600 ha: 16 600 ha: 16, 300 ha: 14 sp.). Species richness of birds identified as
omnivores did not differ significantly between the large fragment and the continuous
forest, and between the medium and the small fragment (Fig. 2). Species richness of
nectarivorous bird did not differ between study sites (Fig. 2)
In bird diet samples Coleoptera, Areneae, Hymenoptera (other than ants),
Lepidoptera larvae, and ants (Formicidae) were the most common prey, comprising 62
- 71% of all food samples (Fig. 3). The relative importance of individual arthropod
groups corresponded with their relative abundance found on tree saplings; however
some exceptions occurred (e.g. ants or cockroaches were relatively more abundant on
tree saplings than in food samples; Fig. 3). More importantly, composition of prey
items in diet samples from the forest and fragments did not differ significantly for any
bird species (χ² < 7.2, P > 0.21; Fig. 3). The average number of prey items/diet sample

Chapter V
139
did not differ significantly (Fig. 4), except samples of Arses insularis (Fig. 4) which
decreased with fragment size.
Number of arthropod individuals per leaf area (F3,36 = 1.15, P = 0.33) and
average body length of arthropods (e.g. Araneae: F3,360 = 1.17, P = 0.31, Lepidoptera
larvae: F3,111 = 0.2, P = 0.81, Coleoptera = F3,452 = 0.98, P = 0.37) did not vary
significantly between study sites. Similarly, there was no difference in number of adult
butterflies observed along transects among the study sites (χ²3 = 6.66, P = 0.083),
neither was there any difference in ant abundance on tuna baits (F3,19 = 1, P = 0.40).
However, more traps (17 out of 30) were visited in the 300 ha fragment than in
continuous forest (9 traps) and the 1200 ha fragment (10 traps).
We found no differences in microclimate in the forest interior among study
sites. None of the measured variables (average daily temperature F3,29 = 0.76, P = 0.53,
average daily humidity F3,29 = 1.2, P = 0.32, and daily temperature fluctuation H3,29 =
2.11, P = 0.34) varied significantly between sites.
Figure 3. Mean relative importance of main arthropod taxa present on tree saplings across all study sites
(there was no significant difference in number of individuals per leaf area between study sites) and in food
samples of birds mist-netted in fragments and continuous forest. The differences between study sites are
not significant.

Chapter V
140
Figure 4. Number of arthropod individuals in food samples of six bird species (ArseInsu = Arses
insularis, CollMega = Colluricincla megarhyncha, MeliAnal = Meliphaga analoga, MeliMega =
Melilestes megarhynchus, MonaGutt = Monarcha guttula, PitoKirh = Pitohui kirhocephalus) in
continuous forest (Cont.), fragment 1200 ha (Fr.1200), fragment 600 ha (Fr.600), and fragment 300 ha
(Fr.300).
In general, microhabitats available in forest fragments differed from those
available in continuous forest. Specifically, canopy openness in forest fragments was
higher than in continuous forest, which resulted in a higher percentage of ground
covered by grass (and ferns) at the expense of litter (Fig. 5). Foliage shrub density at
points was more variable in fragments than in continuous forest (Fig. 5). The
proportion of small (1 – 2 cm DBH) to larger (>2 cm DBH) stems was higher in the
smallest fragment (33%) than in the larger fragments or continuous forest (16 – 23%),
along the measured transects. Also the small stems tend to be species with larger leaves
(7% small leaves, 51% mid-size leaves and 55% large leaves within 1 – 2 cm DBH
category in 300 ha fragment; 22% - 28% - 29% in respectively in continuous forest).
Leaf-size composition of larger plants did not differ between study sites.
We found most sensitive insectivores in points with low canopy openness (8 –
14 %), with relatively large litter cover (55 – 85 %), and shrub density between 20 – 34
% (Fig. 5). Although some points in forest fragments provided such conditions, the
mean canopy openness in all fragments was higher, mean litter cover lower, and shrub
Chapter V
141
density varied a lot between individual points in the fragments, and seemed to be
generally lower, than on the points preferred by sensitive birds (Fig. 5).
Figure 5. Microhabitat characteristics preferred by 19 sensitive insectivorous bird species: (A) canopy
openness, (B) litter cover, (C) shrub density, and the mean values for these variables in continuous forest
(Cont.), fragment 1200 ha (Fr.1200), fragment 600 ha (Fr.600), and fragment 300 ha (Fr.300). Means
(circles), standard error (lines), and ±95% confidence intervals of means (horizontal lines). Values for
birds and habitats are separated by interrupted line. See Table S1 for list of species and their name codes.
Discussion
We found fewer bird species in forest fragments, than in continuous forest.
Specifically, the number of observed insectivorous bird species was the lowest in the
300 ha fragment, higher in both larger forest fragments (600 and 1200 ha) and highest
in continuous forest. Also species richness of frugivores in continuous forest was
significantly higher than in all forest fragments.
Food does not seem to limit local insectivorous birds in studied fragments.
Arthropod richness per leaf area was similar between all study sites, and there was no
obvious difference in amount of foliage across the study sites. Further, we obtained
similar results from examination of bird diet, with no significant changes in food
composition or in number of insects taken. Only one bird species (Arses insularis) had
a lower number of arthropod individuals in food samples from smaller fragments.
More food samples would be however needed to make a robust conclusion. Also some
more subtle specificity in food preference could be underestimated by our method,
since we identified prey items only to order.
The lack of support for food scarcity hypothesis in our study was in agreement
with another tropical study (Sekercioglu et al., 2002) but not with three studies in the

Chapter V
142
temperate zone where higher food abundance in large forest fragments was positively
correlated with the abundance and reproductive performance of the two understory
insectivorous bird species studied (Burke and Nol, 1998, Burke and Nol, 2000, Zanette
et al., 2000).
Changes in invertebrate communities resulting from forest fragmentation are
relatively well documented (Didham et al., 1996, Klein, 1989, Turner, 1996). Some
studies have also shown that changes are due to the differences in food and/or
microhabitat preferences: some species are unaffected or even increase their densities
in fragments (Didham et al., 1996). Leaf-litter invertebrates decline as a result of
desiccation in small forest fragments and generalist edge species that prefer the dense
vegetation near fragment edges increase in number (Didham, 1997). Sekercioglu
(2002) found that invertebrate abundance, their average length, and dry biomass in
forest and fragment were surprisingly similar. We have not found any significant
differences in number of arthropods per leaf area (neither per tuna bait nor per butterfly
transect) in forest fragments and in continuous forest. We believe that the size of our
forests can provide an explanation, as our fragments were large and we focused mainly
on forest interior. Also, another study found decrease of arthropods and food shortage
only in smaller fragments (~55 ha), but not in large ones (> 400 ha; Zanette et al.,
2000).
The microclimate hypothesis states that sedentary understory insectivores react
more unfavourably to microclimate fluctuations in forest fragments than more mobile
species that are frequently exposed to different microclimates. However we failed to
find significant differences in forest interior microclimate, by data loggers placed at
least 300 m from forest edge.
We found that while most of the measured forest characteristics did not differ
significantly between sites, the insectivorous sensitive birds foraged preferably in
microhabitats that differed from those broadly available in forest fragments. Those
birds were very selective towards ground cover and preferred high percentage of
ground covered by litter in contrary to dense grass and fern cover. They were further
seen mostly in points with small canopy openness thus small amount of light
transmitted to understory. Forest fragments offered wide range of microhabitats, but
only few of those points seemed to be suitable for insectivorous birds. On the other
hand, continuous forest and larger fragments seemed to be more homogenous and had
more points with suitable conditions. Compared to continuous forest, the understory
plants of the smallest fragment had also different leaf-size composition, with relatively
more plant species with larger leaves which are shown to be less attractive as searching
substrate for most of the insectivorous birds (Bell, 1969).
Chapter V
143
Monarchidae, Rhipiduridae and Acanthizidae were among the bird species
missing or severely influenced by forest fragmentation. Member of those families are
sallying flycatchers and gleaners searching for food mainly in lower or mid storey of
forests, therefore likely to be influenced by changes in their foraging substrate. Other
sensitive species, e.g. Garritornis isidorey, Pitas or Jewel-Babblers, are dependent on
forest ground substrate where they search for arthropods. This result is in concordance
with a study on scrubwrens in Australia (Creagh et al., 2004), or insectivorous species
in Amazonia (Stratford and Stouffer, 2013), Peru and Tensas (Marra and Remsen,
1997).
All surveys and measurements were conducted at least 150 m from forest edge,
which is believed by some authors to control for direct edge effect (Didham, 1997,
Laurance, 1991). Abiotic conditions (air moisture, temperature, light and soil moisture)
appear to stabilize at 50 – 60 metres (Murcia, 1995) from forest edge, while canopy
cover and canopy damage was impacted at least 150 m from the edge of forest
fragment (Laurance, 1991). One temperate study showed that 225 ha forest fragment
represented actually only 23 ha of core area (Burke and Nol, 2000), and study from
North-East Queensland, reported elevated forest disturbance evident up to 500 m inside
fragment margins, although the most striking changes occurred within 200 m of edges.
Another study found kilometer-scale edge effects for forest beetles (Ewers and
Didham, 2008). It is worth to note that 300 ha fragments, can be represented by a
circle with diameter 1955 m, resulting into 71 ha of untouched forest if we consider
500 m edge effect. Our results show that the edge effect could influence birds deeper in
forest fragments, supporting thus previous recommendations for 500 m distance from
forest edge as buffer zones for bird point-counts (Buckland and Handel, 2006).
Sekercioglu (2002) tentatively rejected the microhabitat hypothesis, and
concluded that limited dispersal capabilities of insectivorous birds may be the most
important factor in their sensitivity to fragmentation. However, it is necessary to point
out that he studied dispersion through cleared areas, while our study sites are
surrounded by secondary growths or plantations and never by cleared areas. The New
Guinean birds can be generally considered as sedentary with limited dispersal abilities
(Diamond, 1973), but we were not able to test for limited dispersal hypothesis. Our
observations from surrounding secondary forests (3 km from fragments) show that at
least some of the species are able to wander in less suitable habitats (Tvardikova,
unpubl. data), confirming thus that some of the bird species appear to be able to move
through highly fragmented landscapes, but it is possible that they suffer high mortality
while doing so.
Chapter V
144
Besides insectivorous birds, our surveys failed to confirm presence of some
large frugivorous birds in forest fragments. Frugivorous birds not recorded in forest
fragments were all large-bodied birds (Northern Cassowary Casuarius
unappendiculatus, Purple-tailed Imperial Pigeon Ducula rufigaster, Cinnamon Ground
Dove Gallicolumba rufigula, Victoria Crowned Pigeon Goura victoria, Coroneted
Fruit Dove Ptilinopus coronulatus). Other species had significantly higher abundances
in continuous forest (i.e. Papuan Hornbill Rhyticeros plicatus). None of the frugivores
showed strict preference to measured habitat characteristics, and their presence did not
seem to be determined by differences in number of flowering and fruiting trees and
between sites during the surveys. However, we are not able to reject the possibility that
canopy frugivores were missing due to seasonal movements. They all are good
migrants, and suffer thus less for limited dispersal abilities able to make daily flights
>10 km (Holbrook et al., 2002), following food resources across large areas. Presence
of other smaller nomadic frugivores would however suggest other explanations. Also
hunting for large bodied birds cannot be excluded as a possible explanation, as some
villagers can hunt them on the borders of protected areas or even circumvent the ban.
Restricted forest area in itself could be also responsible for absence of large frugivores.
Mean home range of adult Cassowary is 206 - 213 ha (Moore, 2007), megapodes male
have home range roughly 100 ha (Booth, 1987), and large, canopy frugivores, such
hornbills and fruit pigeons (Ducula, Ptilinopus), are known or suspected to have home
ranges of >100 ha (Corlett, 2009). Ranges can include both primary and secondary
growths, but they are usually limited and located according to suitable nesting sites,
preferably in primary forest. This could make them unlikely to stay in even large forest
fragments. Decline of large-bodied frugivores has been described by some authors
(Wotton and Kelly, 2012), while others did not report significant changes in their
species richness in forest fragments (MacGregor‐Fors and Schondube, 2011). Here we
show that compared to continuous forests, species richness of large frugivorous birds
decreases in forest fragments, while other frugivores did better (e.g. Eclectus Parrot
Eclectus roratus, Brown Cuckoo-Dove Macropygia amboinensis).
In the view of our results, we suggest that microhabitat change influences
insectivorous birds (especially litter cover, canopy openness, and foliage structure)
plays important role in shaping of bird communities. We are not suggesting that these
variables actually determine if birds will be present or absent, only that we identified
measurable variables associated with preferred microhabitats of these birds. The direct
causal factors might be prey availability or foraging efficiency, which are influenced
by vegetation structure. As long as the correlative relationship between an easily
measured variable (such as the density of small saplings or canopy openness) is
Chapter V
145
consistent with a causal factor (such as prey density), measurement of vegetation
structure is useful for describing essential elements of the habitat that must be
maintained for the persistence of terrestrial insectivores.
Forest fragment of 300 ha had the most altered microhabitat conditions, most
likely resulting from edge effect, which was shown to influence vegetation and forest
structure deep in the forest fragments Gehlhausen et al. (2000) – 250m, Laurance
(1991) – 500 m. These changes made the forest unsuitable to some of the most
sensitive bird species. Neither of the larger fragments housed significantly more bird
species. More research comparing foraging success, breeding and movements in both
forest fragments, and altered habitats is needed to reveal the actual mechanisms of the
local extinction of some lowland species in New Guinea.
Papua New Guinea is one of the few countries in the world where customary
ownership of the land, originating in a tribal past, is recognized by the country’s
legislation (West, 2006, Sekhran, 1997), and where forest-dwelling tribal societies
currently own 85 % of the land in the country (Shearman et al., 2008). Unfortunately,
New Guinean communities tend to lack attitudes that favour conservation a priori. We
are not aware of a single large rain forest in Papua New Guinea that has been
successfully protected, and 90 % of communities opt for logging when they have
opportunity to choose between this and conservation (Novotny, 2010). On the other
hand, communities tend to keep a piece of forest as a source of bush-medicine, or other
forest products (the case of 600 and 1200 ha fragment), or with a vision of profitable
ecotourism (the case of our 300 ha fragment). Such forest fragments are sustainable for
long periods even when not profitable, if they represent small percentage of land
belonging to community. We show that such forest can house relatively large numbers
of birds, and size of forest fragment does not have any significant effect when that
fragment is larger than 300 ha. However, forest fragments larger than our study site
(i.e. larger than 1200 ha) would be needed to preserve larger proportion of forest birds.
While conservation of continuous forest does not seem to be sustainable despite
decades of investment into conservation (Novotny, 2010), protection of larger forest
fragments (~ 300 ha) could represent a useful tool, which is also the most achievable at
village base.
Acknowledgements
I am in debt to villagers and local assistants from Ohu, Baiteta, Baitabag and Wanang
for their help with field work and access to their land. I am also thankful to Petr
Klimes, Jimmy Moses and Petr Vlasanek who provided their data, and to Jana
Sykorova who helped with identification of arthropods in food samples. The project
Chapter V
146
was financially supported by the Czech Science Foundation Grant 206/09/0115, Czech
Ministry of Education ME09082, Grant Agency of University of South Bohemia 04-
136/2010/P, US National Science Foundation DEB-0841885, Christensen Fund project
2013-7476407 and was a part of Center of Excellence for Global Study of Biodiversity
and Function of Forest Ecosystems, reg. n. CZ.1.07/2.3.00/20.0064 co-financed by the
European Social Fund and the Czech Republic.
Supplementary material:
Table S1. List of bird species recorded at all sites during all survey, their name codes,
information on habitat requirements, trophic strategies and the categorization into guild
for analyzes. Ca – carnivores, Omn – omnivores, Fr – frugivores, In – insectivores, Ne
– nectarivores. Raptors, swifts and non-forest bird species passing through the sites
were excluded from analyses, and they are marked by asterisk in the list.
References
BÁLDI , A. 1996. Edge effects in tropical versus temperate forest bird communities:
three alternative hypotheses for the explanation of differences. Acta Zoologica
Academiae Scientarum Hungaricae, 42: 163-172.
BARLOW, J., C. A. PERES, L. M. P. HENRIQUES, P. C. STOUFFER and J. M.
WUNDERLE. 2006. The responses of understorey birds to forest fragmentation,
logging and wildfires: An Amazonian synthesis. Biological Conservation, 128:
182-192.
BEEHLER, B. M., T. K. PRATT and D. A. ZIMMERMAN . 1986. Birds of New Guinea,
Princeton University Press.
BELL, H. 1969. Field notes on the birds of the Ok Tedi River drainage, New Guinea.
Emu, 69: 193-211.
BIBBY , C. J., BURGESS, N. D., HILL , D. A., MUSTOE, S. H. 1992. Bird census
techniques, Academic Press, London.
BOOTH, D. 1987. Home Range and Hatching Success of Malleefowl, Leipoa-Ocellata
Gould (Megapodiidae), in Murray Mallee Near Renmark, Sa. Wildlife
Research, 14: 95-104.
BUCKLAND , S. T. and C. HANDEL. 2006. Point-transect surveys for songbirds: robust
methodologies. The Auk, 123: 345-357.
BURKE, D. and E. NOL. 2000. Landscape and fragment size effects on reproductive
success of forest-breeding birds in Ontario. Ecological Applications, 10: 1749-
1761.

Chapter V
147
BURKE, D. M. and E. NOL. 1998. Influence of food abundance, nest-site habitat, and
forest fragmentation on breeding ovenbirds. The Auk: 96-104.
CANADAY , C. 1996. Loss of insectivorous birds along a gradient of human impact in
Amazonia. Biological Conservation, 77: 63-77.
COLWELL, R. K., A. CHAO, N. J. GOTELLI, S.-Y. LIN, C. X. MAO, R. L. CHAZDON and
J. T. LONGINO. 2012. Models and estimators linking individual-based and
sample-based rarefaction, extrapolation, and comparison of assemblages.
Journal of Plant Ecology, 5: 3-21.
CORLETT, R. T. 2009. Seed dispersal distances and plant migration potential in tropical
East Asia. BIOTROPICA, 41: 592-598.
CREAGH, A., J. FAWCETT and D. N. JONES. 2004. Shrub density correlates with
densities of white-browed scrubwrens Sericornis frontalis in three forest types
in southeast Queensland. Corella, 28: 20-21
DIAMOND , J. M. 1973. Distributional Ecology of New Guinea Birds Recent ecological
and biogeographical theories can be tested on the bird communities of New
Guinea. Science, 179: 759-769.
DIDHAM , R. K. 1997. An overview of invertebrate responses to forest fragmentation.
Forests and insects, 13.
DIDHAM , R. K., J. GHAZOUL, N. E. STORK and A. J. DAVIS. 1996. Insects in
fragmented forests: a functional approach. Trends in Ecology & Evolution, 11:
255-260.
EWERS, R.M., and R.K. DIDHAM 2008. Pervasive impact of large-scale edge effects on a beetle community. PNAS 105:5426–5429.
FORD, H. A., G. W. BARRETT, D. A. SAUNDERS and H. F. RECHER. 2001. Why have
birds in the woodlands of Southern Australia declined? Biological
Conservation, 97: 71-88.
FRAZER, G. W., CANHAM , C.D., LERTZMAN, K.P 1999. Gap Light Analyzer (GLA),
Version 2.0. pp. Imaging software to extract canopy structure and gap light
transmission indices from true-colour fisheye photographs, users manual and
program documentation. Institute of Ecosystem Studies, Millbrook, New
York., Burnaby, British Columbia.
FRAZER, G. W., R. A. FOURNIER, J. A. TROFYMOW and R. J. HALL . 2001. A
comparison of digital and film fisheye photography for analysis of forest
canopy structure and gap light transmission. Agricultural and Forest
Meteorology, 109: 249-263.
GEHLHAUSEN, S. M., M. W. SCHWARTZ and C. K. AUGSPURGER. 2000. Vegetation
and microclimatic edge effects in two mixed-mesophytic forest fragments.
Plant Ecology, 147: 21-35.
Chapter V
148
HOLBROOK, K. M., T. B. SMITH and B. D. HARDESTY. 2002. Implications of
long‐distance movements of frugivorous rain forest hornbills. Ecography, 25:
745-749.
HOYO, D. J., J. ELLIOTT, J. SARGATAL and D. A. CHRISTIE (Eds.) (1992-2011)
Handbook of the Birds of the World (vol. 1-16), Barcelona, Spain, Lynx
Editions.
JACKSON, D. A. 1993. Stopping rules in principal components analysis: A comparison
of heuristical and statistical approaches. Ecology, 74: 2204-2214.
KARR, J. R. and K. E. FREEMARK. 1983. Habitat selection and environmental
gradients: dynamics in the" stable" tropics. Ecology: 1481-1494.
KATTAN , H. GUSTAVO, FRANCO and PADU. 2004. Bird diversity along elevational
gradients in the Andes of Colombia: area and mass effects. Global Ecology
and Biogeography, 13: 451-458.
KLEIN, B. C. 1989. Effects of forest fragmentation on dung and carrion beetle
communities in central Amazonia. Ecology, 70: 1715-1725.
KOMAR, O. 2006. Priority Contribution. Ecology and conservation of birds in coffee
plantations: a critical review. Bird Conservation International, 16: 1-23.
LAURANCE, W. F. 1991. Edge effects in tropical forest fragments: application of a
model for the design of nature reserves. Biological Conservation, 57: 205-219.
LEES, A. C. and C. A. PERES. 2010. Habitat and life history determinants of antbird
occurrence in variable sized Amazonian forest fragments. BIOTROPICA, 42:
614-621.
MACGREGOR‐FORS, I. and J. E. SCHONDUBE. 2011. Use of tropical dry forests and
agricultural areas by neotropical bird communities. BIOTROPICA, 43: 365-
370.
MARRA, P. P. and J. REMSEN JR. 1997. Insights into the maintenance of high species
diversity in the Neotropics: habitat selection and foraging behavior in
understory birds of tropical and temperate forests. Ornithological
Monographs: 445-483.
MARSDEN, S. J., C. T. SYMES and A. L. MACK. 2006. The response of a New Guinean
avifauna to conversion of forest to small‐scale agriculture. Ibis, 148: 629-640.
MCALPINE, J. R., R. KEIG and R. FALLS. 1983. Climate of Papua New Guinea. CSIRO
and Australian National University Press, Canberra.
MESTRE, L. A. M., M. COHN-HAFT and M. M. DIAS. 2010. Diet and prey availability
of terrestrial insectivorous birds prone to extinction in amazonian forest
fragments. Brazilian Archives of Biology and Technology, 53: 1371-1381.
Chapter V
149
MITTERMEIER, R. A., N. MYERS, J. B. THOMSEN, G. A. DA FONSECA and S. OLIVIERI .
1998. Biodiversity hotspots and major tropical wilderness areas: approaches to
setting conservation priorities. Conservation Biology, 12: 516-520.
MOORE, L. A. 2007. Population ecology of the southern cassowary Casuarius casuarius
johnsonii, Mission Beach north Queensland. Journal of Ornithology, 148:
357–366.
MURCIA, C. 1995. Edge effects in fragmented forests: implications for conservation.
Trends in Ecology & Evolution, 10: 58-62.
NEWMARK, W. D. 1991. Tropical forest fragmentation and the local extinction of
understory birds in the eastern Usambara Mountains, Tanzania. Conservation
Biology, 5: 67-78.
NOVOTNY, V. 2010. Rain Forest Conservation in a Tribal World: Why Forest Dwellers
Prefer Loggers to Conservationists. Biotropica, 42: 546-549.
PECKOVER, W. S. and L. W. C. FILEWOOD. 1976. Birds of New Guinea and Tropical
Australia, National Library of Australia, Sydney.
POULIN, B. and G. T. LEFEBVRE. 1995. Additional Information on the Use of Tartar
Emetic in Determining the Diet of Tropical Birds. The Condor, 97: 897-902.
R CORE TEAM. 2012. R: A Language and Environment for Statistical Computing. R
Foundation for Statistical Computing, Vienna, Austria, http://www.R-
project.org.
RALPH, C., S. NAGATA and J. RALPH. 1985. Analysis of Droppings to Describe Diets
of Small Birds. Journal of Field Ornithology, 56: 165-174
SEKERCIOGLU, C. 2012. Bird functional diversity and ecosystem services in tropical
forests, agroforests and agricultural areas. Journal of Ornithology, 153: 153-
161.
SEKERCIOGLU, C. H. 2002. Forest fragmentation hits insectivorous birds hard.
Directions in Science, 1: 62-64.
SEKERCIOGLU, C. H., P. R. EHRLICH, G. C. DAILY , D. AYGEN, D. GOEHRING and R.
F. SANDI . 2002. Disappearance of insectivorous birds from tropical forest
fragments. Proceedings of the National Academy of Sciences of the United
States of America, 99: 263-267.
ŞEKERCIOḡLU, Ç. H., P. R. EHRLICH, G. C. DAILY , D. AYGEN, D. GOEHRING and R. F.
SANDÍ . 2002. Disappearance of insectivorous birds from tropical forest
fragments. Proceedings of the National Academy of Sciences, 99: 263-267.
SEKHRAN, N. 1997. Biodiversity on a tightrope: Incentives for rain forest conservation
in Papua New Guinea. In: The political economy of forest management in
Papua New Guinea (FILER, C., ed.). National Research Institute and
Chapter V
150
International Institute for Environment and Development, Port Moresby, Papua
New Guinea.
SHEARMAN, P., J. BRYAN, J. ASH, P. HUNNAM , B. MACKEY and B. LOKES. 2008. The
state of the forests of Papua New Guinea. University of Papua New Guinea
Press, Port Moresby.
STOUFFER, P. C. and R. O. BIERREGAARD JR. 1995. Use of Amazonian forest
fragments by understory insectivorous birds. Ecology, 76: 2429-2445.
STOUFFER, P. C. and R. O. BIERREGAARD. 1995. Use of Amazonian forest fragments
by understory insectivorous birds. Ecology, 76: 2429-2445.
STRATFORD, J. A. and P. C. STOUFFER. 2013. Microhabitat associations of terrestrial
insectivorous birds in Amazonian rainforest and second‐growth forests.
Journal of Field Ornithology, 84: 1-12.
TATNER, P. 1983. The diet of urban Magpies Pica pica. Ibis, 125: 97-107.
TERBORGH, J., S. K. ROBINSON, T. A. PARKER III, C. A. MUNN and N. PIERPONT.
1990. Structure and organization of an Amazonian forest bird community.
Ecological Monographs, 60: 213–238.
TURNER, I. 1996. Species loss in fragments of tropical rain forest: a review of the
evidence. Journal of Applied Ecology: 200-209.
TVARDIKOVA , K. 2010. Bird abundances in primary and secondary growths in Papua
New Guinea: a preliminary assessment. Tropical Conservation Science, 3:
373-388.
WEST, P. 2006. Conservation is our government now: the politics of ecology in Papua
New Guinea, Duke University Press Books.
WOTTON, D. M. and D. KELLY . 2012. Do larger frugivores move seeds further? Body
size, seed dispersal distance, and a case study of a large, sedentary pigeon.
Journal of Biogeography, 39: 1973-1983.
ZANETTE, L, DOYLE, P, TREMONT and M. S. 2000. Food shortage in small fragments :
Evidence from an area-sensitive passerine. Ecology, 81: 1654-1666.
SUPPLEMENTARY MATERIAL
Table S1. List of bird species recorded at all sites during all survey, their name codes, information on
habitat requirements, trophic strategies and the categorization into guild for analyzes. Ca – carnivores,
Omn – omnivores, Fr – frugivores, In – insectivores, Ne – nectarivores. Raptors, swifts and non-forest bird
species passing through the sites were excluded from analyses, and they are marked by asterisk in the list.
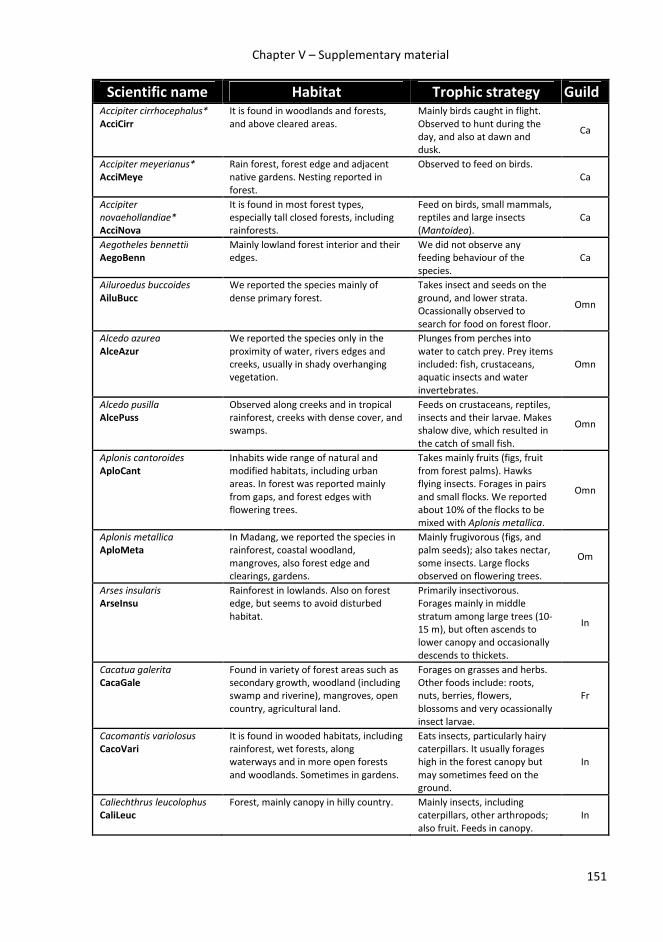
Chapter V – Supplementary material
151
Scientific name Habitat Trophic strategy Guild
Accipiter cirrhocephalus*
AcciCirr
It is found in woodlands and forests,
and above cleared areas.
Mainly birds caught in flight.
Observed to hunt during the
day, and also at dawn and
dusk.
Ca
Accipiter meyerianus*
AcciMeye
Rain forest, forest edge and adjacent
native gardens. Nesting reported in
forest.
Observed to feed on birds.
Ca
Accipiter
novaehollandiae*
AcciNova
It is found in most forest types,
especially tall closed forests, including
rainforests.
Feed on birds, small mammals,
reptiles and large insects
(Mantoidea).
Ca
Aegotheles bennettii
AegoBenn
Mainly lowland forest interior and their
edges.
We did not observe any
feeding behaviour of the
species.
Ca
Ailuroedus buccoides
AiluBucc
We reported the species mainly of
dense primary forest.
Takes insect and seeds on the
ground, and lower strata.
Ocassionally observed to
search for food on forest floor.
Omn
Alcedo azurea
AlceAzur
We reported the species only in the
proximity of water, rivers edges and
creeks, usually in shady overhanging
vegetation.
Plunges from perches into
water to catch prey. Prey items
included: fish, crustaceans,
aquatic insects and water
invertebrates.
Omn
Alcedo pusilla
AlcePuss
Observed along creeks and in tropical
rainforest, creeks with dense cover, and
swamps.
Feeds on crustaceans, reptiles,
insects and their larvae. Makes
shalow dive, which resulted in
the catch of small fish.
Omn
Aplonis cantoroides
AploCant
Inhabits wide range of natural and
modified habitats, including urban
areas. In forest was reported mainly
from gaps, and forest edges with
flowering trees.
Takes mainly fruits (figs, fruit
from forest palms). Hawks
flying insects. Forages in pairs
and small flocks. We reported
about 10% of the flocks to be
mixed with Aplonis metallica.
Omn
Aplonis metallica
AploMeta
In Madang, we reported the species in
rainforest, coastal woodland,
mangroves, also forest edge and
clearings, gardens.
Mainly frugivorous (figs, and
palm seeds); also takes nectar,
some insects. Large flocks
observed on flowering trees.
Om
Arses insularis
ArseInsu
Rainforest in lowlands. Also on forest
edge, but seems to avoid disturbed
habitat.
Primarily insectivorous.
Forages mainly in middle
stratum among large trees (10‐
15 m), but often ascends to
lower canopy and occasionally
descends to thickets.
In
Cacatua galerita
CacaGale
Found in variety of forest areas such as
secondary growth, woodland (including
swamp and riverine), mangroves, open
country, agricultural land.
Forages on grasses and herbs.
Other foods include: roots,
nuts, berries, flowers,
blossoms and very ocassionally
insect larvae.
Fr
Cacomantis variolosus
CacoVari
It is found in wooded habitats, including
rainforest, wet forests, along
waterways and in more open forests
and woodlands. Sometimes in gardens.
Eats insects, particularly hairy
caterpillars. It usually forages
high in the forest canopy but
may sometimes feed on the
ground.
In
Caliechthrus leucolophus
CaliLeuc
Forest, mainly canopy in hilly country. Mainly insects, including
caterpillars, other arthropods;
also fruit. Feeds in canopy.
In
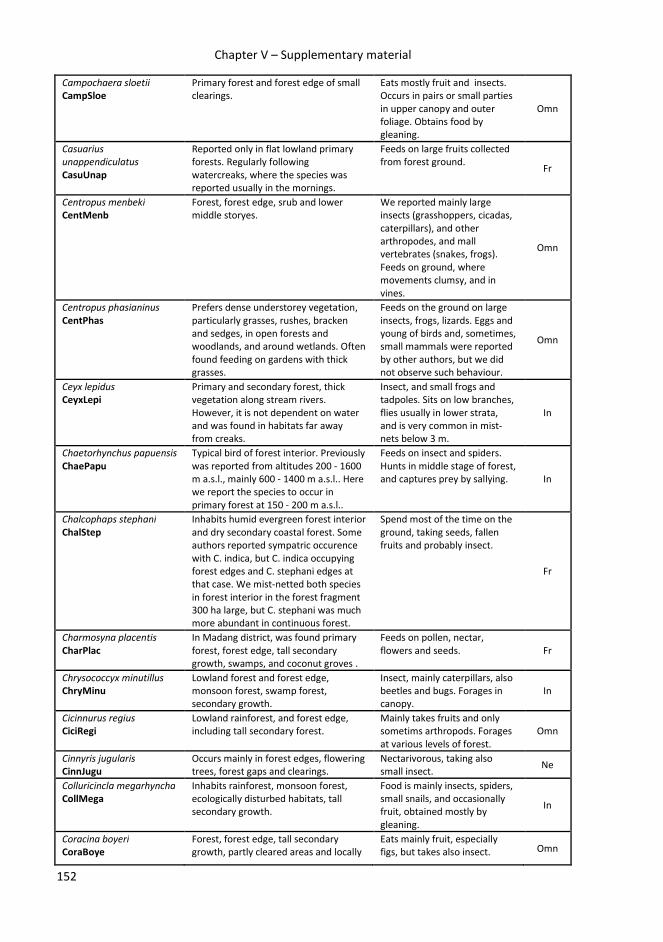
Chapter V – Supplementary material
152
Campochaera sloetii
CampSloe
Primary forest and forest edge of small
clearings.
Eats mostly fruit and insects.
Occurs in pairs or small parties
in upper canopy and outer
foliage. Obtains food by
gleaning.
Omn
Casuarius
unappendiculatus
CasuUnap
Reported only in flat lowland primary
forests. Regularly following
watercreaks, where the species was
reported usually in the mornings.
Feeds on large fruits collected
from forest ground. Fr
Centropus menbeki
CentMenb
Forest, forest edge, srub and lower
middle storyes.
We reported mainly large
insects (grasshoppers, cicadas,
caterpillars), and other
arthropodes, and mall
vertebrates (snakes, frogs).
Feeds on ground, where
movements clumsy, and in
vines.
Omn
Centropus phasianinus
CentPhas
Prefers dense understorey vegetation,
particularly grasses, rushes, bracken
and sedges, in open forests and
woodlands, and around wetlands. Often
found feeding on gardens with thick
grasses.
Feeds on the ground on large
insects, frogs, lizards. Eggs and
young of birds and, sometimes,
small mammals were reported
by other authors, but we did
not observe such behaviour.
Omn
Ceyx lepidus
CeyxLepi
Primary and secondary forest, thick
vegetation along stream rivers.
However, it is not dependent on water
and was found in habitats far away
from creaks.
Insect, and small frogs and
tadpoles. Sits on low branches,
flies usually in lower strata,
and is very common in mist‐
nets below 3 m.
In
Chaetorhynchus papuensis
ChaePapu
Typical bird of forest interior. Previously
was reported from altitudes 200 ‐ 1600
m a.s.l., mainly 600 ‐ 1400 m a.s.l.. Here
we report the species to occur in
primary forest at 150 ‐ 200 m a.s.l..
Feeds on insect and spiders.
Hunts in middle stage of forest,
and captures prey by sallying. In
Chalcophaps stephani
ChalStep
Inhabits humid evergreen forest interior
and dry secondary coastal forest. Some
authors reported sympatric occurence
with C. indica, but C. indica occupying
forest edges and C. stephani edges at
that case. We mist‐netted both species
in forest interior in the forest fragment
300 ha large, but C. stephani was much
more abundant in continuous forest.
Spend most of the time on the
ground, taking seeds, fallen
fruits and probably insect.
Fr
Charmosyna placentis
CharPlac
In Madang district, was found primary
forest, forest edge, tall secondary
growth, swamps, and coconut groves .
Feeds on pollen, nectar,
flowers and seeds. Fr
Chrysococcyx minutillus
ChryMinu
Lowland forest and forest edge,
monsoon forest, swamp forest,
secondary growth.
Insect, mainly caterpillars, also
beetles and bugs. Forages in
canopy.
In
Cicinnurus regius
CiciRegi
Lowland rainforest, and forest edge,
including tall secondary forest.
Mainly takes fruits and only
sometims arthropods. Forages
at various levels of forest.
Omn
Cinnyris jugularis
CinnJugu
Occurs mainly in forest edges, flowering
trees, forest gaps and clearings.
Nectarivorous, taking also
small insect. Ne
Colluricincla megarhyncha
CollMega
Inhabits rainforest, monsoon forest,
ecologically disturbed habitats, tall
secondary growth.
Food is mainly insects, spiders,
small snails, and occasionally
fruit, obtained mostly by
gleaning.
In
Coracina boyeri
CoraBoye
Forest, forest edge, tall secondary
growth, partly cleared areas and locally
Eats mainly fruit, especially
figs, but takes also insect. Omn
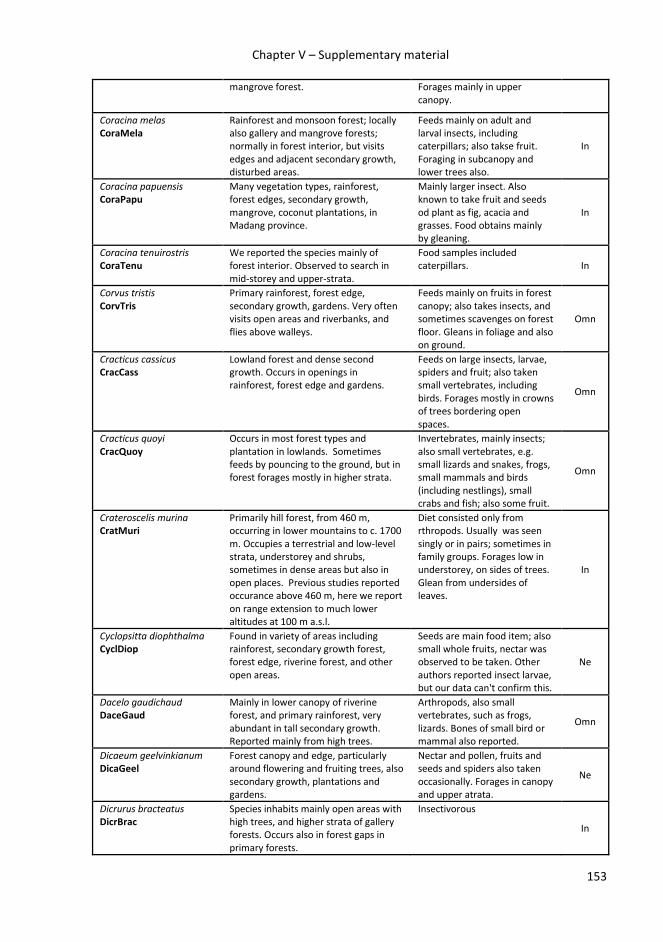
Chapter V – Supplementary material
153
mangrove forest. Forages mainly in upper
canopy.
Coracina melas
CoraMela
Rainforest and monsoon forest; locally
also gallery and mangrove forests;
normally in forest interior, but visits
edges and adjacent secondary growth,
disturbed areas.
Feeds mainly on adult and
larval insects, including
caterpillars; also takse fruit.
Foraging in subcanopy and
lower trees also.
In
Coracina papuensis
CoraPapu
Many vegetation types, rainforest,
forest edges, secondary growth,
mangrove, coconut plantations, in
Madang province.
Mainly larger insect. Also
known to take fruit and seeds
od plant as fig, acacia and
grasses. Food obtains mainly
by gleaning.
In
Coracina tenuirostris
CoraTenu
We reported the species mainly of
forest interior. Observed to search in
mid‐storey and upper‐strata.
Food samples included
caterpillars. In
Corvus tristis
CorvTris
Primary rainforest, forest edge,
secondary growth, gardens. Very often
visits open areas and riverbanks, and
flies above walleys.
Feeds mainly on fruits in forest
canopy; also takes insects, and
sometimes scavenges on forest
floor. Gleans in foliage and also
on ground.
Omn
Cracticus cassicus
CracCass
Lowland forest and dense second
growth. Occurs in openings in
rainforest, forest edge and gardens.
Feeds on large insects, larvae,
spiders and fruit; also taken
small vertebrates, including
birds. Forages mostly in crowns
of trees bordering open
spaces.
Omn
Cracticus quoyi
CracQuoy
Occurs in most forest types and
plantation in lowlands. Sometimes
feeds by pouncing to the ground, but in
forest forages mostly in higher strata.
Invertebrates, mainly insects;
also small vertebrates, e.g.
small lizards and snakes, frogs,
small mammals and birds
(including nestlings), small
crabs and fish; also some fruit.
Omn
Crateroscelis murina
CratMuri
Primarily hill forest, from 460 m,
occurring in lower mountains to c. 1700
m. Occupies a terrestrial and low‐level
strata, understorey and shrubs,
sometimes in dense areas but also in
open places. Previous studies reported
occurance above 460 m, here we report
on range extension to much lower
altitudes at 100 m a.s.l.
Diet consisted only from
rthropods. Usually was seen
singly or in pairs; sometimes in
family groups. Forages low in
understorey, on sides of trees.
Glean from undersides of
leaves.
In
Cyclopsitta diophthalma
CyclDiop
Found in variety of areas including
rainforest, secondary growth forest,
forest edge, riverine forest, and other
open areas.
Seeds are main food item; also
small whole fruits, nectar was
observed to be taken. Other
authors reported insect larvae,
but our data can't confirm this.
Ne
Dacelo gaudichaud
DaceGaud
Mainly in lower canopy of riverine
forest, and primary rainforest, very
abundant in tall secondary growth.
Reported mainly from high trees.
Arthropods, also small
vertebrates, such as frogs,
lizards. Bones of small bird or
mammal also reported.
Omn
Dicaeum geelvinkianum
DicaGeel
Forest canopy and edge, particularly
around flowering and fruiting trees, also
secondary growth, plantations and
gardens.
Nectar and pollen, fruits and
seeds and spiders also taken
occasionally. Forages in canopy
and upper atrata.
Ne
Dicrurus bracteatus
DicrBrac
Species inhabits mainly open areas with
high trees, and higher strata of gallery
forests. Occurs also in forest gaps in
primary forests.
Insectivorous
In

Chapter V – Supplementary material
154
Ducula pinon
DucuPino
Inhabits forest, and partially cleared
areas.
Frugivorous, searching in
canopy. Fr
Ducula rufigaster
DucuRufi
Forest and sometimes forest edge. Frugivorous, the most
important were Arecacea,
Myristicae, Lauraceae. In lower
canopy.
Fr
Ducula zoeae
DucuZoea
Inhabits rain forest. Feeds on various fruits
including Arecaceae,
Lauraceae, Annonaceae and
Moraceae. Feeds in canopy in
small flocks of up to 10 birds.
Fr
Eclectus roratus
EcleRora
Found in wide range of habitats from
forest to secondary growth forest, and
coconut plantations.
Consists of fruits, berries, nuts,
seeds of eucalypts and acacias
in particular; nectar, leaf buds
and blossoms.
Fr
Eudynamys scolopaceus
EudyScol
Forest interiors and only ocassionally
forest edges.
Consuming a variety of insects,
small vertebrates and various
fruits. We reported fruits to be
taken only ocassionally, other
authors identified the species
as omnivorous.
In
Eurystomus orientalis
EuryOrie
Inhabits open wooded areas, with
mature, hollow‐bearing trees suitable
for nesting. Daytime spends pearching
on emergent or dry standing trees in
open ares (gardens, forest gaps).
Feed almost exclusively on
flying insects. They search for
food from a conspicuous perch
and then capture it in skilful
aerial pursuits.
In
Gallicolumba rufigula
GallRufi
Primary rain forest. Diet consists of seeds, fallen
fruits and insect. Considered to
be more insectivorous than C.
indica and C. Stephani.
Fr
Garritornis isidorei
GarrIsid
We recorded the species mainly in
primary forest, and on edges of small
gaps.
Forages mainly by probing bark
and on trunks and branches,
also digs in litter of jungle floor
very often. Diet includes a
range of arthropods; small
reptiles are also taken.
In
Geoffroyus geoffroyi
GeofGeof
Found in primary and secondary
forests, plantations, open woodland,
mangrove and gardens.
Feeds on nectar, seeds, fruit
and blossoms. Ne
Gerygone chloronota
GeryChlo
In dense forests and thickets, mainly in
primary forest and also tall secondary
growths.
Prey includes spiders
(Araneae), cockroach egg sacs
(Blattodea), beetles
(Coleoptera), bugs
(Hemiptera), wasps
(Hymenoptera) and
lepidopteran larvae.
In
Gerygone chrysogaster
GeryChry
Rainforest, secondary growth, monsoon
forest and riparian formations.
Insectivorous, but no details of
prey. In
Goura victoria
GourVict
Occupies swamp and large primary
forests, as well as drier forests, only in
the extreme lowlands.
Diet consists of fallen fruit,
berries and seeds. Occasional
snail and possibly ground‐
dwelling larger insect. Forages
on the forest floor in groups of
two to ten individuals.
Fr
Haliastur indus*
HaliIndu
Terrestrial wetlands and urban areas, in
tropics ranges over forest, farmland and
grasslands. In primary forests reported
mainly along river banks and large
clearings. Nets usually at high tree close
Variety of small animals and
carrion, including mammals,
birds, reptiles, amphibians,
fish, arthropods. Quite often
also domestic poultry.
Ca
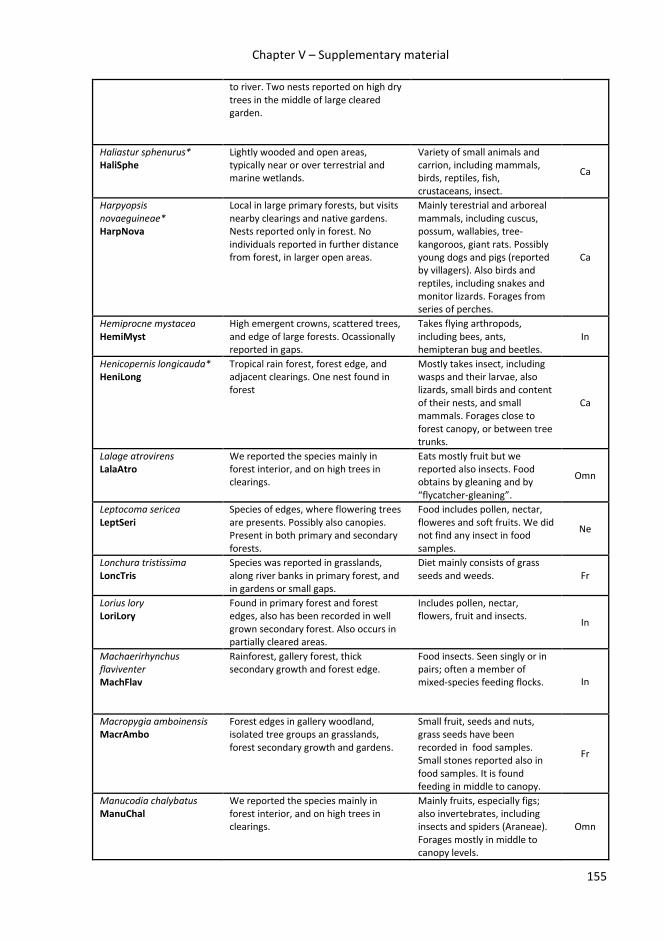
Chapter V – Supplementary material
155
to river. Two nests reported on high dry
trees in the middle of large cleared
garden.
Haliastur sphenurus*
HaliSphe
Lightly wooded and open areas,
typically near or over terrestrial and
marine wetlands.
Variety of small animals and
carrion, including mammals,
birds, reptiles, fish,
crustaceans, insect.
Ca
Harpyopsis
novaeguineae*
HarpNova
Local in large primary forests, but visits
nearby clearings and native gardens.
Nests reported only in forest. No
individuals reported in further distance
from forest, in larger open areas.
Mainly terestrial and arboreal
mammals, including cuscus,
possum, wallabies, tree‐
kangoroos, giant rats. Possibly
young dogs and pigs (reported
by villagers). Also birds and
reptiles, including snakes and
monitor lizards. Forages from
series of perches.
Ca
Hemiprocne mystacea
HemiMyst
High emergent crowns, scattered trees,
and edge of large forests. Ocassionally
reported in gaps.
Takes flying arthropods,
including bees, ants,
hemipteran bug and beetles.
In
Henicopernis longicauda*
HeniLong
Tropical rain forest, forest edge, and
adjacent clearings. One nest found in
forest
Mostly takes insect, including
wasps and their larvae, also
lizards, small birds and content
of their nests, and small
mammals. Forages close to
forest canopy, or between tree
trunks.
Ca
Lalage atrovirens
LalaAtro
We reported the species mainly in
forest interior, and on high trees in
clearings.
Eats mostly fruit but we
reported also insects. Food
obtains by gleaning and by
“flycatcher‐gleaning”.
Omn
Leptocoma sericea
LeptSeri
Species of edges, where flowering trees
are presents. Possibly also canopies.
Present in both primary and secondary
forests.
Food includes pollen, nectar,
floweres and soft fruits. We did
not find any insect in food
samples.
Ne
Lonchura tristissima
LoncTris
Species was reported in grasslands,
along river banks in primary forest, and
in gardens or small gaps.
Diet mainly consists of grass
seeds and weeds. Fr
Lorius lory
LoriLory
Found in primary forest and forest
edges, also has been recorded in well
grown secondary forest. Also occurs in
partially cleared areas.
Includes pollen, nectar,
flowers, fruit and insects. In
Machaerirhynchus
flaviventer
MachFlav
Rainforest, gallery forest, thick
secondary growth and forest edge.
Food insects. Seen singly or in
pairs; often a member of
mixed‐species feeding flocks. In
Macropygia amboinensis
MacrAmbo
Forest edges in gallery woodland,
isolated tree groups an grasslands,
forest secondary growth and gardens.
Small fruit, seeds and nuts,
grass seeds have been
recorded in food samples.
Small stones reported also in
food samples. It is found
feeding in middle to canopy.
Fr
Manucodia chalybatus
ManuChal
We reported the species mainly in
forest interior, and on high trees in
clearings.
Mainly fruits, especially figs;
also invertebrates, including
insects and spiders (Araneae).
Forages mostly in middle to
canopy levels.
Omn

Chapter V – Supplementary material
156
Megapodius decollatus
MegaDeco
Rain forest interior, usually along
riverine flatlands.
Searches for insect in litter,
and high proportion of food is
represents fallen fruits.
Omn
Melanocharis nigra
MelaNigr
Dense vegetation in primary rainforest,
and dense secondary growth. Nests
found usually above 10 ‐ 15 abuve
ground in forest interior, but not dense
shrubs.
Insect. Forages in mid‐storey,
and in lower strata.
In
Meliphaga analoga
MeliAnal
Primary forest and forest edge,
secondary forest, tall secondary growth,
scrub and scrub‐forest, also riparian
and roadside vegetation, in some areas
also coffee plantations, gardens and
garden trees at forest edge.
Diet includes arthropods
(insects), fruit, seeds (probably
ingested with fruit), and nectar
from flowering trees (including
Syzygium). Insect also found in
food samples.
Omn
Meliphaga aruensis
MeliArue
Variety of forest habitats, including
primary rainforest and low plains forest,
also disturbed habitats such as forest
edge, secondary forest and tall or old
regrowth.
Diet includes fruit, seeds
(probably ingested with fruit),
and arthropods (mainly
insects); probably also nectar,
and known to visit
inflorescences of
Poikilospermum and Syzygium.
Mainly in understory, lower
middle story.
Omn
Melidora macrorrhina
MeliMacr
Lower primary and secondary
rainforest, gallery forest, scrub‐forest,
also partly cleared areas, isolated
groups of trees.
Large insect, including stick‐
insect, also frogs. In
Melilestes megarhynchus
MeliMega
Dense vegetation in primary rainforest,
forest edges, tall riparian forest and
secondary growth, and other disturbed
habitats.
Small arthropods, nectar,
occasionally fruit. Forages at all
hights, mainly in lower and
middle storey, less often in
canopy.
In
Microeca flavovirescens
MicrFlav
Mostly in interior of primary forest. Insects including weevils and
other beetles (Coleoptera) and
Hymenoptera.
In
Micropsitta pusio
MicrPusi
Found in many habitats, in canopy of
primary forest or in edges of forest
fragments. Also in clearings with high
trees.
Feeds while gripping upside
down on the sides of tree
trunks, tail braced as a prop.
Takes mostly fruils, nectar but
also insects.
Ne
Mino anais
MinoAnai
Tall primary forest, forest edge and
partially cleared areas, provided that
tall trees still present.
Diet apparently only fruit.
Forages primarily in upper
canopy.
Omn
Mino dumontii
MinoDumo
Forest of various types, including
rainforest, swamp‐forest; also forest
edge and partly cleared areas.
Diet mainly fruit, also insects.
Often feeding on fruit and
berries. Also gleans caterpillars
or hawks insects from high
perches.
Omn
Monarcha chrysomela
MonaChry
Forest, including monsoon forest, hill
forest and gallery forest, usually along
edges, clearings and treefall areas.
Food largely small
invertebrates, including
grasshoppers (Orthoptera).
In
Monarcha frater
MonaFrat
Mainly forest interior, but also forest
edges and secondary forest.
Food items mostly small to
medium‐size invertebrates.
Forages and gleans insects
from within canopy of middle
levels of forest trees.
In
Monarcha guttula
MonaGutt
Interior of primary and secondary
forest; however more common in
primary forest. Secondary growths only
Food items mostly small
invertebrates and larvae.
Search in shrubby and shaded
In
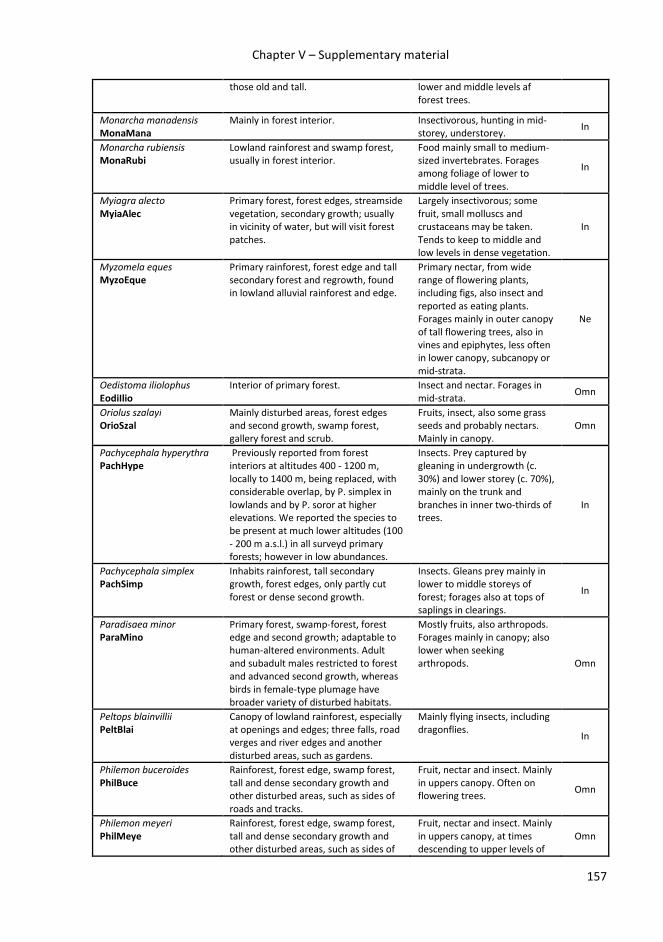
Chapter V – Supplementary material
157
those old and tall. lower and middle levels af
forest trees.
Monarcha manadensis
MonaMana
Mainly in forest interior. Insectivorous, hunting in mid‐
storey, understorey. In
Monarcha rubiensis
MonaRubi
Lowland rainforest and swamp forest,
usually in forest interior.
Food mainly small to medium‐
sized invertebrates. Forages
among foliage of lower to
middle level of trees.
In
Myiagra alecto
MyiaAlec
Primary forest, forest edges, streamside
vegetation, secondary growth; usually
in vicinity of water, but will visit forest
patches.
Largely insectivorous; some
fruit, small molluscs and
crustaceans may be taken.
Tends to keep to middle and
low levels in dense vegetation.
In
Myzomela eques
MyzoEque
Primary rainforest, forest edge and tall
secondary forest and regrowth, found
in lowland alluvial rainforest and edge.
Primary nectar, from wide
range of flowering plants,
including figs, also insect and
reported as eating plants.
Forages mainly in outer canopy
of tall flowering trees, also in
vines and epiphytes, less often
in lower canopy, subcanopy or
mid‐strata.
Ne
Oedistoma iliolophus
EodiIlio
Interior of primary forest. Insect and nectar. Forages in
mid‐strata. Omn
Oriolus szalayi
OrioSzal
Mainly disturbed areas, forest edges
and second growth, swamp forest,
gallery forest and scrub.
Fruits, insect, also some grass
seeds and probably nectars.
Mainly in canopy.
Omn
Pachycephala hyperythra
PachHype
Previously reported from forest
interiors at altitudes 400 ‐ 1200 m,
locally to 1400 m, being replaced, with
considerable overlap, by P. simplex in
lowlands and by P. soror at higher
elevations. We reported the species to
be present at much lower altitudes (100
‐ 200 m a.s.l.) in all surveyd primary
forests; however in low abundances.
Insects. Prey captured by
gleaning in undergrowth (c.
30%) and lower storey (c. 70%),
mainly on the trunk and
branches in inner two‐thirds of
trees.
In
Pachycephala simplex
PachSimp
Inhabits rainforest, tall secondary
growth, forest edges, only partly cut
forest or dense second growth.
Insects. Gleans prey mainly in
lower to middle storeys of
forest; forages also at tops of
saplings in clearings.
In
Paradisaea minor
ParaMino
Primary forest, swamp‐forest, forest
edge and second growth; adaptable to
human‐altered environments. Adult
and subadult males restricted to forest
and advanced second growth, whereas
birds in female‐type plumage have
broader variety of disturbed habitats.
Mostly fruits, also arthropods.
Forages mainly in canopy; also
lower when seeking
arthropods. Omn
Peltops blainvillii
PeltBlai
Canopy of lowland rainforest, especially
at openings and edges; three falls, road
verges and river edges and another
disturbed areas, such as gardens.
Mainly flying insects, including
dragonflies. In
Philemon buceroides
PhilBuce
Rainforest, forest edge, swamp forest,
tall and dense secondary growth and
other disturbed areas, such as sides of
roads and tracks.
Fruit, nectar and insect. Mainly
in uppers canopy. Often on
flowering trees. Omn
Philemon meyeri
PhilMeye
Rainforest, forest edge, swamp forest,
tall and dense secondary growth and
other disturbed areas, such as sides of
Fruit, nectar and insect. Mainly
in uppers canopy, at times
descending to upper levels of
Omn
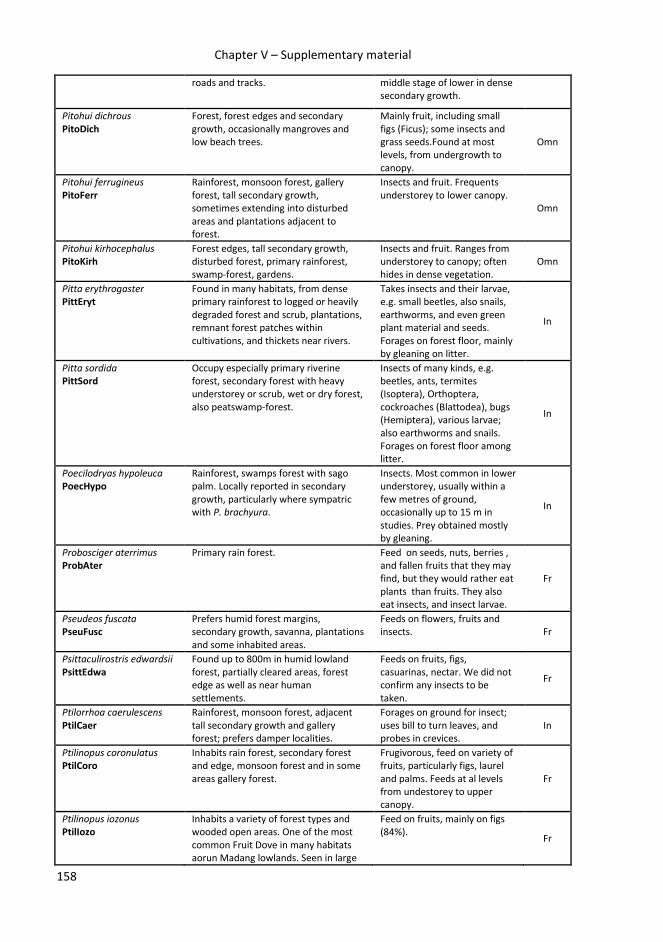
Chapter V – Supplementary material
158
roads and tracks. middle stage of lower in dense
secondary growth.
Pitohui dichrous
PitoDich
Forest, forest edges and secondary
growth, occasionally mangroves and
low beach trees.
Mainly fruit, including small
figs (Ficus); some insects and
grass seeds.Found at most
levels, from undergrowth to
canopy.
Omn
Pitohui ferrugineus
PitoFerr
Rainforest, monsoon forest, gallery
forest, tall secondary growth,
sometimes extending into disturbed
areas and plantations adjacent to
forest.
Insects and fruit. Frequents
understorey to lower canopy.
Omn
Pitohui kirhocephalus
PitoKirh
Forest edges, tall secondary growth,
disturbed forest, primary rainforest,
swamp‐forest, gardens.
Insects and fruit. Ranges from
understorey to canopy; often
hides in dense vegetation.
Omn
Pitta erythrogaster
PittEryt
Found in many habitats, from dense
primary rainforest to logged or heavily
degraded forest and scrub, plantations,
remnant forest patches within
cultivations, and thickets near rivers.
Takes insects and their larvae,
e.g. small beetles, also snails,
earthworms, and even green
plant material and seeds.
Forages on forest floor, mainly
by gleaning on litter.
In
Pitta sordida
PittSord
Occupy especially primary riverine
forest, secondary forest with heavy
understorey or scrub, wet or dry forest,
also peatswamp‐forest.
Insects of many kinds, e.g.
beetles, ants, termites
(Isoptera), Orthoptera,
cockroaches (Blattodea), bugs
(Hemiptera), various larvae;
also earthworms and snails.
Forages on forest floor among
litter.
In
Poecilodryas hypoleuca
PoecHypo
Rainforest, swamps forest with sago
palm. Locally reported in secondary
growth, particularly where sympatric
with P. brachyura.
Insects. Most common in lower
understorey, usually within a
few metres of ground,
occasionally up to 15 m in
studies. Prey obtained mostly
by gleaning.
In
Probosciger aterrimus
ProbAter
Primary rain forest. Feed on seeds, nuts, berries ,
and fallen fruits that they may
find, but they would rather eat
plants than fruits. They also
eat insects, and insect larvae.
Fr
Pseudeos fuscata
PseuFusc
Prefers humid forest margins,
secondary growth, savanna, plantations
and some inhabited areas.
Feeds on flowers, fruits and
insects. Fr
Psittaculirostris edwardsii
PsittEdwa
Found up to 800m in humid lowland
forest, partially cleared areas, forest
edge as well as near human
settlements.
Feeds on fruits, figs,
casuarinas, nectar. We did not
confirm any insects to be
taken.
Fr
Ptilorrhoa caerulescens
PtilCaer
Rainforest, monsoon forest, adjacent
tall secondary growth and gallery
forest; prefers damper localities.
Forages on ground for insect;
uses bill to turn leaves, and
probes in crevices.
In
Ptilinopus coronulatus
PtilCoro
Inhabits rain forest, secondary forest
and edge, monsoon forest and in some
areas gallery forest.
Frugivorous, feed on variety of
fruits, particularly figs, laurel
and palms. Feeds at al levels
from undestorey to upper
canopy.
Fr
Ptilinopus iozonus
PtilIozo
Inhabits a variety of forest types and
wooded open areas. One of the most
common Fruit Dove in many habitats
aorun Madang lowlands. Seen in large
Feed on fruits, mainly on figs
(84%). Fr
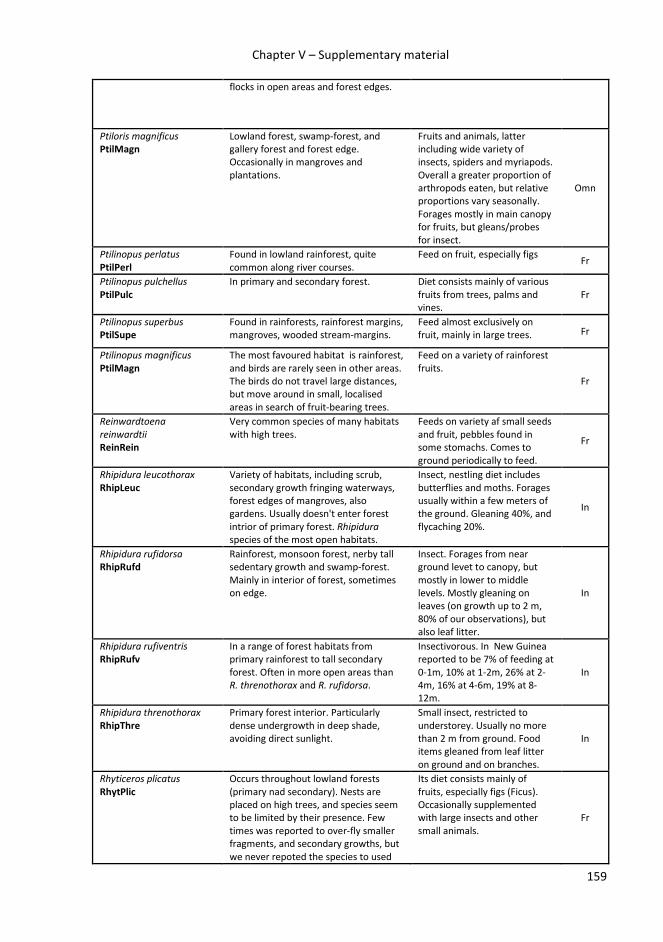
Chapter V – Supplementary material
159
flocks in open areas and forest edges.
Ptiloris magnificus
PtilMagn
Lowland forest, swamp‐forest, and
gallery forest and forest edge.
Occasionally in mangroves and
plantations.
Fruits and animals, latter
including wide variety of
insects, spiders and myriapods.
Overall a greater proportion of
arthropods eaten, but relative
proportions vary seasonally.
Forages mostly in main canopy
for fruits, but gleans/probes
for insect.
Omn
Ptilinopus perlatus
PtilPerl
Found in lowland rainforest, quite
common along river courses.
Feed on fruit, especially figs Fr
Ptilinopus pulchellus
PtilPulc
In primary and secondary forest. Diet consists mainly of various
fruits from trees, palms and
vines.
Fr
Ptilinopus superbus
PtilSupe
Found in rainforests, rainforest margins,
mangroves, wooded stream‐margins.
Feed almost exclusively on
fruit, mainly in large trees. Fr
Ptilinopus magnificus
PtilMagn
The most favoured habitat is rainforest,
and birds are rarely seen in other areas.
The birds do not travel large distances,
but move around in small, localised
areas in search of fruit‐bearing trees.
Feed on a variety of rainforest
fruits.
Fr
Reinwardtoena
reinwardtii
ReinRein
Very common species of many habitats
with high trees.
Feeds on variety af small seeds
and fruit, pebbles found in
some stomachs. Comes to
ground periodically to feed.
Fr
Rhipidura leucothorax
RhipLeuc
Variety of habitats, including scrub,
secondary growth fringing waterways,
forest edges of mangroves, also
gardens. Usually doesn't enter forest
intrior of primary forest. Rhipidura
species of the most open habitats.
Insect, nestling diet includes
butterflies and moths. Forages
usually within a few meters of
the ground. Gleaning 40%, and
flycaching 20%.
In
Rhipidura rufidorsa
RhipRufd
Rainforest, monsoon forest, nerby tall
sedentary growth and swamp‐forest.
Mainly in interior of forest, sometimes
on edge.
Insect. Forages from near
ground levet to canopy, but
mostly in lower to middle
levels. Mostly gleaning on
leaves (on growth up to 2 m,
80% of our observations), but
also leaf litter.
In
Rhipidura rufiventris
RhipRufv
In a range of forest habitats from
primary rainforest to tall secondary
forest. Often in more open areas than
R. threnothorax and R. rufidorsa.
Insectivorous. In New Guinea
reported to be 7% of feeding at
0‐1m, 10% at 1‐2m, 26% at 2‐
4m, 16% at 4‐6m, 19% at 8‐
12m.
In
Rhipidura threnothorax
RhipThre
Primary forest interior. Particularly
dense undergrowth in deep shade,
avoiding direct sunlight.
Small insect, restricted to
understorey. Usually no more
than 2 m from ground. Food
items gleaned from leaf litter
on ground and on branches.
In
Rhyticeros plicatus
RhytPlic
Occurs throughout lowland forests
(primary nad secondary). Nests are
placed on high trees, and species seem
to be limited by their presence. Few
times was reported to over‐fly smaller
fragments, and secondary growths, but
we never repoted the species to used
Its diet consists mainly of
fruits, especially figs (Ficus).
Occasionally supplemented
with large insects and other
small animals.
Fr
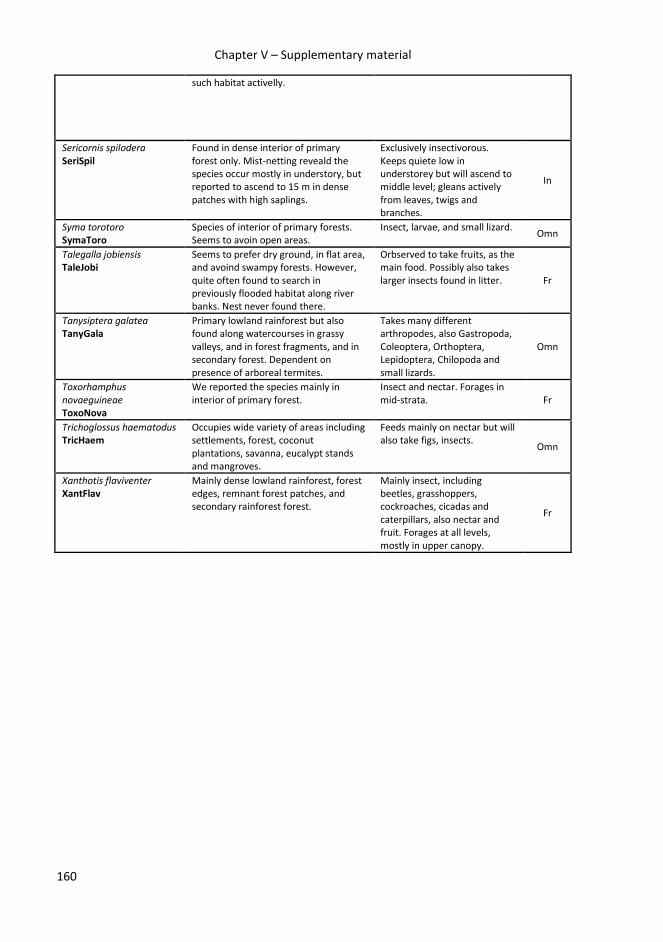
Chapter V – Supplementary material
160
such habitat activelly.
Sericornis spilodera
SeriSpil
Found in dense interior of primary
forest only. Mist‐netting reveald the
species occur mostly in understory, but
reported to ascend to 15 m in dense
patches with high saplings.
Exclusively insectivorous.
Keeps quiete low in
understorey but will ascend to
middle level; gleans actively
from leaves, twigs and
branches.
In
Syma torotoro
SymaToro
Species of interior of primary forests.
Seems to avoin open areas.
Insect, larvae, and small lizard. Omn
Talegalla jobiensis
TaleJobi
Seems to prefer dry ground, in flat area,
and avoind swampy forests. However,
quite often found to search in
previously flooded habitat along river
banks. Nest never found there.
Orbserved to take fruits, as the
main food. Possibly also takes
larger insects found in litter. Fr
Tanysiptera galatea
TanyGala
Primary lowland rainforest but also
found along watercourses in grassy
valleys, and in forest fragments, and in
secondary forest. Dependent on
presence of arboreal termites.
Takes many different
arthropodes, also Gastropoda,
Coleoptera, Orthoptera,
Lepidoptera, Chilopoda and
small lizards.
Omn
Toxorhamphus
novaeguineae
ToxoNova
We reported the species mainly in
interior of primary forest.
Insect and nectar. Forages in
mid‐strata. Fr
Trichoglossus haematodus
TricHaem
Occupies wide variety of areas including
settlements, forest, coconut
plantations, savanna, eucalypt stands
and mangroves.
Feeds mainly on nectar but will
also take figs, insects. Omn
Xanthotis flaviventer
XantFlav
Mainly dense lowland rainforest, forest
edges, remnant forest patches, and
secondary rainforest forest.
Mainly insect, including
beetles, grasshoppers,
cockroaches, cicadas and
caterpillars, also nectar and
fruit. Forages at all levels,
mostly in upper canopy.
Fr
Chapter VI
161
Chapter VI Predation on exposed and leaf-rolling artificial caterpillars in tropical forests
of Papua New Guinea
Katerina Tvardikova, Vojtech Novotny
Journal of Tropical Ecology (2012) 00:1–11

Chapter VI
162

Chapter VI
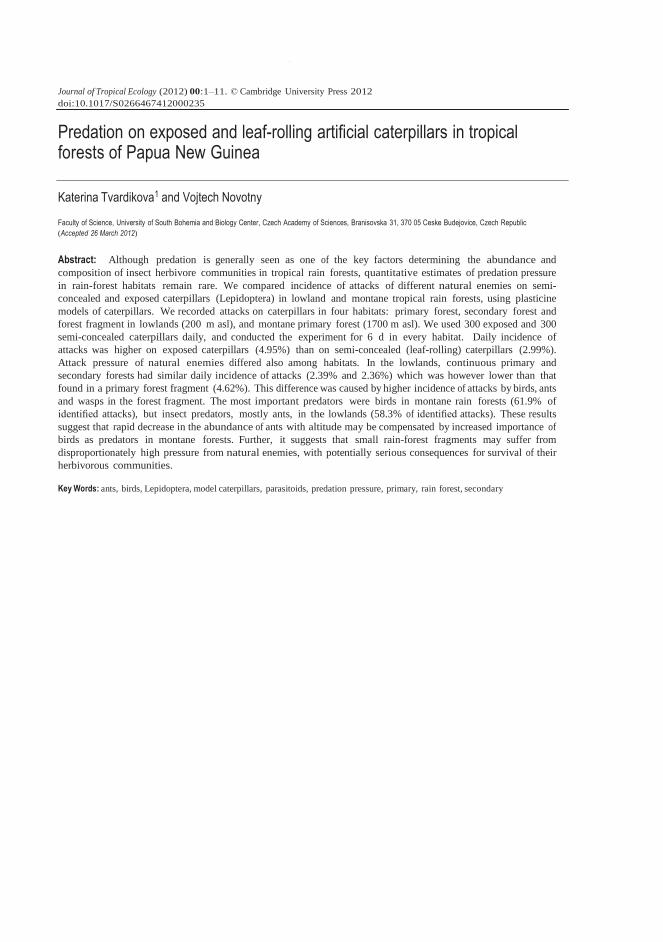
Chapter VI
Journal of Tropical Ecology (2012) 00:1–11. © Cambridge University Press 2012
doi:10.1017/S0266467412000235
Predation on exposed and leaf-rolling artificial caterpillars in tropical forests of Papua New Guinea
Katerina Tvardikova1 and Vojtech Novotny
Faculty of Science, University of South Bohemia and Biology Center, Czech Academy of Sciences, Branisovska 31, 370 05 Ceske Budejovice, Czech Republic
(Accepted 26 March 2012)
Abstract: Although predation is generally seen as one of the key factors determining the abundance and
composition of insect herbivore communities in tropical rain forests, quantitative estimates of predation pressure
in rain-forest habitats remain rare. We compared incidence of attacks of different natural enemies on semi-
concealed and exposed caterpillars (Lepidoptera) in lowland and montane tropical rain forests, using plasticine
models of caterpillars. We recorded attacks on caterpillars in four habitats: primary forest, secondary forest and
forest fragment in lowlands (200 m asl), and montane primary forest (1700 m asl). We used 300 exposed and 300
semi-concealed caterpillars daily, and conducted the experiment for 6 d in every habitat. Daily incidence of
attacks was higher on exposed caterpillars (4.95%) than on semi-concealed (leaf-rolling) caterpillars (2.99%).
Attack pressure of natural enemies differed also among habitats. In the lowlands, continuous primary and
secondary forests had similar daily incidence of attacks (2.39% and 2.36%) which was however lower than that
found in a primary forest fragment (4.62%). This difference was caused by higher incidence of attacks by birds, ants
and wasps in the forest fragment. The most important predators were birds in montane rain forests (61.9% of
identified attacks), but insect predators, mostly ants, in the lowlands (58.3% of identified attacks). These results
suggest that rapid decrease in the abundance of ants with altitude may be compensated by increased importance of
birds as predators in montane forests. Further, it suggests that small rain-forest fragments may suffer from
disproportionately high pressure from natural enemies, with potentially serious consequences for survival of their
herbivorous communities.
Key Words: ants, birds, Lepidoptera, model caterpillars, parasitoids, predation pressure, primary, rain forest, secondary

Summary
175
SUMMARY and APPENDICES
Katerina Tvardikova

176
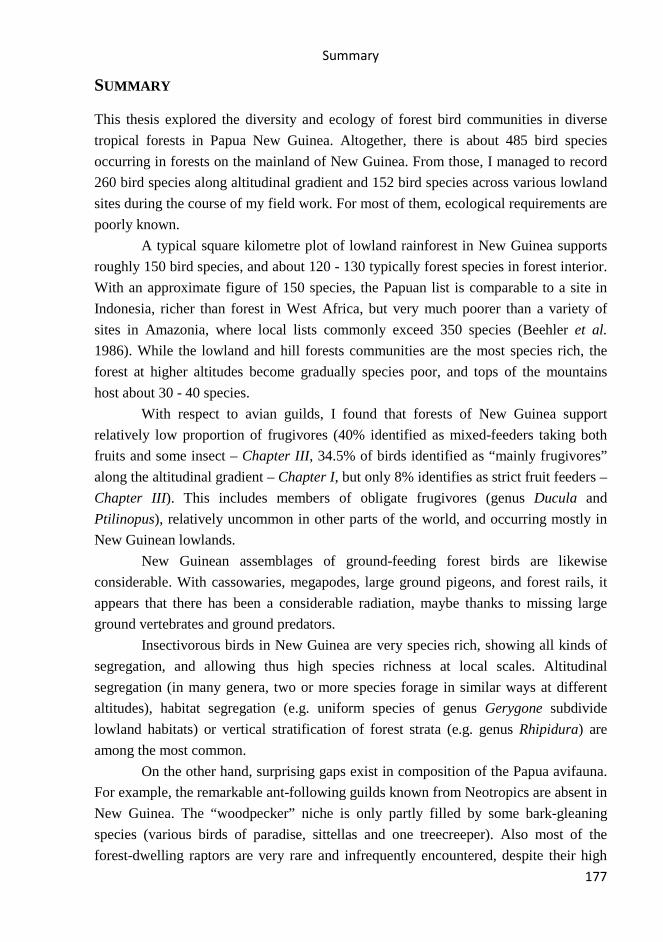
Summary
177
SUMMARY
This thesis explored the diversity and ecology of forest bird communities in diverse
tropical forests in Papua New Guinea. Altogether, there is about 485 bird species
occurring in forests on the mainland of New Guinea. From those, I managed to record
260 bird species along altitudinal gradient and 152 bird species across various lowland
sites during the course of my field work. For most of them, ecological requirements are
poorly known.
A typical square kilometre plot of lowland rainforest in New Guinea supports
roughly 150 bird species, and about 120 - 130 typically forest species in forest interior.
With an approximate figure of 150 species, the Papuan list is comparable to a site in
Indonesia, richer than forest in West Africa, but very much poorer than a variety of
sites in Amazonia, where local lists commonly exceed 350 species (Beehler et al.
1986). While the lowland and hill forests communities are the most species rich, the
forest at higher altitudes become gradually species poor, and tops of the mountains
host about 30 - 40 species.
With respect to avian guilds, I found that forests of New Guinea support
relatively low proportion of frugivores (40% identified as mixed-feeders taking both
fruits and some insect – Chapter III, 34.5% of birds identified as “mainly frugivores”
along the altitudinal gradient – Chapter I, but only 8% identifies as strict fruit feeders –
Chapter III). This includes members of obligate frugivores (genus Ducula and
Ptilinopus), relatively uncommon in other parts of the world, and occurring mostly in
New Guinean lowlands.
New Guinean assemblages of ground-feeding forest birds are likewise
considerable. With cassowaries, megapodes, large ground pigeons, and forest rails, it
appears that there has been a considerable radiation, maybe thanks to missing large
ground vertebrates and ground predators.
Insectivorous birds in New Guinea are very species rich, showing all kinds of
segregation, and allowing thus high species richness at local scales. Altitudinal
segregation (in many genera, two or more species forage in similar ways at different
altitudes), habitat segregation (e.g. uniform species of genus Gerygone subdivide
lowland habitats) or vertical stratification of forest strata (e.g. genus Rhipidura) are
among the most common.
On the other hand, surprising gaps exist in composition of the Papua avifauna.
For example, the remarkable ant-following guilds known from Neotropics are absent in
New Guinea. The “woodpecker” niche is only partly filled by some bark-gleaning
species (various birds of paradise, sittellas and one treecreeper). Also most of the
forest-dwelling raptors are very rare and infrequently encountered, despite their high
Summary
178
species richness (Beehler et al. 1986). Also vultures are absent from New Guinean
avifauna (with the gap partly filled by Brahminy or Whistling Kites occurring in open
areas across studied sites), again thanks to paucity of large terrestrial vertebrates.
In spite of abundance of expeditions conducted over more than two centuries,
there are still birds that are scarcely known in Papua New Guinea, and good-size
regions remain ornithologicaly untouched. Most of the available information and
species lists date back to 1980’s, while ornithological survey slowed down during last
decades. Scarce observations come mainly from birdwatchers. Unlike many other
ornithological expeditions and surveys in the region, I conducted a standardized and
complex survey designed across complete altitudinal gradient (first four studies) and in
various habitats in lowland forests (last two studies). I focused on ecology of birds with
different feeding specializations, and on ecology of insectivorous birds and their food
preferences. This allowed me to describe the food specializations and habitat
preferences for previously poorly known birds.
I provided interesting insights into the factors responsible for patterns of
species richness. I applied rarely used or novel methods to study food preferences of
birds and their predation pressure on herbivores. As such, I provided more detailed
information on the shortcoming of the methods and their use in the field. Many more
detailed studied on birds communities are not part of the thesis and will be published
later. Namely studies on bird community composition, their abundances, and most of
the work relaying on body measurements. Besides the direct analyzes and field work, I
produced also many educational booklets, and one complete internet database (see
Appendices) including information about most of the New Guinean birds. I hope that
those will attract interest of wide public and local people, as well as the thesis will
serve as a determination or inspiration for future studies on New Guinean birds.
MAIN FINDINGS
The first chapter focused on the altitudinal species richness of birds and birds
partitioned into feeding guilds and its drivers. I explored the main environmental
factors that might influence observed patterns: available area, regional species pool,
mid-domain effect, climatic conditions, and habitat characteristics. In agreement with
many other studies, I found the species richness to be the highest in lowlands (133
forest bird species) and decreasing towards to the highest altitudes (37 forest bird
species at the tree line). Beehler (1986) reported mean of 100 bird species at 1,500 m,
75 from 2,500 m, and 25 species from 3,500 m from various site in New Guinea, and
proposed the reduction of available area, decrease in temperature and decrease in tree
height and habitat structural diversity as possible explanations. In comparison to
Summary
179
Beehler, I observed more bird species in higher altitudes of Mt. Wilhelm and identified
habitat complexity as the main driver of observed patterns for all birds, especially for
insectivorous birds. Frugivorous birds followed slightly different pattern of species
richness which correlated strongly with climatic conditions. Overall, habitat
complexity, climatic conditions and regional species pool received the strongest
support as the drivers of altitudinal species richness. On the other hand, area and mid-
domain effect were particularly poor predictors of avian species richness and are thus
unlikely as mechanisms underlying these species richness patterns.
The focus of the second chapter was to describe new range extensions and bird
species previously not recorded in the region of Eastern slopes Mt.Wilhelm. Based on
the field work conducted in 2010 – 2012 and three expeditions along the altitudinal
gradient; I present novel distributional information for 52 bird species. This includes
range extensions, demographic data and altitudinal range shifts. I recorded 29 bird
species with upwards range shifts compared to previously published literature, and
tentatively concluded that upward (but not downward) range extensions and shifts are
probably real, rather than resulting from poor quality of previous information. I also
provided observed altitudinal ranges of all bird species recorded during standardized
survey methods (analyzed in first chapter) and few bird species recorded in addition to
them, or excluded from analyzes in first chapter (i.e. raptors).
In the third chapter, I focused in detail on feeding specializations of birds mist-
netted along the altitudinal gradient. I employed relatively rarely used method of non-
lethal sampling by emetic tartar. I found the method useful and harmless to tested
birds. Overall, I forced 999 birds to regurgitate and my data set comprised 99 species
occurring at 10 different altitudinal sites. I analyzed 739 food samples from 99 bird
species, and identified 3,504 food items (i.e. arthropod individuals, seeds or other plant
materials), from which 2,728 items were arthropods. The information of feeding
preferences was previously unknown for most of the bird species sampled by us. I was
thus able to report and analyze new information about many New Guinean birds. I also
clustered species into feeding guilds based on the obtained datasets, which helped us in
further analyzes. I also pointed some altitudinal trends in food preferences (i.e. bird
taking relatively less arthropods at the highest altitudes than in the lowlands), and
correlation between body sizes of birds and food items.
In the fourth chapter, I studied predation pressure on an artificial arthropod – a
clay caterpillar – along the altitudinal gradient. I focused the study on the two main
predators of arthropods in the tropical forest – birds and ants. The method used in this
study is relatively new, and seems to be useful for studies comparing predation rate of
a given predator between various sites. I used the clay models exposed on leaves with
Summary
180
herbivory and on leaves without herbivory to find out whether birds and ants orient
themselves according to herbivorous damage while searching for food. I completed the
study with survey on abundances of ants and abundances of insectivorous birds
occurring in forest interior (as a part of study in first chapter). I found that clay
caterpillars placed on leaves with mechanical damage are significantly more attractive
for both birds and ants. However, the damaged leaves were more attractive for ants
than for birds. The majority of all recorded attacks on caterpillars were made by ants
(36 % of recorded attacks), and birds (42 %), followed by attacks by unidentified
insects, probably mainly by grasshoppers and crickets (4 %), wasps (4 %), and
parasitoids (1 %). Along the gradient, the number of attacks by birds correlated with
the species richness and abundances of insectivorous birds. The ants caused majority of
attacks in lowlands, but their predation decreased with altitude, and we did not find any
ants and any ant marks on caterpillars above 2700 m asl On the other hand, bird marks
on clay caterpillars were relatively rare at the lowest altitude, and birds only become
more important predators at mid altitudes, where ants were already disappearing.
The fifth chapter focused on bird communities in forest fragments in lowlands.
Lowland bird communities are naturally species rich, but lowland forest in New
Guinea is currently endangered by logging activities, and fragmented at a rapid rate. I
therefore focused on the effect of fragmentation of bird communities. I found that none
of the studied forest fragments housed the same number of species as continuous
forest. However, forest fragments of 300, 600 and 1200 ha housed still more than 80%
of bird species recorded in primary continuous forest, and the difference between
species richness in fragments was not significant. I further identified the most sensitive
bird species between frugivores and insectivores, and their habitat preferences. I also
used non-lethal emetic tartar method (same as in the third chapter) to survey food
taken by six species mist-netted in all fragments, and completed the study by arthropod
sampling. I concluded that food availability doesn’t seem to limit insectivorous birds in
studied fragments. Also microclimate in forest fragments did not differ significantly
from the continuous forest, and was unlikely to influence birds negatively. More
importantly, I found that the sensitive bird species (e.g Monarchidae, Rhipiduridae and
Acanthizidae) foraged preferably in microhabitats that differed from those broadly
available in forest fragments, and were rare in forest fragments. I concluded that
microhabitat influenced insectivorous birds, and that forest structure (especially litter
cover, canopy openness, and foliage structure) plays important role in shaping bird
communities.
In the sixth chapter, I again studied attacks on artificial caterpillars, recorded in
four habitats: primary forest, secondary forest, forest fragment in lowlands (200 m asl),
Summary
181
and montane primary forest (1700 m asl). I compared incidence of attacks of different
natural enemies on semi-concealed and exposed caterpillars. I aimed to find out
whether leaf rolls, folds and ties protect caterpillars from predators, particularly birds,
ants and wasps or whether they serve as cues to predators and thus have negative
effects on survival. We exposed a total of 14 400 caterpillars, and identified 2443
attack attempts. The exposed caterpillars were predated significantly more than the
caterpillars in leaf rolls. The study shows that human disturbance can affect the biotic
interactions between caterpillars and predators. Similarly to the results in fourth
chapter, I show here than birds are relatively more important predators at higher
altitudes, and that birds are compensating for ant disappearance.
In summary, the results of the thesis demonstrated high sensitivity of
insectivorous birds to habitat characteristics, thus their sensitivity to changes in habitat
structure. I show that insectivorous birds are likely to be limited by presence of suitable
microhabitats (both in lowlands and along altitudinal gradient) and forest strata
complexity. Insectivorous birds then tend to disappear from disturbed habitats (or do
not inhabit less complex forest), which results in dramatic changes in trophic
interactions with arthropods, representing their food resources. I also showed that
arthropods are limited by different kinds of predators in different habitats and at
different altitudes.
Reference:
Beehler, B. M., T. K. Pratt, and D. A. Zimmerman. 1986. Birds of New Guinea.
Princeton University Press.
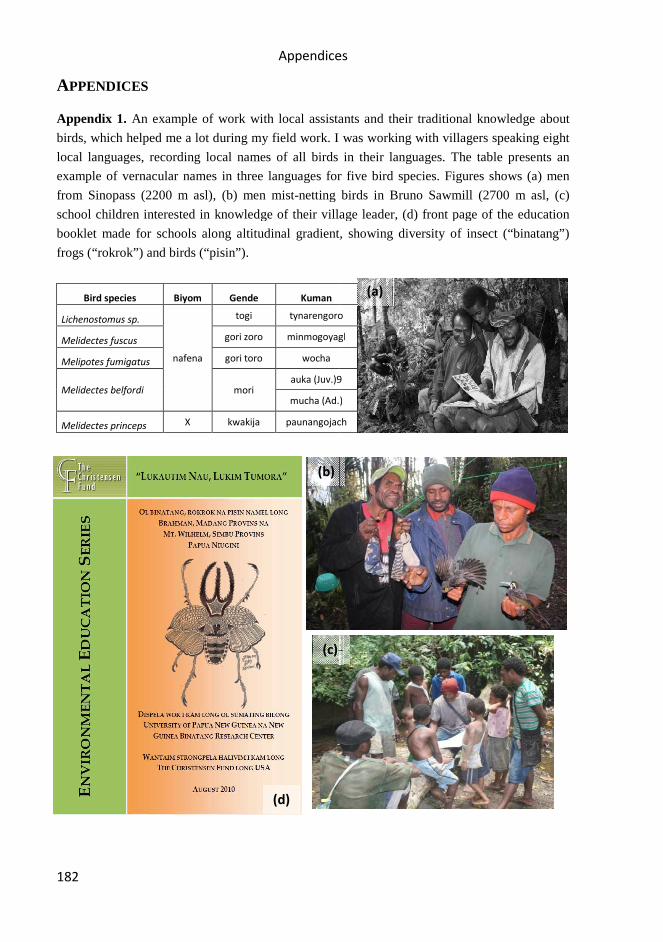
Appendices
182
APPENDICES
Appendix 1. An example of work with local assistants and their traditional knowledge about
birds, which helped me a lot during my field work. I was working with villagers speaking eight
local languages, recording local names of all birds in their languages. The table presents
example of vernacular names in three languages for five bird species.
from Sinopass (2200 m asl), (b) men mist-netting birds in Bruno Sawmill (270
school children interested in knowledge of their village leader, (d) front page of the education
booklet made for schools along altitudinal gradient, showing d
frogs (“rokrok”) and birds (“pisin”).
Bird species Biyom Gende Kuman
Lichenostomus sp.
nafena
togi tynarengoro
Melidectes fuscus gori zoro minmogoyagl
Melipotes fumigatus gori toro wocha
Melidectes belfordi mori auka (Juv.)9
mucha (Ad.)
Melidectes princeps X kwakija paunangojach
(b)
(c)
(d)
Appendices
An example of work with local assistants and their traditional knowledge about
birds, which helped me a lot during my field work. I was working with villagers speaking eight
birds in their languages. The table presents an
vernacular names in three languages for five bird species. Figures shows (a) men
netting birds in Bruno Sawmill (2700 m asl, (c)
knowledge of their village leader, (d) front page of the education
booklet made for schools along altitudinal gradient, showing diversity of insect (“binatang”)
tynarengoro
minmogoyagl
9
mucha (Ad.)
paunangojach
(a)
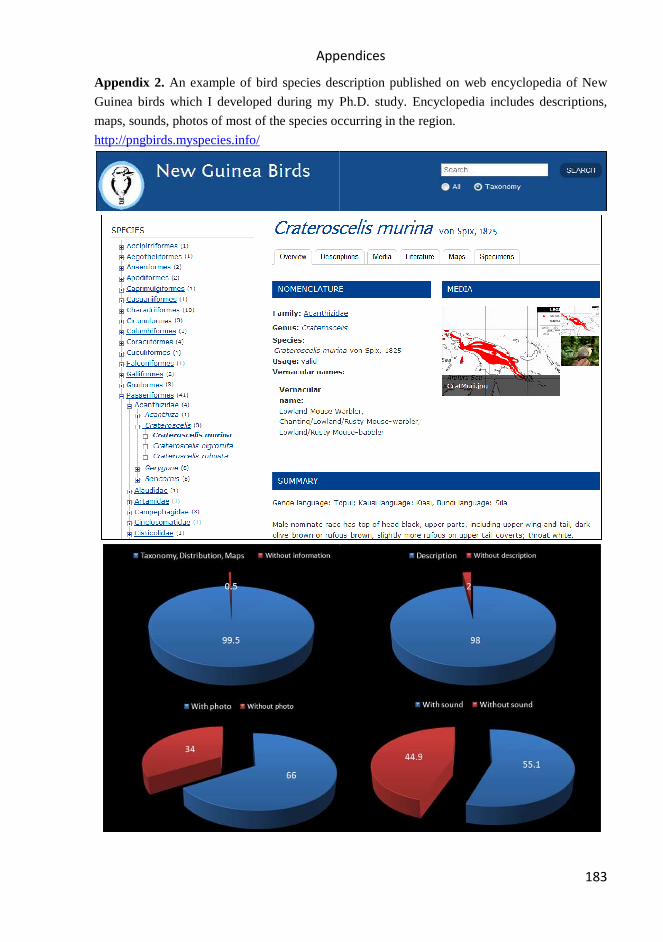
Appendices
Appendix 2. An example of bird species description published on web encyclopedia of New
Guinea birds which I developed during my Ph.D. study. Encyclopedia includes descriptions,
maps, sounds, photos of most of the species occurring in the region.
http://pngbirds.myspecies.info/
Appendices
183
species description published on web encyclopedia of New
Guinea birds which I developed during my Ph.D. study. Encyclopedia includes descriptions,
maps, sounds, photos of most of the species occurring in the region.

Appendices
184
Appendix 3. Examples of attack marks made by natural predators of caterpillars. Full guide
available online: http://tvardikova.weebly.com/downloads.html

185

186
© for non-published parts Kateřina Tvardíková
Trophic relationships between insectivorous birds and insect in Papua New Guinea Ph.D. Thesis Series, 2013, No. 9 All rights reserved For non-commercial use only Printed in the Czech Republic by Vlastimil Johanus Edition of 20 copies University of South Bohemia in České Budějovice Faculty of Science Branišovská 31 CZ-37005 České Budějovice, Czech Republic Phone: +420 387 772 244 www.prf.jcu.cz, e-mail: [email protected]