tropical cyclone report (al052006)
TRANSCRIPT
1
Tropical Cyclone Report Hurricane Ernesto
(AL052006) 24 August – 1 September 2006
Richard D. Knabb and Michelle Mainelli
National Hurricane Center 15 December 2006
Ernesto was briefly a marginal category 1 hurricane (on the Saffir-Simpson Hurricane Scale) over the central Caribbean Sea, and it was a strong tropical storm over the extreme western Atlantic Ocean, including at its final landfall in North Carolina. While impacts from landfalls in Florida and Cuba were limited, the storm produced torrential rainfall and floods in portions of Hispaniola and eastern North Carolina. Gale-force winds and heavy rains associated with Ernesto also impacted portions of Virginia, Maryland, Delaware, and New Jersey. Ernesto was directly responsible for five fatalities in Haiti. a. Synoptic History
Ernesto formed from a tropical wave that emerged from the west coast of Africa on 18 August and moved steadily but uneventfully westward across the tropical Atlantic during the following several days. On 23 August, however, convection associated with the wave increased, and Dvorak satellite classifications from the Tropical Analysis and Forecast Branch (TAFB) of the Tropical Prediction Center/National Hurricane Center (TPC/NHC) began at 1200 UTC, when the wave was located about 500 n mi east of the Lesser Antilles. As the wave approached the Lesser Antilles, a surface low formed near the southern Windward Islands. The system soon acquired enough of a circulation to be designated a tropical depression at 1800 UTC 24 August while centered about 40 n mi north-northwest of Grenada. The “best track” chart of the tropical cyclone’s path is given in Fig. 1, with the wind and pressure histories shown in Figs. 2 and 3, respectively. The best track positions and intensities are listed in Table 1.
Convection increased over the low-level center of the depression as it moved toward the
west-northwest along the southern periphery of a mid-level ridge over the western Atlantic. The cyclone became a tropical storm at 1200 UTC 25 August while centered about 280 n mi south of San Juan, Puerto Rico. Tropical Storm Ernesto gradually turned toward the northwest and continued to intensify as it moved into the central Caribbean Sea on 26 August. The next day at about 0600 UTC, while Ernesto was centered about 70 n mi south of the southern coast of Haiti, it very briefly reached hurricane status with maximum sustained winds of 65 kt and a minimum pressure of about 992 mb. Shortly thereafter, the small inner core of the storm deteriorated and the circulation interacted with the mountainous terrain of Haiti, and Ernesto quickly weakened back to a tropical storm. The center of circulation passed offshore very near the southwestern tip of Haiti at about 0000 UTC 28 August, and by that time the intensity had decreased to 40 kt. Aided by southwesterly shear associated with an upper-level low over the Bahamas, the weakening trend continued early on 28 August as Ernesto moved northwestward toward Cuba.

2
The storm had maximum sustained winds of 35 kt as its center made landfall along the southeastern coast of Cuba, near Playa Cazonal and just west of Guantanamo Bay, at 1115 UTC 28 August. Ernesto turned northwestward and its center remained inland over Cuba for about 18 hours, but it remained a tropical storm with an intensity of 35 kt during that time. The center emerged off the north-central coast of Cuba by 0600 UTC 29 August and the intensity increased slightly to 40 kt. A mid-level high pressure area over the southeastern United States was migrating eastward during this period, allowing Ernesto to continue northwestward. The storm began to traverse the warm waters of the Straits of Florida late on 29 August, and convection gradually increased. Apparently still hindered by disruption of the inner core over Cuba, and possibly influenced by moderate easterly wind shear, Ernesto did not gain any strength between Cuba and southern Florida. Ernesto made landfall at Plantation Key, Florida, in the upper Florida Keys, around 0300 UTC 30 August. A short time later, around 0500 UTC, a second Florida landfall occurred on the Florida mainland in southwestern Miami-Dade County. At both landfalls Ernesto had maximum sustained winds of 40 kt and a minimum central pressure of 1003 mb. Thereafter, Ernesto weakened only slightly, and it remained a tropical storm with maximum sustained winds of 35 kt throughout the remainder of its path over Florida. The storm moved northward along the center of the Florida peninsula and within a weakness in the mid-level ridge, and the cyclone passed over Lake Okeechobee around 1800 UTC 30 August. Ernesto gradually turned north-northeastward, and its center emerged over the Atlantic Ocean near Cape Canaveral, Florida very early on 31 August.
Fueled by the warm waters of the Atlantic, convection increased over the center of the cyclone, and Ernesto intensified to a strong tropical storm as it continued north-northeastward ahead of a deep layer trough approaching from the west. It reached an intensity of 60 kt by 1800 UTC 31 August while centered about 150 n mi south-southwest of Wilmington, North Carolina. The central pressure continued to gradually fall and an eye was becoming discernible in satellite imagery as the storm center approached the coast. The center came ashore at 0340 UTC 1 September on Oak Island, North Carolina, a few miles south-southwest of Wilmington and just west of Cape Fear. At the time of final landfall, Ernesto was very near the threshold between tropical storm and hurricane status, with an intensity of 60 kt and a minimum pressure of 985 mb. Thereafter, Ernesto weakened as it moved across eastern North Carolina where it became a tropical depression by 1200 UTC 1 September. Even before Ernesto made final landfall, however, it combined with a high pressure system centered over southeastern Canada to indirectly produce gale-force winds near the coasts of Virginia, Maryland, Delaware, and New Jersey. Ernesto reached the North Carolina/Virginia border at about 1800 UTC 1 September, although by that time it had transformed into an extratropical cyclone, as it interacted with a pre-existing frontal zone that extended eastward from Virginia. The intensity of Ernesto as an extratropical cyclone as it moved slowly northward over Virginia and Maryland on 2 September is estimated at 40 kt. By 1800 UTC that day, extratropical Ernesto was centered very near Washington, D.C., and after that time the system began to weaken. On 3 September, it was no longer producing gale-force winds as it accelerated across Pennsylvania and New York into
3
southeastern Canada, and it was absorbed into a larger extratropical low pressure system the next day. b. Meteorological Statistics
Observations in Ernesto (Figs. 2 and 3) include data from satellites, aircraft, airborne and ground-based radars, conventional land-based surface and upper-air observing sites, Coastal-Marine Automated Network (C-MAN) stations, National Ocean Service (NOS) stations, ocean data buoys, and ships. Selected ship reports of winds of tropical storm force associated with Ernesto are given in Table 2, and selected surface observations from land stations and from coastal data buoys are given in Table 3.
Satellite observations include geostationary satellite-based Dvorak Technique intensity
estimates from TAFB, the Satellite Analysis Branch (SAB), and the U. S. Air Force Weather Agency (AFWA). Microwave satellite data and imagery from National Oceanic and Atmospheric Administration (NOAA) near-polar-orbiting satellites, Defense Meteorological Satellite Program (DMSP) satellites, and National Aeronautics and Space Administration (NASA) satellites including the Tropical Rainfall Measuring Mission (TRMM), QuikSCAT, and Aqua, were also useful in tracking Ernesto.
Aircraft reconnaissance missions were tasked on an almost continuous schedule, from the genesis of Ernesto until its final landfall, except for periods when the cyclone was over the landmasses of Cuba and Florida. Observations from aircraft include flight-level and dropwindsonde data from 13 operational missions conducted by the 53rd Weather Reconnaissance Squadron of the U. S. Air Force Reserve Command. Two missions were flown by the NOAA Aircraft Operations Center (AOC) Hurricane Hunter WP-3D aircraft, which provided real-time data from the Stepped-Frequency Microwave Radiometer (SFMR).
NWS WSR-88D Doppler radars in coastal regions of the southeastern United States
provided data for center fixes on Ernesto. NWS WSR-88D velocity data were used to help estimate the intensity of Ernesto when it was near or over land.
Ernesto was briefly near the threshold between tropical storm and hurricane strength over
the central Caribbean Sea early on 27 August. Flight-level and dropwindsonde observations from a U. S. Air Force reconnaissance aircraft were available during this period, but NOAA aircraft equipped with the SFMR did not investigate Ernesto over the Caribbean Sea. A dropsonde at 0832 UTC provided a surface wind estimate, derived from the mean wind over the lowest 150 m of the sounding (labeled ‘LLM’ in Fig. 2), of 56 kt. This dropsonde also directly measured a wind speed of 64 kt at 10 m, but post-storm analysis of the vertical profile suggests that this single observation was more likely a gust and not representative of the maximum sustained surface wind. The strongest flight-level wind measurement that day was 78 kt at 0732 UTC, corresponding to about 62 kt at the surface using the average adjustment from 850 mb. One hour later at 0834 UTC, the aircraft measured a flight-level wind of 69 kt at 700 mb, which also corresponds to about 62 kt at the surface. Given our inability to sample the entire circulation, somewhat stronger winds could be expected to have occurred elsewhere during this
4
period and would be consistent with the operational estimate of Ernesto briefly having 65 kt winds near 0600 UTC 27 August. The hurricane-force winds would likely have occurred only in a very small area near the center.
Ernesto is estimated to have made landfall in the Florida Keys and the southern Florida
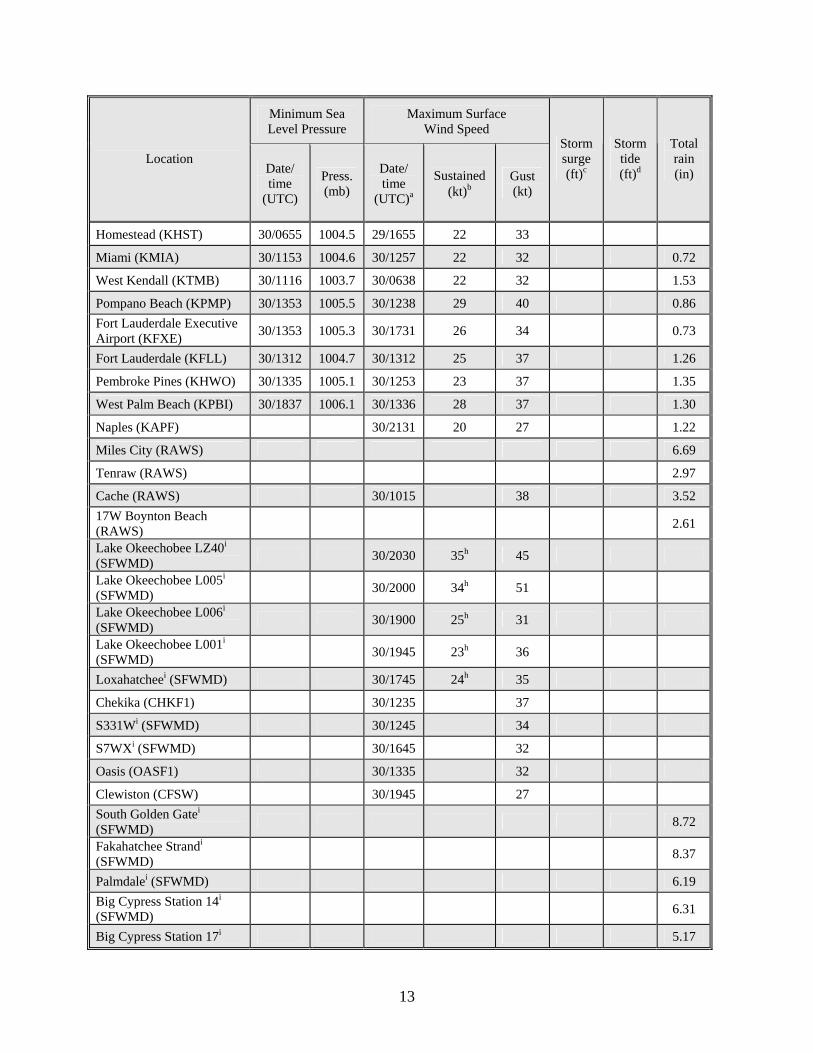
peninsula with an intensity of 40 kt based on aircraft data. The strongest sustained surface wind measured in Florida was 35 kt on Lake Okeechobee, by an instrument operated by the South Florida Water Management District (SFWMD), at 2030 UTC 30 August (Table 3). The Lake Worth C-MAN station, on the Atlantic coast in Palm Beach County, also reported a sustained wind of 35 kt that day. Since both of these SFWMD observations were 15-minute averages, the 1-minute sustained wind at these locations could have been stronger, but no other data were available to confirm this. These data provide supporting evidence that Ernesto remained a tropical storm throughout its entire path over Florida, although the only areas to receive sustained winds of tropical storm force were near or over water.
Ernesto was again near the threshold between tropical storm and hurricane status before
and at the time of landfall in North Carolina. The strongest flight-level (850-mb) wind on 31 August was 73 kt at 1947 UTC, corresponding to about 58 kt at the surface. The SFMR estimated 60–65 kt near 1800 UTC, but the higher end of this range results from isolated peak values that appear slightly inflated by rain and therefore are not considered representative of the maximum sustained surface wind. Radar velocities measured from the WSR-88D at Wilmington, North Carolina reached 80–84 kt at an altitude of 1500 ft just west of the circulation center less than three hours prior to landfall, corresponding to about 60–63 kt at the surface, but the highest values were associated with a transient, mesoscale feature. Fig. 4 is a WSR-88D radar reflectivity depiction of Ernesto at about that same time. The aircraft and radar data reveal no wind observations corresponding to sustained surface winds of 64 kt or greater during the several hours prior to and including final landfall of the center, and the best track intensity during that period is set to 60 kt. Since it is possible, however, that the maximum wind was not sampled, Ernesto might have reached hurricane strength near North Carolina.
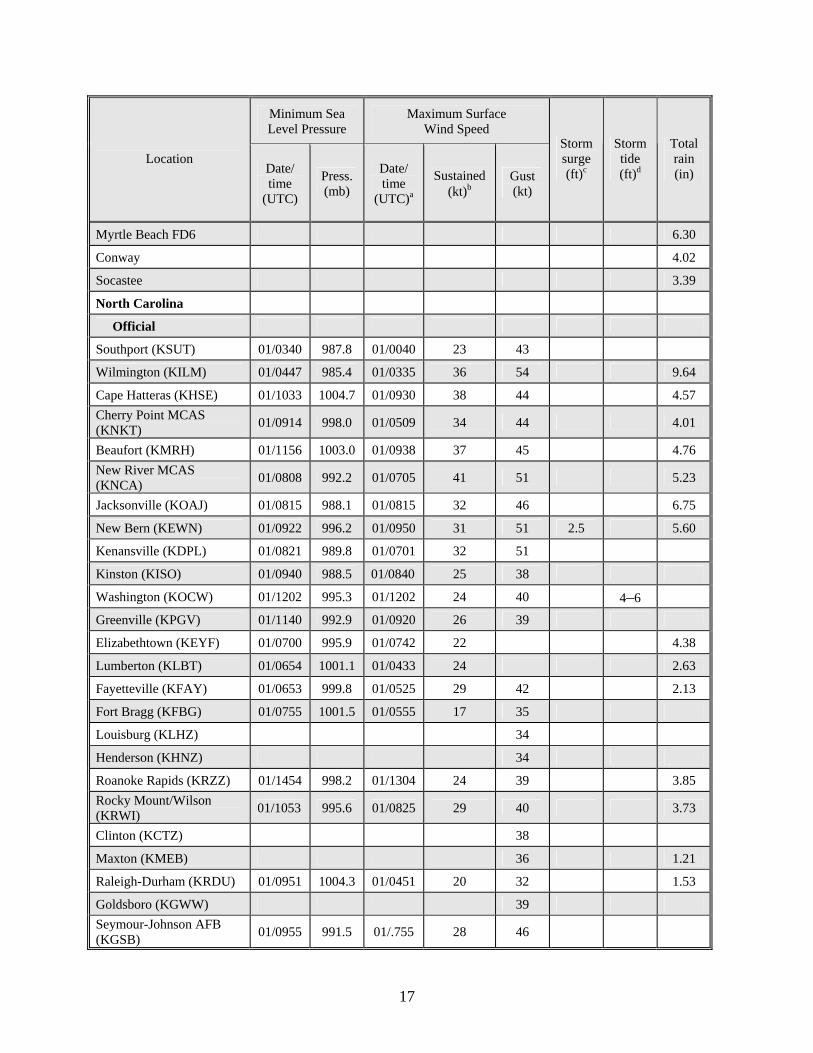
The lowest central pressure of 985 mb occurred near the time of final landfall as
indicated by a surface observation of 985.4 mb at Wilmington. The central pressure remained relatively low as Ernesto proceeded inland. For example, a pressure of 988.5 mb was measured at Kinston, North Carolina, located about 90 n mi inland from the center’s landfall location, at 0940 UTC 1 September or about six hours following landfall. The strongest sustained wind measured by an official surface-based anemometer in North Carolina was 50 kt at the NOS station at Wrightsville Beach (Johnny Mercer Pier), where a gust to 64 kt was also reported. An unofficial gust to 79 kt was reported at Cedar Island (just northeast of Cape Lookout). Based on gage data, the storm surge produced by Ernesto was as high as about 3 ft (e.g., 2.9 ft at Wrightsville Beach NOS), although a total water rise (storm tide) of about 6 ft was reported in a few locations. The surge affected a long stretch of the North Carolina coastline, including in bays, harbors, and rivers adjacent to Pamlico Sound as far north as Dare County (north of Cape Hatteras) (Table 3).
A large area of high pressure centered over southeastern Canada combined with the
approaching Ernesto, even prior to its landfall, to produce sustained gale-force winds and some

5
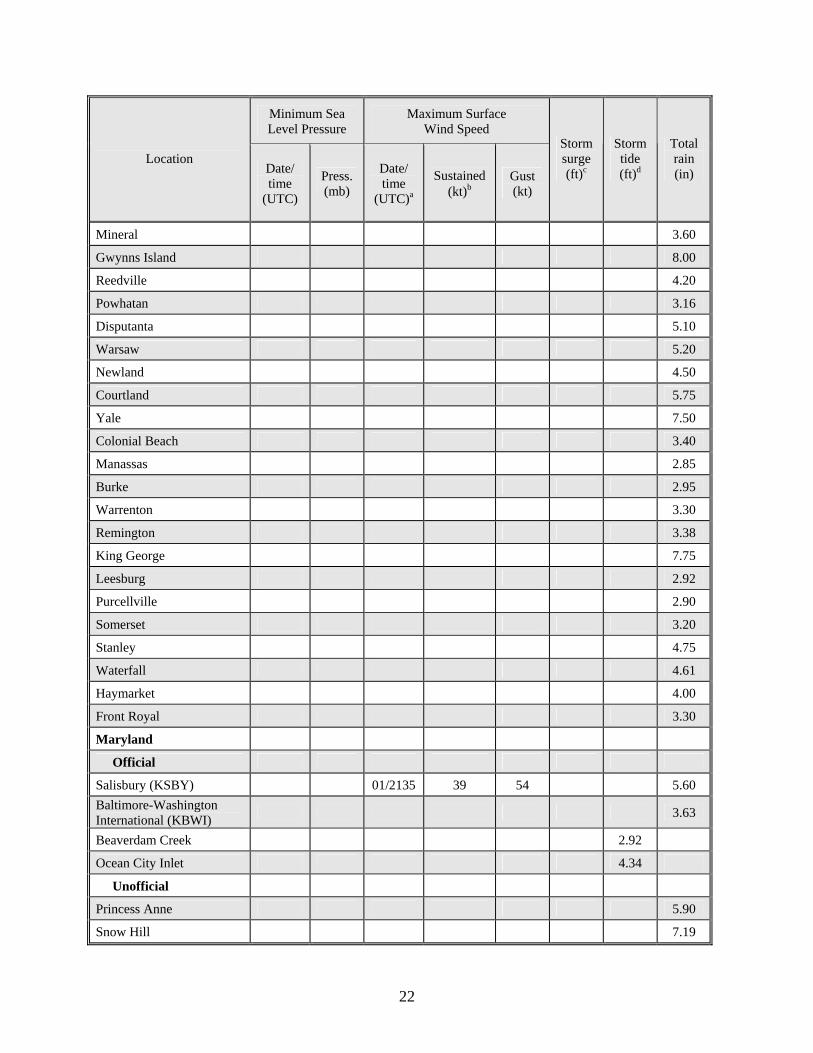
rather heavy rains over and near the coasts of Virginia, Maryland, Delaware, and New Jersey (Table 3). Those winds were indirectly related to Ernesto and are therefore not reflected in the best track intensity. As the extratropical remnant of Ernesto moved slowly over eastern Virginia and Maryland late on 1 September and on the following day, it was directly responsible for the gale-force winds in those areas. The intensity of 40 kt for extratropical Ernesto during that period is based on several surface observations near the coast that were directly involved in the cyclonic circulation. This complex series of events resulted in some storm surge flooding along the western shores of Chesapeake Bay and the adjacent rivers, where storm tides of up to about 6 ft were reported.
Ernesto, its extratropical remnant, and the combination of Ernesto and the high pressure
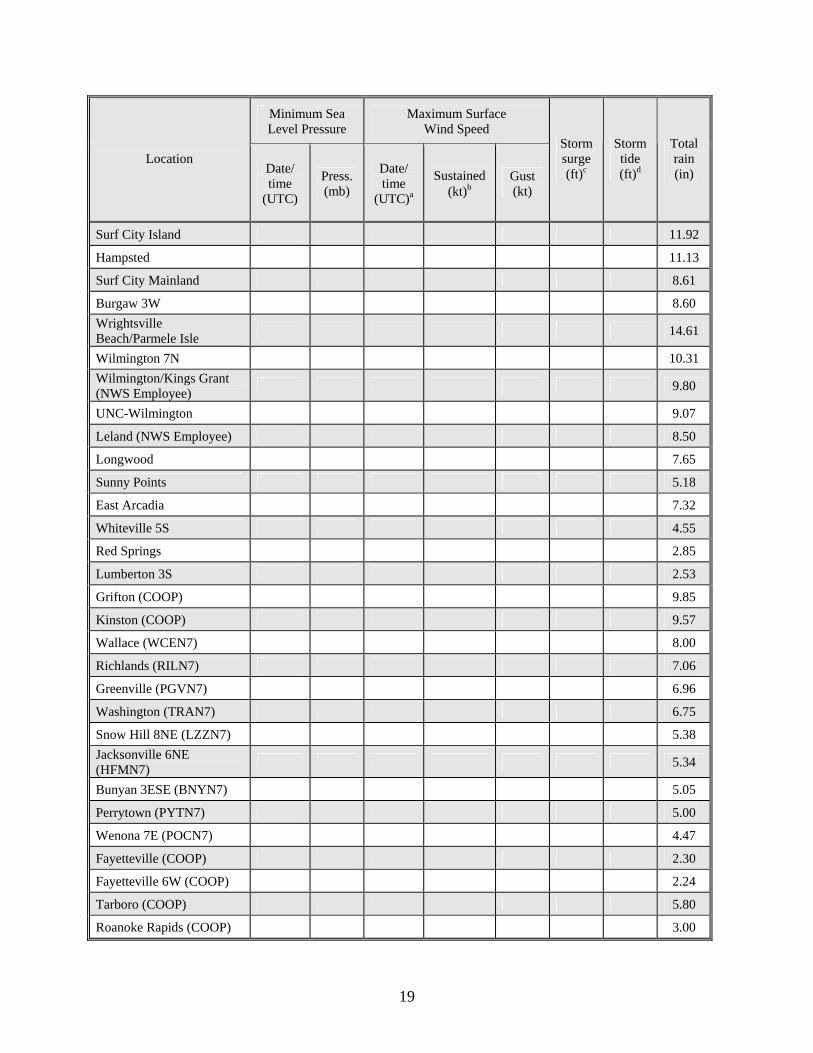
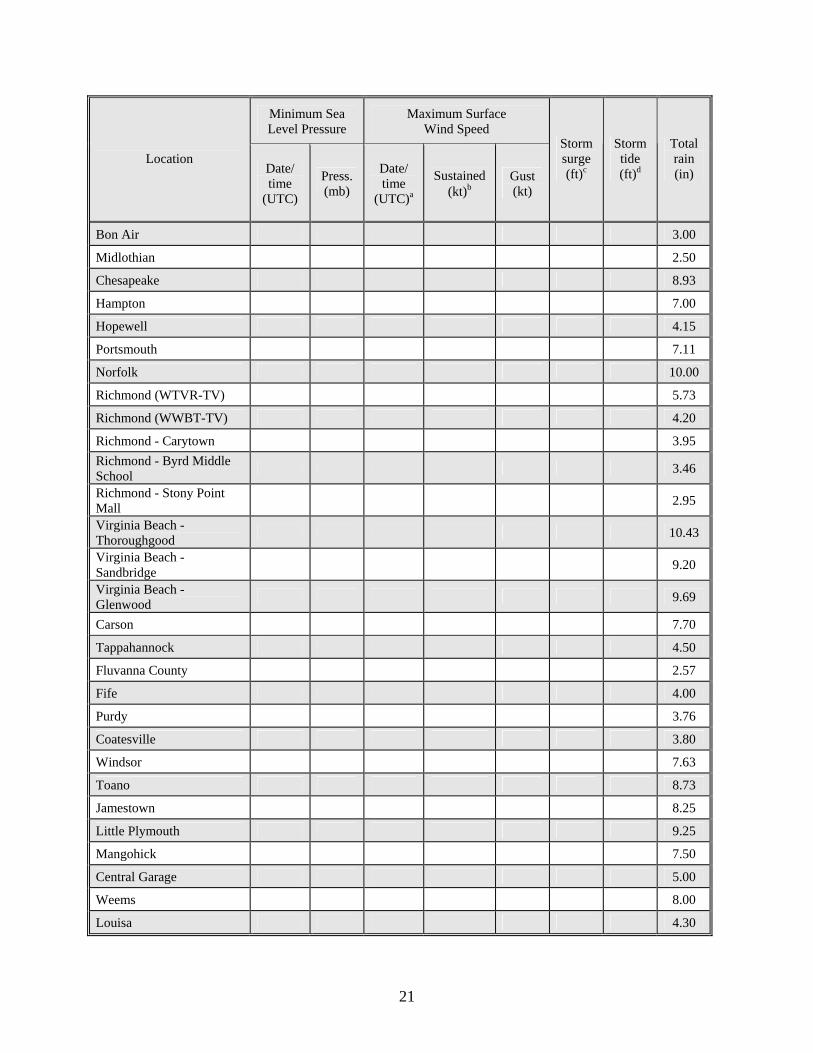
system to its north resulted in significant rainfall over the mid-Atlantic coastal regions of the United States. The storm also produced some large rainfall amounts over portions of Florida and the Greater Antilles (Table 3 and Fig. 5). Storm-total rainfall amounts exceeded 5 in throughout a broad swath across eastern portions of South Carolina, North Carolina, and Virginia, as well as southern Maryland. More than 10 in of rain fell in several locations in North Carolina and Virginia, including a maximum of 14.61 in at Wrightsville Beach, North Carolina. The heavy rains also led to river flooding for several days after Ernesto’s landfall. In particular, the Northeast Cape Fear River crested at 18.8 ft at Chinquapin, well north of Wilmington, and remained in major flood stage during 2–7 September. The large metropolitan areas of southeastern Florida escaped with no more than an inch or two of rain from Ernesto. The storm dropped 3–6 in of rain, however, in many areas near the path of the storm’s center, from the Cape Canaveral area to Lake Okeechobee, in portions of southwestern Florida, and in isolated spots in the Upper Florida Keys. A storm-total maximum of 8.72 in was reported at the South Golden Gate Estates SFWMD station located in Collier County east of Naples. In the Caribbean, 3–5 in of rain were common over much of eastern Cuba as Ernesto moved over the island, with a maximum of 7.46 in reported at Nuevitas in the province of Camaguey. About 7 in of rain fell at Barahona, Dominican Republic as the center of Ernesto passed to the southwest (Table 3).
A total of five weak tornadoes have been reported in association with Ernesto. Two of
these touched down in Osceola County in central Florida on the afternoon of 30 August, and the other three were reported in eastern North Carolina on the evening of 31 August. c. Casualty and Damage Statistics Ernesto was directly responsible for five fatalities reported in Haiti. Two deaths also occurred in Virginia when a tree fell on a residence in Gloucester, although these were not associated with Ernesto as a tropical cyclone. Ernesto was associated with damages in Haiti, the Dominican Republic, and coastal regions of the eastern United States. Most of the damages were caused by fresh water floods and storm surge, but some wind damage was also reported. The estimate of insured losses in the United States caused by Ernesto, provided by the Property Claim Services of the Insurance Services Office, is $245 million. Accounting for uninsured losses by doubling this amount yields an estimated total U. S. damage cost of $500 million.

6
In eastern North Carolina, heavy rains resulted in the flooding of several homes, and other homes were damaged by strong winds. For days following landfall, rain-induced river floods inundated several homes, such as in Chinquapin along the Northeast Cape Fear River north of Wilmington. Storm surge caused minor coastal flooding and beach erosion along the immediate Atlantic coastline. The surge along bays and rivers, such as the Pamlico and Pungo Rivers in Beaufort County and Collington Harbor in Dare County, flooded several homes and businesses. Minor property damages were caused by the three tornadoes in eastern North Carolina. In Virginia, storm surge along the western shores of the Chesapeake Bay and into tidal sections of adjacent rivers flooded several homes, and some piers and boats were significantly damaged. Strong winds downed trees and power lines in coastal areas of North Carolina, Virginia, Delaware, and New Jersey. Ernesto’s heavy rains in southwestern Florida caused flood waters to enter at least 13 homes in Palmdale, located a few miles west of Lake Okeechobee in Glades County. Ernesto caused mud slides and flooded many residences across the mountainous terrain of Hispaniola. At least six homes were destroyed and dozens more were damaged in Haiti, and a bridge was destroyed in Port-au-Prince. More than 400 homes were flooded in the city of Santo Domingo, Dominican Republic. Only minor damage was reported in Cuba. d. Forecast and Warning Critique
The genesis of Ernesto was anticipated very well in Tropical Weather Outlook products
(TWOs) issued by the NHC. The incipient tropical wave was first mentioned in the TWO in the 11:30 am EDT issuance on 22 August, and the possibility of some slow development was indicated. Beginning at 10:30 pm EDT 22 August, more than 39 hours prior to the formation of a tropical depression, the TWO conveyed that the system had the potential to become a tropical cyclone within the next day or two.
A verification of official and guidance model track forecasts is given in Table 4. Average
official track errors for Ernesto were 27, 47, 72, 102, 160, 260, and 415 n mi for the 12, 24, 36, 48, 72, 96, and 120 h forecasts, respectively. The number of verified forecasts ranged from 30 at 12 h to 12 at 120 h. These errors through 72 h are smaller than the average long-term official track errors (Table 4), but the 96-h and 120-h forecasts had errors larger than the long-term averages. The official track forecasts issued during the first few days of Ernesto’s existence were biased too far left, or west. These forecasts were based on the most reliable guidance models that were, especially on 25 and 26 August, tightly clustered on a path into the Gulf of Mexico. The model tracks shifted dramatically eastward on 27 August. As a result, after the storm reached Cuba early on 28 August, the official forecasts were fairly accurate in anticipating where Ernesto would go, including passage over Florida and the Carolinas. The official track forecasts had generally smaller average errors than most of the individual dynamical models at most forecast times, with the exceptions being the GFDI (interpolated GFDL) and the GFSI (interpolated GFS) and its ensemble mean (AEMI). The GFSI performed well, with average errors comparable to, and in some cases lesser than, those of the various consensus models, in part since it shifted farther eastward on 27 August than did the other models. Among the consensus models, the GUNA (combination of the GFDI, UKMI, NGPI, and GFSI tracks) had the smallest average errors, which were considerably smaller than the official errors at all forecast times.

7
A verification of official and guidance model intensity forecasts is given in Table 5. Average official intensity errors were 9, 15, 17, 18, 28, 34, and 35 kt for the 12, 24, 36, 48, 72, 96, and 120 h forecasts, respectively. For comparison, the average long-term official intensity errors are 6, 10, 12, 14, 18, 20, and 22 kt, respectively. Overall, official intensity forecasts were considerably poorer than the long-term averages and were biased quite high, largely because there was more interaction with land than anticipated. Ernesto provides an excellent example of how track and intensity forecasts are interdependent, especially near land areas. Since the official track forecasts issued during 24–26 August indicated Ernesto would move through the western Caribbean Sea and then into the Gulf of Mexico as a hurricane, they did not anticipate the storm’s weakening near Hispaniola and lack of strengthening over and beyond Cuba. Even the forecasts issued on 27 August, which included a track forecast directly over Cuba, could not confidently anticipate how much time Ernesto would spend over that island and how strong it would be thereafter. Once Ernesto emerged north of Cuba on 28 August, official forecasts called for the storm to strengthen before reaching Florida. The reasons for the lack of any strengthening over the warm waters between Cuba and Florida are not fully understood, but contributing factors might have included some modest easterly wind shear and the lingering effects of land interaction that disrupted the storm’s inner core. Official forecasts of the intensity of Ernesto issued within a couple of days of final landfall in North Carolina were reasonably accurate in anticipating a strengthening tropical storm, but they were biased slightly low. Although the official intensity forecasts had large errors, so did most of the intensity guidance models. A notable exception is the GFDI, which had much smaller errors than the official forecast and the remaining intensity models at 48–96 h, in part because of forecast tracks that went directly over Cuba and resulted in lower intensity forecasts.
Coastal watches and warnings that were issued in association with Ernesto are listed in Table 6. Hurricane watches (indicating the possibility of hurricane-force winds) were issued for portions of Florida beginning more than two days prior to the storm’s landfall in the Florida Keys, but Ernesto did not approach hurricane strength as it neared southern Florida. Hurricane watches were also issued for portions of the coasts of Georgia, South Carolina, and North Carolina, but Ernesto made landfall in North Carolina as a strong tropical storm. It is therefore important to note that a hurricane warning (indicating the expectation of hurricane-force winds) was never issued for any part of the United States. Tropical storm warnings were issued, however, in a timely manner (24 h or more in advance of landfall) for most areas directly affected by Ernesto from Florida to North Carolina. Additionally, gale warnings were issued for areas farther north by local NWS forecast offices in advance of the gale-force winds that occurred in those areas. e. Acknowledgements Dr. Michael Brennan (UCAR Visiting Scientist at TPC) provided substantial assistance with data collection, assembling the data tables, and constructing the synoptic history. Large amounts of surface observations were provided by several National Weather Service Forecast Offices in the eastern United States and by the State Climate Office of North Carolina at North Carolina State University. Mr. Colin McAdie (NHC) conducted a thorough analysis of archived
8
WSR-88D radar data provided by the NWS Weather Forecast Office in Wilmington, North Carolina. Appreciation is also extended to Dr. Peter Black and Mr. Eric Uhlhorn of the NOAA Hurricane Research Division for their analysis of the SFMR data.

9
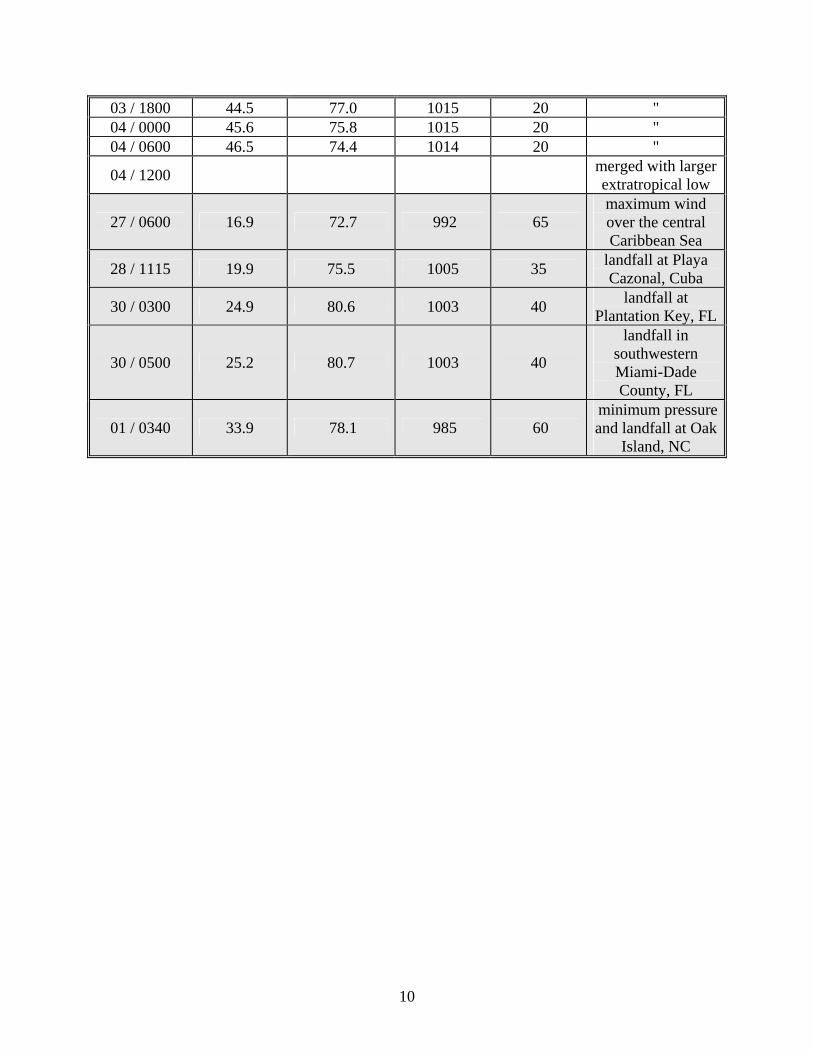
Table 1. Best track for Hurricane Ernesto, 24 August – 1 September 2006.
Date/Time (UTC)
Latitude (°N)
Longitude (°W)
Pressure (mb)
Wind Speed (kt) Stage
24 / 1800 12.7 61.6 1008 30 tropical depression 25 / 0000 13.0 63.0 1007 30 " 25 / 0600 13.3 64.4 1005 30 " 25 / 1200 13.7 65.8 1005 35 tropical storm 25 / 1800 14.0 67.1 1004 35 " 26 / 0000 14.3 68.3 1002 40 " 26 / 0600 14.6 69.5 999 45 " 26 / 1200 15.1 70.4 997 50 " 26 / 1800 15.7 71.2 997 55 " 27 / 0000 16.3 72.0 995 55 " 27 / 0600 16.9 72.7 992 65 hurricane 27 / 1200 17.4 73.4 997 55 tropical storm 27 / 1800 17.8 74.0 1002 45 " 28 / 0000 18.3 74.6 1003 40 " 28 / 0600 19.1 75.2 1004 40 " 28 / 1200 20.0 75.6 1005 35 " 28 / 1800 20.8 76.4 1007 35 " 29 / 0000 21.6 77.4 1007 35 " 29 / 0600 22.4 78.5 1006 40 " 29 / 1200 23.2 79.3 1006 40 " 29 / 1800 23.9 79.9 1005 40 " 30 / 0000 24.7 80.4 1004 40 " 30 / 0600 25.3 80.8 1003 40 " 30 / 1200 26.1 81.0 1002 35 " 30 / 1800 27.0 80.9 1001 35 " 31 / 0000 28.1 80.7 1000 35 " 31 / 0600 29.4 80.4 999 45 " 31 / 1200 30.6 79.9 995 55 " 31 / 1800 31.9 79.2 993 60 " 01 / 0000 33.2 78.4 988 60 " 01 / 0600 34.5 78.0 985 50 " 01 / 1200 35.8 77.6 991 30 tropical depression 01 / 1800 36.6 77.2 997 40 extratropical 02 / 0000 37.1 77.0 1002 40 " 02 / 0600 37.6 76.8 1005 40 " 02 / 1200 38.2 76.7 1007 40 " 02 / 1800 38.9 76.7 1010 40 " 03 / 0000 39.9 76.7 1012 35 " 03 / 0600 41.3 77.1 1014 25 " 03 / 1200 43.1 77.5 1014 20 "
10
03 / 1800 44.5 77.0 1015 20 " 04 / 0000 45.6 75.8 1015 20 " 04 / 0600 46.5 74.4 1014 20 "
04 / 1200 merged with larger extratropical low
27 / 0600 16.9 72.7 992 65 maximum wind over the central Caribbean Sea
28 / 1115 19.9 75.5 1005 35 landfall at Playa Cazonal, Cuba
30 / 0300 24.9 80.6 1003 40 landfall at Plantation Key, FL
30 / 0500 25.2 80.7 1003 40
landfall in southwestern Miami-Dade County, FL
01 / 0340 33.9 78.1 985 60 minimum pressure and landfall at Oak
Island, NC
11
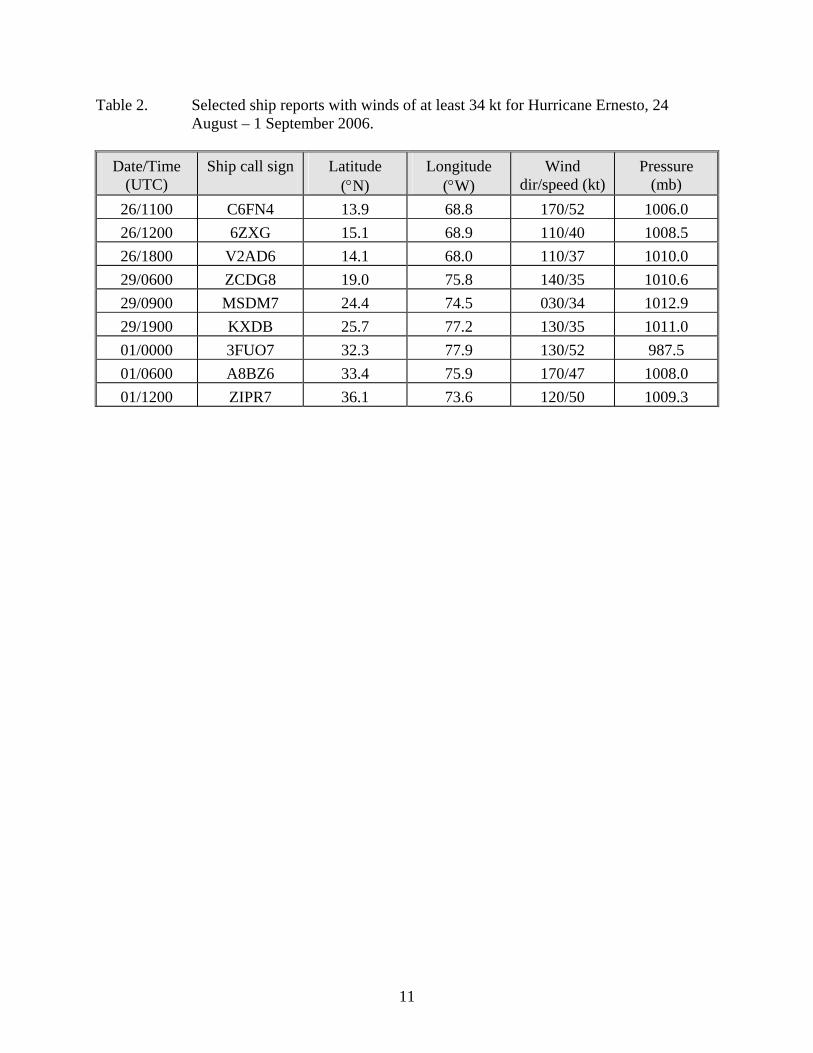
Table 2. Selected ship reports with winds of at least 34 kt for Hurricane Ernesto, 24 August – 1 September 2006.
Date/Time
(UTC) Ship call sign
Latitude
(°N) Longitude
(°W) Wind
dir/speed (kt) Pressure
(mb) 26/1100 C6FN4 13.9 68.8 170/52 1006.0 26/1200 6ZXG 15.1 68.9 110/40 1008.5 26/1800 V2AD6 14.1 68.0 110/37 1010.0 29/0600 ZCDG8 19.0 75.8 140/35 1010.6 29/0900 MSDM7 24.4 74.5 030/34 1012.9 29/1900 KXDB 25.7 77.2 130/35 1011.0 01/0000 3FUO7 32.3 77.9 130/52 987.5 01/0600 A8BZ6 33.4 75.9 170/47 1008.0 01/1200 ZIPR7 36.1 73.6 120/50 1009.3

12
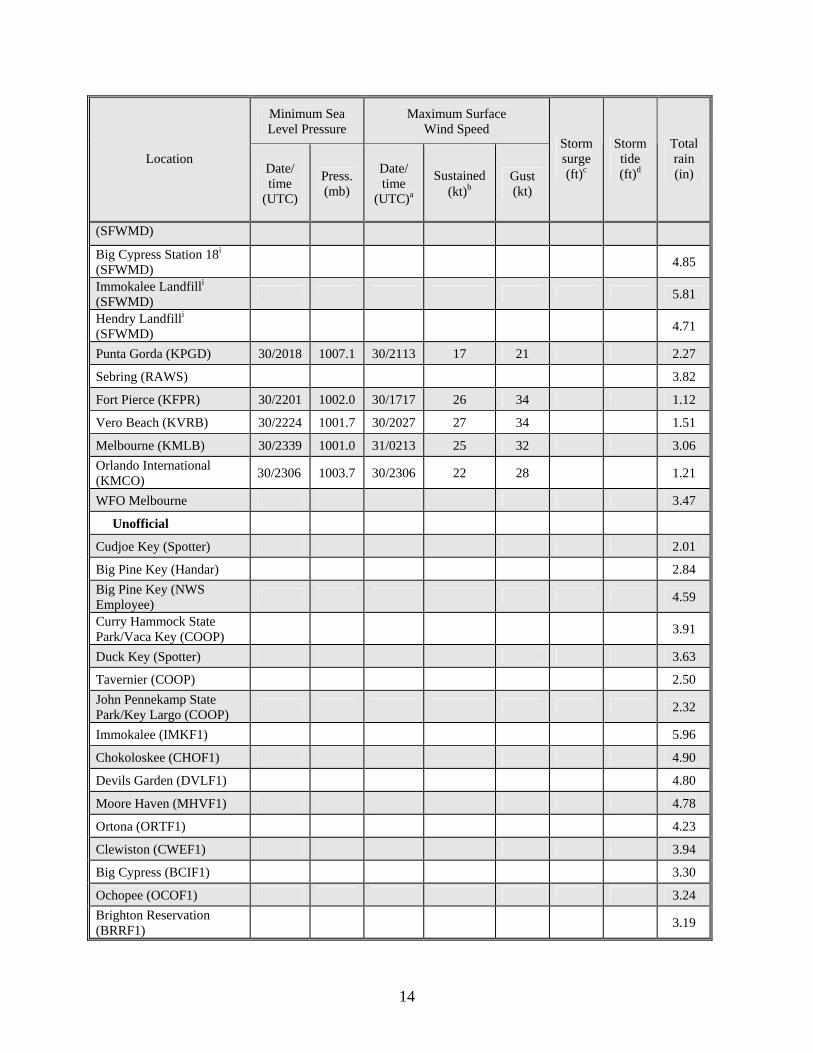
Table 3. Selected surface observations for Hurricane Ernesto, 24 August – 1 September 2006. Note that some observations occurred when Ernesto was an extratropical cyclone or were indirectly associated with Ernesto.
Minimum Sea Level Pressure
Maximum Surface Wind Speed
Location Date/ time
(UTC)
Press. (mb)
Date/ time
(UTC)a
Sustained (kt)b
Gust (kt)
Storm surge (ft)c
Storm tide (ft)d
Total rain (in)
Puerto Rico
Official
Sabana Grande ALERT 4.69
Dominican Republic
Las Americas (MDSD) 27/0900 1012.0 4.13
Barahona (MDBH) 28/2100 1011.2 7.01
Cuba Guantánamo (78334) 5.50 Guantánamo (78356) 4.23 Guantánamo (78368) 5.39 Punta de Maisi, Guantánamo (78369) 5.13
Contramaestre, Santiago de Cuba (78363) 3.54
Universidad, Santiago de Cuba (78364) 3.60
Gran Piedra, Santiago de Cuba (78366) 3.99
Punta Lucrecia, Holguín (78365) 28/1715 49 3.41
Pinares de Mayari, Holguín (78371) 2.87
Velasco, Holguín (78378) 3.11 Nuevitas, Camagüey (78353) 28/2015 45 7.46
Palo Seco, Camagüey (78354) 3.28
Florida
Official
Marathon (KMTH) 30/0910 1007.1 30/0839 23 28 3.18
Key West (KEYW) 30/0942 1008.1 30/1008 25 34 1.35
Opa-Locka (KOPF) 30/1153 1004.3 30/1315 30 35 0.34
13
Minimum Sea Level Pressure
Maximum Surface Wind Speed
Location Date/ time
(UTC)
Press. (mb)
Date/ time
(UTC)a
Sustained (kt)b
Gust (kt)
Storm surge (ft)c
Storm tide (ft)d
Total rain (in)
Homestead (KHST) 30/0655 1004.5 29/1655 22 33
Miami (KMIA) 30/1153 1004.6 30/1257 22 32 0.72
West Kendall (KTMB) 30/1116 1003.7 30/0638 22 32 1.53
Pompano Beach (KPMP) 30/1353 1005.5 30/1238 29 40 0.86 Fort Lauderdale Executive Airport (KFXE) 30/1353 1005.3 30/1731 26 34 0.73
Fort Lauderdale (KFLL) 30/1312 1004.7 30/1312 25 37 1.26
Pembroke Pines (KHWO) 30/1335 1005.1 30/1253 23 37 1.35
West Palm Beach (KPBI) 30/1837 1006.1 30/1336 28 37 1.30
Naples (KAPF) 30/2131 20 27 1.22
Miles City (RAWS) 6.69
Tenraw (RAWS) 2.97
Cache (RAWS) 30/1015 38 3.52 17W Boynton Beach
(RAWS) 2.61
Lake Okeechobee LZ40i (SFWMD) 30/2030 35h 45
Lake Okeechobee L005i (SFWMD) 30/2000 34h 51
Lake Okeechobee L006i (SFWMD) 30/1900 25h 31
Lake Okeechobee L001i (SFWMD) 30/1945 23h 36
Loxahatcheei (SFWMD) 30/1745 24h 35
Chekika (CHKF1) 30/1235 37
S331Wi (SFWMD) 30/1245 34
S7WXi (SFWMD) 30/1645 32
Oasis (OASF1) 30/1335 32
Clewiston (CFSW) 30/1945 27 South Golden Gatei (SFWMD) 8.72
Fakahatchee Strandi (SFWMD) 8.37
Palmdalei (SFWMD) 6.19 Big Cypress Station 14i (SFWMD) 6.31
Big Cypress Station 17i 5.17
14
Minimum Sea Level Pressure
Maximum Surface Wind Speed
Location Date/ time
(UTC)
Press. (mb)
Date/ time
(UTC)a
Sustained (kt)b
Gust (kt)
Storm surge (ft)c
Storm tide (ft)d
Total rain (in)
(SFWMD)
Big Cypress Station 18i (SFWMD) 4.85
Immokalee Landfilli (SFWMD) 5.81
Hendry Landfilli (SFWMD) 4.71
Punta Gorda (KPGD) 30/2018 1007.1 30/2113 17 21 2.27
Sebring (RAWS) 3.82
Fort Pierce (KFPR) 30/2201 1002.0 30/1717 26 34 1.12
Vero Beach (KVRB) 30/2224 1001.7 30/2027 27 34 1.51
Melbourne (KMLB) 30/2339 1001.0 31/0213 25 32 3.06 Orlando International (KMCO) 30/2306 1003.7 30/2306 22 28 1.21
WFO Melbourne 3.47
Unofficial
Cudjoe Key (Spotter) 2.01
Big Pine Key (Handar) 2.84 Big Pine Key (NWS Employee) 4.59
Curry Hammock State Park/Vaca Key (COOP) 3.91
Duck Key (Spotter) 3.63
Tavernier (COOP) 2.50 John Pennekamp State Park/Key Largo (COOP) 2.32
Immokalee (IMKF1) 5.96
Chokoloskee (CHOF1) 4.90
Devils Garden (DVLF1) 4.80
Moore Haven (MHVF1) 4.78
Ortona (ORTF1) 4.23
Clewiston (CWEF1) 3.94
Big Cypress (BCIF1) 3.30
Ochopee (OCOF1) 3.24 Brighton Reservation (BRRF1) 3.19

15
Minimum Sea Level Pressure
Maximum Surface Wind Speed
Location Date/ time
(UTC)
Press. (mb)
Date/ time
(UTC)a
Sustained (kt)b
Gust (kt)
Storm surge (ft)c
Storm tide (ft)d
Total rain (in)
South Bay (SBYF1) 3.10
Boca Raton 30/1230 44
Port Everglades 30/0830 32
Delray Beach 30/1423 36
Boynton Beach 30/1351 1005.1 30/1351 36
North Naples 2.43
East Golden Gate 5.37
NE Lehigh Acres (WU) 4.38 Tice Fire Department (WU) 2.39
Gateway/Lehigh Acres (WU) 2.50
Lovers Key 3.28
Punta Gorda 8NE 2.09
Arcadia EOC (WU) 2.53
Arcadia (FAWN) 2.39
Archbold Bio Station 5.97
Sebring (FAWN) 3.47
Jensen Beach 30/2326 40 0.97
Okeechobee (OKEF1) 30/2330 31
Palm Bay 2.31
Palm Bay/Turkey Creek 2.42
Rockledge 2.66
Melbourne 4.02
Melbourne 3.71
New Smyrna Beach 2.52
Ponce Inlet (PONF1) 2.07
Kenansville (KENF1) 3.08
Palm Bay (PLBF1) 2.61
Scottsmoor (SCMF1) 2.97
Titusville (TITF1) 2.67
Orlando (OREF1) 2.25
Lake City 2E (LCTF1) 2.28

16
Minimum Sea Level Pressure
Maximum Surface Wind Speed
Location Date/ time
(UTC)
Press. (mb)
Date/ time
(UTC)a
Sustained (kt)b
Gust (kt)
Storm surge (ft)c
Storm tide (ft)d
Total rain (in)
Georgia
Unofficial
Hazlehurst (HZLG1) 2.43
South Carolina
Official
Charleston (KCHS) 31/2053 1004.1 31/1754 22 28 2.61
Myrtle Beach (KMYR) 01/0150 998.3 01/0050 30 40 North Myrtle Beach (KCRE) 01/0459 995.9 01/0147 22 35 7.22
Witherbee (RAWS) 2.34
Charleston Harbor 0.88 6.23
Unofficial Sabsoon Navy RS Tower (SPAG1) 31/1400 33 37
Sabsoon Navy MR26 Tower (SKMG1) 31/1932 37 41
Mount Pleasant 6.82
McClellanville 6.35
Daniel Island 4.50
Johns Island 3.35
Moores Landing 3.00
West Ashley (WCSC-TV) 2.96 Mount Pleasant (WCBD-TV) 2.83
Mount Pleasant/Seaside Farm 2.80
Mount Pleasant/Rifle Range Road 2.90
James Island 2.69
Isle of Palms 2.52 Downtown Charleston (KCHL) 31/1928 24f 31 2.24
Ft. Moultrie 2.12
Goose Creek 2.04
Summerville 2.00
17
Minimum Sea Level Pressure
Maximum Surface Wind Speed
Location Date/ time
(UTC)
Press. (mb)
Date/ time
(UTC)a
Sustained (kt)b
Gust (kt)
Storm surge (ft)c
Storm tide (ft)d
Total rain (in)
Myrtle Beach FD6 6.30
Conway 4.02
Socastee 3.39
North Carolina
Official
Southport (KSUT) 01/0340 987.8 01/0040 23 43
Wilmington (KILM) 01/0447 985.4 01/0335 36 54 9.64
Cape Hatteras (KHSE) 01/1033 1004.7 01/0930 38 44 4.57 Cherry Point MCAS (KNKT) 01/0914 998.0 01/0509 34 44 4.01
Beaufort (KMRH) 01/1156 1003.0 01/0938 37 45 4.76 New River MCAS (KNCA) 01/0808 992.2 01/0705 41 51 5.23
Jacksonville (KOAJ) 01/0815 988.1 01/0815 32 46 6.75
New Bern (KEWN) 01/0922 996.2 01/0950 31 51 2.5 5.60
Kenansville (KDPL) 01/0821 989.8 01/0701 32 51
Kinston (KISO) 01/0940 988.5 01/0840 25 38
Washington (KOCW) 01/1202 995.3 01/1202 24 40 4–6
Greenville (KPGV) 01/1140 992.9 01/0920 26 39
Elizabethtown (KEYF) 01/0700 995.9 01/0742 22 4.38
Lumberton (KLBT) 01/0654 1001.1 01/0433 24 2.63
Fayetteville (KFAY) 01/0653 999.8 01/0525 29 42 2.13
Fort Bragg (KFBG) 01/0755 1001.5 01/0555 17 35
Louisburg (KLHZ) 34
Henderson (KHNZ) 34
Roanoke Rapids (KRZZ) 01/1454 998.2 01/1304 24 39 3.85 Rocky Mount/Wilson (KRWI) 01/1053 995.6 01/0825 29 40 3.73
Clinton (KCTZ) 38
Maxton (KMEB) 36 1.21
Raleigh-Durham (KRDU) 01/0951 1004.3 01/0451 20 32 1.53
Goldsboro (KGWW) 39 Seymour-Johnson AFB (KGSB) 01/0955 991.5 01/.755 28 46

18
Minimum Sea Level Pressure
Maximum Surface Wind Speed
Location Date/ time
(UTC)
Press. (mb)
Date/ time
(UTC)a
Sustained (kt)b
Gust (kt)
Storm surge (ft)c
Storm tide (ft)d
Total rain (in)
Elizabeth City (KECG) 01/0654 1012.1 01/0854 29 36
Elizabeth City CG Station 5.07
Duck 4.26
Newport-Croatan (RAWS) 6.12
Sandy Run (RAWS) 5.68 Holly Shelter Back Island (RAWS) 10.21
Supply (RAWS) 7.29
Turnbull Creek (RAWS) 4.45
Whiteville (RAWS) 4.52
New Bern (RAWS) 4.13 Dare County (Collington Harbor) 3
Eastern Pamlico County 1–2 Coastal Onslow and Carteret County 2–3
Unofficial
Southport (NC State Pilot) 59
Sunny Point 59
Cedar Island (CITN7) 01/1010 1002.0 01/1210 79
Morehead City FD 53
Onslow Beach (RSLN7) 01/0955 59
Pea Island (PEIN7) 01/1010 47
Swanquarter (SWQN7) 01/1200 1002.0 01/1210 46
Stumpy Point (SPON7) 01/1000 43
Ocracoke 43
Kinston (ECONET)l 01/0700 21 8.11
Aurora (ECONET)l 01/1100 23 5.28
Castle Hayne (ECONET)l 01/0353 30 9.49
Lewiston (ECONET)l 01/0900 16 6.11
Plymouth (ECONET)l 01/1400 26 3.05
Rocky Mount (ECONET)l 01/1000 20 5.97
Whiteville (ECONET)l 01/0459 18 3.86
19
Minimum Sea Level Pressure
Maximum Surface Wind Speed
Location Date/ time
(UTC)
Press. (mb)
Date/ time
(UTC)a
Sustained (kt)b
Gust (kt)
Storm surge (ft)c
Storm tide (ft)d
Total rain (in)
Surf City Island 11.92
Hampsted 11.13
Surf City Mainland 8.61
Burgaw 3W 8.60 Wrightsville Beach/Parmele Isle 14.61
Wilmington 7N 10.31 Wilmington/Kings Grant (NWS Employee) 9.80
UNC-Wilmington 9.07
Leland (NWS Employee) 8.50
Longwood 7.65
Sunny Points 5.18
East Arcadia 7.32
Whiteville 5S 4.55
Red Springs 2.85
Lumberton 3S 2.53
Grifton (COOP) 9.85
Kinston (COOP) 9.57
Wallace (WCEN7) 8.00
Richlands (RILN7) 7.06
Greenville (PGVN7) 6.96
Washington (TRAN7) 6.75
Snow Hill 8NE (LZZN7) 5.38 Jacksonville 6NE (HFMN7) 5.34
Bunyan 3ESE (BNYN7) 5.05
Perrytown (PYTN7) 5.00
Wenona 7E (POCN7) 4.47
Fayetteville (COOP) 2.30
Fayetteville 6W (COOP) 2.24
Tarboro (COOP) 5.80
Roanoke Rapids (COOP) 3.00

20
Minimum Sea Level Pressure
Maximum Surface Wind Speed
Location Date/ time
(UTC)
Press. (mb)
Date/ time
(UTC)a
Sustained (kt)b
Gust (kt)
Storm surge (ft)c
Storm tide (ft)d
Total rain (in)
Enfield (COOP) 3.75
Scotland Neck (COOP) 3.58
Clinton (COOP) 4.60
Arcola (COOP) 3.07
Goldsboro (COOP) 4.54
Goldsboro 5E (Spotter) 5.30
Wilson (COOP) 4.65
Virginia
Official Virginia Beach - Oceana NAS (KNTU) 01/1856 1002.1 01/1111 29 45 5.71
Norfolk (KORF) 01/1751 1001.3 01/1153 36 46 9.05
Newport News (KPHF) 01/1755 1000.6 01/1345 39 48 8.46
Langley AFB (KLFI) 01/1855 1001.4 01/1243 41 58 7.25
West Point (KFYJ) 01/1642 27 54
Melfa (KMFV) 01/1442 34 47
Wallops Island (KWAL) 01/2054 1006.1 01/2131 49 59 4.53
Norfolk NAS (KNGU) 01/1753 1001.8 01/1145 36 48 6.62
Wakefield (KAKQ) 01/1954 1000.9 6.62
Richmond (KRIC) 01/2054 1004.3 01/1854 26 37 3.91
Rudee Inlet 6.12
Windmill Point 5.23 Washington Dulles (KIAD) 3.23
Washington Reagan National (KDCA) 2.71
Charlottesville (KCHO) 2.26
Unofficial
Chincoteague 8.00
Amelia County 6.60
Ruther Glen 4.75
Charles City 6.22
Chester 4.40
21
Minimum Sea Level Pressure
Maximum Surface Wind Speed
Location Date/ time
(UTC)
Press. (mb)
Date/ time
(UTC)a
Sustained (kt)b
Gust (kt)
Storm surge (ft)c
Storm tide (ft)d
Total rain (in)
Bon Air 3.00
Midlothian 2.50
Chesapeake 8.93
Hampton 7.00
Hopewell 4.15
Portsmouth 7.11
Norfolk 10.00
Richmond (WTVR-TV) 5.73
Richmond (WWBT-TV) 4.20
Richmond - Carytown 3.95 Richmond - Byrd Middle School 3.46
Richmond - Stony Point Mall 2.95
Virginia Beach - Thoroughgood 10.43
Virginia Beach - Sandbridge 9.20
Virginia Beach - Glenwood 9.69
Carson 7.70
Tappahannock 4.50
Fluvanna County 2.57
Fife 4.00
Purdy 3.76
Coatesville 3.80
Windsor 7.63
Toano 8.73
Jamestown 8.25
Little Plymouth 9.25
Mangohick 7.50
Central Garage 5.00
Weems 8.00
Louisa 4.30
22
Minimum Sea Level Pressure
Maximum Surface Wind Speed
Location Date/ time
(UTC)
Press. (mb)
Date/ time
(UTC)a
Sustained (kt)b
Gust (kt)
Storm surge (ft)c
Storm tide (ft)d
Total rain (in)
Mineral 3.60
Gwynns Island 8.00
Reedville 4.20
Powhatan 3.16
Disputanta 5.10
Warsaw 5.20
Newland 4.50
Courtland 5.75
Yale 7.50
Colonial Beach 3.40
Manassas 2.85
Burke 2.95
Warrenton 3.30
Remington 3.38
King George 7.75
Leesburg 2.92
Purcellville 2.90
Somerset 3.20
Stanley 4.75
Waterfall 4.61
Haymarket 4.00
Front Royal 3.30
Maryland
Official
Salisbury (KSBY) 01/2135 39 54 5.60 Baltimore-Washington International (KBWI) 3.63
Beaverdam Creek 2.92
Ocean City Inlet 4.34
Unofficial
Princess Anne 5.90
Snow Hill 7.19

23
Minimum Sea Level Pressure
Maximum Surface Wind Speed
Location Date/ time
(UTC)
Press. (mb)
Date/ time
(UTC)a
Sustained (kt)b
Gust (kt)
Storm surge (ft)c
Storm tide (ft)d
Total rain (in)
Pasadena 3.75
Annapolis 4.80
Baltimore 5.00
Wolfsville 3.00
Darnestown 2.50
Hollywood 6.92
Charlestown 3.16
American Corner 5.50
Federalsburg 4.90
St. Michaels 3.28
Delaware
Official
Wilmington (KILG) 02/0451 41 1.74
Dover AFB (KDOV) 02/0355 53 2.77
Georgetown (KGED) 02/0315 4.51
Unofficial
Wilmington 2.90
Bear 2.40
Newark 2.31
Blackbird 2.99
Woodside 3.90
Kitts Hummock 2.81
Bridgeville 3.75
Bethany Beach Boardwalk 4.06
Long Neck 4.50
Milford 4.50
Bethany Beach Armory 3.61
Jones Crossing 5.15
Redden 4.52
Georgetown 3.97
Harbeson 3.34

24
Minimum Sea Level Pressure
Maximum Surface Wind Speed
Location Date/ time
(UTC)
Press. (mb)
Date/ time
(UTC)a
Sustained (kt)b
Gust (kt)
Storm surge (ft)c
Storm tide (ft)d
Total rain (in)
Prime Hook NWR 3.73
New Jersey
Official
Cape May (KWWD) 01/2055 25 41
Millville (KMIV) 02/0554 26 40 Belmar-Farmingdale (KBLM) 02/0835 29 39
McGuire AFB (KWRI) 02/1255 24 38
Trenton (KTTN) 02/1100 23 35
Newark (KEWR) 02/1711 23 37
Teterboro (KTEB) 02/1851 24 36
Buoy/CMAN/NOS Sites Vaca Key, FL NOS (VACF1) (24.7N 81.1W) 30/0842 26g 43 1.00 1.50
Molasses Reef, FL (MLRF1) (25.0N 80.4W) 30/0300 1004.1 30/0530 34f 42
Long Key, FL (LONF1) (24.8N 80.9W) 30/0400 1005.4 30/0850 33f 52
Sombrero Key, FL (SMKF1) (24.6N 81.1W) 30/0600 1006.9 30/0600 33f 38
Sand Key, FL (SANF1) (24.5N 81.9W) 30/1000 31 35
Fowey Rocks, FL (FWYF1) (25.6N 80.1W) 30/0700 1006.0 30/0710 42 50
Virginia Key, FL NOS (VAKF1) (25.7N 80.2W) 30/1300 39 0.90 2.90
Naples Pier, FL NOS (NPSF1) (26.1N 81.8W) 30/2154 43 1.00 3.10
Lake Worth, FL (LKWF1) (26.6N 80.0W) 30/1500 1005.9 30/1440 35 43
Clearwater Beach, FL NOS (CWBF1) (28.0N 82.8W) 30/2230 22 43
NOAA Buoy 41012 (30.0N 80.6W) 31/0850 1000.3 31/1150 29 33
Fernandina Beach, FL NOS (FRDF1) (30.7N 81.5W)
2.55
NOAA Buoy 41008 (31.4N 80.9W) 31/1050 1004.9 31/1610 26 31

25
Minimum Sea Level Pressure
Maximum Surface Wind Speed
Location Date/ time
(UTC)
Press. (mb)
Date/ time
(UTC)a
Sustained (kt)b
Gust (kt)
Storm surge (ft)c
Storm tide (ft)d
Total rain (in)
Fort Pulaski, GA NOS (FPKG1) (32.0N 80.9W) 0.94 7.07
NOAA Buoy 41002 (32.3N 75.4W) 01/0400 30 45
NOAA Buoy 41004 (32.5N 79.1W) 31/1950 995.6 31/2200 41f 54
Fripp Inlet, SC (FRP1)j (32.5N 80.5W) 31/2012 1009.2 0.68 6.57
Folly Beach, SC (FBIS1) (32.7N 79.9W) 31/2000 1003.6 31/1400 25f 32
South Capers Island, SC NOS (SCIS1) (32.9N 79.7W)
1.28 6.21
NOAA Buoy 41013 (33.4N 77.7W) 01/0150 990.5 01/0050 45f 56
Springmaid Pier, SC NOS (MROS1) (33.7N 78.9W) 01/0200 998.0 31/1700 26 38
Oyster Landing, SC NOS (33.4N 79.2W) 1.73
Sunset Beach, NC (SNSN7)j (33.9N 78.5W) 01/0300 991.5 01/0100 32 43 1.58
Wrightsville Beach, NC NOS (JMPN7) (34.2N 77.8W)
01/0436 986.8 01/0330 50 64 2.90 5.87
NOAA Buoy 41035 (34.5N 72.3W) 01/0700 993.7 01/0607 40 55
Cape Lookout, NC (CLKN7) (34.6N 76.5W) 01/0800 1002.2 01/0840 43 55
NOAA Buoy 41025 (35.0N 75.4W) 01/1000 1003.9 01/1157 35 49
Duck, NC (DUCN7) (36.2N 75.8W) 01/1730 1003.7 01/1107 36 50
Cape Henry, VA (CHLV2) (36.9N 75.1W)
01/1900 1001.2 01/1342 50 57
Chesapeake Bay Bridge Tunnel, VA NOS (CBBV2) (37.0N 76.1W)
5.55
Sewells Point, VA NOS (SWPV2) (37.0N 76.3W) 5.52
Kiptopeke, VA NOS (KPTV2) (37.2N 76.0W) 01/1248 30 44 5.81
Yorktown, VA NOS (YKTV2) (37.2N 76.5W) 01/1436 52 65 5.97
York River East Rear 01/1318 52 66

26
Minimum Sea Level Pressure
Maximum Surface Wind Speed
Location Date/ time
(UTC)
Press. (mb)
Date/ time
(UTC)a
Sustained (kt)b
Gust (kt)
Storm surge (ft)c
Storm tide (ft)d
Total rain (in)
Range Light, VA NOS (YKRV2) (37.3N 76.3W) Rappahannock Light, VA NOS (RPLV2) (37.5N 76.0W)
01/1812 48 58
Lewisetta, VA NOS (LWTV2) (38.0N 76.5W) 01/1800 37 55 5.50
Bishops Head, MD NOS (BISM2) (38.2N 76.0W) 01/2030 38 65 4.05
Solomons Island, MD NOS (SLIM2) (38.3N 76.5W) 01/2218 1007.9 01/2218 33 53
Cambridge, MD NOS (CAMM2) (38.6N 76.1W) 02/0000 36 49 4.15
NOAA Buoy 44009 (38.5N 74.7W) 02/0650 1008.0 01/2350 39 49
Lewes NOS, DE (LWSD1) (38.8N 75.1W) 02/0712 1008.5 02/0336 46 58
Thomas Point, MD (TPLM2) (38.9N 76.4W) 02/0700 1008.2 01/2200 41 46
Francis Scott Key Bridge, MD NOS (FSKM2) (39.2N 76.5W)
02/0930 1008.8 02/0300 28 35
Chesapeake City, MD NOS (CHCM2) (39.5N 75.8W)
02/0930 1010.9 02/0536 23 34
Delaware City, DE NOS (DELD1) (39.6N 75.6W) 02/1000 1008.7 02/1000 29 40
Ambrose Light, NY (ALSN6) (40.5N 73.8W) 02/1110 44 52
a Date/time is for sustained wind when both sustained and gust are listed. b Except as noted, sustained wind averaging periods for C-MAN and land-based ASOS reports
are 2 min; buoy averaging periods are 8 min. c Storm surge is water height above normal astronomical tide level. d Storm tide is water height above National Geodetic Vertical Datum (1929 mean sea level). f 10-minute average. g 6-minute average. h 15-minute average. i South Florida Water Management District (SFWMD) site. j Carolinas Coastal Ocean Observing and Prediction System (Caro-COOPS) site. k University of South Florida site. l North Carolina Environment and Climate Observing Network (ECONET) site.

27
Table 4. Preliminary track forecast evaluation (heterogeneous sample) for Hurricane Ernesto, 24 August – 1 September 2006. Forecast errors (n mi) are followed by the number of forecasts in parentheses. Errors smaller than the NHC official forecast are shown in bold-face type. Verification includes the depression stage but does not include the extratropical stage.
Forecast Period (h) Forecast Technique
12 24 36 48 72 96 120 CLP5 35 (30) 73 (28) 121 (26) 171 (24) 233 (20) 307 (16) 416 (12) GFNI 32 (26) 62 (24) 98 (22) 138 (20) 218 (16) 373 (12) 568 ( 8) GFDI 25 (30) 44 (28) 69 (26) 104 (24) 176 (20) 274 (16) 380 (12) GFSI 27 (28) 42 (25) 60 (23) 76 (20) 111 (16) 199 (11) 400 ( 7) AEMI 33 (29) 52 (27) 73 (25) 90 (22) 128 (16) 183 (11) 351 ( 6) NGPI 29 (30) 61 (28) 107 (26) 150 (23) 187 (18) 221 (14) 317 ( 9) UKMI 33 (28) 63 (26) 96 (24) 113 (20) 271 (14) 243 ( 6) 326 ( 4) A98E 38 (30) 72 (28) 113 (26) 150 (24) 253 (20) 400 (16) 585 (12) A9UK 40 (15) 65 (14) 96 (13) 128 (12) 208 (10)
BAMD 40 (30) 72 (28) 99 (26) 139 (24) 261 (20) 447 (16) 652 (12)
BAMM 38 (30) 68 (28) 96 (26) 133 (24) 235 (20) 384 (16) 592 (12) BAMS 44 (30) 81 (28) 112 (26) 145 (24) 234 (20) 363 (16) 571 (12) CONU 24 (30) 46 (28) 73 (26) 104 (24) 181 (19) 258 (14) 382 (10) GUNA 22 (27) 40 (24) 64 (22) 62 (17) 132 (13) 172 ( 5) 268 ( 3) FSSE 24 (26) 42 (24) 61 (22) 85 (20) 157 (16) 247 (12) 447 ( 8) OFCL 27 (30) 47 (28) 72 (26) 102 (24) 160 (20) 260 (16) 415 (12)
NHC Official (2001–2005
mean)
37 (1930)
65 (1743)
91 (1569)
118 (1410)
171 (1138)
231 (913)
303 (742)

28
Table 5. Preliminary intensity forecast evaluation (heterogeneous sample) for Hurricane Ernesto, 24 August – 1 September 2006. Forecast errors (kt) are followed by the number of forecasts in parentheses. Errors smaller than the NHC official forecast are shown in bold-face type. Verification includes the depression stage but does not include the extratropical stage.
Forecast Period (h) Forecast Technique
12 24 36 48 72 96 120 SHF5 9.4 (30) 13.4 (28) 14.9 (26) 16.1 (24) 22.0 (20) 21.3 (16) 27.9 (12)GFDI 8.9 (30) 11.7 (28) 11.2 (26) 13.3 (24) 17.5 (20) 25.6 (16) 38.7 (12)
SHIP 10.4 (30) 15.5 (28) 19.1 (26) 25.6 (24) 40.8 (20) 48.1 (16) 48.9 (12)
DSHP 7.7 (30) 11.3 (28) 12.7 (26) 16.7 (24) 27.0 (20) 35.9 (16) 36.3 (12)
FSSE 8.1 (26) 11.4 (24) 12.0 (22) 13.9 (20) 24.8 (16) 33.1 (12) 37.9 ( 8)
ICON 7.9 (30) 10.9 (28) 12.5 (26) 15.4 (24) 23.3 (20) 31.8 (16) 41.7 (12)
OFCL 8.7 (30) 14.5 (28) 16.9 (26) 18.3 (24) 27.8 (20) 34.1 (16) 35.4 (12)
NHC Official (2001–2005
mean)
6.3 (1930)
9.8 (1743)
12.1 (1569)
14.3 (1410)
18.4 (1138)
19.8 (913)
21.8 (742)

29
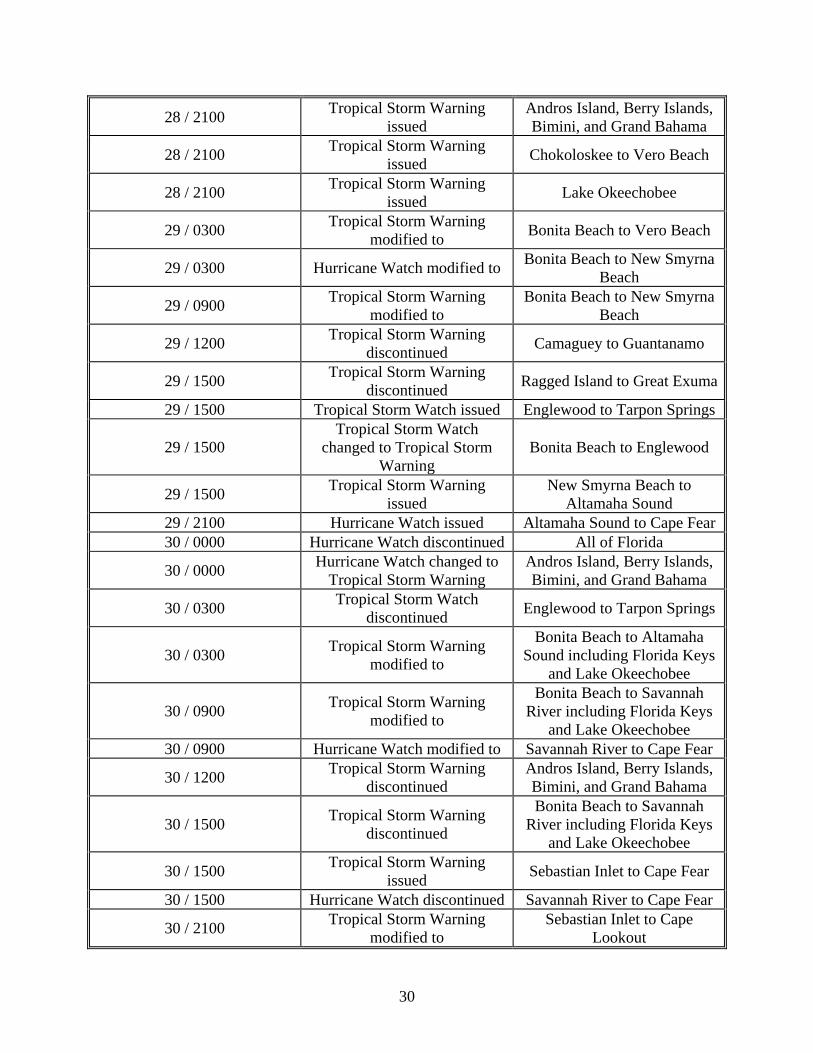
Table 6. Watch and warning summary for Hurricane Ernesto, 24 August – 1 September 2006.
Date/Time (UTC) Action Location
25 / 2100 Tropical Storm Watch issued Haiti/Dominican Republic Border to SW tip of Haiti
25 / 2100 Tropical Storm Watch issued Jamaica
26 / 0300 Tropical Storm Watch
changed to Tropical Storm Warning
Haiti/Dominican Republic Border to SW tip of Haiti
26 / 1500 Tropical Storm Watch
changed to Tropical Storm Warning
Jamaica
26 / 1500 Tropical Storm Watch changed to Hurricane Watch Jamaica
26 / 1500 Hurricane Watch issued Cayman Islands 26 / 2100 Hurricane Watch issued Las Tunas to Guantanamo
27 / 0900 Tropical Storm Warning changed to Hurricane Warning
Haiti/Dominican Border to SW tip of Haiti
27 / 1500 Hurricane Warning issued Camaguey to Guantanamo 27 / 2100 Hurricane Watch issued Ocean Reef to Dry Tortugas
28 / 0000 Hurricane Watch changed to Tropical Storm Watch
Cayman Brac and Little Cayman
28 / 0000 Hurricane Watch discontinued Grand Cayman
28 / 0300 Hurricane Watch changed to Tropical Storm Warning Jamaica
28 / 0300 Tropical Storm Warning issued
Ragged Island and Great Exuma
28 / 0300 Hurricane Watch issued Andros Island
28 / 0900 Tropical Storm Watch discontinued
Cayman Brac and Little Cayman
28 / 0900 Tropical Storm Warning discontinued Jamaica
28 / 0900 Hurricane Watch issued Chokoloskee to Deerfield Beach
28 / 1200 Hurricane Warning discontinued
Haiti/Dominican Border to SW tip of Haiti
28 / 1500 Hurricane Warning changed to Tropical Storm Warning Camaguey to Guantanamo
28 / 1500 Hurricane Watch modified to Chokoloskee to New Smyrna Beach
28 / 1500 Hurricane Watch issued Lake Okeechobee
28 / 1500 Hurricane Watch issued Berry Islands, Bimini and Grand Bahama
28 / 2100 Tropical Storm Watch issued Chokoloskee to Englewood
30
28 / 2100 Tropical Storm Warning issued
Andros Island, Berry Islands, Bimini, and Grand Bahama
28 / 2100 Tropical Storm Warning issued Chokoloskee to Vero Beach
28 / 2100 Tropical Storm Warning issued Lake Okeechobee
29 / 0300 Tropical Storm Warning modified to Bonita Beach to Vero Beach
29 / 0300 Hurricane Watch modified to Bonita Beach to New Smyrna Beach
29 / 0900 Tropical Storm Warning modified to
Bonita Beach to New Smyrna Beach
29 / 1200 Tropical Storm Warning discontinued Camaguey to Guantanamo
29 / 1500 Tropical Storm Warning discontinued Ragged Island to Great Exuma
29 / 1500 Tropical Storm Watch issued Englewood to Tarpon Springs
29 / 1500 Tropical Storm Watch
changed to Tropical Storm Warning
Bonita Beach to Englewood
29 / 1500 Tropical Storm Warning issued
New Smyrna Beach to Altamaha Sound
29 / 2100 Hurricane Watch issued Altamaha Sound to Cape Fear 30 / 0000 Hurricane Watch discontinued All of Florida
30 / 0000 Hurricane Watch changed to Tropical Storm Warning
Andros Island, Berry Islands, Bimini, and Grand Bahama
30 / 0300 Tropical Storm Watch discontinued Englewood to Tarpon Springs
30 / 0300 Tropical Storm Warning modified to
Bonita Beach to Altamaha Sound including Florida Keys
and Lake Okeechobee
30 / 0900 Tropical Storm Warning modified to
Bonita Beach to Savannah River including Florida Keys
and Lake Okeechobee 30 / 0900 Hurricane Watch modified to Savannah River to Cape Fear
30 / 1200 Tropical Storm Warning discontinued
Andros Island, Berry Islands, Bimini, and Grand Bahama
30 / 1500 Tropical Storm Warning discontinued
Bonita Beach to Savannah River including Florida Keys
and Lake Okeechobee
30 / 1500 Tropical Storm Warning issued Sebastian Inlet to Cape Fear
30 / 1500 Hurricane Watch discontinued Savannah River to Cape Fear
30 / 2100 Tropical Storm Warning modified to
Sebastian Inlet to Cape Lookout

31
31 / 0300 Tropical Storm Warning modified to Cocoa Beach to Cape Lookout
31 / 0900 Tropical Storm Warning modified to
Flagler Beach to Cape Lookout
31 / 1500 Tropical Storm Warning discontinued
Flagler Beach to Cape Lookout
31 / 1500 Tropical Storm Warning issued
Savannah River to Currituck Beach Light
31 / 1500 Hurricane Watch issued South Santee River to Cape Lookout
31 / 2100 Tropical Storm Warning modified to
Edisto Beach to Currituck Beach Light
1 / 0000 Tropical Storm Warning modified to
Savannah River to Currituck Beach Light
1 / 0300 Tropical Storm Warning modified to
South Santee River to Currituck Beach Light
1 / 0900 Tropical Storm Warning modified to
Cape Fear to Currituck Beach Light
1 / 0900 Hurricane Watch discontinued All
1 / 1200 Tropical Storm Warning modified to
Surf City to Currituck Beach Light
1 / 1500 Tropical Storm Warning discontinued All

32
10
15
20
25
30
35
40
45
50
-95 -90 -85 -80 -75 -70 -65 -60 -55 -50 -45
Hurricane Ernesto24 Aug - 1 Sep 2006
HurricaneTropical StormTropical Dep.ExtratropicalSubtr. StormSubtr. Dep.
00 UTC Pos/Date12 UTC Position
Low / Wave
PPP Min. press (mb)
25
4
3
31
30
29
2827
26
1
2
985 mb
Figure 1. Best track positions for Hurricane Ernesto, 24 August – 1 September 2006. Track during the extratropical stage is
based in part on analyses from the NOAA Ocean Prediction Center and the NOAA Hydrometeorological Prediction Center.
33
20
30
40
50
60
70
80
90
8/24 8/26 8/28 8/30 9/1 9/3 9/5
Hurricane Ernesto24 August - 1 September 2006
BEST TRACKSat (TAFB)Sat (SAB)Sat (AFWA)Obj T-NumAC (sfc)AC (flt>sfc)AC (DVK P>W)QuikSCATSurfaceDrop (sfc)Drop (LLM xtrp)Drop (MBL xtrp)
Win
d S
peed
(kt)
Date (Month/Day)
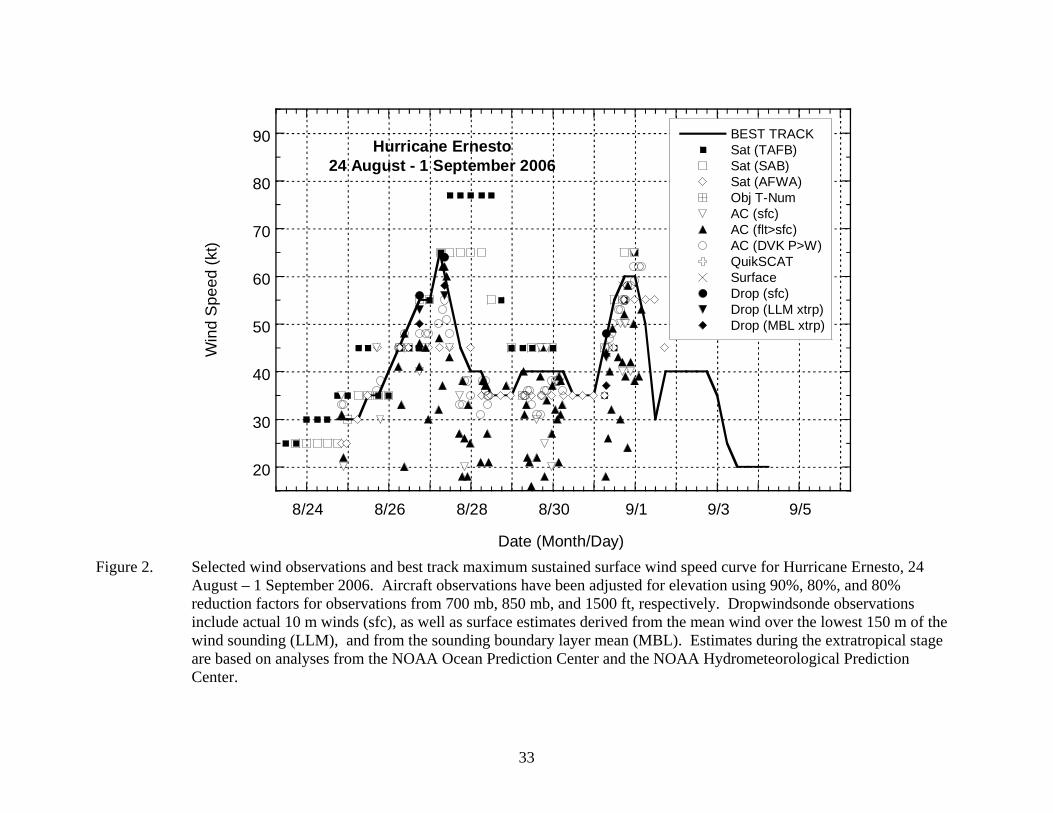
Figure 2. Selected wind observations and best track maximum sustained surface wind speed curve for Hurricane Ernesto, 24 August – 1 September 2006. Aircraft observations have been adjusted for elevation using 90%, 80%, and 80% reduction factors for observations from 700 mb, 850 mb, and 1500 ft, respectively. Dropwindsonde observations include actual 10 m winds (sfc), as well as surface estimates derived from the mean wind over the lowest 150 m of the wind sounding (LLM), and from the sounding boundary layer mean (MBL). Estimates during the extratropical stage are based on analyses from the NOAA Ocean Prediction Center and the NOAA Hydrometeorological Prediction Center.

34
980
990
1000
1010
1020
8/24 8/26 8/28 8/30 9/1 9/3 9/5
Hurricane Ernesto24 August - 1 September 2006
BEST TRACKSat (TAFB)Sat (SAB)Sat (AFWA)Obj T-NumAC (sfc)Surface
Pres
sure
(mb)
Date (Month/Day)
Figure 3. Selected pressure observations and best track minimum central pressure curve for Hurricane Ernesto, 24 August – 1
September 2006. Estimates during the extratropical stage are based in part on analyses from the NOAA Ocean Prediction Center and the NOAA Hydrometeorological Prediction Center.

35
Figure 4. WSR-88D radar imagery from Wilmington, North Carolina of Ernesto at 0104 UTC 1 September 2006, about two and
one half hours prior to landfall of the circulation center just west of Cape Fear, North Carolina.

36
Figure 5. Rainfall totals produced over the eastern United States during the period 30 August – 4 September 2006 in association
with Ernesto. Graphic provided by the NOAA Hydrometeorological Prediction Center.