tropical cyclone report richard j. pasch, eric s. blake ... · hurricane fabian 27 august-8...
TRANSCRIPT
-1-
Tropical Cyclone ReportHurricane Fabian
27 August-8 September 2003
Richard J. Pasch, Eric S. Blake, and Daniel P. BrownNational Hurricane Center
19 November 2003
Fabian was a long-lived, powerful Cape Verde hurricane that struck Bermuda with categorythree intensity. It caused extensive damage on that island, where it was reported to be the worsthurricane since 1926.
a. Synoptic History
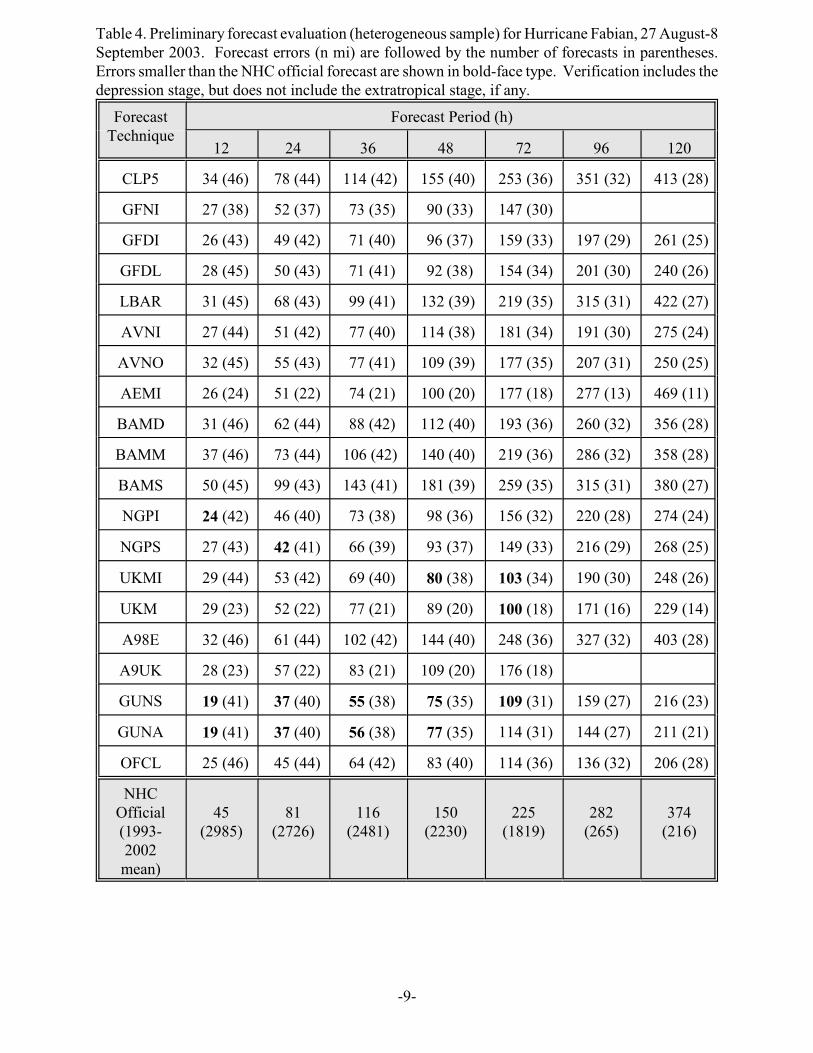
Fabian’s genesis can be traced back to a vigorous tropical wave that emerged from westernAfrica on 25 August, and moved westward through the Cape Verde Islands a day later. By 27August, the deep convection associated with the system became more consolidated in a circular area,and it is estimated that a tropical depression formed at 1800 UTC, centered about 365 n mi west ofthe Cape Verde Islands. Fabian’s path is shown in Fig. 1, and time series of the tropical cyclone’smaximum sustained wind and minimum central pressure are displayed in Figs. 2 and 3, respectively.The best track positions and intensities are listed in Table 1. With a favorable atmospheric andoceanic environment (characterized by vertical shear from 850 to 200 mb of 5-10 kt or less, seasurface temperatures near 27.5°C), the tropical cyclone strengthened fairly steadily and became atropical storm around 1200 UTC 28 August, and a hurricane by 0000 UTC 30 August over the east-central tropical Atlantic. Fabian reached its estimated peak intensity of 125 kt at 1800 UTC 1September when it was centered about 265 n mi east-northeast of the northern Leeward Islands. Thishurricane maintained Category 3 or Category 4 intensity on the Saffir-Simpson Hurricane Scale foralmost a week.
Fabian was steered on a westward to west-northwestward heading for several days by deepeasterlies to the south of a subtropical ridge. The forward speed gradually slowed from 18-19 kt justafter genesis to less than 10 kt by 2 September, as the tropical cyclone neared a weakness in thesubtropical ridge produced by a mid-level cyclonic circulation over the southwestern North Atlantic.Then, the hurricane turned toward the northwest while continuing to decelerate over the next coupleof days. A large mid-tropospheric trough nearing the east coast of the United States provided a morenorthward steering flow, and Fabian turned north-northwestward to northward with increasingforward speed. Fabian targeted Bermuda, and struck that island with an intensity close to 100 kt.The eastern eyewall of the hurricane moved over Bermuda around 2000 UTC on 5 September.Observers on the western end of the island reported a brief interlude of blue sky and windsdecreasing to 50-60 kt at various times between 1945 and 2115 UTC, which indicates that they werein the eastern fringes of Fabian’s eye. The center of Fabian did not make landfall. However, sincethe eyewall passed over Bermuda, the hurricane made a direct hit on that island.
After raking Bermuda, the hurricane accelerated north-northeastward and northeastward,weakening to below 100 kt after 1800 UTC 6 September. Fabian lost its tropical characteristics on8 September while located about 700 n mi east-northeast of Cape Race, Newfoundland. It turnednorthward the next day and merged with another extratropical cyclone between southern Greenlandand Iceland.

-2-
b. Meteorological Statistics
Observations in Fabian (Figs. 2 and 3) include satellite-based Dvorak technique intensityestimates from the Tropical Analysis and Forecast Branch (TAFB), the Satellite Analysis Branch(SAB) and the U. S. Air Force Weather Agency (AFWA), as well as flight-level and dropwindsondeobservations from flights of the 53 Weather Reconnaissance Squadron of the U. S. Air Forcerd
Reserve Command (AFRES) and the National Oceanic and Atmospheric Administration (NOAA).
Fabian’s peak intensity is estimated to be 125 kt, based on a 700 mb flight-level wind of 140kt measured by AFRES around 1917 UTC 1 September. A minimum central pressure of 942 mbwas measured at that time. A lower central pressure of 939 mb was measured by NOAA at 2245UTC 3 September, but maximum flight-level winds around that time only supported an intensity of115 kt.
Surface observations in Hurricane Fabian, all from Bermuda, are listed in Table 2. Asustained (10 min average) wind speed of 105 kt and a gust to 131 kt were measured by Cable andWireless at an elevation of 280 ft above sea level. Sustained104 kt winds, with gusts to 127 kt, wereobserved at Warwick Tower at an elevation of 220 ft above ground level. Sustained winds of 102kt with a gust to 143 kt were measured by Bermuda Harbor Radio at an elevation of 255 ft above sealevel. Since these observations are unofficial and at elevations significantly higher than 10 m, it isdifficult to use them to make an accurate assessment of the hurricane’s strength when it hit Bermuda.They are, however, not inconsistent with category three intensity. Unfortunately, due to a loss ofpower, the official wind measurements from the Bermuda Airport (TXKF) anemometer ended at1935 UTC 5 September, and the extreme sustained and gust wind speed values were estimated. Shipand drifting buoy reports of winds of tropical storm force associated with Fabian are given in Table3.
c. Casualty and Damage Statistics
Fabian was directly responsible for eight fatalities. A man drowned in a rip current near CapeHatteras on 4 September. Four people drowned when they, and their vehicles, were swept off of acauseway in Bermuda on 5 September. Three fishermen drowned when their vessel sank about 350n mi southeast of St. John’s, Newfoundland on 7 September.
Bermuda was hit hard by Fabian. There was extensive damage to vegetation andconsiderable roof damage to houses in exposed locations. Some buildings had more severe damage,due to inherent structural weakness in some cases and possibly due to tornadoes (which were notconfirmed) in others. There were huge (estimated 20 to 30 ft high) battering waves on the southshore of the island, with the reported storm surge estimated near 10 ft. Significant structural damagewas inflicted as a result of wave action and/or surge. Property damage estimate in Bermuda isestimated to be at least 300 million U.S. dollars.
d. Forecast and Warning Critique
In comparison to the long-term average, Fabian's track was well predicted in most cases.Average official track errors (with the number of cases in parentheses) for Fabian were 25 (46), 45(44), 64 (42), 83 (40), 114 (36), 136 (32), and 206 (28) n mi for the 12, 24, 36, 48, 72, 96, and 120

All forecast verifications in this report include the depression stage of the cyclone. 1
National Hurricane Center verifications presented in these reports prior to 2003 did not includethe depression stage.
Errors given for the 96 and 120 h periods are averages over the two-year period2
2001-2.
-3-
h forecasts, respectively . These errors are considerably (40-50%) lower than the average official1
track errors for the 10-yr period 1993-2002 of 45, 81, 116, 150, 225, 282, and 374, respectively.2
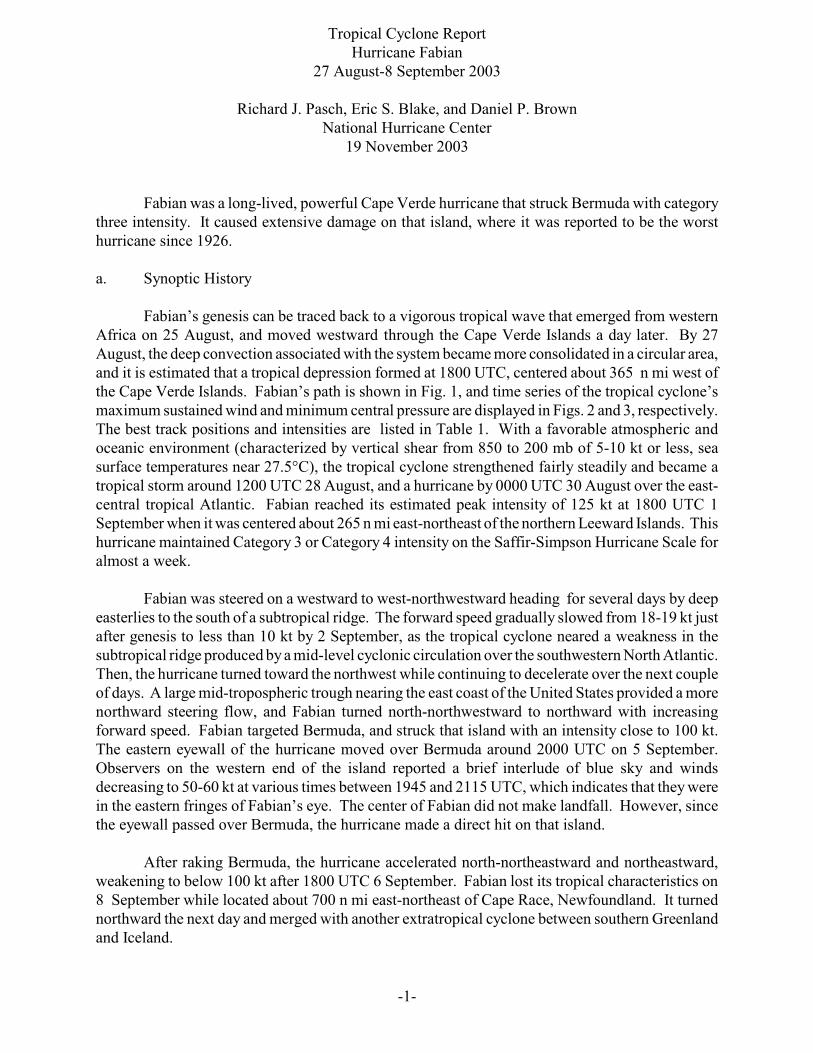
Overall, the official forecasts were slightly slow with somewhat of a westward bias. Table 4 liststhe average forecast errors for the various track prediction models and model consensus forcomparison with the official forecast errors. In general the official forecasts had lower average trackerrors than any of the individual models. However, the GUNS and GUNA consensus had averageerrors that were a little lower than, or the same as, the official forecasts at hours 12 through 72.
Average official intensity errors for Fabian were 4, 7, 10, 13, 18, 20, and 21 kt for the 12,24, 36, 48, 72, 96, and 120 h forecasts, respectively. For comparison, the average official intensityerrors over the 10-yr period 1993-2002 are 6, 10, 13, 15, 19, 21, and 22 kt, respectively. Thus theintensity forecasts for Fabian were about the same as the recent historical averages.
Table 5 lists the watches and warnings, all for Bermuda, associated with Hurricane Fabian.A hurricane watch was issued 35 h before Fabian's closest approach, and a hurricane warning wasissued 29 h before Fabian's closest approach.
Acknowledgements
We thank Roger Williams, director of the Bermuda Meteorological Service, for providingmeteorological observations and the information on Fabian's impact on Bermuda.

-4-
Table 1. Best track for Hurricane Fabian, 27 August-8 September 2003.
Date/Time(UTC)
Latitude(°N)
Longitude(°W)
Pressure(mb)
WindSpeed(kt)
Stage
27 / 1800 14.6 30.7 1009 25 tropical depression
28 / 0000 14.7 32.3 1008 30 "
28 / 0600 14.9 34.2 1008 30 "
28 / 1200 15.0 36.2 1006 35 tropical storm
28 / 1800 15.1 38.2 1004 40 "
29 / 0000 15.2 40.1 1000 45 "
29 / 0600 15.4 41.8 997 50 "
29 / 1200 15.5 43.1 997 50 "
29 / 1800 15.8 44.3 990 60 "
30 / 0000 16.3 45.6 987 65 hurricane
30 / 0600 16.7 46.9 984 70 "
30 / 1200 17.0 48.0 973 85 "
30 / 1800 17.3 49.2 960 100 "
31 / 0000 17.6 50.3 952 110 "
31 / 0600 17.8 51.4 952 110 "
31 / 1200 18.0 52.5 952 110 "
31 / 1800 18.2 53.5 948 115 "
01 / 0000 18.3 54.3 945 120 "
01 / 0600 18.5 55.3 949 120 "
01 / 1200 18.7 56.3 949 120 "
01 / 1800 19.0 57.3 944 125 "
02 / 0000 19.3 58.3 943 125 "
02 / 0600 19.6 59.2 945 120 "
02 / 1200 20.1 59.9 945 120 "
02 / 1800 20.5 60.7 946 120 "
03 / 0000 20.9 61.3 945 115 "
03 / 0600 21.3 61.8 945 110 "

Date/Time(UTC)
Latitude(°N)
Longitude(°W)
Pressure(mb)
WindSpeed(kt)
Stage
-5-
03 / 1200 21.9 62.3 945 110 "
03 / 1800 22.5 62.8 944 110 "
04 / 0000 23.2 63.0 939 115 "
04 / 0600 23.8 63.3 944 105 "
04 / 1200 24.8 63.8 944 105 "
04 / 1800 25.8 64.3 941 110 "
05 / 0000 27.1 64.6 940 115 "
05 / 0600 28.6 65.1 946 105 "
05 / 1200 30.1 65.3 951 105 "
05 / 1800 31.8 65.3 950 105 "
06 / 0000 33.4 64.7 953 100 "
06 / 0600 34.9 64.0 956 100 "
06 / 1200 36.0 62.4 957 100 "
06 / 1800 36.9 60.4 958 100 "
07 / 0000 37.9 58.2 962 90 "
07 / 0600 39.1 55.7 965 85 "
07 / 1200 40.6 53.4 967 80 "
07 / 1800 42.3 50.7 972 75 "
08 / 0000 44.3 47.9 975 70 "
08 / 0600 46.3 44.7 977 70 "
08 / 1200 48.7 40.8 980 65 "
08 / 1800 51.7 36.0 980 65 extratropical
09 / 0000 54.0 32.0 980 60 "
09 / 0600 56.0 29.0 982 50 "
09 / 1200 58.0 27.0 982 50 "
09 / 1800 60.0 27.0 990 40 "
10 / 0000 absorbed
01 / 1800 19.0 57.3 944 125 maximum intensity

Date/Time(UTC)
Latitude(°N)
Longitude(°W)
Pressure(mb)
WindSpeed(kt)
Stage
-6-
04 / 0000 23.2 63.0 939 115 minimum pressure
05 / 2000 32.3 65.1 952 100 closest approach (12 nmi west) to Bermuda

-7-
Table 2. Selected surface observations for Hurricane Fabian, 5 September 2003.
Location
Minimum SeaLevel Pressure
Maximum Surface Wind Speed Storm
surge(ft)c
Stormtide(ft)d
Totalrain(in)Time
(UTC)Press.(mb)
Time(UTC)a
Sustained
(kt)b
Gust(kt)
Bermuda
Bermuda Airport(TXKF)
2030 964.0 2055 105 130 1.82e e f
TXKF anemometersiteg 1927 72 102
Cable andWirelessh 1940 105 131
Bermuda HarbourRadioi 2050 961.0 1855 102 143
Weatherbird(research vessel)j 2048 961.0 1855 67 95
Pitt’s Bay(Hamilton)k 2000 960.0
Cambridge BeachesHotell 2100 953.0
Southhampton 2000 954.5m
Warwick Tower 1900 98 120n
Warwick Tower 1900 104 127o
Time is for sustained wind.a
Averaging period is 10 min.b
Storm surge is water height above normal astronomical tide level.c
Storm tide is water height above National Geodetic Vertical Datum (1929 mean sea level).d
TXKF maximum winds estimated at weather service building 130 ft asl.e
Rain data unreliable but total rainfall amounts were unlikely to exceed 3 in. Most observations reported only light f
rain and low visibility due to sea spray.
Airfield anemometer 40 ft asl; power failed at mast base due to storm surge at 1935 UTC.g
Instrument height 280 ft asl.h
Instrument heigh 255 ft asl; mast fell down shortly after peak gust at 1935 UTC. Pressure from barograph trace.i
Wind instrument not well exposed.j
Voluntary observer (barograph).k
West end of Bermuda; pressure from barograph (time not calibrated).l
Voluntary observer; Davis Instruments.m
Instrument height 157 ft agl.n
Instrument height 220 ft agl.o

-8-
Table 3. Available ship and drifting buoy reports with winds of at least 34 kt for Hurricane Fabian,2003.
Date/Time(UTC)
Ship call signor buoy ID
Latitude(°N)
Longitude(°W)
Winddir/speed (kt)
Pressure (mb)
03 / 1800 ELRU8 20.6 59.4 180 / 35 1014.5
05 / 0000 ELZU6 29.0 61.7 150 / 37 1014.0
05 / 0900 ELZU6 30.9 63.0 140 / 41 1010.0
05 / 2200 ELZU6 34.3 66.1 040 / 43 1003.0
07 / 1200 3FKD9 38.4 51.1 180 / 45 1007.3
07 / 2000 44551 43.5 45.7 150 / 39 1006.1
07 / 2100 44551 43.5 45.7 150 / 39 1003.2
08 / 0300 VEP717 46.7 48.7 010 / 35 993.8
08 / 0300 3FPK7 46.7 48.0 320 / 36 990.7
08 / 0300 HP6038 46.4 48.4 040 / 40 990.9
08 / 0600 ELVX4 43.0 40.8 200 / 35 1011.0
08 / 0600 VEP717 46.7 48.7 350 / 40 995.2
08 / 0600 3FPK7 46.7 48.0 340 / 37 992.7
08/ 0600 HP6038 46.4 48.4 310 / 41 993.6
08 / 0700 62711 47.3 45.8 320 / 70 985.7
08 / 0800 62711 47.3 45.8 350 / 45 985.5
08 / 0900 HP6038 46.4 48.4 290 / 36 1001.9
-9-
Table 4. Preliminary forecast evaluation (heterogeneous sample) for Hurricane Fabian, 27 August-8September 2003. Forecast errors (n mi) are followed by the number of forecasts in parentheses.Errors smaller than the NHC official forecast are shown in bold-face type. Verification includes thedepression stage, but does not include the extratropical stage, if any.
ForecastTechnique
Forecast Period (h)
12 24 36 48 72 96 120
CLP5 34 (46) 78 (44) 114 (42) 155 (40) 253 (36) 351 (32) 413 (28)
GFNI 27 (38) 52 (37) 73 (35) 90 (33) 147 (30)
GFDI 26 (43) 49 (42) 71 (40) 96 (37) 159 (33) 197 (29) 261 (25)
GFDL 28 (45) 50 (43) 71 (41) 92 (38) 154 (34) 201 (30) 240 (26)
LBAR 31 (45) 68 (43) 99 (41) 132 (39) 219 (35) 315 (31) 422 (27)
AVNI 27 (44) 51 (42) 77 (40) 114 (38) 181 (34) 191 (30) 275 (24)
AVNO 32 (45) 55 (43) 77 (41) 109 (39) 177 (35) 207 (31) 250 (25)
AEMI 26 (24) 51 (22) 74 (21) 100 (20) 177 (18) 277 (13) 469 (11)
BAMD 31 (46) 62 (44) 88 (42) 112 (40) 193 (36) 260 (32) 356 (28)
BAMM 37 (46) 73 (44) 106 (42) 140 (40) 219 (36) 286 (32) 358 (28)
BAMS 50 (45) 99 (43) 143 (41) 181 (39) 259 (35) 315 (31) 380 (27)
NGPI 24 (42) 46 (40) 73 (38) 98 (36) 156 (32) 220 (28) 274 (24)
NGPS 27 (43) 42 (41) 66 (39) 93 (37) 149 (33) 216 (29) 268 (25)
UKMI 29 (44) 53 (42) 69 (40) 80 (38) 103 (34) 190 (30) 248 (26)
UKM 29 (23) 52 (22) 77 (21) 89 (20) 100 (18) 171 (16) 229 (14)
A98E 32 (46) 61 (44) 102 (42) 144 (40) 248 (36) 327 (32) 403 (28)
A9UK 28 (23) 57 (22) 83 (21) 109 (20) 176 (18)
GUNS 19 (41) 37 (40) 55 (38) 75 (35) 109 (31) 159 (27) 216 (23)
GUNA 19 (41) 37 (40) 56 (38) 77 (35) 114 (31) 144 (27) 211 (21)
OFCL 25 (46) 45 (44) 64 (42) 83 (40) 114 (36) 136 (32) 206 (28)
NHCOfficial(1993-2002mean)
45(2985)
81(2726)
116(2481)
150(2230)
225(1819)
282(265)
374(216)

-10-
Table 5. Watch and warning summary for Hurricane Fabian, September 2003.
Date/Time(UTC)
Action Location
04/0900 Hurricane Watch Bermuda
04/1500 Hurricane Warning Bermuda
06/0300 Hurricane Warning Discontinued Bermuda
-11-
Figure 1. Best track positions for Hurricane Fabian, August/September 2003. Track during the extratropicalstage is based on analyses from the NOAA Ocean Prediction Center.

-12-
Figure 2. Selected wind observations and best track maximum sustained surface wind speed curve for HurricaneFabian, August/September 2003. Aircraft observations have been adjusted for elevation using 90%, 80%, and80% reduction factors for observations from 700 mb, 850 mb, and 1500 ft, respectively. Dropwindsondeobservations include actual 10 m winds (sfc), as well as surface estimates derived from the mean wind over thelowest 150 m of the wind sounding (LLM), and from the sounding boundary layer mean (MBL). Estimatesduring the extratropical stage are based on analyses from the NOAA Ocean Prediction Center.

-13-
Figure 3. Selected pressure observations and best track minimum central pressure curve for Hurricane Fabian,August/September 2003. Objective Dvorak estimates represent linear averages over a three-hour periodcentered on the nominal observation time. Estimates during the extratropical stage are based on analyses fromthe NOAA Ocean Prediction Center.