tropical dryland agroforestry on clay soils: analysis of...
TRANSCRIPT

Tropical dryland agroforestry on clay soils:
Analysis of systems based on Acacia senegal in the Blue Nile region, Sudan
El Amin Yousif Abdalla Raddad
Academic dissertation
To be presented, with the permission of the Faculty of Agriculture and Forestry of the
University of Helsinki, for public discussion in Auditorium II of the Infocentre,
Viikinkaari 11, on 19 July 2006 at 12 o’clock noon
Helsinki 2006

2
Supervisor: Professor Olavi Luukkanen Director Viikki Tropical Resources Institute (VITRI)
Department of Forest EcologyUniversity of HelsinkiHelsinkiFinland
Reviewers: Docent Veli PohjonenVärriön tutkimusasemaUniversity of HelsinkiRuuvaojaFinland
Dr. John DeromeMetla (Finnish Forest Research Institute)RovaniemiFinland
Opponent: Professor (Emer.) Peter M.A. TigerstedtUniversity of HelsinkiHelsinkiFinland

3
ABSTRACT
Acacia senegal, the gum arabic producing tree, is the most important component intraditional dryland agroforestry systems in the Blue Nile region, Sudan. The aim of thepresent study was to provide new knowledge on the potential use of A. senegal indryland agroforestry systems on clay soils, as well as information on tree/cropinteraction, and on silvicultural and management tools, with consideration on systemproductivity, nutrient cycling and sustainability. Moreover, the aim was also to clarifythe intra-specific variation in the performance of A. senegal and, specifically, theadaptation of trees of different origin to the clay soils of the Blue Nile region.
In agroforestry systems established at the beginning of the study, tree and crop growth,water use, gum and crop yields, nutrient cycling and system performance wereinvestigated for a period of four years (1999 to 2002). Trees were grown at 5 x 5 m and10 x 10 m spacing alone or in mixture with sorghum or sesame; crops were also grownin sole culture.
The symbiotic biological N2 fixation by A. senegal was estimated using the 15N naturalabundance ( 15N) procedure in eight provenances collected from differentenvironments and soil types of the gum arabic belt and grown in clay soil in the BlueNile region. Balanites aegyptiaca (a non-legume) was used as a non-N-fixing referencetree species, so as to allow 15N-based estimates of the proportion of the nitrogen intrees derived from the atmosphere.
In the planted acacia trees, measurements were made on shoot growth, water-useefficiency (as assessed by the 13C method) and (starting from the third year) gumproduction. Carbon isotope ratios were obtained from the leaves and branch woodsamples.
The agroforestry system design caused no statistically significant variation in wateruse, but the variation was highly significant between years, and the highest water useoccurred in the years with high rainfall. No statistically significant differences werefound in sorghum or sesame yields when intercropping and sole crop systems werecompared (yield averages were 1.54 and 1.54 ha-1 for sorghum and 0.36 and 0.42 t ha-1
for sesame in the intercropped and mono-crop plots, respectively). Thus, at an earlystage of agroforestry system management, A. senegal had no detrimental effect on cropyield, but the pattern of resource capture by trees and crops may change as the systemmatures.
Intercropping resulted in taller trees and larger basal and crown diameters as comparedto the development of sole trees. It also resulted in a higher land equivalent ratio. Whengum yields were analysed it was found that a significant positive relationship existedbetween the second gum picking and the total gum yield. The second gum picking

4
seems to be a decisive factor in gum production and could be used as an indicator forthe total gum yield in a particular year.
In trees, the concentrations of N and P were higher in leaves and roots, whereas thelevels of K were higher in stems, branches and roots. Soil organic matter, N, P and Kcontents were highest in the upper soil stratum. There was some indication that the Pcontent slightly increased in the topsoil as the agroforestry plantations aged. At astocking of 400 trees ha-1 (5 x 5 m spacing), A. senegal accumulated in the biomass atotal of 18, 1.21, 7.8 and 972 kg ha-1of N, P, K and OC, respectively. Trees contributedca. 217 and 1500 kg ha-1 of K and OC, respectively, to the top 25-cm of soil over thefirst four years of intercropping.
Acacia provenances of clay plain origin showed considerable variation in seed weight.They also had the lowest average seed weight as compared to the sandy soil (western)provenances.
At the experimental site in the clay soil region, the clay provenances were distinctlysuperior to the sand provenances in all traits studied but especially in basal diameterand crown width, thus reflecting their adaptation to the environment. Values of 13C,indicating water use efficiency, were higher in the sand soil group as compared to theclay one, both in leaves and in branch wood. This suggests that the sand provenances(with an average value of -28.07‰) displayed conservative water use and high droughttolerance. Of the clay provenances, the local one (Bout) displayed a highly negative (-29.31‰) value, which indicates less conservative water use that resulted in highproductivity at this particular clay-soil site. Water use thus appeared to correspond tothe environmental conditions prevailing at the original locations for these provenances.
Results suggest that A. senegal provenances from the clay part of the gum belt areadapted for a faster growth rate and higher biomass and gum productivity as comparedto provenances from sand regions. A strong negative relationship was found betweenthe per-tree gum yield and water use efficiency, as indicated by 13C. The differencesin water use and gum production were greater among provenance groups than withinthem, suggesting that selection among rather than within provenances would result indistinct genetic gain in gum yield.
The relative 15N values (‰) were higher in B. aegyptiaca than in the N2-fixing acaciaprovenances. The amount of Ndfa increased significantly with age in all provenances,indicating that A. senegal is a potentially efficient nitrogen fixer and has an importantrole in agroforestry development. The total above-ground contribution of fixed N tofoliage growth in 4-year-old A. senegal trees was highest in the Rahad sand-soilprovenance (46.7 kg N ha-1) and lowest in the Mazmoom clay-soil provenance (28.7 kgN ha-1). This study represents the first use of the 15N method for estimating the Ninput by A. senegal in the gum belt of Sudan.

5
Key words: Acacia senegal, agroforestry, clay plain, 13C, 15N, gum arabic, nutrientcycling, Ndfa, Sorghum bicolor, Sesamum indicum
Author’s address:El Amin Y. RaddadViikki Tropical Resources Institute (VITRI)P. O. Box 27. FI-00014 University of Helsinki, FinlandTel: +358-9-58647; Fax: +358-9-58646; e-mail: [email protected]

6

7
PREFACE
The work reported here was carried out at the Viikki Tropical Resources Institute(VITRI), Department of Forest Ecology, University of Helsinki, as a part of theresearch project “Integrated Forest Resources Management for CombatingDesertification in Sudano-Sahelian Africa”, and later, the project “Trees, agroforestryand land use in dryland Africa” (TALDA), both financed by the Academy of Finland.The study also received funding during the field period in Sudan from the AgriculturalResearch Corporation of the Sudan. Moreover, the study received funding from theUniversity of Helsinki at its later stages.
I am grateful to my supervisor Prof. Olavi Luukkanen, who offered me an opportunityto join VITRI. His passion, excellent guidance, valuable criticism, prompt support andcontinual interest throughout the working process were considerably crucial and deeplyappreciated. I am also obliged to the reviewers of this thesis, Docent Veli Pohjonen andDr. John Derome for their constructive comments. I am greatly indebted to Dr.Mohamed A. Elfadl for exchange of information, constructive and long discussion andto his family for the privilege of their strong support and friendship.
The assistance of the Forestry Research Centre and Damazin Research Station staff inSudan is acknowledged. The author is greatly indebted to many colleagues andmembers at the ARC, FRC, and DRS, for their excellent support throughout thefieldwork. I list them hereafter without title: Ahmed Ali Salih, Ibrahim Nour Eldin,Elsheikh A. Elsheikh, Abbas A. Elsheikh, Mohamed A. Khateeb, Faroug M. Basheer,Abdelhalim A. Babekir, Shama Elamin, Kamal Hamad, Inaam Eltahir, Obayi A.Yousif, Osman A. Abdelrahman, Faisal Bushari, Elamin El Zubeir, Dafalla Salim,Sulaiman Idris, El Rayah Dafalla, Mamoun Gasim Musa and El Faith Farah.
The author is grateful to Marjut Wallner for the analysis of the plant and soil nitrogenand organic carbon and to Eloni Sonninen for carrying out the 13C and 15N analyses. Ithank Prof. Hannu Ilvesniemi, previously Head, Dept. of Forest Ecology, University ofHelsinki, and Pekka Nygren, Frank Berninger and Hannu Rita for their valuablediscussion and comments.
I wish to express my appreciation to my colleagues and friends at VITRI, with whom Ihad useful discussions and suggestions. I again list them promptly with no title; I thankVesa Kaarakka, Jörn Laxén, Teija Reyes, Mark Appiah, Riikka Otsamo, AbdallaGaafar, Eddie Glover, Eshetu Yirdaw, Anu Eskonheimo, Minna Hares, Sakina Elshibli,Ping Zhou, Kurt Walter, Omar Abdi, Maarit Kallio, Talvikki Aittoniemi, OlliTaskinen, Jukka Lippu, Sirkka Bergström, Varpu Heliara, Wending Huang, Syed Alamand Fobissie Kalame.

8
Many thanks go to the members of the Finnish society who have cordially welcomedme and my family through the whole study period for their gracious hospitality, andfrom whom we have gained knowledge of many things, for example, how to survive inFinland during a cold winter.
Last but not least, very special thanks are due to my wife Wissal Abdel Rahman andmy daughter Isrra, who have been my companions throughout my study. Their supportand enthusiasm have provided the incentive for the successful completion of this study.
Helsinki, April 2006El Amin Yousif A. Raddad

9
LIST OF ORIGINAL PAPERS
This thesis is based on the following original articles, which are referred to in the textby their respective Roman numerals (I-V).
I. Raddad, E.Y., Luukkanen, O., Salih, A.A., Kaarakka, V. and Elfadl, M.A. 2006.Productivity and nutrient cycling in young Acacia senegal farming systems on Vertisolin the Blue Nile region, Sudan. Agroforestry Systems.http://www.springerlink.com/agfo. DOI: 10.1007/s10457-006-9009-6
II. Raddad, E.Y. and Luukkanen, O. 2005. The influence of different Acacia senegalagroforestry systems on soil water and crop yields in clay soils of the Blue Nile region,Sudan. Agricultural Water Management. (Accepted). http://www.elsevier.com/agwat/
III. Raddad, E.Y. 2006. Ecophysiological and genetic variation in seedling traits andin first-year field performance of eight Acacia senegal provenances in the Blue Nile,Sudan. New Forests (NEFO23R1). http://www.springerlink.com/nefo.
IV. Raddad, E.Y. and Luukkanen, O. 2006. Adaptive genetic variation in water useefficiency and gum yield in Acacia senegal provenances grown on clay soil in the BlueNile region, Sudan. Forest Ecology and Management 226: 219-229.http://www.elsevier.com/locate/foreco. doi:10.1016/j.foreco.2006.01.036
V. Raddad, E.Y., Salih, A.A., Elfadl, M.A., Kaarakka, V. and Luukkanen O. 2005.Symbiotic nitrogen fixation in eight Acacia senegal provenances in dryland clays ofthe Blue Nile Sudan estimated by the 15N natural abundance method. Plant and Soil275: 261-269. http://www.springerlink.com/plso. DOI: 10.1007/s11104-005-2152-4
NB: These publications should be referred to according to the bibliographicinformation given above. No reference to the reprints in this thesis should be made.
In studies I and V, E.Y. Raddad introduced the research idea, organized experimentalarrangements, collected and analyzed the data and prepared the manuscripts whichwere revised jointly with the rest of the authors. During the study period in Sudan,A.A. Salih and M.A. Elfadl provided support in methodological phases.In studies II and IV, E.Y. Raddad introduced the research idea, organized theexperimental arrangements, collected and analyzed the data in Sudan and prepared themanuscripts which were revised by O. Luukkanen.

10

11
TABLE OF CONTENTS
ABSTRACT.............................................................................................................. 3
PREFACE................................................................................................................. 7
LIST OF ORIGINAL PAPERS ............................................................................... 9
LIST OF ACRONYMS AND ABBREVIATIONS ................................................ 13
1. INTRODUCTION............................................................................................... 151.1 BACKGROUND ................................................................................................. 151.2 VERTISOLS (CLAY SOILS) ................................................................................. 161.3 DRYLANDS ...................................................................................................... 171.4 THE GUM ARABIC BELT .................................................................................... 181.5 AGROFORESTRY .............................................................................................. 191.6 EFFECTIVE RAINFALL....................................................................................... 221.7 AIMS OF THE STUDY......................................................................................... 231.8 HYPOTHESES OF THE STUDY............................................................................. 24
2. THEORETICAL FRAMEWORK ..................................................................... 25
2.1 SOIL WATER AVAILABILITY AND DRAINAGE ..................................................... 252.2 EFFECT OF A. SENEGAL ON SOIL WATER ............................................................ 262.3 CROP YIELD AND PRODUCTIVITY...................................................................... 272.4 TREE GROWTH IMPROVEMENT ......................................................................... 29
2.4.1 Roots and root system................................................................................ 292.5 PHYSIOLOGICAL ADAPTATION.......................................................................... 30
2.5.1 General considerations ............................................................................. 302.5.2 Adaptation and adaptive attributes ............................................................ 312.5.3 Water use efficiency .................................................................................. 32
2.6 DRY-MATTER PRODUCTION.............................................................................. 332.7 NUTRIENT AND ORGANIC MATTER ACCUMULATION ......................................... 33
2.7.1 Nutrient cycling......................................................................................... 332.7.2 Nitrogen dynamics .................................................................................... 362.7.3 Phosphorus dynamics................................................................................ 372.7.4 Potassium dynamics .................................................................................. 38
2.8 PLANT NITROGEN ISOTOPE COMPOSITION......................................................... 392.9 CARBON ISOTOPE COMPOSITION....................................................................... 39
3. MATERIAL AND METHODS .......................................................................... 423.1 RESEARCH SITE................................................................................................ 423.2 EXPERIMENTAL DESIGN ................................................................................... 42
3.2.1 Effect of Acacia senegal on two field crops................................................ 423.2.2 Physical soil analysis and soil water content ............................................. 433.2.3 Provenance testing.................................................................................... 44
3.3 PLANT AND SOIL SAMPLES ............................................................................... 45

12
3.4 NUTRIENTS ANALYSES..................................................................................... 453.5 NUTRIENT UPTAKE........................................................................................... 463.6 DISCRIMINATION MEASUREMENTS OF CARBON AND NITROGEN ISOTOPES......... 463.7 ESTIMATES OF N2 FIXATION ............................................................................. 473.8 LEAF BIOMASS ESTIMATES ............................................................................... 473.9 DATA ANALYSIS .............................................................................................. 47
4. RESULTS............................................................................................................ 494.1 SOIL CONDITIONS............................................................................................. 494.2 WATER USE ..................................................................................................... 494.3 EFFECT OF ACACIA SENEGAL ON CROP YIELD (STUDIES I, II).............................. 494.4 EFFECT OF CROPS ON TREES............................................................................. 504.5 TREE GUM YIELD (STUDIES I, IV) ..................................................................... 504.6 NUTRIENT CONTENT (STUDY I) ........................................................................ 54
4.6.1 Nutrients amounts in the soil ..................................................................... 544.6.2 Nutrient and C concentrations of trees ...................................................... 564.6.3 Nutrient amount of crops (Study I) ............................................................ 56
4.7 TREE PROVENANCE VARIATION (STUDIES III, IV, V) ........................................ 574.7.1 Carbon isotope composition 13C)............................................................ 614.7.2 Estimates of biological N2 fixation (Study V) ............................................ 63
5. DISCUSSION...................................................................................................... 675.1 EFFECT OF ACACIA SENEGAL ON CROP YIELD..................................................... 675.2 TREE GROWTH PARAMETERS............................................................................ 685.3 NUTRIENT CONCENTRATIONS AND UPTAKE BY TREES....................................... 695.4 NUTRIENT CONCENTRATION AND UPTAKE IN CROPS ......................................... 705.5 NUTRIENT DYNAMICS UNDER CULTIVATION..................................................... 705.6 NITROGEN INPUT OF A. SENEGAL ...................................................................... 715.7 PROVENANCE VARIATION AND ADAPTATION.................................................... 725.8 CARBON ISOTOPE COMPOSITION....................................................................... 74
6. CONCLUSIONS................................................................................................. 75
REFERENCES ....................................................................................................... 78
13
LIST OF ACRONYMS AND ABBREVIATIONS
13C/12C Carbon isotope ratios15N/14N Nitrogen isotope ratiosAF AgroforestryAI Aridity indexANOV Analysis of varianceARC Agricultural Research Corporation (Sudan)C/N Carbon to nitrogen ratioCa Atmospheric carbon dioxide concentrationCi Intercellular carbon dioxide concentrationDRS Damazin Research StationET EvapotranspirationFAO Food and Agriculture Organization of the United NationsFNC Forests National CorporationFRC Forestry Research Centreha HectareHSD Honestly significant differenceIAEA International Atomic Energy AgencyICRAF International Centre for Research in Agroforestry (World Agroforestry
Centre)IES Institute of Environmental Studies (Sudan)IIED International Institute for Environment and Development (UK)ISRIC International Soil Reference and Information CentreISSS International Society of Soil ScienceLER Land equivalent ratioMg m-3 Megagram per cubic meterNAR Net assimilation rateNdfa Nitrogen derived from the atmosphereNPK Nitrogen, phosphorus, potassiumNWFP Non-wood forest productOC Organic carbonP Phosphorus (also precipitation)PDB Pee Dee BelemnitePET Potential evapotranspirationPUE Precipitation use efficiencyR2 Coefficient of determinationRCBD Randomized complete block designRGR Relative growth rateSOM Soil organic matterSWC Soil water contentSWS Soil water storageTE Transpiration efficiency

14
VAM Vesicular-arbuscular mycorrhizal fungiWC Water contentWU Water useWUE Water use efficiency
13C Difference in the relative abundance of the heavy carbon isotope (13C)15N Difference in the relative abundance of the heavy nitrogen isotope(15N)

15
1. INTRODUCTION
1.1 Background
In recent years, the land use in Sudan has been characterized by large-scale landdegradation and loss of tree cover. These two processes are interrelated and caused byhuman activities, such as wood harvesting, overgrazing and land clearing for farmlandexpansion. Deprived farmers have responded to declining land productivity byabandoning their existing degraded cropland and moving to new lands for cultivationof their rainfed agricultural crops.
Over the last few decades there has been a clear evident southwardly recede of isohyetscoupled with more frequent droughts. This may be a constant trend or just a stage of along cycle (cf. Eskonheimo 2006). This phenomenon combined with overgrazing andremoval of the tree cover for various purposes may be causing desert encroachmentand perhaps a similar recede of the boundaries of all ecological zones. There have alsobeen changes in the quality of their vegetation composition. Some species that wereonce dominant or very conspicuous have greatly decreased, some almost to the edge ofextinction (Mahmoud et al. 1996).
The national strategy of Sudan for agriculture and natural resources aims atconservation and development of these resources. It aims at increasing of the forestarea by 25% of the present area up to a total of ca. 70 million ha. It also aims atintegration of agriculture and forestry by introduction of trees into the farming systems,so as to cover 20% of the land area in irrigation schemes and 10 to 20% of that in therain-fed sector, whether mechanized or traditional. The strategy also aims at increasingthe gum arabic production to 60, 000 tons annually, as well as paying attention to othernon-wood forest products (NWFPs).
Acacia senegal (L.) Willd. (“hashab” in Arabic), a leguminous tree species belongingto the Mimosoideae subfamily, is the main agroforestry tree species in Sudan with awide natural distribution in the Sudano-Sahelian zone of Africa (Raddad 1987, Ballal2002). The tree is highly variable, with four distinct varieties recognized (Wickens etal. 1995). The variety senegal with which we are concerned here is the main source ofgum arabic and a well-established traditional agroforestry tree component.
In the clay plains of the Blue Nile region in Sudan, extensive mechanized rainfedcultivation of sorghum, sesame, sunflower and other annual crops is practiced. Largeareas have been completely cleared of tree cover. The productivity of these field cropshas declined because of loss of soil fertility. As there is little deposition, accumulationor decomposition of soil organic material in this dryland environment, the natural soilfertility is threatened (Ardö and Olsson 2003). As a result, much of the abandonedfarmland has been given to the national forest service (Forests National Corporation,FNC) for reforestation.

16
Many authors have already shown that traditional agroforestry with A. senegal is anideal example for sustainable natural forest management. The dramatic increase in theanimal and human population has led to increased pressure on the available naturalresources, particularly land and the woody vegetation. Furthermore, intensivecultivation, overgrazing and tree cutting has led to land degradation and, consequently,decreased the land productivity. These factors have resulted in food shortage, poverty,and lack of fodder and fuelwood.
The traditional production of gum arabic from the acacia trees of this agroforestrysystem is an off-season income-generating activity for most of the farmers in thisregion. Gum yields have decreased, however, because of biotic, physical,socioeconomic and institutional reasons. There is a need to look at this traditionaldryland management from a more holistic perspective. Proper integration of the gum-yielding tree into the production system needs to be evaluated and studied from a cropand tree physiology viewpoint, since, in contrast to western Sudan where agroforestryis practiced on sandy soil, in the Blue Nile clay plains A. senegal has only recentlybeen introduced into the farming systems. Understanding the water balance of thesystem and the nutrient cycling is of paramount importance for the future managementsustainability.
1.2 Vertisols (clay soils)
Vertisols are dark montmorillonite-rich clays with characteristics shrinking/swellingproperties. This group of soils with a high clay content (>30% to at least 50 cm fromthe surface) and in dry condition with typical cracks which are at least 1 cm wide andreach a depth of 50 cm or even more is often also called heavy cracking clay soil.When this clay soil rewets it clasps and the result is a soil that mixes up preventing theformation of the distinct horizons found in most other soil orders. Vertisols are fertile,rich in organic matter, high in clay and low in permeability. Vertisols form distinctcracks in the dry season that can tear plant roots. The dry period can seriously limit thetypes of crops that can grow on these soil types. They have a very high water holdingcapacity and are normally very high in fertility. They are difficult to till when eitherwet or dry without destruction of the soil structure (Bunting and Lea 1962, FAO 1998).
The typical clay soil of the Blue Nile region is dark-coloured, alkaline (pH ≤ 8) anddries during the dry season forming very deep cracks; these cracks are 2-15 cm wide atthe surface, and they turn narrower downwards and elongate as far as to 150 cm depth.With the advent of the rains, the clay absorbs moisture mainly through these cracks andswells, which closes the cracks. After this, the water penetration is extremely slow andtemporary flooding or water-logging is frequently experienced, especially after heavyshowers (El Houri 1986).

17
1.3 Drylands
Drylands are defined as areas where the ratio of the mean annual precipitation (P) topotential evapotranspiration (PET) is less than 0.65. They are classified into fourclimatic zones on the basis of aridity index (AI) values, defined as hyper-arid (<0.03),arid (0.03 to <0.20), semi-arid (0.20 to <0.50) and dry sub-humid (0.50 to 0.65;Middleton and Thomas 1997).
Globally, drylands cover 40% of the Earth’s total land surface, excluding the hyper-arid lands that cover about 8% (UNDP/UNSO 1997). Out of this total area, the arid,semi-arid and dry sub-humid zones cover 12%, 18% and 10%, respectively. In Africa,drylands cover 43% of the land, and about 65% of the countries are classified asdryland countries (Ffolliott et al. 2002, IUFRO 2004).
Dryland boundaries are constantly changing, because of high inter-annual variability inthe mean rainfall and the occurrence of droughts that may last for periods of severalyears at a time. Delineation of dryland boundaries therefore requires caution because ofthe processes inherent in dryland climatic regimes on the one hand, and the effects dueto human activities on the other (Ffolliott et al. 2002).
On drylands, desertification and poverty are distinct but interlinked phenomena withtheir underlying causes and consequences. Desertification is now clearly understood asland degradation in arid, semi-arid and dry sub-humid areas resultant from variousfactors, including climatic variation and human activities (Middleton and Thomas1997). Thus, it can correctly be stated that drylands are constrained by factors relatedto natural causes, threatened and accelerated by factors related to anthropogenic causes(IUFRO 2004).
One-half of the world's countries have portions or all of their land in drylandenvironments. These lands and their sub-humid margins equal to one-third of theglobe's surface and are the home to almost 40 percent of the world's population (Whiteet al. 2002). They include hotspots where land and environmental degradation isoccurring at alarming rates, often leading to desertification, and threatening thelivelihood of more than one billion people. Drylands vary in terms of their climate,soils, flora, fauna, land use, and people. One common feature of all drylandenvironments, however, is their resilience in terms of recovery from effects of drought(IUFRO 2004).
On drylands, water availability is a primary factor controlling plant growth processesand productivity (Kramer and Kozlowski 1979, Bewley and Krochko 1982). Explicitly,it has been observed that in dry environments about 90% of the diameter growth inwoody plants is attributed to water availability (Zahner 1968).
18
One of the most important factors to consider in planning and management of drylandresources is the rainfall intensity and variability. Because the soils of drylandenvironments often cannot absorb all of the rain that falls in intensive storms, water isfrequently lost in runoff and seepage processes. At the opposite extreme of thespectrum, the water from a rainfall of low intensity can be lost through evaporation andevapotranspiration when the rain falls on a dry soil surface. Rainfall intensity alsorelates to the risk of soil erosion. Individual raindrops carry enough energy capable ofremoving topsoil upon impact, causing splash erosion, which can degrade or destroythe soil structure over time (Brooks et al. 2003).
The water-holding capacity of the dryland soils and their ability to supply nutrients areof primary importance to planners and managers of natural and agricultural resources.Soil depth and texture largely govern the amount of water that infiltrates or can be heldin a soil body. However, a hardpan layer, restricting water-holding capacities androoting depth, often limits the depth of soils in dryland regions. These hardpans consistof CaCO3 or other materials that can be continuous and occur between 5 and 60 cmbelow the surface. Rates of deposition, accumulation, and decomposition of organicmaterial are low in dryland environments, hence the natural soil fertility is low. Thelimited organic matter that is present can be quickly lost when soils are cultivated foragricultural crop production. The extensive leaching of nutrients and intensiveweathering of minerals on older exposed surfaces often characterize the soils (Brookset al. 2003).
1.4 The gum arabic belt
“The gum arabic belt”, where A. senegal grows naturally, coincides with the area ofcentral Sudan mainly between latitudes 10º and 14º N. The two most conspicuous gumarabic belt areas outside these limits are the northeast (Faw-Gedaref-Kassala), and inthe southeast along the Blue Nile/Upper Nile states border (Fig. 1).
The total gum belt area in Sudan amounts to 520,000 km2, which is equal to one-fifthof the area of the country. A field survey conducted in 1989 indicated that there existedscarcely any A. senegal north of latitude 13º 45´ in Kordofan or Darfur (IIED and IES1990). The gum belt provides a buffer against desertification across the vast region ofthe Sudano-Sahelian zone. A. senegal provides a variety of valuable economic andecological functions, such as gum arabic, fodder for livestock, fuelwood and shade, aswell as many indirect benefits associated with the tree. Its extensive and massive rootsystem reduces soil erosion and runoff, and, as a leguminous tree, it fixes nitrogenwhich encourages grass and crop growth. The tree is also essential in sand dunefixation for these reasons; it is the preferred species in bush-fallow rotational andintercropping farming systems in the drylands of western Sudan (Barbier 2000).

19
1.5 Agroforestry
Agroforestry is defined as “intensive land-use management that optimizes the benefits(whether physical, biological, ecological, economic or social) from biophysical
Fig. 1. Map of Sudan with Acacia senegal provenance locations. Broken lines show the gumarabic belt boundaries. Average monthly rainfall (mm) of the two contrasting regions forprovenances is shown. Numbers 1, 2, 3, 4, 5, 6, 7 and 8 stand for provenances Bout,Mazmoom, Gedaref, Domokeya, Nabag, Saata, Rahad and Semaih, respectively (modifiedafter FAO 2003).
0
500
Study site
0
500
Prec
ipita
tion
(mm
)
M onth
MonthPrec
ipita
tion
(mm
)
0
500
Study site
0
500
0
500
Study site
0
500
0
500
Study site
0
500
0
500
Study site
0
500
Prec
ipita
tion
(mm
)
M onth
MonthPrec
ipita
tion
(mm
)
NN
0 350 km

20
interactions created when trees and/or shrubs are deliberately combined with cropsand/or livestock” (Gold et al. 2000).
Traditionally, farmers on the drylands of Africa have developed a wide range ofagroforestry and soil conservation strategies to adapt their crop and livestockproduction systems to the marginal conditions of their lands and to minimize climaticrisks to household and food supply. The strategies include deliberate preservation ofselected valuable trees and shrubs in cropped fields and the use of tree/shrub biomass(leaves and twigs) as mulch on crusted or compacted soils to improve the organicmatter input and soil structure. Agroforestry involves management systems thatincorporate a tree or shrub component in the agricultural landscape, and it can increaseboth the carbon storage and biodiversity in areas where annual crops or degraded landsare predominant.
Agroforestry has shown promising results in the rehabilitation of degraded lands. Withits low level of inputs and multipurpose-tree species focus, agroforestry as a landrestoration strategy also shows a significant potential for small-scale subsistencefarmers in dryland and developing regions. The presence of trees in an agriculturalsystem can have a significant influence by increasing the soil fertility and ecosystemproduction capacity as a whole. Although agroforestry systems have been seen as ageneral solution for the reclamation of degraded lands, it is important to note that theultimate success depends on the ability to increase the related knowledge among allpartners involved and on the acceptance by farmers and local communities (Nair 1993,Buck et al. 1999, Eskonheimo 2006).
The traditional A. senegal agroforestry system practiced for centuries in the Sudano-Sahelian zone can be seen as a complex and dynamic resilient system reacting to a widevariety of long-term external changes and short-term disturbances related to climate,topography, soils, geomorphology, herbivores, fires and human intervention. Animportant general conclusion has been that, in dryland environments, the effects of globalclimate change are of increasing concern and the main attention is directed towardsmanagement and policy improvements (IUFRO 2004). Moreover, considerations foradaptation to climate change have been exemplified for Sudan in particular by Abdalla etal. (2002).
The inherent ability of dryland acacias to restore the land productivity is supported byevidence from traditional farming practices as well as from scientific research (Fries1995). Understanding the nature of coexistence between the components of theecosystem, which under other circumstances are mutually exclusive or unequalpartners, yields theoretical insights and has practical implications for sustainablemanagement.
The changes that occur in natural systems in the Sudano-Sahelian zone are mainlythose of limited disturbance. Much competition among plants takes place below

21
ground, where root systems influence the biogeochemistry, hydrology and primaryproduction. In contrast, soil characteristics play a significant role in plant speciesdistribution through their effects on root system development and, subsequently, on theestablishment and growth of plant communities. As shown in related earlier studies(Gaafar et al. 2005), water is the main factor limiting plant growth; the competition issevere between the woody plants and agricultural crops for both water and nutrients.
A. senegal is a deep-rooted tree species capable of efficiently using soil resources, andits presence can increase the overall biomass productivity. However, agroforestryresearch especially concentrates on the competition between trees and crops in the top50 to 60 cm soil layer (Ong et al. 1996, Livesley et al. 2002).
The diverse patterns of growth and development in natural A. senegal trees ispresumably a result of adaptation. Little is known on how site and climatic factorsinfluence the balance between above and below-ground components or how thesefactors affect the gum arabic production. Preliminary results from the earlier phases ofthe present research project show that the gum production per tree is higher at highertree densities (Ballal et al. 2005). Such results are surprising, again suggesting thatmore research needs to be done.
On drylands, combinations of agricultural cropping, livestock production, forestry, andother types of production systems are frequently placed on the same piece of landrotationally or simultaneously. Regardless of the nature of these combinations, the goalis attaining ecological stability and sustainable benefits to the users of the land.
Land use sustainability is a challenge to the people living in dryland environments.Problems that commonly challenge these people include desertification, poverty andlow levels of investment. However, people can also confront major problems inattempting to attain a level of sustainable land use because of their inadequateknowledge of alternative land use practices (Ffolliott et al. 1995, Squires and Sidahmed1998). Many people have a "tradition" in agriculture that is not always matched by asimilar attitude towards other land uses such as forestry, wildlife ranching, orecotourism, all of which have these days become profitable enterprises in manydryland regions of the world. This lack of appreciation can be a barrier to the initiationof these land uses, especially on marginal agricultural lands. The barriers are oftenovercome through new land tenure arrangements, the education of people, extensionservices, and, most of all, through demonstrating the benefits obtained by morediversified land-use activities (IUFRO 2004).
Cannell et al. (1996) argued that agroforestry may increase the productivity, providedthe trees capture resources which are under-utilized by crops. In annual systems wherethe land lies bare for extended periods, the residual water remaining in the soil afterharvest and the off-season rainfall are often unused. For instance, in the drylands of theBlue Nile (with a mean annual rainfall of about 730 mm), substantial amounts

22
available water remain in the top one-metre soil layer after harvesting the crops, andthis water could be used by trees, thus improving the water use and productivity of thelands (Ong et al. 1996).
The drylands of the world suffer from a vicious cycle of low productivity, low levels ofinvestment, and, as a result, poverty. Investments, apart from those made for irrigatedagriculture activities, are relatively low (Marples 1986, Ffolliott et al. 1995, Squiresand Sidahmed 1998). Low productivity, low levels of investment, and land degradationoften leading to desertification are responsible for regional poverty and incomedifferences. The poverty and hunger that are predominant in sub-Saharan Africa are apoignant example of this situation. Other critical problems include the inherentproblems of water scarcity, tenure considerations, and ineffective developmentalpolicies. Improving this situation requires that a variety of technical and institutionalproblems be solved. Among these solutions is increasing the level of investments inappropriate agriculture, alternative land use practices, and other appropriate income-generating interventions. Other solutions are designing strategies for risk managementand implementing programmes for more equitable land distribution and levels ofincome (IUFRO 2004).
1.6 Effective rainfall
Effective rainfall is that portion of the total rainfall where part of the rain may be lostby surface runoff, deep percolation below the root zone or by evaporation of the rainintercepted by the plant foliage. The effective rainfall is assumed as 80% of the totalrainfall (Doorenbos and Pruitt, 1975; Sudan Meteorological Department, 2002).
In regions where high-intensity rains occur, only a portion of the water can pass thesoil and be stored in the root zone; hence the effectiveness of rain is consequently low.In case of light rains, interception by the plant foliage can be important; wet plants tendto transpire less, which is offset by increased evapotranspiration of the rainwaterintercepted by the plant foliage. In practice, for conditions where the ground is fullycovered, it has been assumed that intercepted light rainfall is close to 100% effective.Where crops do not cover a high percentage of the ground and the soil surface has beendry for some time before rain, evaporation from the wet soil surface can beconsiderable. Rainfall of 6 to 8 mm per day may essentially all be lost by evaporation.Even rains of 25 to 30 mm during initial and early crop development stages with a lowpercentage of ground cover may result in a net gain of only 60% of the rain received(Doorenbos and Pruitt 1975, Allen et al. 1998).
Different countries use different criteria to estimate the effective rainfall as apercentage of total rainfall. In India, one method considers 70% of the averageseasonal rainfall to be effective. In another, the effective rainfall is taken as the meanrainfall but excluding a daily rainfall of less than 5 mm and in excess of 75 mm in one

23
day and 125 mm in ten days. In Thailand, 80% of the November and 90% of theDecember to March rainfall is taken as effective. In Japan, for non-submerged rice, therainfall is assumed 80% effective, but a daily rainfall below 1.85 mm and above 30mm is discarded; when effective rainfall and residual soil water on the previous dayexceeds 30 mm, the surplus is excluded from calculations.
A rough guide to estimating effective rainfall is the method of the US Bureau of theReclamation for use in arid and semi-arid regions. Mean season precipitation of thedriest one in consecutive years is used as the basis, while the effectiveness ofincrements of monthly rainfall ranges from 90% for the first 25 mm to 0% forprecipitation greater than 150 mm (Doorenbos and Pruitt 1975).
1.7 Aims of the study
General objectives
The main aim of the present study was to provide new knowledge on the potential useof A. senegal in dryland agroforestry systems on clay soils, and to provide silviculturaland management tools, with consideration for agroforestry system productivity,nutrient cycling and sustainability. The study was also carried out acknowledging thefact that dryland ecosystems in the Blue Nile constitute a carbon sink potentiallyaffected by agroforestry and other forms of land use. An ultimate general aim was toprovide guidance for designing suitable agroforestry systems for clay soil in Sudan forland rehabilitation and suitable land use, so as to contribute to increased environmental,production and social benefits and services.
Specific objectives
The specific objectives were as follows:
1. To analyse the soil water characteristics associated with two agricultural cropscommonly used in dryland agroforestry in Sudan, sorghum, and sesame. Anattempt was made also to determine the effect of trees on crop performance and thegeneral availability of water for agricultural crops in clay soils.
2. To clarify the growth and gum yield performance and physiological behaviour ofdifferent A. senegal provenances grown in agroforestry systems on clay soil inrelation to conditions of their original habitats, so as to assess their geneticvariability and adaptation for the purpose of finding suitable acacia stocks forsustainable land use.

24
3. To study and determine the nutrient cycling and balance for N, P, K and OC in thesoil in relation to different production system designs represented by sole A.senegal stands, intercropping and sole agricultural crops.
1.8 Hypotheses of the study
The following hypotheses were set:
1. A. senegal competes for water with agricultural crops, and the soil water contentwould vary spatially depending on tree density; competition for water would alsodepend on tree spacing and management.
2. The microclimate created by trees in the agroforestry system would favourablyaffect the soil water content and improve the growth of associated crops as well as theoverall productivity of this intercropping system.
3. Agroforestry systems based on A. senegal increase crop and tree yields given thatthey utilise more water and nutrients than annual cropping systems (reflectingfacilitation and sharing of resources).
4. Nutrient balance and cycling in A. senegal-based agroforestry systems is moreefficient compared to monoculture of agricultural crops; the rate at which the nutrientcapital is increased in trees and surface soil during the cropping period is important inestablishing a simple relationship between site nutrient enrichment and the density andage of trees.
5. Competition for resources between trees and crops occurs under the ground ratherthan above the ground.
6. Local clay-soil A. senegal provenances are well adapted to their sites, and theymaintain a high water and nitrogen use efficiency and high biomass and gumproductivity.
7. Water availability would influence leaf carbon isotope ratios ( 13C) and waterrelations parameters, making these also indicators for genetic adaptation in A. senegal.
8. Dryland agroforestry systems, through appropriate land management, are moreeffectual as carbon sinks as compared to crop monoculture or sole forestry systems.

25
2. THEORETICAL FRAMEWORK
2.1 Soil water availability and drainage
Usually, the amount of available water is low in sand, higher in clay and maximal inloamy and silt soils. In clay soils, however, the drainage is often poor; and clay soilscontaining less than 10 to 15% air volume at field capacity may have insufficientaeration for plant growth (Soil Survey Staff 1996).
It has been confirmed that agroforestry systems may greatly increase the rainfallutilization as compared to annual cropping systems. Nevertheless, carefulconsideration of the tradeoffs between the loss of crop production and the additionalvalue provided by tree products is of paramount importance (Lott et al. 2003). Walkeret al. (1981) proposed that stratification of soil water between the topsoil and subsoilmay lower the competition between woody plants and grasses (since woody plantspresumably have the exclusive use of subsoil water), and trees tend to utilize theavailable soil water in such a way that they do not prevent the establishment or survivalof crops.
Tree species selection and management and their spatial arrangement is a key factor indetermining the feasibility of dryland agroforestry systems. Gregory (1996) reportedthat Prosopis juliflora (Sw.) DC. reduced the soil water content in the crop-rootingzone less and had less competitive effect on sorghum than A. nilotica (L.) Willd. in anagroforestry system. The two tree species therefore performed differently in theirspecific root density and distribution. This has profound implications for modellingtree-crop competition, since most current approaches assume a direct correlationbetween root length and water uptake irrespective of species. The conservation of soilwater by acacias is more useful during drought years as compared to normal andabove-normal years of rainfall in the Blue Nile region conditions (Bukhari 1998).
The soil water content is extremely important for crop growth, and the soil waterstorage (SWS) before sowing of an annual crop plays an important role in crop growthand yield. Increase of SWS before sowing can enhance crops to develop larger anddeeper root systems, which can add to the utilization of available soil water (Li et al.2001).
On drylands, evaporation from the soil surface can reach up to 30-60% of the totalamount of rainfall (Wallace 1991). Annual crops often use only a small fraction of theavailable rainfall or stored soil water reserves. Incorporation of woody perennials, suchas A. senegal, into a farming system can increase the overall biomass productivity(Ong et al. 2000, Livesley et al. 2004).

26
A. senegal has a deep root system that makes it capable of efficiently using soilresources, and its presence may enhance ecosystem productivity. The diverse patternsof growth and development in natural A. senegal trees is presumably a result ofadaptation (Gaafar et al. 2005). However, little is known of how site and climaticfactors influence the balance between above-and below ground components or howthese factors affect the gum production of acacia trees.
2.2 Effect of A. senegal on soil water
Development of dryland agroforestry systems depends on the fact that the tree speciesselected have few superficial lateral roots. Their root system goes deeper into the soilthan that of the crop species and obtains water and nutrients inaccessible to the crop.Various tree species are assumed as suitable for agroforestry, despite limitedknowledge of their root distribution. However, it has also been recognized that in manysituations tree roots compete with crop roots for water and soil nutrients, and underthese circumstances the system has to be modified or managed in such a way as tomaintain and retain the expected positive results (Schroth 1995, Smith et al. 1999).
A general observation reported by ICRAF (1996) and Gregory (1996) has been thatwhen soil water and nutrients are distributed evenly, trees will preferentially extractwater from the top soil layer. However, one way of reducing the impact of tree roots oncrop growth is to carry out root pruning, which has been found to increase the cropyield in some agroforestry systems (Yadav and Khanna 1992, Korwar and Radder1994). A simpler management technique that may have the same effect is shootpruning.
A well-known phenomenon which has been widely demonstrated for herbaceous andwoody plants consists of the fact that when shoots are defoliated or pruned, plantgrowth is concentrated above the ground and the below-ground growth stops or slowsdown dramatically (Jones et al. 1998). This tendency of plants to maintain and keep theratio between roots and shoot constant under a certain prevailing set of environmentalconditions has been termed ‘functional equilibrium’ by Brouwer (1983). In someintercropping situations, crown pruning offers the additional benefits of reduction ofshading and provision of fuelwood and fodder for the dry season. Likewise, shootpruning is a standard and main component in managing alley cropping systems, butfew data are available on the exact effect and impact of shoot pruning on root growth(Schroth and Zech 1995).
Tree root density decreases sharply with increasing soil depth, with most fine rootsbeing found in the surface layers. In a study by (Bouillet et al. 2002) the number of fineroot intersects in the 0-25 cm surface soil layer represented 16-53% of the totalthroughout the profile, depending on stand age and the type of profile. The percentageof root intersects in surface layers increased with stand age. This could be due to the

27
greater concentration of nutrients in surface layers, since the highest root densitieswere generally observed under the stump. In the central clay plains of Sudan, the rootsystem depth of mature trees varies from 60-80 cm. A compacted nature of the claysoil and the accumulation of soil water content in the upper soil layer could account forthis pattern (Bukhari 1998).
Daily fluctuations in the soil water content seem to be greatest in the topsoil (0-15 cm)and decrease as soil depth increases. In general, little soil water manages to reach thesoil layers below 45 cm (Smit and Rethman 2000). The water content in the soilsuggests high rainwater losses (e.g. runoff plus interception) on plots with a high treedensity and less grass cover, compared to plots with a low tree density and some grasscover. This evidence suggests that soil water extraction within the topsoil zone by theroots of trees occurs at a rate fast enough to prevent soil water from reaching deepersoil layers (Smit and Rethman 2000).
Positive and negative interactions (or facilitation and competition) between trees andherbaceous plants may occur simultaneously (Holmgren et al. 1997). Facilitation mayresult in increased productivity through improving the water and nutrient statusbeneath the canopy.
Introduction of woody plants into the system can change the water balance of a site.Replacing the grassland with forest has been reported to have a significant impact onthe groundwater status and recharge by altering interception and transpiration (LeMaitre et al. 1999, Vertessy and Bessard 1999). The magnitude and impact of thischange may be of great importance in regions experiencing marked seasonal rainfallvariation. Due to this reason, the introduction and planting of exotic fast-growing treescould modify not only the composition and distribution of native grasses but also thelocal water balance (Gyenge et al. 2002).
The use of water resources by silvopastoral systems reflects the productivity of thesesystems. Water consumption has been found to be higher in silvopastoral systemsbased on pines than in an open pasture (Gyenge et al. 2002). It has also been reportedthat roots of Leucaena and maize exploit water from the same soil horizons during therainy season, with the result that the intercropped maize captures less water than solemaize (Howard et al. 1995).
2.3 Crop yield and productivity
Agroforestry systems increase the productivity by facilitation and sharing of resources;the temporal and spatial complementarities of resource capture by trees and crops in anagroforestry system are major determinants of the ability of the system to improve cropyields and the overall productivity (Ong and Black 1995, Cannell et al. 1996, Huang1998). In agroforestry systems trees reduce the solar heat effect on crops and decrease

28
the wind speed and soil temperature. It has been reported that the yield of crops grownunder leguminous trees is generally higher as compared to sole crops. Recognizing thisfact, agroforestry has been practiced on drylands for centuries (Sharma 1998). Cropproductivity is enhanced under a tree canopy because of improved soil fertility and theinfluence of shade leading to reduced under-storey temperature and evapotranspirationin a hot and dry environment (Bunderson et al. 1990).
Owing to its size and age, the woody component of an agroforestry system has aconsiderable advantage in sequestering resources from a large area and in enhancingsoil physical and chemical properties under its canopy (Kessler 1992, Belsky et al.1993). This is well demonstrated by the effects of isolated trees on the under-storeyhabitats and vegetation as described by Belsky et al. (1993) in the semi-arid rangelandsof East Africa, in which the under-storey vegetation productivity under Acacia tortilis(Forssk.) Hayne and Adansonia digitata L. amounted to 50 and 20 % higher,respectively, as compared to outside the tree canopy. Similarly, the organic mattercontent and N, P, K, and Ca concentrations were significantly higher under the treecanopies than in an open area.
In some countries like Australia agroforestry is regarded as a means to alleviate theproblems of rising water table and salinization, which affect a major proportion of thedryland areas (Eastham et al. 1994). Under adverse conditions such as sloping land,poor soil conditions, and drought stress, trees are often superior as fodder and fuelsources compared to herbaceous species (Roder 1992, Olsen et al. 2000). However, inalley cropping the competition between trees and crops may significantly reduce theyields of the crops (Ong et al. 2000). Long-term experiments with maize grown withErythrina poeppigiana (Walp.) O.F. Cook, and Gliricidia sepium (Jacq.) Walp.hedgerows have indicated that, after seven years, the maize productivity and N uptakewere more than twice as high in alley cropping with either tree species as compared tocrop monoculture (Haggar et al. 1993).
There is sufficient evidence to show that the overall (biomass) productivity of anagroforestry system is generally greater than that of an annual system, although notnecessarily greater than that of a forestry or grassland system. The basis for potentiallyhigher productivity could be due to the capture of more growth resources, e.g. light orwater (Ong et al. 1996), or to improved soil fertility.
Results from Leucaena-based systems in the tropics indicate that the competitivenature and vigorous growth of this tree usually reduce the yield of associated crops.Over-yielding and under-yielding as a result of competition usually occursimultaneously, because the trees and the crops both require water, light space andnutrients (Ong et al. 1996). The same studies also concluded that the major limitinggrowth resources available for a mixture of components always exceed those availablefor corresponding sole stands, irrespective of the proportions of species.

29
Complementarity exists when a full yield of one component or the other can beachieved simply by varying the proportions of the desired species.Changes in soil structure through plant-induced increases in macro-porosity have thepotential to influence the soil water dynamics, including the timing and rate ofevapotranspiration and nutrient uptake, aeration, and redistribution of particles andsolutes. These factors influence chemical and microbial activities in the rhizosphereand subsequently the growth and yield of the following crop (White 1997, Harrier andWatson 2003).
Sorghum (Sorghum bicolor (L.) Moench)
Sudan’s flora includes all the three wild sorghums believed to be the ancestors ofcultivated sorghum (S. aethiopicum, S. verticilliflorum and S. arundinaceum). It is alsothe home of five to six other wild sorghums, including S. sudanensis (Sudan grass)which internationally is very important as a fodder crop. Sorghum is one of the mostsignificant and widely used grain crops in Sudan and in the Sudanese diet andeconomy. The germplasm of sorghum is thoroughly collected, documented andpreserved. Collection started in 1914 by Punter and was later augmented with localtypes and exotic introduction, mainly from U.S.A in the early forties, and plantbreeders kept adding to the collection (Mahmoud et al. 1996). Its productivity variesgreatly from one year to another due to the fluctuation in weather and its componentssuch as the amount of rainfall and its distribution.
Sesame (Sesamum indicum L.)
Sesame is one of the main oil crops in Sudan, grown under rain-fed conditions bysubsistence, semi-commercial and commercial farmers. Selection by subsistencefarmers has resulted in many land races adapted to different ecological areas, varyingmainly in rainfall (300 to 1000 mm) and soil type (sandy to heavy clay), and to theneeds of the farmer (e.g. seed colour). All cultivars have one dehiscent capsule per leafaxil, but they differ in seed colour, days to maturity, degree of branching, number oflocules per capsule and capsule size, which affects the number of seeds produced(Mahmoud et al. 1996).
2.4 Tree growth improvement
2.4.1 Roots and root system
The practice of intercropping during early stages of timber plantation management iswidely known as the taungya system (Ballal et al. 2005). Especially the first two yearsof intercropping in taungya systems have been well studied, and many authors reportan increase in tree growth rates as compared to tree monoculture (e.g. Chamshama etal. 1992). However, tree growth can also be faster in monoculture trees than in

30
agroforestry systems. This suggests that trees can be adversely affected by competitionwith associated crops for the above and below-ground resources during theestablishment period. Nevertheless, trees in agroforestry systems later normally reachthe level of growth found in solely grown trees (Ong et al. 2000).
The root system architecture is highly influenced by environmental factors. A. senegalhas thick roots that are capable of penetrating hard clay soils. Field and laboratorystudies have shown that tree species with thick roots penetrate compact soils moreeasily than the thin-rooted ones (Materechera et al. 1991, Salih 1998). Large porescreated by thick roots are known to last longer and withstand disturbance due to tillageand land use in general, as compared to the fine pores created by thin roots (Blackwellet al. 1990).
Rapid decomposition of roots is required for quick formation of bio-pores. In addition,this rate of decomposition is determined and influenced by many factors such as the C:N ratio, and composition of sugars in the roots, microbial flora population, andmoisture availability. The optimum C: N ratio for greater microbial activity and fasterformation of bio-pores is about 25 (White 1997). Thick roots of woody species tend tohave higher C: N ratios of between 70-106, than found in Quercus spp. and Pinus spp.(Usman et al. 2000) and a greater concentration of insoluble carbohydrates, as found inAcacia spp. (Peter and Lehmann 2000).
In general, the natural vegetation productivity under savanna trees increases with adecrease in rainfall; however, the opposite occurs in agroforestry. One explanation forthis is that, in the savanna, the beneficial effects of microclimate improvements (e.g.lower temperature and reduction in water loss) are greater in more xeric environments.Mature savanna trees have a high proportion of woody biomass above the ground ascompared to the area of foliage, whereby the amount of water saved (largely byreduction in soil evaporation) is greater compared to the water lost throughtranspiration by trees (Ong and Leakey 1999).
2.5 Physiological adaptation
2.5.1 General considerations
The research into physiological characters related to drought adaptation and tolerancehas been fruitful over the last decades. Determination of water-use efficiency, withstable carbon isotope measurements of trees, has become common in studies ondrought adaptation (Kramer 1980, Arndt et al. 2000, Li and Wang 2003). Most of thetraits that explain plant adaptation to drought are related to plant development andstructure and include phenology, the size and depth of the root system, xylemproperties, or the storage of reserves (Passioura 2002, Chaves et al. 2003).

31
The physiological and morphological adjustments that take place in a plant duringwater deficit can be divided into short and long-term responses. These responses andtheir implications for field performance are controlled by the genetic characteristics ofthe plants and those growing conditions under which it has evolved (Jones 1980).Generally, plants adapt to drought by improving the water uptake through developingdeep root systems, or by osmotic adjustment, by reducing water loss, or by maintaininga large internal storage of water (Larcher 2003).
Structural modifications, such as changes in the relationship between leaf and stemwood areas, may be of considerable importance in the end, reflecting acclimation oradaptation to the supply and demand of water under particular growing conditions. Ingeneral, a reduction of the leaf area is an efficient way to control water loss duringdrought (Myers and Landsberg 1989, Gibson et al. 1995, Warren and Adams 2004).The reduction of the leaf area is, however, a relatively slow and irreversible responsemechanism that more affects long-term adaptation than the diurnal physiologicalbehaviour. An extensive and deep root system is commonly associated with gooddrought adaptation and enables a plant to take up water efficiently (Awe et al. 1976,Grunwald and Karschon 1982).
A small leaf area, such as that commonly found in Acacia species, prevents water lossand enables the plant to survive drought. Similarly, prompt stomatal regulation leads tolower stomatal conductance that tends to increase the leaf area. According toWhitehead et al. (1984), the leaf area becomes smaller in dry conditions due to thegreater evaporative demands.
Leguminous trees can grow and nodulate well under drought-stress conditions. Plantsof the genus Acacia are pioneer plants that play an important role in the preservationand restoration of fertility in poor and eroded soils in Africa. Deficiency in N oftenlimits plant growth and, hence, a symbiotic relationship has evolved between plantsand a variety of N2-fixing organisms. These plants produce an extensive, deep rootsystem in addition to their potential to fix atmospheric N2. For example, speciesrepresenting the genera Acacia and Prosopis are widely spread in the drylands ofAfrica and other regions and have proved to form effective N2-fixing nodules.Leguminous trees have been estimated to annually fix about 40-580 kg of N per ha,compared to 15-210 kg per ha for grain legumes (Fownes and Anderson 1991).
2.5.2 Adaptation and adaptive attributes
Adaptation is defined as inherent modification in structures or functions that increasethe probability of an organism surviving and reproducing in a particular environment(Kramer 1980). Adaptive responses to water availability include physiological andmorphological changes affecting, for instance, plant structure, growth rate, water-useefficiency (WUE), tissue osmotic potential and stomatal conductance (Begg andTurner 1980, Li and Wang 2003). The extremes of dryland climates mainly determine

32
the form of the physiological adaptations and ecological requirements of plantsoccurring in dryland areas. Stem and leaf structures, physiological control oftranspiration and metabolic rates, water and food storage organs, and thorns are furtherexamples of characteristics reflecting adaptation to drought. Such specializationsbecome less marked as aridity becomes moderate and less acute and the conditions forplant establishment and growth become more favourable (Turner and Kramer 1980,Ffolliott et al. 2002, Chaves et al. 2003).
2.5.3 Water use efficiency
Water use efficiency (WUE) can be defined as the ratio of biomass yield toevapotranspiration, or net photosynthesis to transpiration, or carbon gained per unit ofwater lost to transpiration (Cowan 1982). It is an important index of water relations,and a high WUE is usually considered beneficial in water-limited environments.“Water-wasting trees” are trees with a high degree of transpiration and a relatively lowphotosynthetic rate. Alternatively, as the ratio of dry matter accumulation and waterconsumption (B/W) is determined over a season, plants can achieve a high WUE eitherthrough high net photosynthesis rate while growing, or low transpiration rate, or both.Both processes are at least partially regulated by stomatal conductance (Cowan 1982).
Many authors have suggested that two types of water-use behaviour are operational inwoody plants. A prodigal water use behaviour is beneficial in conditions where thewater supply is interrupted for short periods only and where there is little danger ofserious desiccation despite rapid water use; it enables the plant to grow quickly. Incontrast, a conservative water use behaviour is beneficial in conditions where a longdry period prevails under which a plant uses the available water efficiently, leading toavailability of soil water for use later during the dry season (e.g. Li and Wang 2003).
Climate change has now become a serious issue of the world’s attention. It refers toshifts in climate occurring because of natural processes and human intervention, e.g.through land-use changes and increased carbon dioxide in the atmosphere (Wigley1999). Scientific consensus today has suggested that the relative contribution ofanthropogenic factors to the change in natural climate is significant (Hare 1993,Wigley 1999).
An increase in water-use efficiency paralleling the trend of CO2 concentration increasein the atmosphere, commonly found in trees, might also increase the transpirationefficiency in dryland acacias (cf. Luukkanen 1991). This would allow dryland trees togrow rapidly and act as an effective carbon sink for the anthropogenic CO2 even duringthe anticipated global climate change (Feng 1999, Koskela et al. 2000).

33
2.6 Dry-matter production
The production rate of single plants can be given in terms of the net assimilation rate(NAR) or the relative growth rate (RGR). The magnitudes of the highest possible andaverage net assimilation rate depend mainly on the morphological and physiologicalconstitution of the plant. Similarly to the photosynthesis rate, dry-matter productionexhibits a temperature optimum, and both a water deficit and an inadequate orunbalanced provision of nutrients can reduce the production of dry matter (Larcher2003).
2.7 Nutrient and organic matter accumulation
2.7.1 Nutrient cycling
The concepts and practices of soil amelioration by trees have been extensivelyreviewed by several authors (Ingram 1990, Buresh and Tian 1998, Deans et al. 1999,Lal 2001, and many others). Many studies have postulated that soil improvement islinked to the growth of deep-rooted trees and shrubs which recycle plant nutrients fromlower soil strata and build up the soil organic matter (Schroth 1995, Buresh and Tian1998). Sprent (1995) suggested that the key to success of the Mimosoideae subfamilytrees in dry/saline environments is more likely attributed to their deep roots than totheir nitrogen fixation. The general vertical distributions of nutrients from shallowest todeepest ranked in the following order: P> K> Ca> Mg> Na = Cl = SO4. Nutrientsefficiently cycled by plants, such as P and K, were more concentrated in the topsoil(upper 20 cm layer) as compared to nutrients less limiting to plant growth, such as Na(Jobbagy and Jackson 2001).
Numerous studies have reported higher soil organic material (SOM) contents in topsoilunder trees than in open areas (Breman and Kessler 1995, Young 1997, Lal 2002).Mordelet et al. (1993), for example, reported higher soil organic C under trees than inopen grassland in a humid savanna in Ivory Coast. Trouve et al. (1994) found aprogressive increase in SOM under Eucalyptus sp. and Pinus caribaea Morelet inplantations on sandy soil in the Congo, and Belsky et al. (1993) showed anaccumulation of SOM at 0-15 cm depth under Acacia tortilis and Adansonia digitataon a savanna in Kenya. Kang (1997) reported that soil organic C at 0-15 cm depth after5-year hedgerow intercropping with Leucaena leucocephala (Lam.) De Wit was 12.3 gkg-1 under the hedgerow and 9.4 g kg-1 between the hedgerows, as compared to 5.9 gkg-1 in the control without a hedgerow. In semi-arid ecosystems, soils under treecanopies evidently have greater levels of organic matter and nutrients such as Ca, K,Mg and P than those in open grassland systems (Belsky et al. 1993, Campbell et al.1994).

34
Nutrient release from SOM is usually more dependent on the portion of the SOM inbiologically active fractions than on the total amount of SOM. Trees can augment theinorganic soil N, N mineralization and the quantity of N in light-fraction SOM. Amongsix tree fallows of 2 and 3-year duration in Zambia, the inorganic N content and Nmineralization were found to be higher in leaf litter of tree species with a low (lignin +polyphenol) to N ratio as compared to tree species with a high ratio (Barrios et al.1997, Buresh and Tian 1998).
In Sudan, A. senegal occurs widely and is used to restore the soil fertility in sandyareas in traditional bush-fallow systems, but it has also been artificially established torestore the soil fertility in the large-scale rain-fed sorghum production area of the BlueNile region (El Houri 1986). Singh and Singh (1993) also pointed out that short-livedcomponents such as annual herbs and grasses have a major role in the aspects ofproductivity and nutrient cycling in dry tropical forests.
Research in western Kenya has shown that fast-growing trees with a high N demandtake up subsoil nitrate accumulated below the rooting depth of annual crops. Sesbaniasesban (L.) Merr. was also more effective than a natural grass fallow in extractingsubsoil water, suggesting lower leaching loss of nutrients under S. sesban than undernatural uncultivated fallows (Buresh and Tian 1998).
Trees can increase the availability of nutrients through increased release of nutrientsfrom soil organic matter (SOM) and recycled organic residues. Some agroforestry trees(e.g. Leucaena leucocephala, Sesbania sesban, Acacia spp., Gliricidia sepium) have apotential to provide N in quantities sufficient to support moderate crop yields through(1) N inputs from biological N2 fixation and retrieval of nitrate from deep soil layersand cycling of N from plant residues and manure, (2) retrieval of nutrients from belowthe rooting zone of crops, and (3) reduction in nutrient losses due to processes such asleaching and erosion (cf. Fig. 2). Cycling of P from organic material is normallyinsufficient to meet the P requirements of crops. Sustained crop production withagroforestry on P-deficient soils will frequently require external P inputs (Buresh andTian 1998, Jobbagy and Jackson 2001).
Deep capture and uptake of nutrients
Trees having deep roots can potentially intercept and prevent nutrients from leachingdown the soil profile and ‘capture’ nutrients accumulated in the subsoil below therooting depth of annual crops (Van Noordwijk et al. 1996). Nutrients taken up by treesfrom below the rooting zone of annual crops will later return as an input whentransferred to surface soil through leaf litter, roots, and pruning of tree leaves andbranches (Schroth 1995). The lateral extension of tree roots can be significant,particularly in dryland areas (Breman and Kessler 1995). The lateral capture anduptake of nutrients from within the rooting zone of crops, nonetheless, represents a

35
reallocation of nutrients within the soil-plant system rather than an input. Trees couldalso affect the restoration of the soil fauna, which is essential for SOM and plantresidues decomposition (Buresh and Tian 1998).
Generally, tree roots can extend beyond the rooting depth of annual crops (Stone andKalisz 1991, Torquebiau and Kwesiga 1996, Mekonnen et al. 1997, Ludwig et al.2004), and the spatial distribution and temporal patterns of root growth vary amongdifferent tree species (Ruhigwa et al. 1992, Hauser 1993). The extent to which treeroots in deep soil layers contribute to the overall uptake of nutrients is, however, lessclear and less frequently documented. In his critical review of the literature, Buresh(1995) concluded that the potential of trees to retrieve subsoil nutrients is generallygreatest when (1) trees have deep rooting systems and a higher uptake of nutrients, (2)
Fig. 2. Conceptual model for nutrient uptake, transport, and above-ground cyclingthrough litter fall in Acacia senegal agroforestry systems.
Roots andLitter
(decomposition)
SorghumSesame
(stem, foliage,grain, seeds)
A. senegalleaf, twigs
branches stem(wood, bark)
roots
SoilNitrogen (N)
Phosphorus (P)Potassium (K)
Roots andLitter
(decomposition)
SorghumSesame
(stem, foliage,grain, seeds)
A. senegalleaf, twigs
branches stem(wood, bark)
roots
SoilNitrogen (N)
Phosphorus (P)Potassium (K)

36
the surface soil experiences water and/or nutrient stress, and (3) significant reserves ofplant-available nutrients or weatherable minerals occur in the subsoil. Larger capture ofsubsoil resources by roots would be anticipated for water and for mobile nutrients suchas nitrate, than for less mobile nutrients such as P. There is consistently little potentialof trees to capture P from beneath the rooting depth of crops (IAEA 1975), presumablybecause the plant-extractable P concentration is normally low in the subsoil (Bremanand Kessler 1995).
2.7.2 Nitrogen dynamics
Nitrogen is the primary element that most often limits plant growth in many terrestrialecosystems, and the competition between plants and microbes for this nutrient ispowerful (Hodge et al. 2000). Most of the soil N occurs in organically bound forms,which need to be mineralized to simpler compounds such as ammonium or nitrate to beready for uptake by plants. In reality, a small fraction of the total N (< 10% in mostcases) may be mineralized during the short rotation of a fast-growing tree plantation(Miller 1995, Hawkins et al. 2000).
In mixed-species plantations under short rotation, the amount and time of N transferfrom N2-fixing trees to non-N2-fixing trees are essential issues to be taken into accountwhen attempting to develop optional nutrient management strategies. According to thelimited information available mainly from trials in Southeast Asia, it emerges that theacacia species fix substantial amounts of N during the first few years of establishmentand a significant amount of that N can be transferred to adjacent eucalypts, therebyameliorating the growth and nutrition of the eucalypts. The postulated transfer of Nfrom acacia to eucalypts during an early stage of plantation development is probablydue to a below-ground turnover of roots and nodule senescence, since the above-ground litter decomposition is slight and contributes little to the overall N dynamics atthis stage (Khanna 1998).
Green plants utilize inorganically bound nitrogen, that is, they are autotrophic withrespect to nitrogen as well as to carbon. Nitrogen is taken up from the soil as nitrate orammonium ions. Most plants can meet their nitrogen requirements with either NO3
- orNH4
+, as long as the pH in the space occupied by the roots is suitable. Like all ionabsorption, that of inorganic nitrogen requires energy and is thus dependent onrespiration; consequently, plants growing in cold, poorly aerated soils often suffer fromnitrogen deficiency (Larcher 2003). Controlled fallow with nitrogen-fixing legumesand possibly with rock phosphate application are cited as key soil fertility restorationoptions (ICRAF 1996).
A. senegal, known for long as a nitrogen-fixing species, is important and has itssignificant effects in reclaiming degraded lands in the tropics through amelioration ofsoil properties, as also has been observed in Sudan (Alstad 1991, Njiti and Galiana1996). Jewitt and Manton (1954, cited by Ardö and Olsson 2003) compared an

37
exhausted site that had been under continuous cultivation for 30 years with an areataken out of cultivation and allowed to regenerate as a gum forest (A. senegal). OrganicN, exchangeable calcium and pH were much higher in the gum forest. The Nconcentration of the upper 15 cm soil stratum was 0.019% in the gum forest and0.009% on the exhausted site. After clearing of the gum forest, the two sites werecultivated with sesame and groundnuts (Arachis hypogaea L.). The sesame yield wasfive times higher and the groundnut yield one and half times higher for the clearedforest as compared to the exhausted site.
2.7.3 Phosphorus dynamics
Phosphorus (P) is the most limiting nutrient for plants in many areas of the tropics. It isan important plant macronutrient, which constitutes 0.2% of a plant’s dry weight. Lowavailability of P in bulk soil restricts plant uptake (Harrier and Watson 2003).Nonetheless, there have been few studies that have assessed the extent andeffectiveness of tree root exudates in P mobilization for crop uptake under fieldconditions. If trees in an agroforestry system exhibit P-mobilizing adaptations, thenthese species would acquire P from sources that are not in competition with the crop.Moreover, if the rhizospheres of tree and crop roots overlap, and if they do not excludeeach other, there is a potential for the crop to benefit from the increased P availabilityin tree rhizosphere soil (Van Noordwijk et al. 1999).
The most important modifications to low P availability that trees may exhibit, andwhich may profit the crops, are related to mobilization and hydrolysis of P in therhizosphere through organic-anion exudation (Dinkelaker et al. 1989, Radersma andGrierson 2004), increased phosphate activity (Mc Lachlan 1980, Chen et al. 2003), ironreduction (Gardner et al. 1983, Grierson and Attiwill 1989), pH increase or decrease(Hinsinger 2001), or rhizosphere microbial effects (Bowen and Rovira 1999, Hawkinset al. 2000).
The cycling of P from organic materials is normally insufficient to meet the Prequirements of crops. Sustained crop production with agroforestry on P-deficient soilswill significantly require external P input (Buresh and Tian 1998, Khanna 1998).Most studies have found little or no benefit of trees on extractable inorganic soil P.Siaw et al. (1991) and Weil and Mughogho (1993) found no significant difference inavailable soil P under hedgerow intercropping with L. leucocephala and Dactyladeniabarteri as compared to a control without trees or with Faidherbia albida. Some studieshave reported a decrease in extractable inorganic P under trees, probably because ofsequestration of P in tree biomass (Haggar et al. 1991). Kang et al. (1997) found aslight favourable effect of 4-year old trees (Senna siamea, L. leucocephala, Acacialeptocarpa and Acacia auriculiformis) on extractable P at 0-15 cm soil depth duringthe fallow phase.

38
Trees might have access to soil P from unstable pools inaccessible or exploited bycrops (Hands et al. 1995). Many tree species in the tropics form associations withectomycorrhizal (ECM) or vesicular-arbuscular mycorrhizal (VAM) fungi (Mason andWilson 1994, Chen et al. 2003). This association may enhance P uptake by the treethrough the extensive proliferation of mycorrhizal hyphae, which results in theeffective exploration of large soil volume. Mycorrhizal fungi can also contribute to thesynthesis and production of phosphatase enzyme and organic acids that ameliorate andupgrade the availability of soil P (Bolan 1991, Handreck 1997).
Buresh et al. (1997) reported in western Kenya that rotation of unfertilized maize withSesbania sesban rather than continuous maize cropping could to a small degreeincrease the availability of P. The S. sesban fallow also increased the maize yield onthis P-deficient soil, but it did not exclude P deficiency in subsequent maize crops.The balance of P is mainly a consequence of adsorption and precipitation reactionswith sesquioxides (e.g. Al2O3/ Fe2O3) rather than low amounts of total P (Sanchez1976, Hue 1991). Likewise, a main challenge of agroforestry research is to identifyspecies that are able to transform unavailable P into forms that may be utilized by thecrop, through nutrient cycling or by direct root effects; in the end, that will result inimproved crop performance and productivity.
It is postulated that increased exudation activity of organic acids in A. senegal treeroots may have a role in increasing hydrolysis and solubility of organic P and then theavailability of organic P for microbial interactions in the rhizosphere. This may also beto some extent responsible for enhancing the mineralization of organic P.
2.7.4 Potassium dynamics
The total amount of potassium (K) in soils varies broadly from less than 0.01% toabout 4%, and is usually about 1%. Clays may contain 2 to 4% K. The direct source ofK for crops is that in the soil solution. Its availability to a plant mainly depends on theK+ ion concentration close to the root zone, on the rate at which K+ ions are transportedthrough the soil solution to the root surface, on the replenishment of the solution bydesorption from exchange sites on the soil colloids, and on the level to which the plantroots ramify through the soil (Wild 1988).
Deans et al. (1999), working with A. senegal agroforestry in Senegal, showed that theincrease of N and K in surface soil as plantations aged could be predictable by multipleregression equations in which plantation age and inter-tree spacing were used asvariables. The accumulation of N in 15 years of fallow period would provide goodsorghum yields for at least four successive cropping seasons. Accordingly, the amountsof K in trees exceeded those in the upper soil strata, suggesting that harvesting of treesposes a greater threat to the site K budget as compared to the site N budget, andharvesting of tree fruits and leaves for fodder pose a heavier risk to site fertility thanremoval of wood at the end of the rotations.

39
The central reasons for adoption and practicing of agroforestry systems in areas wherecommercial fertilizers are expensive or even unavailable is the inherent capacity ofsuch systems to recover, recycle, and utilise nutrients. This is often linked tomechanisms associated with woody perennial species. Agroforestry systems could beprofitable if established directly after forest removal. Under conditions of degradedlands, a number of years are required for soil recovery. However, for this reason,farmers with limited capital and poor soils may require subsides and support toestablish agroforestry systems (Montagnini et al. 2000).
2.8 Plant nitrogen isotope composition
The forms of nitrogen absorbed by plants can have different isotope compositions, andmany studies now routinely measure foliar 15N in an attempt to understand differencesin patterns of nitrogen use among co-occurring species. Many studies assume that 15Nat natural abundance levels acts as a tracer (Boddey et al. 2000), i.e. the isotope ratio ofsource nitrogen is preserved during nitrogen absorption, assimilation and translocation,and that the 15N of leaf tissue reflects that of the nitrogen source in the soil.
Few studies have addressed the genetic variation in physiological traits that couldcause differences in whole plant and foliar 15N (Evans 2001). Legumes obtain their Nrequirements from two major sources: from the soil and through symbiotic N2 fixation.These two N sources often differ in 15N abundance, whereby an N-fixing plant, whichdepends on both soil N and symbiotic N2 fixation, is less abundant in 15N than a non-N2-fixing plant grown at the same site (Shearer and Kohl 1986, Danso et al. 1993,Handley and Scrimgeour 1997, Evans 2001). Plants dependent on soil N have morepositive 15N values that are close to those of soil nitrogen. In N-fixing plants,significant amounts of N are derived from the atmosphere and therefore dilute the 15Nconcentration derived from the soil.
There is relatively little information on the genetic variation in N2 fixation byherbaceous legumes, and even fewer measurements have been made with trees (forGliricidia sepium, cf. Liyanage et al. 1994). Many authors have shown a strongrelationship between precipitation and 15N. These suggest that the annual rainfall maybe an important component controlling ecosystem nitrogen cycling (Austin andVitousek 1998, Austin and Sala 1999).
2.9 Carbon isotope composition
Stable carbon isotope ratios are measured using an isotope ratio mass spectrometer,which measures the ratio between different isotopes in a sample and compares thiswith a standard. In principle, one can measure the absolute abundance of an isotopewithin a sample; however, the total variation is naturally quite small and subject to

40
errors caused by sample heterogeneity, daily fluctuations within the mass spectrometerand by sample preparation procedure (Lajtha and Michener 1994). Therefore, inpractice, the isotope ratio of a sample (Rsample) is compared to a standard (Rstandard), sothat any fluctuations will be reflected evenly both in the standard and in the sample. Ris expressed as the ratio of a heavy to a light isotope. The differences ( ) in ratios haveunits of per mill (‰):
{ } 10001tan
13 ×−=dards
sample
RR
Cδ (1)
Ecologists are much concerned with the stable isotopes of carbon (13C/12C), nitrogen(15N/14N), sulphur (34S/32S), oxygen (18O/16O) and hydrogen (2H/1H). In this study, weare primarily concerned with the first two pairs of isotopes. Common thought is thatsamples containing more of the heavy isotope are referred to as ‘enriched’ or are‘heavier’ than other samples. Those that contain less of the heavy isotope are‘depleted’ and are ‘lighter’ than other samples (Chaves et al. 2003). Many chemicaland physical processes have a significant isotopic fractionation, which generally refersto an enrichment or depletion of the heavy isotope. For example, plants contain less 13Cthan atmospheric CO2, because processes involved in both diffusion of CO2 andenzymatic reactions discriminate against the heavier 13CO2.
Isotopes and plant water-use efficiency
The most ordinary ecological use of carbon isotope ratios at natural abundance levels isas an indication of photosynthetic WUE in C3 species. The use of 13C analysis toestimate long-term WUE has been subjected to thorough reviewing and is becomingalmost a routine (Ehleringer and Osmond 1989, Farquhar et al. 1989, Ehleringer 1991,Ehleringer et al. 1993). A common application of isotope ratios has been for screeningcultivars of dryland crop and rangeland grass species. The isotope data havecorresponded well with various other methods of estimating WUE, and the results havebeen remarkably consistent across altering environments (Ehleringer et al. 1990, Readand Farquhar 1991).
Reported heritability values in WUE are often high (Hubick et al. 1988, Hall et al.1990, Ehdaie et al. 1991), signifying that WUE is a trait for which breedingprogrammes can be readily designed. Research on carbon isotope ratios in naturalecosystems has focused on WUE in desert ecosystems or across gradients of wateravailability in mesic systems. Comstock and Ehleringer (1988) compared WUE indesert species that had photosynthetic stems as well as leaves, and established that 13Cvalues were more positive, and thus WUE values higher, in stem than in leaf tissue.Comparing different species within a habitat, Smedley et al. (1991) found that short-lived annuals or herbaceous species had significantly lower values than long-livedperennial species; they reported that 13C incorporates physiological processes overtime and enables seasonal variation in processes such as WUE to be evaluated.
41
Species active during wetter, more favourable months discriminate against 13C morethan do species that persist over dry seasons, indicating a higher WUE in the moredrought-tolerant species. A comparison of plants over a wider environmental gradientfor their 13C showed that those from drier conditions had more positive 13C valuesthan those originating from wetter areas. Similarly, foliar 13C was more positiveduring a dry year than a wet year (Garten and Taylor 1992). In Acer negundo L. it hasbeen reported that during wet years female trees display higher growth rates and lowercarbon isotope ratios, which indicates their less conservative water use as compared tomales (Ward et al. 2002).
Sharp differences in water use and carbon gain strategies among plants in a habitatwith environmental heterogeneity have been observed. Superior plants with lowerdiscrimination values indicate decreased ratios between the inter-cellular andatmospheric CO2 concentrations that appear to result from a decrease of stomatalconductance following a drop in water availability (Sandquist and Ehleringer 2003).Clay et al. (2003) stated that stable isotopic 13C is helpful in evaluation of the factorsthat determine yield variability in wheat, corn and soybean. A negative value indicatesthat a sample has a lower 13C/12C ratio than the standard, PDB (Pee Dee Belemnite).WUE and leaf 13C are negatively related with Ci/Ca, the proportion of leafintercellular and ambient CO2 concentrations, and thus dependent on factors thatinfluence stomatal conductance and leaf photosynthetic rate. WUE and 13C differ withsoil and atmospheric moisture conditions (Farquhar et al. 1989). However, Read andFarquhar (1991) found that 13C in species of the genus Nothofagus was inverselyrelated to the rainfall at the site of origin. 13C measured in a common environmentwith sufficient resources is the most feasible measure of the genetic (or adaptive) valuefor WUE (cf. Condon and Richards 1992, Handley et al. 1994).
Selection of plants for higher transpiration efficiency by measuring their carbonisotope discrimination has been recommended (Wright et al. 1993, Hall et al. 1994, Luet al. 1996). It may also be a hopeful approach in tree breeding, because changes incarbon isotope discrimination can be independent of shifts in root-to shoot allocation(Zhang et al. 1996). The selection for trees with low 13C and, therefore, hightranspiration efficiency, has the potential to increase total tree biomass growth inwater-limited arid environments, such as those occurring in the Blue Nile area of theSudan.
Previous studies (e.g. Devitt et al. 1997) have reported that average leaf WUE values inlive oak (Quercus virginiana Mill.) and tall fescue (Festuca arundinacea Schreb.) werecorrelated with average leaf carbon isotope ratios, and in tall fescue the leaf WUEincreased as the leaf carbon isotope ratio become more negative. It was verified thatleaf carbon isotope ratios could be used as a method of screening for plant responsetowards low water-use. However, plant water-use efficiency is a complex function ofthe CO2 concentration of the atmosphere. It can increase, remain constant, or decreasewith an increase of the atmospheric CO2 concentration (Feng and Epstein (1995).

42
Usually, there is a strong relationship between 13C and modelled soil wateravailability or transpiration (Dupouey et al. 1993, McNulty and Swank 1995, Walcroftet al. 1997). Accordingly, 13C may well be a useful indicator of drought stress, butonly in seasonally dry climates (P/E< 1), where the variation in other environmentalfactors remains unchanged. Likewise, a more drought-tolerant tree species, for instancePinus pinaster Aiton, can be inefficient in the use of water (Warren et al. 2001).
It can be concluded that high transpiration efficiency (dry matter produced per unit ofwater transpired) is a useful trait for plants adapted to dry regions. Genetic variation in
13C of different woody plant species has been linked to the distribution of genotypesacross gradients in air humidity and soil water availability (e.g. Pennington et al.1999). Earlier studies have assessed the genetic variability of 13C and nutrientconcentrations in woody plant species and revealed a high degree of variation betweenthe species studied (Prasolova et al. 2001).
3. MATERIAL AND METHODS
3.1 Research site
The research site was located in the Blue Nile State near Ed Damazin town (34° 23′,11° 47 , 470 m above sea level). The climate at the trial site is semi-arid with a meanannual rainfall (May-October) of 736 mm. The mean annual temperature is 28.1 ºC,and the length of the growing season for main agricultural crops is 82 days. The soilconsists of dark cracking clay (Vertisol) which extends to at least 15 m in depth. Thenatural vegetation is woodland savanna dominated by Acacia seyal, A. polyacanthaWilld. A. senegal, Balanites aegyptiaca (L.) Del., Combretum spp., and Dichrostachyscinerea (L.) Wight & Arn. as characteristic tree species (El Amin 1990).
The site was first cleared of trees shrubs and grass, and then deep-ploughed with achisel plough, followed twice by a wide level disc plough.
3.2 Experimental design
3.2.1 Effect of Acacia senegal on two field crops
Seeds of A. senegal originating from Bout (local provenance) were directly sown onagricultural land on 20 July 1999 at a spacing of 5 x 5 m (400 trees ha-1) and 10 x 10 m(100 trees ha-1) Simultaneously, agricultural crops were sown between the acacia trees.Sorghum ‘Wad Ahmed’ variety was sown at 0.75 m spacing between rows and 0.3-0.5m within rows, and sesame variety ‘Kenana 2’ at 0.75 m spacing between rows and

43
0.2-0.3 m within rows. This intercropping with sorghum and sesame was repeatedannually between 1999 and 2002 in a rotational manner. Pure crops and sole A. senegalstands were also established using the same spacings, so as to provide controltreatments; plot size was 30 x 30 m. Weeding was carried out annually as requiredduring the growing season (Study I). No fertilizers were applied. Trees were managedannually by removing the lower branches, and the first systematic pruning was appliedwhen trees were three years old. Growth variables indicating height (H), basal diameter(BD) and crown diameter (CD), were measured annually at the end of the growingseason. Trees were tapped for gum arabic using the traditional axe for the first timewhen they were three and a half years old (Studies I, IV).
Annual crops in the experimental plots were harvested at physiological maturity. Smallplots (6×6 m, representing 4% of the plot area for crop harvest) were laid out at thecentre of each plot. Heads were harvested, sun-dried and threshed, and later the grainand seed yields were calculated (in kg ha-1); this was done annually. About ten plantswere randomly selected from these sample plots for measurements of plant height, thenumber of tillers in sorghum, and, in sesame the number of branches and number ofcapsules.
The experimental design used was a randomized complete block design (RCBD) withfour replications (Studies I, II). The treatments were as follows: A. senegal 5 x 5m/sorghum (Sg5), A. senegal 10 x 10 m/sorghum (Sg10), A. senegal 5 x 5 m /sesame(Se5), A. senegal 10 x 10 m/sesame (Se10), Sorghum (SgC), Sesame (SeC), A. senegal5 x 5 m (C5), and A. senegal 10 x 10 m (C10).
3.2.2 Physical soil analysis and soil water content
At the establishment of the field trials in 1999, soil samples were taken from differentsoil depths (0-25, 25-50, 50-75 cm) for complete soil analysis in the Land and WaterResearch Centre, ARC, Wad Medani, Sudan (Table 1). Soil water content wasdetermined gravimetrically and with neutron probe (Model 4300 depth moisture gauge,type Troxler, USA). Pits were dug using metal cores (Eijkel Kamp, Giesbeek), andaluminium access tubes were installed to 1.2 m soil depth. Tubes were installed at 0.3m distance from the nearest tree in the centre of the plots. Measurements were takenduring the morning for 0-25 cm, 25-50 cm and 50-75 cm depth, at different crop stages(early, mid, and late); they required about one hour to finish. Neutron probe countswere converted to soil water content (mm) based on a calibration performed using soilwater content samples. Initial and late soil bulk densities for the same three depthswere determined by the cylinder method; undisturbed soil samples were collected bymeans of metal core sampling cylinders of known volume and then oven dried at105oC for 48 hours. The oven-dried weight of the soil sample was divided by thevolume of the cylinder to obtain the bulk density, expressed as g cm-3 (Mg m-3) (Blakeand Hartge 1986). The rainfall at the site was also recorded for the whole period of thestudy (1999-2003) using a rain gauge (Fig. 3; Studies I, II).

44
3.2.3 Provenance testing
Nursery stage (Study III)
Seeds of eight A. senegal provenances, namely Bout (BO), Mazmoom (MZ), Gedaref(GE), Domokeya (DO), Nabag (NA), Saata (SA), Rahad (RH), and Semaih (SE), werecollected from different geographical regions in the gum belt of the Sudan; the firstthree were collected from the clay plain and the latter five from the sand plain (Fig. 1,Table 1, Studies III, IV and V). These provenances were representative of wide naturalecological and geographical distribution with contrasting environmental conditions,corresponding to the elite production range of the species through the gum belt. The
Fig. 3. Monthly rainfall during the growing season at the experimental site in theBlue Nile region over the study period 1999-2002.
0
50
100
150
200
250
300
A M J J A S O N A M J J A S O N A M J J A S O N A M J J A S O N A M J J A S O N
1999 2000 2001 2002 2003
Year and month
Rai
nfal
l (m
m)

45
seeds were sown in the nursery in 10 x 20 cm polyethylene bags filled with a mixtureof silt and sand in 2:1 ratio by volume, on 1 April 1999. Flood irrigation was used overthe whole period. Data on seedlings growth parameters and biomass production werecollected regularly at three-week intervals.
Field stage (Studies III-IV)
Seventeen weeks after sowing, the seedlings representing the different provenanceswere transported to the field and planted on 29 July 1999, at 3 x 3 m spacing in plots of27 x 27 m, giving 100 trees per plot (1111 trees ha-1); following a randomised completeblock design with four replications. The same layout of the trial as used in the nurserywas maintained in the field. The site was hand-weeded as required during the firstgrowing season. Later, strip weeding was performed annually for the wholeexperimental period.
3.3 Plant and soil samples
Plant samples from sesame and sorghum (complete plant) were collected from alltreatments and taken for nutrient analysis (Study I). Likewise, composite samples oftree leaves plus twigs were also collected (three samples of each component were takenfrom the upper, middle and lower plant parts and mixed together to form a compositesample).
A tree from each treatment plot was selected from the inner ones, cut at the groundlevel and separated into stem, branches, leaves and roots. Samples from each part weretaken for analyses (5 replicates). The water content (WC) for trees were estimated byoven-drying subsamples at 70 oC to constant weight. The biomass of tree parts wascorrected accordingly to obtain the dry weight of each part in kg. Nitrogen,phosphorus, potassium and organic carbon were determined every year at the end ofthe cropping season.
Soil samples were taken from the middle of the experimental plots by augering at cropharvest to depths of 0-25, 25-50, 50-75 and 100 cm. Composite soil samples from thefour depths were taken annually for nutrient analysis in all treatments (described indetails in Study I).
3.4 Nutrients analyses
The chemical composition of the plant tissue (trees and crops; Study I) was determinedafter oven drying at 70 oC for 24 hours to a constant weight and grinding in a Wileymill with stainless steel points to pass a 40-mesh screen. Total nitrogen and C in theplant tissues and soil were determined by dry combustion on a LECO® CNS-1000

46
Carbon, Sulphur and Nitrogen Analyser. Phosphorus and potassium were extracted bywet aching of 1g plant material in acid mixture consisting of 10 ml H2SO4, 3 ml HNO3and 1 ml HClO4 following the methods of Olsen and Sommers (1982) and Allen(1989). Phosphorus was determined from the extract using a spectrophotometer andpotassium using a flame photometer (described in detail in Study I).
3.5 Nutrient uptake
Soil volume of the uppermost 25 cm soil slice per hectare was multiplied by therespective average bulk density to obtain its weight; this weight was in turn multipliedby corresponding nutrient concentration (N, P, K and C) to obtain the amount of soilnutrients content in kg per hectare. The nutrient contents of the trees were computed bymultiplying the dry weight of each part by its respective mean nutrient concentration,and then summed to obtain the total standing amount of nutrients in the above-groundtree biomass.
3.6 Discrimination measurements of carbon and nitrogen isotopes
Plant samples (consisting of current fully expanded leaves including petioles, twigs andsmall branches) were collected from about ten trees in each replication in all Acaciaprovenances annually at the end of the rainy season when trees were at maximumfoliage. Leaves from the upper, middle and lower plant parts were pooled to form asingle sample (Studies IV, V). Samples were dried at 70 °C. Values of 13C weremeasured using a mass spectrometer (Finnigan Delta + XL, Thermofinnigan, Bremen,Germany), connected on-line to an elemental analyser type NC 2500 (CE Instruments,Milan, Italy) by an interface ConFlow III (Thermofinnigan, Bremen, Germany).
The carbon isotope results were given as delta values in per mil (‰) deviation from theV-PDB (Pee Dee Belemnite), the usual standard against which all measurements arereferred, namely CO2 obtained from the carbonate shell of a Cretaceous mollusc,Belemnitella americana from the Pee Dee Formation in South Carolina (Craig 1957,cited by Feng 1999), as described in detail in Study IV:
{ } 10001tan
13 ×−=dards
sample
RR
Cδ (1)
where R is the carbon isotope ratio 13C/12C for sample and standard, respectively.The error for the 13C values was estimated to be ± 0.2 ‰ or less.

47
3.7 Estimates of N2 fixation
Plant samples collected as described above were used. Trees of Balanites aegyptiacagrowing naturally at the planting site were used as non-N2-fixing reference material.Ten individual samples from the reference tree species were similarly collected andpooled.
The natural abundance ( 15N) method (Shearer and Kohl 1986, Högberg 1997, Boddeyet al. 2000) was used, since it is suitable for measuring N2 fixation in naturalecosystems (Kurdali et al. 1993, Yoneyama et al. 1993). These measurements, madewith 15N, were considered more reliable than the acetylene reduction assay. Plant 15Nreflects the potentially variable 15N values of external N sources and 15N/ 14Nfractions, which occur during the assimilation, transport and loss of N.
The plant tissue was oven-dried at 70 0C to constant weight and milled into finepowder. Subsamples of ground material were finely reground in a rotating ball bearingmill. Analysis of powdered samples was conducted at the Radio Carbon DatingLaboratory of the University of Helsinki, Finland. The 15N/ 14N isotope ratio wasdetermined by a mass spectrometer (Finnegan Delta + Advantage, Thermofinnigan,Bremen, Germany) described in detail in Study V. The deviation of the sample 15N/ 14Nratio from that of the atmosphere ( 15N) was calculated as follows:
{ } 10001tan
15 ×−=dards
sample
RR
Nδ (2)
3.8 Leaf biomass estimates
To estimate the total leaf biomass in A. senegal, destructive sampling of trees was usedto develop an allometric equation based on the tree basal diameter (BD) at ground level(Study V). A total of 30 trees were cut at the ground level, and the dry weights ofleaves, stems and branches were determined. A regression equation was derived basedon (BD) as the independent variable:
Y = -0.8019 + 0.31272BD, R2 = 0.76, (P < 0.0001) (3)
3.9 Data analysis
Analysis of variance was performed, whenever needed, using the General LinearModel (GLM) procedure of the statistical software SPSS 10 for Windows 2000.Regression analysis was done using the JMP 3.2 statistical package (SAS 1997).Tukey’s HSD test and Student t-tests (Steel and Torrie 1980) were performed to

48
determine the possible differences between the means. Significance levels, if nototherwise mentioned, were P < 0.05.
Table 1. Soil characteristics of the study site in the Blue Nile region, Sudan.Soil depthParameter
0-25 cm 25-50 cm 50-75 cmParticle size distribution Coarse sand (%) 34 32 40 Fine sand (%) 7 10 10 Silt (%) 19 14 12 Clay (%) 40 41 38 Bulk density (g cm-3) CaCO3 (%)
1.4 0.0
1.6 0.0
1.64 0.6
Exchangeable bases Na (cmol kg-1) 0.91 2.35 2.3 K (cmol kg-1) 0.48 0.38 0.43CEC (cmol kg-1) 38 40 36OC (%) 0.324 0.312 0.312N (%) 0.024 0.022 0.021C/N ratio 14 14 15Available P (mg kg-1) 4.0 2.4 2.6Total P (mg kg-1) 393.0 268.0 228.5pH paste 7.2 7.5 7.7EC (ds m-1) 0.46 0.50 0.70SAR 2 2 3ESP (%) 2 5 6Soluble cations and anions meq L-1
(saturation extract) Na 1.8 2.4 3.7 Ca 1.5 1.5 2.5 Mg 0.5 0.5 0.5 Cl 1.4 1.8 3.4 CO3 0.0 0.0 0.0 HCO3 1.9 2.0 2.5
Particle size distribution: coarse sand 2 to 0.2 mm, fine sand 0.2 to 0.02 mm, silt0.02 to 0.002 mm, and clay <0.002 mm. CEC = cation exchange capacity, EC =electrical conductivity, SAR = Sodium adsorption ratio, ESP = exchange sodiumpercentage.

49
4. RESULTS
4.1 Soil conditions
The soil at the experimental site consisted of dark cracking clay, representative of theCentral Clay Plain of Sudan. This soil, because of its high montmorillonitic content,swells during the wet season and shrinks, forming deep cracks (> 1m deep), during thedry season. The infiltration rate is very slow (< 0.5 cm/hr), and the soil is thus highlyprone to waterlogging. The soil is inherently deficient in nitrogen, availablephosphorus and carbon (Table 1). The water-holding capacity is high and so is thepermanent wilting point (45% and 21%, respectively), and therefore the availablewater content is about 24%.
The soil at the research site was also rich in bases but poor in N and organic matter.The soil was alkaline, with a pH value ranging between 7.2 and 7.7 in the topsoil layer(0-75 cm) (Table1).
4.2 Water use
Water use (WU), defined as the initial soil water content minus the final soil watercontent added with precipitation, was calculated for the whole system from themeasured soil water content in all treatments. There were no significant differences inWU caused by types of intercropping, but highly significant (P 0.0001) differencesbetween years existed. Years 1999 and 2001 (i.e. the years with a high amount ofannual rainfall) showed the highest water use, while the WU was very low in 2002when the rainfall was exceptionally low (498 mm; Fig. 4).
4.3 Effect of Acacia senegal on crop yield (Studies I, II)
Yields of grain and straw of sorghum or sesame seeds and stalks showed no significantdifferences between different treatments compared to the control plots. The yield ofsesame stalks, however, seemed to vary in the different treatments, but this variationwas not significant (Table 2). Grain production in sorghum was significantlyinfluenced by the variation in the annual rainfall between the years (P = 0.02). Thehighest yield of sorghum grain was obtained when sorghum was intercropped with A.senegal at the spacing of 5x5 m. The highest sorghum grain yield was realized duringthe first and second year (1999, 2000; 2.04 t ha-1 and 1.48 t ha-1, respectively).Sesame seed and stalk production varied significantly during the different years ofstudy (1999-2002). This obviously also reflects the sensitivity of sesame to excesswater availability. The highest and lowest seed yields were observed in 1999 and 2001(0.64 t ha-1 and 0.14 t ha-1, P 0.0001), respectively.

50
4.4 Effect of crops on trees
Tree biomass
Tree height (H), basal diameter (BD) and crown diameter (CD) were significantly (P0.0001) affected by the treatments; however, the crop type had no effect on tree growthparameters, although tree growth varied between the years (Fig. 5 d, e, f).
Intercropping increased the tree height at a spacing of 5 x 5m, relative to control treesgrown without agricultural crops (Fig. 5 a). The tree height increased rapidly duringthe study period and thus showed significant variation between the years (P 0.0001).Intercropping with sorghum at a spacing of 5 x 5 m produced the tallest trees, whereastrees grown at 10 x 10 m spacing and intercropped with sesame were the shortest (1.77and 1.46 m, respectively).
The basal diameter (BD) of trees also varied significantly among the treatments (P0.0001). Similarly to tree height, the BD was largest in trees grown at the 5 x 5 mspacing intercropped with sorghum or sesame (6.24 and 6.03 cm) and smallest (5.08cm) at the 10 x 10 m spacing intercropped with sesame (Fig. 5 c). Following the samepattern, the tree crown diameter was also significantly affected by the treatments (P0.0001). Trees grown at 5 x 5 m or 10 x 10 m spacing and intercropped with sesameproduced the largest and the smallest tree crown diameters (2.63 m 2.14 m,respectively, Fig. 5 b).
4.5 Tree gum yield (Studies I, IV)
Trees were tapped for gum production for the first time when three and a half yearsold. Gum yield per tree showed no significant variation among different intercroppingsystems (Study I), but the gum production per hectare varied (P < 0.0001) due to thedifferent tree densities used. Gum yields were 33.0 kg ha-1 and 7.0 kg ha-1 at the firstround of tapping of trees 3.5 years old, grown in spacing of 5 x 5 m or 10 x 10 m,respectively. A significant positive correlation existed between the second or thirdpicking of gum on the one hand and the total gum yield per tree on the other (R2 =0.74, P < 0.0001; R2 = 0.48, P = 0.0002, respectively; Fig. 6 a, c). The data suggestthat the second gum picking seems to be a decisive factor in gum production and couldbe used as an indicator for the prediction of the total gum yield.

51
Fig. 4. Soil water content averaged over the profile as affected by different agroforestrysystems (a), date of measurement (b) and soil depth (c), and the water use of A. senegal indifferent agroforestry systems (d). In (a) and (d) Sg = sorghum, Se = sesame, C = control, 5 =5x5 m spacing, 10 = 10x10 m spacing. Trees were grown in the Blue Nile region, Sudan,during the study period from 1999 to 2002. Bars indicate standard errors.
SgCSeC
Sg5Se5
Sg10Se10
C5C10
Treatment
0.0
5.0
10.0
15.0
20.0
Soil
wat
er (m
m)
•
•
•
•
•
•
•
•
a
S 19
99N
199
9A
200
0S
2000
O 2
000
M 2
001
J 200
1JL
200
1S
2001
O 2
001
N 2
001
M 2
002
J 200
2A
200
2S
2002
O 2
002
N 2
002
Time (month)
10.0
20.0
30.0
40.0
Soil
wat
er (m
m)
•
•
•
•
•
•
•
•
•
••
••
• •
•
•
b
0-25 0-50 0-75Soil depth (cm)
0.0
10.0
20.0
30.0
Soil
wat
er (m
m)
•
•
•
c
SgCSeC
Sg5Se5
Sg10Se10
C5C10
Treatment
450.0
500.0
550.0
600.0
650.0
Wat
er u
se (m
m)
Mean = 547.7
d

52
Table 2. Sorghum and sesame yields in agroforestry systems in the Blue Nile region, Sudanin 1999-2002. Two spacings of A. senegal (5x5 m and 10x10 m) and the sole crop as acontrol were used. The annual rainfall at the site is also indicated.
Yield (t ha-1) 1999 2000 2001 2002 Average
Agroforestry system
Grain/seed
Stover/stalk
Grain/seed
Stover/stalk
Grain/seed
Stover/stalk
Grain/seed
Stover/stalk
Grain/seed
Stover/stalk
Sorghum 5x5 m 1.68 5.01 1.74 3.33 1.39 4.20 1.00 3.71 1.45
±0.174.06±0.36
10x10 m 1.30 4.48 2.10 4.12 1.45 4.63 1.64 4.46 1.62±0.17
4.42±0.12
Control 1.47 5.37 2.3 4.93 1.04 3.37 1.36 4.24 1.54±0.27
4.48±0.44
Sesame 5x5 m 0.61 1.50 0.35 0.80 0.11 0.36 0.43 0.77 0.38
±0.100.86±0.24
10x10 m 0.55 1.30 0.31 0.87 0.12 0.28 0.50 0.84 0.37±0.10
0.82±0.21
Control 0.76 1.90 0.30 0.74 0.20 0.49 0.40 0.71 0.42±0.12
0.96±0.32
Rainfall(mm) 859 625 824 498There were no differences in yield among treatments in a particular year (P < 0.05). Meansand standard errors are indicated (n = 4).

53
Fig. 5. Height (a), crown diameter (b) and basal diameter (c) of Acacia senegal treesgrown in agroforestry systems and on average in three successive years (d, e, f). Sg =sorghum, Se = sesame, C = control (no crop), 5 = 5x5 m spacing, 10 = 10x10 mspacing. Bars indicate standard errors. Adopted from Study (I).
Sg5 Se5 C5 Sg10 Se10 C10Treatment
0.0
0.5
1.0
1.5
2.0
Hei
ght (
m)
••
•
•
•
•
a
Sg5 Se5 C5 Sg10 Se10 C10Treatment
0.5
1.0
1.5
2.0
2.5
Cro
wn
diam
eter
(m)
••
•
•
•
• c
Sg5 Se5 C5 Sg10 Se10 C10Treatment
0.0
2.0
4.0
6.0
Bas
al d
iam
eter
(cm
)
••
•
•
•
• b
2000 2001 2002Year
0.5
1.0
1.5
2.0
2.5
Cro
wn
diam
eter
(m)
•
•
•
f
2000 2001 2002Year
0.0
0.5
1.0
1.5
2.0
Hei
ght (
m)
•
•
•
d
2000 2001 2002Year
0.0
2.0
4.0
6.0
Bas
al d
iam
eter
(cm
)
•
•
•
e
54
The gum yield of young trees showed no significant differences among provenances(Study IV), but clay provenances generally ranked higher compared to the sandprovenances in gum yield per tree. As found in the agroforestry experiments, asignificant positive relationship existed between the yield from the second or thirdpicking of gum on the one hand, and the total gum yield per tree on the other (P <0.0001; R2 = 0.78, 0.31, respectively; Fig. 6 b). As in the previous case, the data showthat the second gum picking was the main contributor to total gum production and thatit probably can be used as an indicator for the total gum yield. A strong negativerelationship was observed between the per-tree gum yield and 13C (P < 0.03, R2 =0.54, Fig. 6, Study IV). A positive relationship existed between soil water content andgum yield per tree (P < 0.0001, R2 = 0.47, 0.53, 0.52, and 0.49) for soil depths 0-25,25-50, 50-75, and 70-100 cm, respectively.
4.6 Nutrient content (Study I)
4.6.1 Nutrients amounts in the soil
Results for soil nutrient amount after four years of intercropping are presented in Fig. 7a-c, (see also Fig. 4, Study I). The total soil organic carbon amount was notsignificantly affected by the agricultural crops. Therefore, the data for agroforestrysystems having the same tree spacing were grouped together. The soil carbon contentwas however, highly affected by the year of observation (F = 10.08, P < 0.0001). Year2001 with high rainfall (824 mm) showed the highest amount of soil organic carbon.This variation was also significant in relation to soil depth: the amount of carbon in the0-25 cm stratum was greater than that for the other depths (F = 4.12, P = 0.02).
The total N in the soil did not vary significantly among treatments, but it tended to beslightly higher when trees were grown at 5 x 5 m spacing and intercropped withsesame (Fig. 7 b). Amount of N varied between years (F = 6.29, P = 0.0006), probablydue to successive input from the trees by N2 fixation and mineralization of organicmatter. The total N amount was highest in the uppermost stratum and decreasedsuccessively with depth (F = 4.84, P = 0.01).
The amount of exchangeable K varied significantly between years and was highest in2000 (0.53 ± 0.017%, P < 0.0001). No significant differences in K were observed inrelation to treatments or soil depth. Amounts of exchangeable P also variedsignificantly between years, being highest in 2001 with its high annual rainfall, (4.42 ±0.105%, P < 0.0001), followed by 2002.

55
Fig. 6. Relationship between gum yield per tree at separate pickings and totalgum yield per tree (a, c in agroforestry and b in provenance trial). Data werecollected during two years (2002 and 2003; trees were three and four years old,respectively).
0
100
200
300
400
500
0 50 100 150 200 250 300 350
Gum yield at second picking (g)
Y =125.1+1.04XR2 = 0.74P < 0.0001
a
0
50
100
150
200
250
300
0 50 100 150 200
Gum yield per tree at second picking (g)
Y =49.41+1.42XR2 = 0.78P < 0.0001
b
0
100
200
300
400
500
0 20 40 60 80 100 120
Gum yield at third picking (g)
Y=110.41+3.26XR2 = 0.48P = 0.0002
c

56
The C/N ratio was relatively low in 2002, which could be due to the effect ofagricultural crops and an increase of N in the topsoil through N2 fixation by trees(average decreases in the C/N ratios were 19.1%, 11.8% and 6.8% in the agroforestry,pure crop and sole A. senegal treatments, respectively). Soil exchangeable P showed nosignificant variation among treatments or soil depth, but in general P tended todecrease with an increasing soil depth and time (Fig. 7 c). The same trend wasobserved for total soil C.
4.6.2 Nutrient and C concentrations of trees
Concentrations of N, P, K and C in trees grown in the intercropping treatments weredetermined for samples of tree leaves and twigs collected annually after the end of therainy season and before trees shed their leaves. Different tree parts (leaves, branches,stem and roots) were also analysed for sample trees cut at ground level at age four.
Significant differences between tree parts were found in the P and K values (Fig. 8 a-c). The concentration of P in tree leaves was highest in the leaves of sole orintercropped acacias, except for the treatment where A. senegal was intercropped withsorghum at a spacing of 5 x 5 m. No significant variation among treatments wasobserved in N or C. Highly significant differences were observed between years in thecase of N, P, and C (P 0.0001). Year 2002 resulted in the highest level of tree N; thiscould be because, as trees grew older, they accumulated more N in their total leaf mass.On the other hand, the same year showed the lowest P concentrations in tree leaves.This was a trend different from the one found in the other nutrients. A decrease in Pcould have been due to the ageing of trees; as they grew older, the P concentrationsdecreased or there was some P translocation to other tree parts.
The total C concentration in trees was high during the second year and low during thelast year of observation. K showed no significant variation. The interaction betweentreatments and years was significant only for the K and C concentrations (F = 2.03,2.19, P 0.048 and P 0.03, respectively). After four years of intercropping, theabove-ground biomass of A. senegal (on average, for trees with 5 m or 10 m spacing)had accumulated N ca. 18 kg ha-1, P 1.21 kg ha-1, K 7.8 kg ha-1 and OC 972 kg ha-1
(Table 3).
4.6.3 Nutrient amount of crops (Study I)
In Study I, in agricultural crops, the N and C amounts varied among treatments(averages for N were 21.97 ± 2.8, 51.75 ± 2.51 kg ha-1, and for C 598.9 ± 89.95,2576.1 ± 106.53 kg ha-1 for sesame and sorghum, respectively). The N and C amountswere higher in sesame than in sorghum. No significant variation among treatments wasobserved in P or K (the averages were 2.46 ± 0.53 and 11.11 ± 1.14 for sesame, and9.81 ± 1.5 and 46.6 ± 2.4 kg ha-1 for sorghum, respectively). However, the valuesvaried considerably between years. N, P and K levels were higher in 2000 as compared

57
to the other years. At the same time, the C amount in crops was low in that particularyear and high during the rest of the period. The variation between years and theinteraction among treatments and years were highly significant (P 0.0001 for P andK; P = 0.006 for N, and P 0.05 for C; Table 4).
4.7 Tree provenance variation (Studies III, IV, V)
Soil water
In the study of Acacia senegal provenance variation, significant (P < 0.0001)differences in soil water content at different soil depths were recorded. Trees tended touse water in the 0-50 cm topsoil during the wet season and depend on water from thesubsoil layers in the dry season. No variation in water use among the provenances wasobserved (P > 0.97). However, the soil water balance under different A. senegalprovenances showed significant variation (P < 0.0001) which depended on thesampling date (Fig. 1, Study IV).
Tree height
The Acacia senegal provenances observed in the present studies did not differsignificantly in height, basal diameter or the number of branches during the first year,but later, with time, clear-cut significant differences among provenances were observed(Fig. 2 a, Study IV).
Provenances originating from the clay soil area maintained a taller height (F = 5.29, P< 0.02) as compared to provenances from the sand soil area; respective average heightswere 1.94 ± 0.04 and, 1.82 ± 0.03 m at the end of the four-year observation period.Provenance Bout (BO) ranked highest, followed by Mazmoom (MZ), whileprovenance Semaih (SE) produced the smallest height (1.98, 1.96, and 1.75 m,respectively). These were 5.9% and 4.8% above, and 6.4% below the overall averageof 1.87 m, respectively.

58
Fig. 7. (a) Total soil carbon, (b) total soil N and exchangeable K, and (c) exchangeable P in 0-25 cm soil stratum after 4 years of Acacia senegal intercropping with sorghum or sesame. In(a) AF = agroforestry, 5x5 and 10x10 refer to tree spacing (m), initial = before the start of theintercropping treatments. In (b) and (c), for acronyms, cf. Fig. 4.
InitialAF5x5
AF10x10Pure crop
Trees 5x5Trees 10x10
Treatment
0
2
4
6
8
10
12
14
16
Soil
C (t
.ha-
1)
a
InitialSgC
SeCSg5
Sg10Se5
Se10C5
C10
Treatment
0
2
4
6
8
10
12
14
Soil
P (k
g ha
-1)
c
00.10.20.30.40.50.60.70.80.9
1
Initial SgC SeC Sg5 Sg10 Se5 Se10 C5 C10Treatment
Soil
N a
nd K
(t h
a-1)
N t ha-1 K t ha-1
b

59
Fig.8. Nutrient and carbon concentrations in tree parts in A. senegal (stem, branches, leavesand roots). (a) nitrogen and potassium, (b) phosphorus, and (c) total C; after 4 years ofintercropping with sorghum or sesame. Bars indicate standard errors.
0
1
2
3
4
Stem
Bra
nch
Leav
es
Roo
t
Stem
Bra
nch
Leav
es
Roo
t
Stem
Bra
nch
Leav
es
Roo
t
Sorghum Sesame Sole trees
N a
nd K
conc
entr
atio
ns in
tree
par
ts (%
dry
wei
ght) N% K %
a
42.5
43
43.5
44
44.5
45
45.5
46
46.5
Stem
Bra
nch
Leav
es
Roo
t
Stem
Bra
nch
Leav
es
Roo
t
Stem
Bra
nch
Leav
es
Roo
t
Sorghum Sesame Sole trees
Car
bon
in tr
ee p
arts
(% dr
y w
eigh
t) c
0
0.02
0.04
0.06
0.08
0.1
0.12
Stem
Bra
nch
Leav
es
Roo
t
Stem
Bra
nch
Leav
es
Roo
t
Stem
Bra
nch
Leav
es
Roo
t
Sorghum Sesame Sole trees
P in
tree
par
ts (%
dry
wei
ght) b

60
Table 3. Above-ground nutrient (N, P, K) and carbon (OC) accumulation per hectare inAcacia senegal trees in agroforestry systems and without intercropping at two spacingsafter 4 years of growth. Treatment N (kg ha-1) K (kg ha-1) P (kg ha-1) OC (kg ha-1)Spacing 5x5 m 30.2 12.54 1.98 1590.6Spacing 10x10 m 5.3 2.97 0.43 353.3Sole trees (control) 5x5 m 14.0 5.98 0.93 930.1Sole trees (control) 10x10 m 3.5 1.50 0.23 232.5
Table 4. Soil nutrient balance (kg ha-1; top 25-cm layer) in Acacia senegal agroforestrysystems and control treatments (sole trees or crops) after 4 years of measurement.Treatment1
Nutrient Cropexport(harvest)
Trees(abovegroundbiomass)
Changesin soilafter 4years
Output Initialinputfromsoil
Netnutrientgain (+)or loss(-)
Sg5 N 206 30 811 1017 840 -147Sg10 N 202 5 621 823 840 +22SgC N 214 - 793 1007 840 -167Se5 N 89 30 904 993 840 -123Se10 N 86 5 630 716 840 +129SeC N 89 - 648 737 840 +103C5 N - 14 677 677 840 +177C10 N - 4 660 660 840 +184Sg5 K 40 125 580 620 700 +205Sg10 K 47 30 700 747 700 -17SgC K 56 - 560 616 700 +84Se5 K 7 125 590 597 700 +228Se10 K 8 30 700 708 700 +22SeC K 8 - 670 678 700 +22C5 K - 60 710 710 700 +50C10 K - 15 670 670 700 +45Sg5 P 5 2 7 12 14 +4Sg10 P 6 0 13 19 14 -4SgC P 6 - 7 13 14 +1Se5 P 1 2 12 13 14 +3Se10 P 3 1 12 15 14 0SeC P 2 - 13 15 14 -1C5 P - 1 14 14 14 +1C10 P - 1 12 12 14 +3
1Sg = sorghum, Se = sesame, C = control, 5 = 5x5 m spacing, 10 = 10x10 m. Initialinput refers to the situation before the start of intercropping treatments.
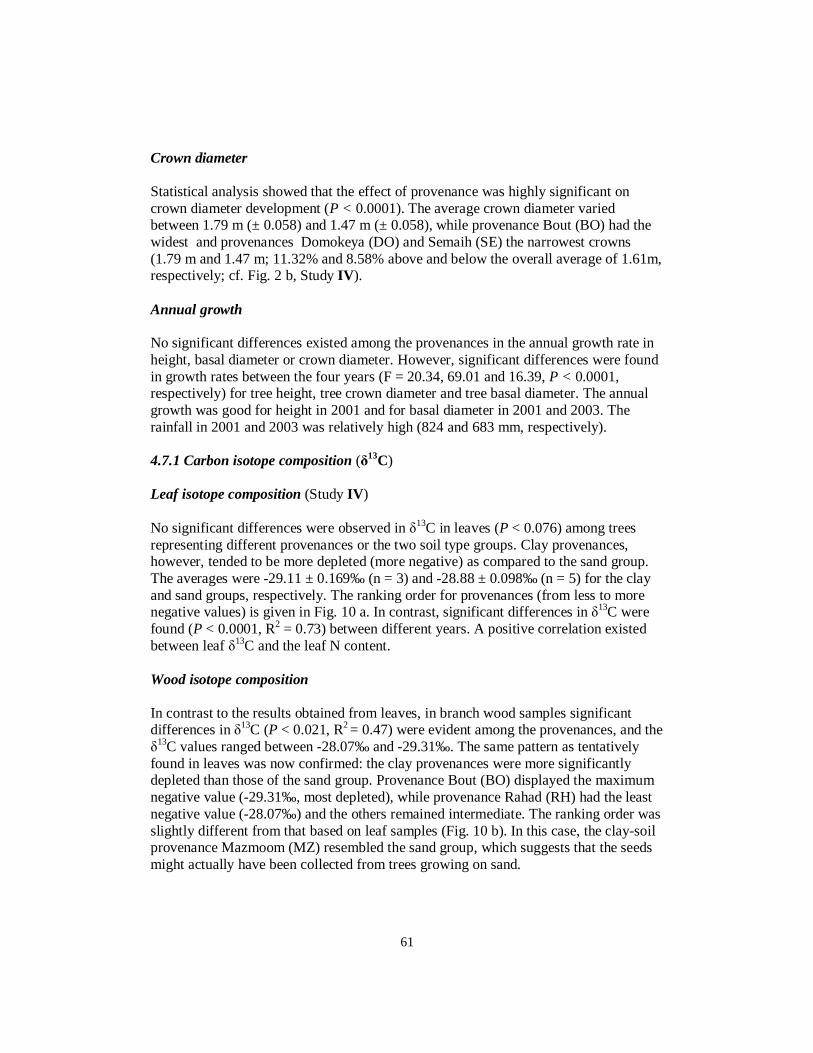
61
Crown diameter
Statistical analysis showed that the effect of provenance was highly significant oncrown diameter development (P < 0.0001). The average crown diameter variedbetween 1.79 m (± 0.058) and 1.47 m (± 0.058), while provenance Bout (BO) had thewidest and provenances Domokeya (DO) and Semaih (SE) the narrowest crowns(1.79 m and 1.47 m; 11.32% and 8.58% above and below the overall average of 1.61m,respectively; cf. Fig. 2 b, Study IV).
Annual growth
No significant differences existed among the provenances in the annual growth rate inheight, basal diameter or crown diameter. However, significant differences were foundin growth rates between the four years (F = 20.34, 69.01 and 16.39, P < 0.0001,respectively) for tree height, tree crown diameter and tree basal diameter. The annualgrowth was good for height in 2001 and for basal diameter in 2001 and 2003. Therainfall in 2001 and 2003 was relatively high (824 and 683 mm, respectively).
4.7.1 Carbon isotope composition ( 13C)
Leaf isotope composition (Study IV)
No significant differences were observed in 13C in leaves (P < 0.076) among treesrepresenting different provenances or the two soil type groups. Clay provenances,however, tended to be more depleted (more negative) as compared to the sand group.The averages were -29.11 ± 0.169‰ (n = 3) and -28.88 ± 0.098‰ (n = 5) for the clayand sand groups, respectively. The ranking order for provenances (from less to morenegative values) is given in Fig. 10 a. In contrast, significant differences in 13C werefound (P < 0.0001, R2 = 0.73) between different years. A positive correlation existedbetween leaf 13C and the leaf N content.
Wood isotope composition
In contrast to the results obtained from leaves, in branch wood samples significantdifferences in 13C (P < 0.021, R2 = 0.47) were evident among the provenances, and the
13C values ranged between -28.07‰ and -29.31‰. The same pattern as tentativelyfound in leaves was now confirmed: the clay provenances were more significantlydepleted than those of the sand group. Provenance Bout (BO) displayed the maximumnegative value (-29.31‰, most depleted), while provenance Rahad (RH) had the leastnegative value (-28.07‰) and the others remained intermediate. The ranking order wasslightly different from that based on leaf samples (Fig. 10 b). In this case, the clay-soilprovenance Mazmoom (MZ) resembled the sand group, which suggests that the seedsmight actually have been collected from trees growing on sand.

62
Fig. 10. (a) Mean 13C in leaves of different Acacia senegal provenances in 2000–2002and (b) that in wood in 2002 (summer). Trees were grown on clay soil in the Blue Nileregion, Sudan. Bars indicate standard error. The first three provenances originate fromclay soil and the others from sand soil areas.
Bou
t
Maz
moo
m
Ged
aref
Dom
okey
a
Nab
ag
Saat
a
Rah
ad
Sem
aih
Provenance
-29.6
-29.4
-29.2
-29.0
-28.8
-28.6
-28.4
•
•
•
•
•
•
•
•13
C (‰
)
a
Bou
t
Maz
moo
m
Ged
aref
Dom
okey
a
Nab
ag
Saat
a
Rah
ad
Sem
aih
Provenance
-29.4-29.2-29.0-28.8-28.6-28.4-28.2-28.0-27.8-27.6-27.4-27.2
•
•
•
•
•
•
•
•
13C
(‰)
b

63
A positive relationship between 13C in the year 2000 and that in the subsequent year2001 existed (P = 0.024, R2 = 0.76). There were temporal changes in 13C: valueswere, on average, most depleted in 2001. The variation in depletion associated withtime was the small but significant.
4.7.2 Estimates of biological N2 fixation (Study V)
The leaf nitrogen concentration ( 15N-total concentration) as found in the A. senegalprovenances is presented in Fig. 11 a-b. The 15N in the leaves differed significantly (P= 0.026) between the A. senegal provenances and the reference tree species (B.aegyptiaca). In acacias, the highest and lowest mean 15N values were 5.65 ± 0.428‰and 3.81 ± 0.328‰, respectively, whereas the corresponding value for the referencetree species was 7.02 ± 0.012‰. There were no significant differences (P = 0.32)among provenances. Provenance Rahad (RH) exhibited the lowest and provenanceBout (BO) the highest 15N. There was no significant difference in 15N between thetwo provenance groups based on soil type. A highly significant (P < 0.001) variation in
15N existed among years. The highest amount of N fixed seemed to be associated withthe highest annual rainfall (824 mm in 2001).
All acacia provenances showed a decrease in 15N indicating increase in N2 fixationwith age (Fig. 11 a). The %Ndfa values for provenance Rahad (RH), showing thehighest average N2 fixation, were 28, 48 and 61, or 22, 37 and 48, and those inprovenance Bout (BO), showing the lowest N2 fixation, 0, 30 and 34 or 0, 23 and 26using assumption 1 or 2 for the three different years, respectively (Table 5).
In acacias, there were significant differences in %Ndfa between years (P = 0.001, Figs.12, and 4 in Study V). The mean %Ndfa values, with assumption 1, for the differentyears were 16 ± 3.7, 32 ± 2.8 and 40 ± 3.7, and with assumption 2, 13 ± 3.1, 26 ± 3.1and 31 ± 3.1, respectively (Fig. 4 a, b in Study V).

64
a)
0123456789
2000 2001 2002
Year
15N
(‰)
BOMZGEDONASARHSEB. aegyptiaca
2
3
4
5
6
7
8
BO MZ GE DO NA SA RH SE BA
Provenance
b)
15N
(‰)
Fig. 11. (a) Variation in 15N in Acacia senegal provenances and Balanites aegyptiaca(BA) in different years, and (b) that in three successive years combined. (For provenanceacronyms, cf. Table 1). Bars indicate standard error. The horizontal line refers to totalresponse sample mean. Adapted from Study V.

65
Table 5. Estimates of the contribution of N2 fixed from the atmosphere (%Ndfa) byAcacia senegal provenances calculated with the 15N natural-abundance methodusing Balanites aegyptiaca as non-N2-fixing reference. Trees were grown on claysoil in the Blue Nile region, Sudan. 15Na values of 0‰ and -2‰ were used forassumptions 1 and 2, respectively. n = 3.
Provenance %Ndfa
Year 2000 Year 2001 Year 2002
15N N-free assumption
0‰ -2‰ 0‰ -2‰ 0‰ -2‰
Bout (BO) 0 0 30 23 34 26
Mazmoom (MZ) 19 15 30 23 31 24
Gedaref (GE) 26 20 32 25 38 29
Domokeya (DO) 1 1 23 18 41 32
Nabag (NA) 0 0 25 19 35 27
Saata (SA) 21 16 32 25 37 29
Rahad (RH) 28 22 48 37 61 48
Semaih (SE) 32 25 39 31 40 31

66
Estimates of nitrogen amount in leaves
The total amount of leaf N was estimated from the leaf N concentration. There were nosignificant (P = 0.74) differences between different acacia provenances, whereas theyears showed a highly significant variation (P = 0.0013). Year 2001, with a highannual rainfall (824 mm), ranked high compared to the rest. Highest amounts observedwere, in 2002, 46.7 and 36.4 kg of leaf N in provenance Rahad (RH). Provenance Bout(BO), which was native to the region, yielded 32.8, or 25.47 kg ha-1 of leaf N, based onassumptions 1 or 2, respectively (Table 3, Study V). These results suggest a meanannual contribution of 21.6 and 20.0 kg ha-1 of fixed N2 to the total leaf N by the clayand sand soil provenance groups, respectively, when grown on the present clay-soilexperimental site.
The average amount of N accumulated in A. senegal leaves in four years equalled0.077 kg N per tree, which was equivalent to 85.8 kg N ha-1 in provenance Bout (BO)and 0.059 kg N per tree, equivalent to 66.1 kg N ha-1, in provenance Rahad (RH).
Fig. 12. Average %Ndfa pooled over eight Acacia senegal provenances in 2000-2002. Bars indicate standard error. The annual rainfall is also indicated.
05
10152025303540
2000 2001 2002
Year
% N
dfa
0100200300400500600700800900
Ann
ual r
ainf
all (
mm
)
Ndfa rainfall

67
5. DISCUSSION
5.1 Effect of Acacia senegal on crop yield
In this study, the crop grain or seed yields were not influenced by intercropping withtrees, regardless of agricultural crop type or tree density. This probably reflects the factthat the agroforestry systems tested were still young. Based on general informationavailable from the Blue Nile, intercropping with A. senegal could possibly continue formore than five years without a risk of crop yield reduction. Obviously, there was littlecompetition for water between trees and crops, even if water is normally the limitingfactor for crop growth on dryland (Feng and Epstein 1995). The results show asensitivity of sesame to excessive water: a low sesame yield was observed during yearsof high rainfall.
As trees grew older, their water use increased. Dawson (1996) has confirmed thatlarger trees use more water than smaller ones, suggesting also water use by trees ofdifferent size is proportional to their leaf area.
Trees seem to utilise the water in the topsoil rather than that below. However, thepresent data show that there is no detrimental effect of competition between trees andcrops during an early stage of agroforestry system development. Under an A. senegalagroforestry system with trees four years of age, the clay soil had enough water tosupport the crop plant growth for the whole growing season up to crop maturation andharvest.
Kaushik and Kumar (2003) observed high yields from pearl millet (Pennisetumtyphoides Rich), cluster bean (Guar bean) and cowpea (Vigna unguiculata (L.) Walp.)in association with “khejri” (Prosopis cineraria (L.) Druce trees. Increased crop returnsfrom a tree-crop combination as compared to sole crops have been reported by Reddyand Sudha (1989). Droppelmann et al. (2000) observed similar results, and Ong et al.(2000) reported that the yields of intercrops (Sorghum or Vigna) in combination withpruned trees were similar to crop yields obtained without trees. This shows that therecan be complementarity in resource use between different agroforestry systemscomponents. Negative effects of tree hedges and alley cropping designs on the yieldsof annual intercrops have been found at the tree/ crop interface in most studies insemiarid regions under rain-fed conditions (cf. Rao et al. 1991, Jama et al. 1995,Govindarajan et al. 1996, Heinemann et al. 1997).
In the present study the soil nutrients were also sufficient to support crop growth incombination with trees; this shows that there is facilitation and complementarity inresource sharing and use between agricultural crops and A. senegal.
68
The reduction in sesame yield during two years of high rainfall (with 625 and 824 mmof precipitation) was probably due to the fact that sesame does not grow well in poorlydrained and heavy clay soil like that commonly found in the Blue Nile region. Oplingeret al. (1990) and Langham and Wiemers (2002) reported that, in sesame, excessivemoisture is not beneficial, and extended periods of rainfall or high air humidity maycause leaf diseases. Sesame plants standing in water for more than a few hours may bekilled. In contrast, sesame could do well in areas of 400-500 mm of annualprecipitation, and it will respond to irrigation if applied properly (Langham andWiemers 2002). In the present study, sorghum failed to produce a higher than averagegrain yield in 2001. That was a year with a long rainy season and high annual rainfall(824mm). The erratic rainfall in July and August in that year, however, may haveaffected the sorghum yield negatively.
A varying quantity and distribution of the annual rainfall and an increasing maturity ofthe trees thus seemed to result in changes in tree/crop interactions. The present studiessuggest that intercropping of A. senegal with annual crops is advantageous in terms ofcrop yield and diversity. In contrast to sole stands of trees or crop monoculture, in anA. senegal agroforestry system the farmer can get from the same piece of land twodifferent crops at different times of the year. The use of optimal tree spacing seems tobe an effective management tool to increase the overall biomass and productivity perarea in rainfed dryland farming and in restocking of the gum belt.
5.2 Tree growth parameters
In this study the growth rate of trees was affected positively by association with annualcrops. This could be explained by the fact that trees also benefited from cropmanagement practices. The slow tree growth in sesame plots with a wider tree spacingcould be due to the fact that trees were not competing for resources with sesame duringtheir initial years of growth or to the low tree density of 100 trees ha-1. In comparison,Ong et al. (2000) reported that crops affected the growth of Grevillea robustanegatively during early stages of intercropping due to competition for the availableresources.
Plants compete for resources irrespective of whether they grow in sole stands or asspecies mixture. The degree of competition between individual plants depends on thedemand for and the availability of growth resources, as well as on the ability of thecomponent species to exploit a shared resource pool. Therefore, a production systemthat makes optimal use of the resources shows the highest productivity. In the presentstudies, it was found that the highest overall productivity was reached when A. senegalwas planted at a high density with annual crops.
The temporal variation in the growth rate of trees between years was obviously mainlydue to annual rainfall fluctuations and subsequent variations in the net assimilation

69
rate. The highest relative growth rate was recorded during years with good rainfall. Thegrowth rate was not consistent over time, showing variation between years.
5.3 Nutrient concentrations and uptake by trees
Concentrations of nutrients in tree tissues found in this study were similar to thosereported for A. senegal by Breman and Kessler (1995) and Deans et al. (1999).Bernhand-Reversat and Poupon (1980) found N concentrations of 0.5%, 0.6% and3.0% in stems, branches, twigs and leaves, respectively.The reported range of tissue-nutrient concentrations in A. senegal seedlings has beenobserved to increase with increasing soil fertility (Colonna et al. 1991). Concentrationranges, obtained by these authors, were 3.1-4.2%, 0.11-0.21% and 1.1-1.6% for foliarN, P, and K, respectively, and their data indicated that the soils in which the trees grewwere under nutrient deficiency, approaching the lower soil-fertility range. Ong et al.(2000) have reported that the foliar P amount was lower in sole crop plots than inGrevillea robusta agroforestry systems.
In the present investigation, the P concentration of woody tissues decreased as the treesaged, and it was higher in tree roots as compared to above-ground parts. Deans et al.(1999) reported similar results. Sterck et al. (1991), studying Faidherbia albida (Del.)A. Chev., observed decreasing internal concentrations of both N and P as the tree partsaged. These results suggest considerable internal translocation of P from woodytissues. Similar results on P translocation in A. senegal were reported by Deans et al.(1999). Considerable internal translocations of P and K from woody parts werereported for many species by various authors (cf. Pierre 2002). Thus, it seems that treescontain sufficient reserves of P in their tissues to maintain growth in the future evenwhen the soil P level is a limiting factor. In addition, limitations in P availability arebalanced by cycling of this nutrient through litter fall.
An increase in N in tree tissues as result of a high density of trees intercropped withsesame in the present studies was possibly explained by the fact that A. senegal obtainsN from symbiotic N2 fixation (34-61% of total N). A higher total nutrient uptake bytrees in agroforestry systems can be interpreted as more efficient resource use ascompared to monoculture.
Present results on exchangeable K suggest that trees can tap it from deeper soilsources, since the site now studied was rich in K. Recycling of nutrients from deepersoil layers was the most likely cause for increase in topsoil fertility associated with thepresence of trees. Similar results for legume trees were observed by Palm (1995) andSprent (1995) and for the A. senegal growing in Senegal by Deans et al. (1999).
Intercropped trees not only take up less nutrients from the topsoil than a cropmonoculture but they also contribute to an increase in the N concentration of the soil

70
under agroforestry. Root and nodule turnover could also be held responsible for this, asreported by Lehmann and Zech (1998).
5.4 Nutrient concentration and uptake in crops
The uptake of nutrients by sorghum or sesame did not considerably affect the sitenutrient budget during the four cropping seasons of the present investigation. Incontrast, the annual rainfall seemed to have a clear effect. The uptake increased duringyears with high total rainfall and good rainfall distribution. A high annual rainfall withan erratic temporal distribution decreased the uptake of nutrients by sesame. Inparticular, that was obvious in year 2001 with an annual rainfall of 824mm. The uptakeof all nutrients was higher in agroforestry systems than in sole crops, suggesting thatthe resource use was more intensive in agroforestry system than in monoculture.Similar results have been reported by Lehmann et al. (1999) in an agroforestry systemcombining sorghum and Acacia saligna in northern Kenya.
Of the different tree parts in A. senegal the N concentration was highest in the leaves,and since the leaves are shed on to the site and captured in clay cracks (unlike thesituation on sandy soil), this has positive effects on N cycling. On the other hand, the Kconcentrations were highest in the roots, stems and branches. Even if there was no riskfor depletion of K on the present site, that could pose a risk at the end of the treerotation, especially if the trees are to be taken away from the site.
5.5 Nutrient dynamics under cultivation
When land is opened up for farming, the soil N content usually decreases. This ismainly a consequence of an increased rate of oxidation of the soil organic matter (Wild1988). In subsequent years, the annual loss can be lower, and almost all of it can bebalanced by the nitrogen fixed by the trees.
In soil profiles most of the phosphate is usually located in the surface soil strata. Inuncultivated soils, the phosphate will accumulate near the soil surface because of itscycling through vegetation and deposition in litter. Hence the circulation that leads toincreased soil organic matter contents also generally leads to increased soil organicphosphorus concentrations. It is commonly assumed that the soil organic P is deriveddirectly in or after biochemical transformations, from crop residues and leaf litter,where P is present in organic compounds (Wild 1988).
In the present studies, the nutrient balance was slightly negative for N, and also for P ifall the above-ground annual crop biomass was exported (Table 4). Any improvementof the soil nutrient status under these systems would need a long enough time to occur(cf. Ong and Leakey 1999). When the long-term tree or crop production potential is

71
considered, the supply of P seems to be a critical factor. The integration of A. senegalinto this cropping system seems to ensure high nutrient use efficiency. Similar resultswere reported by Lehmann et al. (1999) and Deans et al. (1999). An increase in wateruse-efficiency paralleling for most trees the trend of CO2 concentration increase in theatmosphere might also improve the transpiration efficiency in acacias (Luukkanen1991). This would allow dryland trees to grow rapidly and act as an effective carbonsink for the anthropogenic CO2 (Feng 1999, Koskela et al. 2000).
Estimates from the present study indicate that ca. 217 kg ha-1 of K and 1500 kg ha-1 ofOC were added to the top 25-cm of soil during four years of annual crop cultivation ina mixture with A. senegal at 5 x 5 m spacing (corresponding to 400 trees ha-1).However, the below-ground biomass was not included in these calculations, due todifficulties in excavating the root system in clay soil.
5.6 Nitrogen input of A. senegal
Previous research is not available on the variation in leaf biomass of A. senegal in itsnatural habitat. In the present work, an allometric equation similar to that used by Puiget al. (1990) was applied. The amount of leaf biomass in the present studies rangedfrom 1.3 to 2.6 t ha-1 (Equation 3). Due to small variation in basal diameter valuesamong the acacia provenances, there were only small differences in the leaf biomassestimates observed (the tree stand density was similar for all the provenances, 1,111trees ha-1). These biomass estimates were consistent with those reported earlier, in N2-fixing legumes and Pterocarpus lucens, by Puig et al. (1990), and by Roggy et al.(1999) and Sylla et al. (2002) in other tropical semi-arid ecosystems similar to those ofthe present investigation.
Root nodules were found in the nursery, but they were not detected under fieldconditions. Johnson and Mayeux (1990) postulated that nodules cannot be detected insome N2-fixing tree roots at certain of sites, even when compatible rhizobia are presentin the soil, because they decompose rapidly or are too small to be detected, or becausethey are located at 5-10 m depth.
The value for 15N was higher (5.19‰), but not significantly, in the clay soil group ofprovenances, as compared to that in the group originating from the sandy soil areas(4.85‰). This probably reflects the fact that A. senegal trees growing on clay initiallydepend on the soil N for growth and start their symbiotic N2 fixation later. This wasobserved for the whole provenance group from the clay plain. In contrast, provenancescollected from the area of N-poor sandy soils obviously started the N2 fixation earlier.Provenance Rahad (RH) showed low 15N values and high %Ndfa values. The influenceof rainfall in the process of N2 fixation was not highly evident, suggesting thatadequate soil water was available during the growing seasons throughout the study.

72
The difference in 15N values between Balanites aegyptiaca and the A. senegalprovenances was significant enough to detect acacia trees with only a slightcontribution of N2 fixation to their total nitrogen. These estimates of N2 fixation (withlow standard errors) were similar to those reported by Roggy et al. (1999) in oxisols. Inthe present study, only the leaf 15N abundance was used, since the variation in 15Nbetween different tree organs is usually very small. Ladha et al. (1993) reported nodifferences in 15N abundance between the trunk, branch or leaf samples taken fromnodulated Gliricidia sepium or from Senna spectabilis. Ndoye et al. (1995), whenstudying different acacias including A. senegal using the 15N isotope dilutiontechnique, found that leaves and stems showed similar 15N enrichment. Similarly, otherestimates of %Ndfa do not seem to differ significantly between different plant parts, orbetween whole trees grown in greenhouse or in the field (Danso et al. 1995, Gueye etal. 1997, Sylla et al. 1998). However, some authors have reported differences in 15Nbetween different plant parts (Boddey et al. 2000).
In the present study, B. aegyptiaca had a high leaf 15N value (7.04‰), whereas A.senegal showed lowered ones, e.g. 3.81‰ in provenance Rahad (RH) and 5.65‰ inprovenance Bout (BO). This suggests that A. senegal is less dependent on soil N, ascompared to B. aegyptiaca, due to its ability to fix N in natural conditions. Amounts ofNdfa in the leaves of A. senegal provenances indicate that Ndfa represented 26 to 34% ofthe total nitrogen accumulated in provenance Bout (BO) and 48 to 61% in provenanceRahad (RH) using assumptions 1 and 2, respectively, in the four-year-old trees. Theseproportions are higher than those reported for Pterocarpus lucens by Sylla et al.(2002). Interestingly, Ndoye et al. (1995) reported 34.4% Ndfa in 5-month-old potted A.senegal plants.
Schulze et al. (1991) estimated the percentage of Ndfa as ranging from 10 to 30% inwoody Mimosaceae species along an aridity gradient in Namibia. Shearer et al. (1983)reported that N2 fixation might contribute 43-61% of the nitrogen in Prosopis spp.under conditions of very low mineral nutrient availability. The present results are inline with the findings of Ovalle et al. (1996) and Ndoye et al. (1995) and suggest thatAfrican acacias are potentially good N2-fixers, in contrast to the common belief thatthey are poor ones (cf. Dommergues 1987). The present results also suggest that the A.senegal provenance Bout (BO) has a good potential for reforestation and agroforestryprogrammes in the clay plain of the gum belt.
5.7 Provenance variation and adaptation
In the present study, significant differences were evident in the soil water balance atdifferent soil depths. Trees tended to use the water in the 0-50 cm topsoil stratum andvery little of that from the sub-soil during the rainy season. The water use was greaterduring the rainy season than during the dry season, as can be expected as a result fromwater availability. Trees from the wetter clay regions had a less conservative water-use

73
behaviour, grew faster, and produced more gum, as compared to those from the drier,sand soil regions. This agrees with earlier findings by Devitt et al. (1997) and Raebildet al. (2003).
The present results suggest that provenances from the eastern clay-soil part of the gumbelt are well adapted to that region and take the advantage of the short but intensiverainfall season by growing faster with a high photosynthetic rate and less conservativewater-use, which also results in superior growth and good gum production.
Tree height is usually considered an important variable in the evaluation of thevariation in performance among tree species and provenances. Height may also be seenas a measure of the adaptation of tree to its environment. This was in the present studydemonstrated by the local provenance Bout (BO), which was superior to the others interms of height (Fig. 2 a, Study IV).
The variability in adaptation between provenances is under genetic control. In thisstudy, the environmental effects on performance were small, since the provenanceswere grown under identical field conditions. For studying the interaction betweenenvironment and genotype, which may be present, field studies covering both soiltypes are needed.
Significant differences in basal diameter and crown diameter were found amongindividual provenances and in height, growth rate, 13C, and gum production betweenthe two provenance groups representing sand and clay soil. The differences detected ingrowth variables, gum production and 13C may reflect specific adaptation mechanismsin A. senegal. Physiological and morphological adjustments that take place in a plantduring water deficit can be divided into short and long-term responses. Theirimplications for field performance are controlled by the genetic characteristics of thetree and the growing conditions under which it has evolved (Verzino et al. 2003).The variation in annual growth between years was due to annual rainfall fluctuationsthat affected the relative growth rate (RGR). The highest annual growth rate wasrecorded during the years with good rainfall (2001 and 2003).
Antunez et al. (2001) stated that the variation in RGR among woody species is due tothe variation in leaf area ratio (LAR, whole plant area related to complete plant dryweight) which is also greater in deciduous species as compared to evergreens. Theysuggested that the specific leaf area (SLA), more than RGR, could be a significantparameter in determining the adaptive advantages of evergreens in dry or nutrient-poorenvironments and deciduous species growing on fertile soils. The differences in the netrate of production per unit of dry weight (RGR) in plants can be attributed either toenvironmental conditions, or to inherent genetic traits (Poorter 1990). It has beenreported (Warren and Adams 2004) that species originating from more arid habitatshave a higher specific leaf density and nitrogen content, as also was the casedemonstrated here by the acacia provenances from the sand soil areas.

74
5.8 Carbon isotope composition
In the present studies, A. senegal provenances from the clay part of the gum belt hadconsistently more negative 13C values and a higher growth rate than those from thesand areas. This indicates a conservative water use behaviour in the latter group (lessnegative 13C). A lower 13C (higher intrinsic water use efficiency) could be due tohigher rate of carbon assimilation. These differences were maintained over the wholeexperimental period.
In this investigation, the carbon isotope composition of leaves and branch wood wasdetermined separately. It has been reported by a number of investigators that in a tree,woody parts are often more enriched in 13C than the leaves. The present data show thatleaves and branches differed in their 13C composition, with the branches having high
13C values. Variation in 13C with tissue type has been reported in earlier tree studies(Schleser 1990, Newton et al. 1996), which reinforces the need for consistent samplingof tissues. Variation in 13C could be due to inherent provenance and speciesdifferences in isotope discrimination, or to variation in sites factors such as wateravailability (Warren et al. 2001). Values of 13C measured in a common environmentwith ample resources are the best measure of the genetic or adaptive indicator for WUE(Condon and Richards 1992, Handley et al. 1994). This offers potential for evaluationand screening of tree species and to identify suitable genotypes for reforestation andrehabilitation of degraded dryland (e.g. Griffiths 1993, Newton et al. 1996).
Perennial plants having their genetic origin in drier environments often have higherWUE values than individuals of the same species from wetter environments (O’Leary1988, Ehleringer and Cooper 1988, Comstock and Ehleringer 1992). The strongnegative relationship now found between 13C and gum yield explains the fact that
13C was negatively correlated with variables that are normally positively related togrowth, such as net photosynthesis, transpiration and total biomass (cf. Li and Wang2003).
Carbon isotope composition can be used to determine the water availability to plantcommunities (Steward et al. 1995) or the genetic adaptation of plants to particularconditions of water supply (Anderson et al. 1996). A narrow crown, small leaf size andearly shedding of leaves that reduces the transpiration demand, are more characteristicsof the sand provenances of A. senegal as compared to the clay ones. The resultssuggest that the natural selection associated with the rainfall gradient, soil type andclimatic factors has resulted in genetic variation in physiological factors involved in
13C patterns for these populations. In A. senegal distinct differences in water-use andcarbon gain strategies among provenances thus appear to exist.
The gum production process in A. senegal seems to be highly affected by the soil watercontent (SWC) at different soil depths (cf. Gaafar 2005). The soil water contents atdepths of 25-50 and 50-75 cm in particular had a strong effect on this process. In clay

75
soil, cracks appear soon after the end of the rains, and most of the water in the topsoilthen evaporates. This explains the particular uptake of water from the subsequentdeeper layers. In clay soils, the soil water content at 100 cm depth seems to have littleeffect on the process of gum production, and trees seem not to be able to use the waterfrom this depth, which explains the weak relationship. However, the situation maychange as trees age. In sandy soils, the situation is completely different and trees usewater from deep soil strata (Gaafar 2005).
The local provenance Bout (BO) was efficient in the use of water available during theshort rainy season; this was reflected in its superior growth, high photosynthetic rateand high gum yield. As found in earlier studies, an increase in biomass may beexpected with an increase in water-use efficiency in dryland conditions where wateravailability limits the plant growth (Feng and Epstein 1995).
Present results prove that a more drought-tolerant A. senegal genotype is moreconservative in its use of water. This was the case in the sand provenances, inagreement with earlier findings on conifers by Warren et al. (2001). Less conservativewater-use is a characteristic trait for A. senegal provenances adapted to the Blue Nileregion, as exemplified by the local provenance Bout (BO) in the present study.
The changes in 13C values with time were small but significant, reflecting the fact thatthe growing conditions, particularly the rainfall patterns, were very different, forinstance, in 2000 and 2001. An increase in water use-efficiency in trees in general as aconsequence of an increase of the CO2 concentration in the atmosphere might alsoimprove the biomass growth and consequently the gum yield in A. senegal (cf.Luukkanen 1991). This would also allow dryland trees such as A. senegal to act as asuccessively more effective carbon sinks for the increased anthropogenic CO2 underthe predicted global atmospheric change (Feng 1999, Koskela et al. 2000).
6. CONCLUSIONS
No increase or decrease was observed in agricultural crop yield as a result ofintercropping with A. senegal at an early stage of agroforestry system management.However, patterns of resource capture by trees and crops may change as theagroforestry system matures; any reduction in crop yields could be compensated by theproduction of gum arabic from the acacia trees. Gum yields were 33.0 kg ha-1 and 7.0kg ha-1 at the first tapping of trees when three-and-a-half years old and grown inspacing of 5 x 5 m or 10 x 10 m, respectively.
This simultaneous agroforestry system could be an alternative, or at least a variant, ofthe more traditional A. senegal fallowing system. The simultaneous system has theadvantage of crop outputs at the start of the rotation when nothing can be harvestedfrom the trees.

76
Levels of N and K in trees were high, suggesting that lopping of branches andremoving them from the site or overgrazing in the dry season poses a potential threat toN and K budgets in the agroforestry systems.
There was little evidence that P increased in the topsoil as the agroforestry plantationsaged. The P uptake by roots appeared to be more or less balanced by losses throughlitterfall and root turnover of system components. However, A. senegal could have arole in the mineralization of the total P.
The soil carbon sink was considerable in the young agroforestry systems now studied.This indicates a potential of dryland agroforestry for long-term carbon sequestration inthe attempts to prevent a global climate change.
The total gum arabic production per tree in a certain year can be predicted from theyield in the second gum picking; this relationship can be used in planning andimplementing the annual gum harvest, for instance, in relation to fluctuations inagricultural crop production.
Intercropping of A. senegal with sorghum or sesame is an effective measure inreforestation and land rehabilitation for farming purposes in the central clay plain ofthe gum belt in Sudan.
Tree management and especially the application of appropriate tree spacing is animportant factor in determining the feasibility and success of agroforestry systems inthe drylands of the Blue Nile region.
A. senegal provenances formed two distinctly different groups that exhibited variabilityin their morphological growth parameters at the nursery and during the early fieldstage. The most outstanding result was the superior performance in terms of heightgrowth, branch number and basal diameter of the clay provenances. This suggestsadaptation of provenances in this group to their local environment. The early fastheight growth increases their importance for agroforestry and soil conservation in thedrylands of the Blue Nile, since their superior traits can shorten the establishmentperiod and protect the soil from excessive erosion by rains and overheating thatincreases the soil water evaporation and soil cracking.
Tree height, basal diameter and branch number are suitable indicators for the selectionof A. senegal genotypes for use in reforestation and agroforestry systems in the claypart of the gum belt. Branch number which is very important traditional criterion usedby farmers, indicates growth vigour and potential for gum production.
There is a genetic divergence in the carbon isotope composition between A. senegalprovenances from clay and sand soil areas of the gum belt in Sudan. This can berelated to the variation in the amount and timing of water availability and other

77
climatic and environmental factors, leading to intra-specific variation in adaptationmechanisms. Trees from the sandy part of the gum belt with a low and erratic rainfallhave less negative carbon isotope discrimination values. This indicates a conservativewater-use behaviour that results in slow growth rate.
Trees from the eastern, clay soil part of the gum belt where the rainfall is higher andthe conditions are more predictable have lower (more depleted) carbon isotopediscrimination values, thus displaying a less conservative water-use behaviour which,under the prevailing conditions, results in higher biomass and gum productivity andbetter adaptability to the specific Blue Nile clay plain environments. The presentinvestigation suggests that the carbon isotope discrimination method is helpful inevaluating the performance and productivity of planted A. senegal provenances ondifferent sites. The method also offers potential for evaluating the water use efficiencyof this species so as to identify appropriate genotypes that can be used in reforestation,rehabilitation and agroforestry programmes.
Growth traits, physiological characteristics and gum production can be used separatelyas criteria for genotype selection of A. senegal, since they are mutually correlated.
Selection and planting of the local clay provenances of A. senegal, as compared tounrelated material, in the Blue Nile region will lead to increases in biomass growth andgum production. Until more experimental field work on both soil types is conducted,planting of sand soil provenances is recommended for drought tolerance in the sandypart of the gum belt where water is a more severe limiting factor.
Further research should look into the genotype x environment interaction in A. senegalat different test sites over a wider range of environmental conditions within the gumbelt of central Sudan and ultimately over the entire gum belt of Sudano-SahelianAfrica.

78
REFERENCES
Abdalla, A.T., Stigter, C.J., Bakhiet, N.I., Gough, M.C., Mohamed, H.A., Mohammed,A.E. & Ahmed, M.A. 2002. Traditional underground grain storage in clay soils inSudan improved by recent innovations. Tropicultura 20: 170-175.
Allen, R.G., Pereira, L.S., Raes, D. & Smith, M. 1998. Crop evapotranspiration,Guidelines for computing crop water requirements. Irrigation and Drainage Paper No.56, FAO, Rome, Italy. 300 p.
Allen, S.E. (Ed). 1989. Chemical Analysis of Ecological Materials. BlackwellScientific Publications. Oxford. 368 p.
Alstad, G. 1991. The Influence of Acacia tortilis on Soil in Arid North-eastern Sudan.Bergen, Norway: University of Bergen. 79 p.
Anderson, J.E., William, J., Kriedemann, P., Austin, M.P., & Farquhar, G.D. 1996.Correlations between carbon isotope discrimination and climate of native habitats fordiverse eucalypt taxa growing in common garden. Australian Journal of PlantPhysiology 23: 311-320.
Antunez, I., Retamosa, E.C. & Villar, R. 2001. Relative growth rate inphylogenetically related deciduous and evergreen woody species. Oecologia 128: 172-180.
Ardö, J. & Olsson, L. 2003. Assessment of soil organic carbon in semi-arid Sudanusing GIS and the GENTURY model. Journal of Arid Environments 54: 633-651.
Arndt, S.K., Wanek, W., Clifford, S.C. & Popp, M. 2000. Contrasting adaptations todrought stress in field- grown Ziziphus mauritiana and Prunus persica trees: waterrelations, osmotic adjustment and carbon isotope composition. Australian Journal ofPlant Physiology 27: 985-996.
Austin, A.T. & Sala, O.E. 1999. Foliar 15N is negatively correlated with rainfall alongthe IGBP transect in Australia. Australian Journal of Plant Physiology 26: 293-295.
Austin, A.T. & Vitousek, P.M. 1998. Nutrient dynamics on rainfall gradient in Hawaii.Oecologia 133: 519-529.
Awe, J.O., Shepherd, K.R. & Florence, R.G. 1976. Root development in provenancesof Eucalyptus camaldulensis Dehn. Australian Forest Research 39: 201-209.

79
Ballal, M.E. 2002. Yield trends of gum arabic from Acacia senegal as related to someenvironmental and managerial factors: Doctoral thesis, Faculty of Forestry, Universityof Khartoum. Sudan. 105 p.
Ballal, M.E., El Siddig, E.A., Elfadl, M.A. & Luukkanen, O. 2005. Gum arabic yield indifferently managed Acacia senegal stands in western Sudan. Agroforestry Forum 63:237-245.
Barbier, E.B. 2000. The economic linkages between rural poverty and landdegradation: some evidence from Africa. Agriculture Ecosystems & Environment 82:355-370.
Barrios, E., Kwesiga, F., Buresh, R.J. & Sprent, J.I. 1997. Light fraction soil organicmatter and available nitrogen following trees and maize. Soil Science Society ofAmerica Journal 61: 826-831.
Begg, J.E. & Turner, N.C. 1980. Morphological adaptations to water stress. In: Turner,N.C. & Kramer, P.J. (Eds.), Adaptation of plants to water and high temperature stress,pp. 31-42. John Wiley & Sons, New York.
Belsky, A.J., Mwonga, S.M., Amundson, R.G., Duxbury, J.M. & Ali, A.R. 1993.Comparative effects of isolated trees on their under canopy environments in high- andlow-rainfall savannas. Journal of Applied Ecology 30: 143-155.
Bernhard-Reversat, F. & Poupon, H. 1980. Nitrogen cycling in a soil-tree system in aSahelian savanna. Example of Acacia senegal. In: Rowsswall, T. (Ed.), NitrogenCycling in West African Ecosystems. Proc. Workshop SCOPE/UNEP InternationalNitrogen Unit, MAB (UNESCO) and IITA, Ibadan, Nigeria, 11-15 Dec. 1978. pp. 363-369.
Bewley, J.D. & Krochko, J.E. 1982. Desiccation- tolerance. In: lange, O.L., Nobel,P.S., Osmond, C.B. & Ziegler, H. (Eds.) Physiological Plant Ecology 2. WaterRelation and Carbon Assimilation, pp. 325-378. Encyclopedia of Plant Physiology,New Series, Volume 12 B. Springer, Berlin.
Blackwell, P.S., Green, T.W. & Mason, W.K. 1990. Responses of biopore channelsfrom roots to compression by vertical stresses. Soil Science Society of America Journal54: 1088-1091.
Blake, G.R. & Hartge, K.H. 1986. Bulk density. In: Klute, A. (Ed.), Methods of soilanalysis, Part 1, 2nd ed. Agronomy 9, pp. 363-375.

80
Boddey, R.M., Peoples, M.B., Palmer, B. & Dart, P.J. 2000. Use of the 15N naturalabundance technique to quantify biological nitrogen fixation by woody perennials.Nutrient Cycling in Agro-ecosystems 57: 235-270.
Bolan, N.S. 1991. A critical review on the role of mycorrhizal fungi in the uptake ofphosphorus by plants. Plant and Soil 134: 189-207.
Bouillet, J.P., Laclau, J.P., Arnaud, M., M’Bou, A.T., Andre, L.S. & Jourdan, C. 2002.Changes with age in spatial distribution of roots of Eucalyptus clone in Congo Impacton water and nutrient uptake. Forest Ecology and Management 171: 43-57.
Bowen, G.D. & Rovira, A.D. 1999. The rhizosphere and its management to improveplant growth. Advances in Agronomy 66: 1-102.
Breman, H. & Kessler, J.J. 1995. Woody plants in agro-ecosystems of semi-aridregions. Springer-Verlag, Berlin, Germany. 340 p.
Brooks, K.N., Ffolliott, P.F., Gregersen, H.M. & DeBano, L.F. 2003. Hydrology andthe management of watersheds. 3rd ed. Ames: Iowa: Iowa State University Press. pp.373-384.
Brouwer, R. 1983. Functional equilibrium: sense or nonsense? Netherlands Journal ofAgricultural Science 31: 335-348.
Buck, L.E., Lassoie, J.P., & Fernandes, E.C.M. (Eds.). 1999. Agroforestry insustainable agricultural systems. Boca Raton, Florida: Lewis Publishers. 416 p.
Bukhari, Y.M. 1998. Tree-root influence on soil physical conditions, seedlingestablishment and natural thinning of Acacia seyal var. seyal on clays of central Sudan.Agroforestry Systems 42: 33-43.
Bunderson, W.T., Wakeel, A.El., Saad, Z. & Hashim, I. 1990. Agroforestry andpotential in Western Sudan. In: Budd, W., et al. (Eds.), Planning for Agroforestry. NewYork, Elsevier Science Publisher.
Bunting, A.H. & Lea, J.D. 1962. The soils and vegetation of the Fung, East CentralSudan. Journal of Ecology 50: 529-558.
Buresh, R.J. & Tian, G., 1998. Soil improvement by trees in sub-Saharan Africa.Agroforestry Systems 38: 51-76.
Buresh, R.J. 1995. Nutrient cycling and nutrient supply in agroforestry systems. In:Dudal, R. & Roy, R.N. (Eds.), Integrated Plant Nutrition Systems, pp 155–164. FAOFertilizer and Plant Nutrition Bulletin No. 12. Rome, Italy

81
Buresh, R.J., Smithson, P.C. & Hellums, D.T. 1997. Building soil P capital in sub-Saharan Africa. In: Buresh, R.J. & Sanchez, P.A. (Eds.), Replenishing Soil Fertility inAfrica. SSSA Special Publication. 51. SSSA and ASA, Madison, WI, USA. pp. 111-149.
Campbell, B.M., Frost, P., King, J.A., Mawanza, M. & Mhlanga, L. 1994. Theinfluence of trees on soil fertility on two contrasting semiarid soil types at Matopos,Zimbabwe. Agroforestry Systems 28: 159-172.
Cannell, M.G.R., Van Noordwijk, M. & Ong, C.K. 1996. The central agroforestryhypothesis: the trees must acquire resources that the crop would not otherwise acquire.Agroforestry Systems 34: 27-31.
Chamshama, S.A.O., Monela, G.C., Sekiete, K.E.A. & Persson, A. 1992 Sustainabilityof taungya system at North Kilimanjaro forest plantation, Tanzania. AgroforestrySystems 17: 1-11.
Chaves, M.M., Maroco, J.B. & Pereira, J.S. 2003. Understanding plant responses todrought from genes to the whole plant. Functional Plant Biology 30: 239-264.
Chen, C.R, Condron, L.M., Sinaj, S., Davis, M.R., Sherlock, R.R. & Frossard, E. 2003.Effects of plant species on phosphorus availability in a range of grassland soils. Plantand Soil 256: 115-130.
Clay, D.E., Clay, S.A., Jackson, J. Dalsted, K., Reese, C., Liu, Z., Malo, D.D. &Carlson, C.G. 2003. Carbon-13 discrimination can be used to evaluate soybean yieldvariability. Agronomy Journal 95: 430-435.
Colonna, J.P., Thoen, D., Ducosso, M., & Badji, S. 1991. Comparative effects ofGlomus mosseae and P fertilizer on foliar mineral composition of Acacia senegalseedlings inoculated with Rhizobium. Mycorrhiza 1: 35-38.
Comstock, J.P. & Ehleringer, J.R. 1988. Contrasting photosynthetic behaviour inleaves and twigs of Hymenoclea salsola, a green-twigged, warm desert shrub.American Journal of Botany 75: 136-1370.
Comstock, J.P. & Ehleringer, J.R. 1992. Correlating genetic variation in carbonisotopic composition with complex climatic gradients. Proc. Natl. Acad. Sci. 89: 7747-7751.
Condon, A.G. & Richards, R.A. 1992. Broad sense heritability and genotype xenvironment interaction for carbon isotope discrimination in field-grown wheat.Australian Journal of Agricultural Research 43: 921-934.

82
Cowan, I.R. 1982. Regulation of water use in relation to carbon gain in higher plants.In: Lange, O.L., Nobel, C.B., Osmond, C.B. & Ziegler, H. (Eds.), Physiological PlantEcology II. Water Relations and Carbon Assimilation. pp 489-613. Encyclopedia ofPlant Physiology, New series, Volume 12B. Springer-Verlag, Berlin Heidelberg, NewYork.
Craig, H. 1957. Isotopic standards for carbon and oxygen and correction factors formass spectrometric analysis of carbon dioxide. Geochimica et Cosmochimica Acta. 12:133-149.
Danso, S.K.A., Hardarson, G. & Zapata, F. 1993. Misconceptions and practicalproblems in the use of 15N soil enrichment techniques for estimating N2. Plant and Soil152: 25-52.
Danso, S.K.A., Zapata, F. & Awonaike, K.O. 1995. Measurement of biological N2fixation in field-grown Robinia pseudo acacia L. Soil Biology and Biochemistry 27:415-419.
Dawson, T.E. 1996. Determining water use by trees and forests from isotopic, energybalance and transpiration analysis: the roles of tree size and hydraulic lift. TreePhysiology 16: 263-272.
Deans, J.D., Diagne, O., Lindley, D.K., Dione, M. & Parkinson, J.A. 1999. Nutrientsand organic-matter accumulation in Acacia senegal fallows over 18 years. ForestEcology and Management 124: 153-167.
Devitt, D.A., Smith, S.D. & Neuman, D.S. 1997. Leaf carbon isotope ratios in threelandscape species growing in an arid environment. Journal of Arid Environments 36:249-257.
Dinkelaker, B., Römheld, V. & Marschner, H. 1989. Citric acid excretion andprecipitation of calcium citrate in the rhizosphere of white lupin (Lupinus albus L.).Plant Cell Environment 12: 285-292.
Dommergues, Y. 1987. The role of biological nitrogen fixation in agroforestry. In:Steppler, H.A. & Nair, P.K.A. (Eds.), Agroforestry. A Decade of Development, pp.245-271. ICRAF, Nairobi, Kenya.
Doorenbos, J. & Pruitt, W.O. 1975. Crop water requirements. FAO Irrigation andDrainage Paper 24, (revised), Rome, Italy. 144 p.
Droppelmann, K.J., Ephrath, J.E. & Berliner, P.R. 2000. Tree/crop complementarity inan arid zone runoff agroforestry system in Northern Kenya. Agroforestry Systems 50:1-16.

83
Dupouey, J.S., Leavitt, S.W., Choisnel, E. & Jourdain, S. 1993. Modelling carbonisotope fractionation in tree rings based on effective evapotranspiration and soil waterstatus. Plant Cell and Environment 16: 939-947.
Eastham, J., Scott, P.R. & Steckis, R. 1994. Components of the water balance of treespecies under evaluation for agroforestry to control salinity in the wheat belt ofWestern Australia. Agroforestry Systems 26: 157-170.
Ehdaie, B., Hall, A.E., Farquhar, G.D., Nguyen, H.T. & Waines, J.G. 1991. Water-useefficiency and carbon isotope discrimination in wheat. Crop Science 31: 1282-1288.
Ehleringer, J.R. & Cooper, T.A. 1988. Correlations between carbon isotope ratio andmicrohabitat in desert plants. Oecologia 76: 562-566.
Ehleringer, J.R. & Osmond, C.B. 1989. Stable isotopes In: Pearcy, R.W., Ehleringer,J., Mooney, H.A. & Rundel, P.W. (Eds.), Plant Physiological Ecology: field methodsand instrumentation, pp. 281-300. London: Chapman and Hall. 448 p.
Ehleringer, J.R. 1991. 13C/12C fractionation and its utility in terrestrial plant studies. In:Coleman, D.C. & Fry, B. (Eds.), Carbon Isotope Techniques. Academic Press, NewYork, pp.187-200.
Ehleringer, J.R., White, J.W., Johnson, D.A. & Brick, M. 1990. Carbon isotopediscrimination, photosynthetic gas exchange, and water-use efficiency in common beanand range grasses. Acta Oecologia 11: 611-25.
Ehlerringer, J.R., Hall, A.E., & Farquhar, G.D. (Eds.), 1993. Stable isotopes and plantcarbon-water relations. Academic Press, San Diego, California, USA. 555 p.
El Amin, H.M. 1990. Trees and Shrubs of the Sudan. ISBN. Ithaca Press England. 484p.
El Houri, A.A. 1986. Some aspect of dryland afforestation in the Sudan with specialreference to Acacia tortilis (Forks.) Hayne, Acacia senegal Willd. and Prosopischilensis (Molina) Stuntz. Forest Ecology and Management 16: 209-221.
Eskonheimo, A. 2006. Women, environmental changes and forestry-relateddevelopment: Gender-affected roles of rural people in land degradation andenvironmental rehabilitation in a dry region of Sudan. PhD Thesis. University ofHelsinki Tropical Forestry Reports 29. 214 p.
Evans, R.D. 2001 Physiological mechanisms influencing plant nitrogen isotopecomposition. Trends in Plant Science 6: 121-126.

84
FAO. 1998. World reference base for soil resources. Report 84.<http://www.fao.org/docrep/w8594e00.htm> (05.06.2006).
FAO. 2003. <http://www.fao.org/countryprofiles/index.asp?> (10.07.2003).
Farquhar, G.D., Ehleringer, J.R. & Hubick, K.T. 1989. Carbon isotope discriminationand photosynthesis. Annual Review Plant Physiology. Plant Molecular Biology 40:503-537.
Feng, X. & Epstein, S. 1995. Carbon isotope of trees from arid environments andimplications for reconstructing atmospheric CO2 concentration. Geochimica etCosmochimica Acta 59: 2599-2608.
Feng, X. 1999. Trends in intrinsic water-use efficiency of natural trees for past 100-200years: a response to atmospheric CO2 concentration. Geochimica et CosmochimicaActa 63: 1891-903.
Ffolliott, P.F., Brooks, K.N., Gregersen, H.M. & Lundgren, A.L. 1995. Drylandforestry: Planning and management. New York: John Wiley & Sons.
Ffolliott, P.F., Jeffrey, O.D., James, T.F., Itshack, M., Timothy, E.F., Abdullah, A.M.,Carter, J. & Paul, V. 2002. Assessing capabilities of soil and water resources indrylands: The role of information retrieval and dissemination technologies IALCConference. Arid Lands Newsletter, Issue No. 52, November/ December 2002.
Fownes, J.H. & Anderson, D.G., 1991. Change in nodule and root biomass of Sesbaniasesban and Leucaena leucocephala following coppicing. Plant Soil 138: 9-16.
Fries, J. 1995. Management of natural forests in the semi-arid areas of Africa: Presentknowledge and research needs. IRDC. Swedish University of Agricultural Sciences,Uppsala. 119 p.
Gaafar, A.M. 2005. Improvement of traditional Acacia senegal agroforestry:Ecophysiological characteristics as indicators for tree-crop interaction on sandy soil inwestern Sudan. PhD Thesis. University of Helsinki Tropical Forestry Reports 26. 100p.
Gardner, W.K., Barber, D.A. & Parbery, D.G. 1983. The acquisition of phosphorousby Lupinus albus L. III. The probable mechanism by which phosphorous movement inthe soil/root interface is enhanced. Plant and Soil 70: 107-124.
Garten, C.T. & Taylor, G.E., 1992. Foliar 13C within a temperature deciduous forest:spatial, temporal, and species sources of variation. Oecologia 90: 1-7.

85
Gibson, A., Bachelard, E.P. & Hubick, K.T. 1995. Relationship between climate andprovenance variation in Eucalyptus camaldulensis Dehnh. Australian Journal of PlantPhysiology 22: 453-460.
Gold, M.A., Rietveld, W.J., Garrett, H.E. & Fisher, R.F. 2000. Agroforestrynomenclature, concepts, and practices for the USA. In: Garrett, H. E., Rietveld, W.J. &Fisher, R.F. (Eds.), North American Agroforestry: An Integrated Science and Practice,ASA, Madison, WI, USA. pp. 63-76.
Govindarajan, M., Rao, M.R., Mathuva, M.N., & Nair, P.K.R. 1996. Soil-water androot dynamics under hedgerow intercropping in semiarid Kenya. Agronomy Journal88: 513-520.
Gregory, P.J. 1996. Approaches to modelling the uptake of water and nutrients inagroforestry systems. Agroforestry Systems 34: 51-65.
Grierson, P.F. & Attiwill, P.M. 1989. Chemical characteristics of proteoid root mat ofBanksia integrifolia L.f. Australian Journal of Botany 37: 137-143.
Griffiths, H. 1993. Carbon isotope discrimination. In: Hall, D.O., Scurlock, J.M.O.,Bolhar-Nordenkampf, H.H., Leegood, R.C. & Long, S.P. (Eds.), Photosynthesis andProduction in a Changing Environment: a field and laboratory manual, pp. 193-206.London: Chapman and Hall. 464 p.
Grunwald, C. & Karschon, R. 1982. Leaf xylem water potentials and water saturationdeficits as related to seed origin of Eucalyptus camaldulensis Dehnh. Australian ForestResearch 12: 175-181.
Gueye, M., Ndoye, I., Diand, A.M., Danso, S.K.A. & Dreyfus, B. 1997. Active N2fixation in several Faidherbia albida provenances. Arid Soil Research andRehabilitation 11: 63-70.
Gyenge, J.E., Fernandez, M.E., Salda, G.D. & Schlichter, T.M. 2002. Silvopastoralsystems in North-western Patagonia II: water balance and water potential in a stand ofPinus ponderosa and native grassland. Agroforestry Systems 55: 47-55.
Haggar, J.P., Tanner, E.V.J., Beer, J.W. & Kass, D.C.L. 1993. Nitrogen dynamics oftropical agroforestry and annual cropping systems. Soil Biology and Biochemistry 25:1363-1378.
Haggar, J.P., Warren, G.P., Beer, J.W. & Kass, D. 1991. Phosphorus availability underalley cropping and mulched and un-mulched sole cropping systems in Costa Rica.Plant and Soil 137: 275-283.

86
Hall, A.E., Mutters, R.G., Hubick, K.T. & Farquhar, G.D. 1990. Genotypic differencesin carbon isotope discrimination by cowpea under wet and dry field conditions. CropScience 30: 300-305.
Hall, A.E., Richards, R.A., Condon, A.G., Wright, G.C. & Farquhar, G.D. 1994.Carbon isotope discrimination and plant breeding. Plant Breeding Review 12: 81-113.
Handley, L.L. & Scrimgeour, C.M. 1997. Terrestrial plant ecology and 15N naturalabundance: the present limits to interpretation for uncultivated systems with originaldata from a Scottish old field. Advances in Ecological Research 27: 133-212.
Handley, L.L., Nevo, E., Ravan, J.A., Martinez-Carrasco, R., Scrimgeour, C.M.,Pakniyat, H. & Forster, B.P. 1994. Chromosome 4 controls potential water useefficiency ( 13C) in barley. Journal of Experimental Botany 280: 1661-1663.
Handreck, K.A. 1997. Phosphorus requirements of Australian native plants. AustralianJournal of Soil Research 35: 241-289.
Hands, M.R., Harrison, A.F. & Bayliss-Smith, T. 1995. Phosphorus dynamics in slash-and burn and alley cropping systems of the humid tropics. In: Tiessen, H. (Ed.),Phosphorus in the Global Environment; Transfer, Cycles and Management. Scope 54,pp. 155-170. John Wiley & Sons Ltd, New York.
Hare, F.K. 1993. Climate variations, drought and desertification. WMO-No. 653. 44 p.
Harrier, L.A. & Watson, C.A. 2003. The role of arbuscular mycorrhizal fungi insustainable cropping systems. Advances in Agronomy 79: 185-225.
Hauser, S. 1993. Effect of Acioa barteri, Cassia siamea, Flemingia macrophylla andGmelina arborea leaves on germination and early development of maize and cassava.Agriculture Ecosystems & Environment 45: 263-273.
Hawkins, H., Johansen, A., & George, E. 2000. Uptake and transport of organic andinorganic nitrogen by arbuscular mycorrhizal fungi. Plant and Soil 226: 275-285.
Heinemann, A.M., Otieno, H.J.O., Mengick, E.K. & Amadelo, B.A. 1997. Growth andyield of eight agroforestry tree species in line plantings in western Kenya and theireffect on maize yields and soil properties. Forest Ecology and Management 91: 103-135.
Hinsinger, P. 2001. Bioavailability of soil inorganic P in the rhizosphere as affected byroot induced chemical changes: a review. Plant Soil 237: 173-195.

87
Hodge, A., Robinson, D. & Fitter, A. 2000. Are micro-organisms more effective thanplants at competing for nitrogen? Trends in Plant Sciences 5: 304-308.
Högberg, P. 1997. 15N natural abundance in soil-plant systems. New Phytologist 137:179-203.
Holmgren, M. Scheffer, M. & Huston, M.A. 1997. The interplay of facilitation andcompetition in plant communities. Ecology 78(7): 1966-1975.
Howard, S.B., Ong, C.K., Rao, M.R., Mathuva, M. & Black, C.R., 1995. Thepartitioning of light and water in Leucaena-maize agroforestry systems. In: Sinoquet,H., Cruz, P. (Eds.), Ecophysiology of Tropical Crops. INRA, Paris. pp. 123-136.
Huang, W. 1998. Productive coexistence and gain in agroforestry systems. DoctoralThesis. Acta Forestalia Fennica No. 260. 72 p.
Hubick, K.T., Shorter, R. & Farquhar, G.D. 1988. Heritability and genotype xenvironment interactions of carbon isotope discrimination and transpiration efficiencyin peanut (Arachis hypogaea L.) Australian Journal of Plant Physiology 15: 799-813.
Hue, N.V. 1991. Effects of Organic Acids/ Anions on P sorption and Phytoavailabilityin Soils with Different Mineralogies. Soil Science 152: 463-471.
IAEA .1975. Root activity patterns of some tree crops. Technical Report Series No.170. International Atomic Energy Agency, Vienna, Austria 154 p.
ICRAF. 1996. Annual report 1995. International Centre for Research In Agroforestry,Nairobi, Kenya.
IIED. & IES. 1990. Gum Arabic Belt Rehabilitation In the Republic of the SudanReport, Ministry of Finance and Economic Planning (Planning) of the Government ofthe Sudan, Vol.1.159 p.
Ingram, J. 1990. The role of trees in maintaining and improving soil productivity-review of literature. In: Prinsley, R.T. (Ed.), Agroforestry for Sustainable Production.Commonwealth Science Council, London. pp. 243-303.
IUFRO, 2004. Trees, Agroforestry and Global Change in Dryland Africa (TACCDA).Proceedings from VITRI/ ETFRN/ IUFRO workshop, 31 July-4 August 2003,Hyytiälä, Finland. www.etfrn.org.
Jama, B.A., Nair, P.K.R. & Rao, M.R. 1995. Productivity of hedgerow shrubs andmaize under alley cropping and block planting systems in semiarid Kenya.Agroforestry Systems 31: 257-274.
88
Jewitt, T.N. & Manton, J.S. 1954. Soil exhaustion in the Goz sands of the Sudan.Congres international de la science du sol, leopodville, pp. 413-416.
Jobbagy, E.G. & Jackson, R.B. 2001. The distribution of soil nutrients with depth:Global patterns and the imprint of plants. Biochemistry 53: 51-77.
Johson, H.B. & Mayeux, H.S. 1990. Prosopis glandulosa and the nitrogen balance ofrange lands: extent and occurrence of nodulation. Oecologia 84: 176-185.
Jones, H.G. 1980. Interaction and integration of adaptive responses to water stress: Theimplication of an unpredictable environment. In: Turner, N.C. and Kramer, P.J. (Eds.),Adaptation of plants to water and high temperature stress, pp. 353-365. John Wiley &Sons, New York.
Jones, M., Sinclair, F.L. & Grime, V.L. 1998. Effect of tree species and crown pruningon root length and soil water content in semi-arid agroforestry. Plant and Soil 201:197-207.
Kang, B.T. 1997. Alley cropping–soil productivity and nutrient recycling. ForestEcology and Management 91: 75–82.
Kang, B.T., Salako, F.K., Akobundu, I.O., Pleysier, J.L. & Chianu, J.N. 1997.Amelioration of a degraded Oxic Paleustalf by leguminous and natural fallows. SoilUse and Management 13: 130-135.
Kaushik, N. & Kumar, V. 2003. Khejri (Prosopis cineraria)-based agroforestry systemfor arid Haryana, India. Journal of Arid Environments 55: 433-440.
Kessler, J.J. 1992. The influence of Karite (Vitellaria paradox) and nere (Parkiabiglobosa) trees on sorghum production in Burkina Faso. Agroforestry Systems 17: 97-134.
Khanna, P.K. 1998. Nutrient cycling under mixed-species tree systems in SoutheastAsia. Agroforestry Systems 38: 99-120.
Korwar, G.R. & Radder, G.D. 1994. Influence of root pruning and cutting interval ofLeucaena hedgerows on performance of alley cropped rabi sorghum. AgroforestrySystems 25: 95-109.
Koskela, J., Nygren, P., Berninger, F. & Luukkanen, O. 2000. Implications of theKyoto Protocol for tropical forest management and land use: prospects and pitfalls.University of Helsinki Tropical Forestry Reports 22. 103 p.

89
Kramer, P.J. & Kozlowski, T.T. 1979. Physiology of woody plants. Academic press,New York. 811 p.
Kramer, P.J. 1980. Drought, Stress, and the origin of adaptations In: Turner, N.C. &Kramer, P.J. (Eds.), Adaptation of plants to water and high temperature stress, JohnWiley & Sons, New York. pp. 7-20.
Kurdali, F., Domenach, A.M., Bouvarel, L. & Moiroud, A. 1993. Field comparison ofd15N values and growth of alder provenances and species. Soil Science Plant Nutrition39: 635-643.
Ladha, J.K., Peoples, M.B., Garrity, D.P., Capuno, V.T. & Dart, P.J. 1993. Estimatingdinitrogen fixation of hedgerow vegetation using the 15N natural abundance method.Soil Science Society of America Journal 57: 732-737.
Lajtha, K. & Michener, R.H., Eds.1994. Stable Isotopes in Ecology and EnvironmentalScience. Oxford: Blackwell Scientific Publications. London, 316 p.
Lal, R. 2001. Managing world soils for food security and environmental quality.Advances in Agronomy 74: 155-192.
Lal, R. 2002. The Potential of soils of the tropics to sequester carbon and mitigate thegreenhouse effect. Advances in Agronomy 76: 1-3.
Langham, D.R. & Wiemers, T. 2002. Progress in mechanizing sesame in the USthrough breeding. In: Janick, J. & Whipkey, A. (Eds.), Trends in new crops and newuses. ASHS Press, Alexandria, VA. pp. 157-173.
Larcher, W. 2003. Physiological Plant Ecology. Ecophysiology and Stress Physiologyof Functional Groups, 4th ed. Springer-Verlag, Berlin, Heidelberg. 513 p.
Le Maitre, D.C., Scott, D.F. & Colvin, C. 1999. A review of information on interactionbetween vegetation and groundwater. Water S. A. 25 (2): 137-152.
Lehmann, J. & Zech, W. 1998. Fine root turnover in hedgerow intercropping inNorthern Kenya. Plant Soil 198: 19-31.
Lehmann, J., Weigl, D., Droppelmann, K., Huwe, B. & Zech, W. 1999. Nutrientcycling in an agroforestry system with runoff irrigation in Northern Kenya.Agroforestry Systems 43: 49-70.
Li, C. & Wang, K. 2003. Differences in drought responses of three contrastingEucalyptus microtheca F. Muell. Populations. Forest Ecology and Management 179:377-385.

90
Li, F.M., Song, Q.H., Liu, H.S., Li, F.R. & Liu, X.L. 2001. Effects of pre-sowingirrigation and phosphorus application on water use and yield of spring wheat undersemi-arid conditions. Agricultural Water Management 49: 173-183.
Livesley, S.J., Gregory, P.J. & Buresh, R.J. 2002. Competition in tree row agroforestrysystems. 2. Distribution, dynamics and uptake of soil inorganic N. Plant and Soil 247:177-187.
Livesley, S.J., Gregory, P.J. & Buresh, R.J. 2004. Competition in tree row agroforestrysystems. Soil water distribution and dynamics. Plant and Soil 264: 129-139.
Liyanage, M.de S., Danso, S.K.A. & Jayasundara, H.P.S. 1994. Biological nitrogenfixation in four Gliricidia sepium genotypes. Plant and Soil 161: 267-274.
Lott, J.E., Khan, A.A.H., Black, C.R. & Ong, C.K. 2003. Water use in Grevillearobusta-maize over story agroforestry system in semi-arid Kenya. Forest Ecology andManagement 180: 45-59.
Lu, Z., Chen, J., Percy, R.G., Sharifi, M.R., Rundel, P.W. & Zeiger, E. 1996. Geneticvariation in carbon isotope discrimination and its relation to stomatal conductance inPima cotton (Gossypium barbadense). Australian Journal of Plant Physiology 23: 127-132.
Ludwig, F., Dawson, T.E., Prins, H.H.T., Berendse, F. & De Kroon, H. 2004. Below-ground competition between trees and grasses may overwhelm the facilitative effectsof hydraulic lift 7: 623-631.
Luukkanen, O. 1991. Global change and the eco-physiology of tropical trees. Proc.Conference Global Change: Effects on Tropical Forest, Agricultural, Urban andIndustrial Ecosystems, Bangkok, 22-24 Oct. 1990, pp. 66-71. ITTO Tech. Series 6.
Mahmoud, A.M., Khidir, M.O., Khalifa, M.A., El Ahmadi, A.B., Musnad, H.A.R. &Mohamed, E.I. 1996. Sudan country report to the FAO international technicalconference on plant genetic resources. Leipzig, Germany. 86 p.
Marples, S. 1986. Production and investment in marginal areas. In Development ofrain-fed agriculture under arid and semiarid conditions, Ed. Davis, T.J. 87.Washington, DC: The World Bank.
Mason, P.A. & Wilson, J. 1994. Harnessing symbiotic association: vesicular-arbuscular mycorrhizas. In: Leaky, R.R.B., & Newton, A.C. (Eds.), Tropical Trees:The Potential for Domestication and the Rebuilding of Forest Resources, HSMO,London, UK. pp 165-175.

91
Materechera, S.A., Dexter, A.R. & Alston, A.M. 1991. Penetration of very strong soilsby seedling roots of different plant species. Plant Soil 135: 31-41.
Mc Lachlan, K.D. 1980. Acid phosphate activity of intact roots and phosphorousnutrition of plants. I. Assay conditions and phosphate activity. Australian Journal ofAgricultural Research 31: 429-440.
Mc Nulty, S.G. & Swank, W.T. 1995. Wood 13C as a measure of annual basal areagrowth and soil water stress in a Pinus strobus forest. Ecology 76: 1581-1586.
Mekonnen, K., Buresh, R.J. & Jama, B. 1997. Root and inorganic nitrogendistributions in Sesbania fallow, natural fallow and maize. Plant Soil 188: 319-327.
Middleton, N.J. & Thomas, D.S.G. 1997. World Atlas of Desertification. UNEP.Arnold, London. UK. 182 p.
Miller, H.G. 1995. The influence of stand development on nutrient demand, growthand allocation. Plant Soil 168/169: 225-232.
Montagnini, F., Jordan, C.F. & Machado, R.M. 2000. Nutrient cycling and nutrient useefficiency in agroforestry systems, In: Ashton, M.S., & Montagnini, F. (Eds.). Thesilvicultural basis for agroforestry systems. CRC Press, Boca Raton, FL, USA. pp.131-160.
Mordelet, P., Abbadie, L. & Menaut, J.C. 1993. Effects of tree stumps on soilcharacteristics in a humid savanna of West Africa (Lamto, Cote d’ Ivoire). Plant andSoil 153: 103-111.
Myers, B.J. & Landsberg, J.J. 1989. Water stress and seedling growth of twoeucalyptus species from contrasting habitats. Tree Physiology 5: 207- 218.
Nair, P.K.R. 1993. An Introduction to Agroforestry. Kluwer Academic Publishers,Dordrecht, the Netherlands. 499 p.
Ndoye, I., Gueye, M., & Danso, S.K.A. 1995. Nitrogen fixation in Faidherbia albida,Acacia raddiana, Acacia senegal and Acacia seyal estimated using the 15N isotopedilution technique. Plant and Soil 172: 175-180.
Newton, A.C., Dick, J. McP. & Heaton, T.H.E. 1996. Stable carbon isotopecomposition ( 13C) on Acacia tortilis subsp. spirocarpa (A. Rich.) Brenan growing atthree semi-arid sites in Kenya. Journal of Arid Environments 34: 325-330.

92
Njiti, C.F. & Galiana, A. 1996. Symbiotic properties and rhizobium requirements foreffective nodulation of five tropical dry zone acacias. Agroforestry Systems 43: 265-275.
O’Leary, M.H. 1988. Carbon isotopes in photosynthesis. Bioscience 38: 325-336.
Olsen, R.K., Schoeneberger, M.M. & Aschmann, S.G. 2000. An ecological foundationfor temperate agroforestry. In: Garrett, H.E., Rietveld, W.J. & Fisher, R.F. (Eds.),North American Agroforestry: An Integrated Science and Practice. ASA, Madison,Wisconsin, USA, pp. 31-61.
Olsen, S.R. & Sommers, L.E. 1982. Phosphorus. In: Page A.L., Miller R.H. andKeeney D.R. (Eds.), Methods of Soil Analysis: Part 2 Chemical and MicrobiologicalProperties, American Society of Agronomy, Madison, Wisconsin, USA. pp. 403-430.
Ong, C.K. & Black, C.R., 1995. Complementarity in resource use in agroforestrysystems. In: Kang, B.T., Osiname, A.O. & Osiname Larbi, Osiname. (Eds.), alleyfarming-Research and Development. IITA, Ibadan, Nigeria. pp. 73-89.
Ong, C.K. & Leakey, R.R.B. 1999. Why tree-crop interactions in agroforestry appearat odds with tree-grass interactions in tropical savannahs. Agroforestry Systems 45:109-129.
Ong, C.K., Black, C.R., Marshall, F.M. & Corlett, J.E. 1996. Principal of resourcecapture and utilization of light and water. In: Ong, C.K. & Huxley, P. (Eds.) Tree-Cropinteractions a Physiological Approach. CAB International, Oxon, UK. pp. 73-158.
Ong, C.K., Black, C.R., Wallace, J.S., Khan, A.A.H., Lott, J.E., Jackson, N.A.,Howard, S.B. & Smith, D.M. 2000. Productivity, microclimate and water use inGrevillea robusta-based agroforestry systems on hill slopes in semi-arid Kenya.Agriculture Ecosystems & Environment 80: 121-141.
Oplinger, E.S., Putnam, D.H., Kaminski, A.R., Hanson, C.V., Oelke, E.A., Schulte,E.E. & Doll, J.D. 1990. In Alternative Field Crops Manual, Sesame Home.http://www.hort.purdue.edu/newcrop/afcm/spelt.html. (26.4.04).
Ovalle, C., Longeri, L., Aronson, J. 1996. N2 fixation, nodule efficiency and biomassaccumulation after two years in three Chilean legume trees and TagasasteChamaecytisus proliferus subsp. palmensis. Plant and Soil 179: 131-140.
Palm, C.A. 1995. Contribution of agroforestry trees to nutrient requirements ofintercropped plants. Agriculture Ecosystems and Environment 30: 105-124.

93
Passioura, J.B. 2002. Environmental plant biology and crop improvement. FunctionalPlant Biology 29: 537-546.
Pennington, R.E., Tischler, C.R., Johnson, H.B. & Polley, H.W. 1999. Geneticvariation for carbon isotope composition in honey mesquite (Prosopis glandulosa).Tree Physiology 19: 583-589.
Peter, I. & Lehmann, J. 2000. Pruning effects on root distribution and nutrientdynamics in an acacia hedgerow planting in northern Kenya. Agroforestry Systems 50:59-75.
Pierre, M. 2002. Mineral nutrient concentrations in sapwood and heartwood: aliterature review. Annals of Forest Science 59: 713-722.
Poorter, H., & Remkes, C. 1990. Leaf area ratio and assimilation rate of 24 wildspecies differing in relative growth rate. Oecologia 83: 553-559.
Prasolova, N.V., Xu, Z.H., Farquhar, G.D., Saffigna, P.G. & Dieters, M.J. 2001.Canopy carbon and oxygen isotope composition of 9-year-old hoop pine families inrelation to seedling carbon isotope composition and growth, field growth performanceand canopy nitrogen concentration. Canadian Journal of Forest Research 31: 673-681.
Puig, H., Riera, B. & Lescure, I.P. 1990. Phytomasse et productivite’. Bois et Foretsdes Tropiques 220: 25-32.
Raddad, E.Y. 1987. Physiological studies and seedlings survival of some forest trees inthe Sudan. M.Sc. thesis, Faculty of Science, University of Khartoum, Sudan. 120 p.
Radersma, S., & Grierson, P.F. 2004. Phosphorus mobilization in agroforestry:Organic anions, phosphatase activity and phosphorus fractions in the rhizosphere. Plantand Soil 259: 209-219.
Raebild, A., Graudal, L. & Ouedraogo, L.G. 2003. Evaluation of provenance trial ofAcacia senegal at Dori, Burkina Faso. Trail No. 8 in the arid zone series. Results anddocumentation No.3. DANIDA Forest Seed Centre, Denmark.
Rao, M.R., Ong, C.K., Pathak, P., & Sharma, M.M. 1991. Productivity of annualcropping systems on a shallow alfisol in semi-arid India. Agroforestry Systems 15: 51-63.
Read, J. & Farquhar, G.D. 1991. Comparative studies in Nothofagus (Fagaceace). I.Leaf carbon isotope discrimination. Functional Ecology 5: 684-695.

94
Reddy, Y.V.R., & Sudha, M. 1989. Economics of agroforestry system-CRIDAsexperience. In: Singh, R.P., Ahlwat, I.P.S., Ganga, S. (Eds.), Agroforestry Systems inIndia-Research and Development. Indian Society of Agronomy, New Delhi, pp. 179-186.
Roder, W. 1992. Experiences with tree fodder’s in temperate regions of Bhutan.Agroforestry Systems 17: 263-270.
Roggy, J.C., Prevost, M.F., Garbaye, J. & Domenach, A.M. 1999. Nitrogen cycling inthe tropical rain forest of French Guiana: comparison of two sites with contrasting soiltypes using 15N. Journal of Tropical Ecology 15: 1-22.
Ruhigwa, B.A., Gichuru, M.P., Mambani, B. & Tariah, N.M. 1992. Root distributionof Acioa barteri, Alchornea cordifolia, Cassia siamea and Gmelina arborea in an acidUltisol. Agroforestry Systems 19: 67-78.
Salih, A.A. 1998. Root and shoot growth of Prosopis chilensis in response to soilimpedance and soil matric potential. Journal of Arid Environments 40: 43-52.
Sanchez, P.A. 1976. Properties and Management of Soils in the Tropics. John Wiley &Sons, New York. 618 p.
Sandquist, D.R. & Ehleringer, J.R. 2003. Carbon isotope discrimination differenceswithin and between contrasting populations of Encelia farinosa raised under common-environment conditions. Oecologia 134: 463-470.
SAS. 1997. JMP statistical package. SAS Institute, Inc, Cary, N.C.
Schleser, G. 1990. Investigation of the 13C pattern in leaves of Fagus sylvatica L.Journal of Experimental Botany 41: 564-572.
Schroth, G. & Zech, W. 1995. Root length dynamics in agroforestry with Gliricidiasepium as compared to sole cropping in semi-deciduous rainforest zone of West Africa.Plant and Soil 170: 297-306.
Schroth, G. 1995. Tree roots characteristics as criteria for species selection and systemsdesign in agroforestry. Agroforestry Systems 30: 125-143.
Schulze, E.D., Gebauer, G., Ziegler, H. & Lange, O.L. 1991. Estimates of nitrogenfixation by trees on an aridity gradient in Namibia. Oecologia 88: 451-455.
Sharma, A.K. 1998. Reaping the benefits of non wood forest products and services.Agroforestry Today 10 (1): 23-24.

95
Shearer, G. & Kohl, D.H. 1986. N2 fixation in field settings: estimation based onnatural 15N abundance. Australian Journal of Plant Physiology 13: 699-756.
Shearer, G., Kohl, D.H., Virginia, R.A., Skeeters, J.L., Nilsen, E.T., Sharif, M.R. &Rundel, P.W. 1983. Estimates of N2 fixation from variation in the natural abundance of15N in Sonorian desert ecosystem. Oecologia (Berlin) 56: 365-373.
Siaw, D.E.K.A., Kang, B.T. & Okali, D.U.U. 1991. Alley cropping with Leucaenaleucocephala (Lam.) De Wit and Acioa barteri (Hook. F.) Engl. Agroforestry Systems14: 219-231.
Singh, L. & Singh, J.S. 1993. Importance of short-lived components of a dry tropicalforest for biomass production and nutrient cycling. Journal of Vegetation Science 4:681-686.
Smedley, M.P., Dawson, T.E., Comstock, J.P., Donovan, L.A., Sherrill, D.E., Cook,C.S. & Ehleringer, J.R. 1991. Seasonal carbon isotope discrimination in grasslandcommunity. Oecologia 85: 314-320.
Smit, G.N. & Rethman, N.F.G. 2000. The influence of thinning on soil water in a semi-arid savanna of southern Africa. Journal of Arid Environments 44: 41-59.
Smith, D.M., Jackson, N.A., Roberts, J.M. & Ong, C.K. 1999. Root distribution in aGrevillea robusta-maize agroforestry system in semi-arid Kenya. Plant and Soil 211:191-205.
Soil Survey Staff. 1996. Keys to Soil Taxonomy. SMSS Technical Monograph No. 19,6th ed. Pocahontas press, Inc. Blacksburg, Virginia, U.S.A.
Sprent J. 1995. Legume trees and shrubs in the tropics: N2-fixation in perspective. SoilBiology and Biochemistry 27: 401-407.
Squires, V.R. & Sidahmed, A.E. 1998. Drylands: Sustainable use of rangelands intothe twenty-first century. Rome: International Fund for Agricultural Development.
Steel, R.G.D. & Torrie, J.H. 1980. Principles and Procedures of Statistics second ed.McGraw-Hill, New York.633 p.
Steward, G.R., Turnbull, M.H., Schmildt, S., Erskine, P.D. 1995. C natural abundancein plant communities along a rainfall gradient: a biological integrator of wateravailability. Australian Journal of Plant Physiology 22: 51-55.
Stone, E.L. & Kalisz, P.J. 1991. On the maximum extent of tree roots. Forest Ecologyand Management 46: 59-102.

96
Sterck, F.J., Van der Zandt, G.J.A.W., & Oldemann, R.A.A. 1991. Architecturaldevelopment of Faidherbia albida (Del.) A. Chev. Physiologie des arbres et arbustesen zones arides et semi-arides. Group d’Etude de l’Arbre, Paris. pp. 249-256.
Sudan Meteorological Department, 2002. Annual reports (1982-2002), Khartoum,Sudan.
Sylla, S.N., Ndoye, I., Ba, A.T., Gueye, M. & Dreyfus, B. 1998. Assessment ofnitrogen fixation in Pterocarpus erinaceous and P. lucens using the 15N labellingmethods. Arid Soil Research and Rehabilitation 12: 257-253.
Sylla, S.N., Ndoye, I., Gueye, M., Ba, A.T. & Dreyfus, B. 2002. Estimates ofbiological nitrogen fixation by Pterocarpus lucens in a semi arid natural forest park inSenegal using 15N natural abundance method. African Journal of Biotechnology 1: 50-56.
Torquebiau, E.F. & Kwesiga, F. 1996. Root development in Sesbania sesban fallow-maize system in Eastern Zambia. Agroforestry Systems 34: 193-211.
Trouve, C., Mariott, A., Schwartz, D. & Gguillet, B. 1994. Soil organic carbondynamics under Eucalyptus and Pinus planted on savannas in the Congo. Soil Biologyand Biochemistry 26: 287-295.
Turner, N.C. & Kramer, P.J. 1980. Adaptation of plants to water and high temperaturestress, John Wiley & Sons, New York. 482 p.
UNDP/UNSO. 1997. Aridity zones and Dryland populations: An Assessment ofpopulation Levels in the World’s Drylands. UNSO/UNDP, New York.
Usman, S., Singh, S.P., Rawat, Y.S. & Bargali, S.S. 2000. Fine root decomposition andnitrogen mineralization patterns in Quercus leucotrichophora and Pinus roxburghiiforests in central Himalaya. Forest Ecology and Management 131: 191-199.
Van Noordwijk, M., Lawson, G., Soumare, A., Groot, J.J. & Hariah, K. 1996. Rootdistribution of trees and crops competition and /or complementarity. In: Ong, C.K. &Huxley, P. (Eds.), Tree Crop Interactions-A Physiological Approach. CABInternational, Wallingford, UK. pp. 319-364.
Van Noordwijk, M.Radersma, S. & Lusiana, B.1999. Modelling root architecture andphosphorus uptake in agroforestry. Agroforestry Forum 9: 28-30.
Vertessy, R.A. & Bessard, Y. 1999. Conservation of grasslands to plantations:anticipating the negative hydrologic effects. In: VI International Rangeland CongressProceedings (2). Townsville, QLD., Australia, pp. 679-683.

97
Verzino, G., Carranza, C., Ledesma, M., Joseau, J. & Di Rienzo, J. 2003. Adaptivegenetic variation of Prosopis chilensis (Molina) Stuntz. Preliminary results from onetest-site. Forest Ecology and Management 175: 119-129.
Walcroft, A.S., Silvister, W.B., Whitehead, D. & Kelliher, F.M. 1997. Seasonalchanges in stable carbon isotope ratios within annual rings of Pinus radiata reflectenvironmental regulation of growth processes. Australian Journal of Plant Physiology24: 57-68.
Walker, B.H., Ludwig, D., Holling, C.S. & Peterman, R.M. 1981. Stability of semi-arid savanna grazing systems. Journal of Ecology 69: 473-498.
Wallace, J.S. 1991. The measurement and modelling of evaporation from semi-aridland. In: Sivakumar, M.V.K., Wallace, J.S., Renard, C. & Giroux, C. (Eds.), Soil waterbalance in Sudano-Sahelian Zone. IAHS, No 199. pp. 131-148.
Ward, J.K., Dawson, T.E. & Ehleringer, J.R. 2002. Responses of Acer negundogenders to inter-annual differences in water availability determined from carbonisotope ratios of tree ring cellulose. Tree Physiology 22: 339-46.
Warren, C.R. & Adams, M.A. 2004. What determines rates of photosynthesis per unitnitrogen in Eucalyptus seedlings? Functional Plant Biology 31: 1169-1178.
Warren, C.R., McGrath, J.F. & Adams, M.A. 2001. Water availability and carbonisotope discrimination in conifers, Oecologia 127: 476-486.
Weil, R.R. & Mughogho, S.K. 1993. Nutrient cycling by Acacia albida (syn.Faidherbia albida) in agroforestry systems. In: Ragland, J. & Lal, R. (Eds.),Technologies for Sustainable Agriculture in the Tropics. ASA Special Publication. 56,ASA, CSSA and SSSA, Madison, WI. pp 97-108.
White, R.E. 1997. Principles and Practices of Soil Science: The soils as a naturalresource. Third edition. Blackwell Science, Melbourne. 348 p.
White, R.P., Tunstall, D. & Henninger, N. 2002. An ecosystem approach to drylands:Building support for new development policies. Information Policy Brief 1.Washington, DC: World Resources Institute.
Whitehead, D., Edwards, W.R.N. & Jarvis, P.G. 1984. Conducting sapwood area,foliage area, and permeability in mature trees of Picea sitchensis and Pinus contorta.Canadian Journal of Forest Research 14: 940-947.
Wickens, G.E., Seif El Din, A.G., Sita, G. & Nahal, I. 1995. Role of Acacia species inthe rural economy of dry Africa and the Near East. FAO Conservation Guide 27. 85 p.

98
Wigley, T.M.L. 1999. The science of climate change: global and U.S. perspectives.Arlington, Virginia: Pew Centre on Global Climate Change. 48 p.
Wild, A. (Ed). 1988. Russell’s soil conditions and plant growth. 11th edn. LongmanScientific & Technical. John Wiley & Sons, Inc., New York. 991 p.
Wright, G., Hubick, K.T., Farquhar, G.D. & Rao, R.C.N. 1993. Genetic andenvironmental variation in transpiration efficiency and its correlation with carbonisotope discrimination and specific leaf area in peanut. In: Ehleringer, J.R. Hall, A.E. &Farquhar, G.D. (Eds.), Stable Isotopes and Plant Water Relations. Academic Press, pp.247-255.
Yadav, J.P. & Khanna, P. 1992. Root pruning enhances crop production underProsopis cineraria. Agroforestry Today 4(4): 13-14.
Yoneyama, T., Muraoka, T., Murakami, T. & Boonkerd, N. 1993. Natural abundanceof 15N in tropical plants with emphasis on tree legumes. Plant Soil 153: 295-304.
Young, J. 1997. Agroforestry for Soil Management. CABI / ICRAF, Wallingford, UK.
Zahner, R. 1968. Water deficits and growth of trees. In: Kozlowski, T.T. (Ed.), waterdeficits and plant growth II, Academic Press New York. pp. 191-254.
Zhang, J., Marshall, J.D. & Fins, L. 1996. Correlated population differences in drymatter accumulation, allocation, and water-use efficiency in three sympatric coniferspecies. Forest Science 42: 242-249.
Total of 245 references