troubleshooting router switch fabric and data path 7-143 cisco ios xr troubleshooting guide for the...
TRANSCRIPT

Cisco IOS XR Troubleshooting Guide fOL-23591-02
C H A P T E R 7
Troubleshooting Router Switch Fabric and Data PathThis chapter describes techniques to troubleshoot router switch fabric and data path. It includes the following sections:
• Understanding Switch Fabric Architecture, page 7-143
• Getting Started with Fabric Troubleshooting, page 7-145
• Troubleshooting Packet Drops, page 7-146
• Troubleshooting RSP and LC Crashes, page 7-165
• Troubleshooting Complete Loss of Traffic, page 7-168
• Gathering Fabric Information Before Calling TAC, page 7-172
Understanding Switch Fabric ArchitectureFigure 7-1 provides an overview of the switch fabric architecture.
7-143or the Cisco ASR 9000 Aggregation Services Router

Chapter 7 Troubleshooting Router Switch Fabric and Data Path Understanding Switch Fabric Architecture
Figure 7-1 Switch Fabric Architecture
As shown in Figure 7-1, there are two fabric interface ASIC on each RSP. Each fabric interface ASIC provides 40 GB of throughput. If one RSP is lost, the shelf can still operate at full capacity without loss of bandwidth.
Each line card (LC) has four 23 GB fabric channels on which to send traffic to the fabric ASICs. The switch fabric is in an active/active relationship. All four fabric ASICs are active, even though the RSP cards are in an active/standby relationship. The system performs load balancing on unicast traffic across these four channels.
The arbiters are in an active/standby relationship (the arbiter on the active RSP card is the active arbiter). Both the active and standby arbiters receive requests for switch fabric access from the LCs. If there is a switchover of the active RSP, the standby RSP arbiter has a current copy of switch fabric requests, which helps to speed up the switchover.
Active Fabric
SwitchFabric 0
SwitchFabric 1
Arbiter
RSP0
Active RP
Active Fabric
SwitchFabric 0
SwitchFabric 1
Arbiter
RSP1
Standby RP 2813
42
Fabric I/O(LC)
Fabric I/O(LC)
23G fabric channelsFabric requests
7-144Cisco IOS XR Troubleshooting Guide for the Cisco ASR 9000 Aggregation Services Router
OL-23591-02
Chapter 7 Troubleshooting Router Switch Fabric and Data Path Getting Started with Fabric Troubleshooting
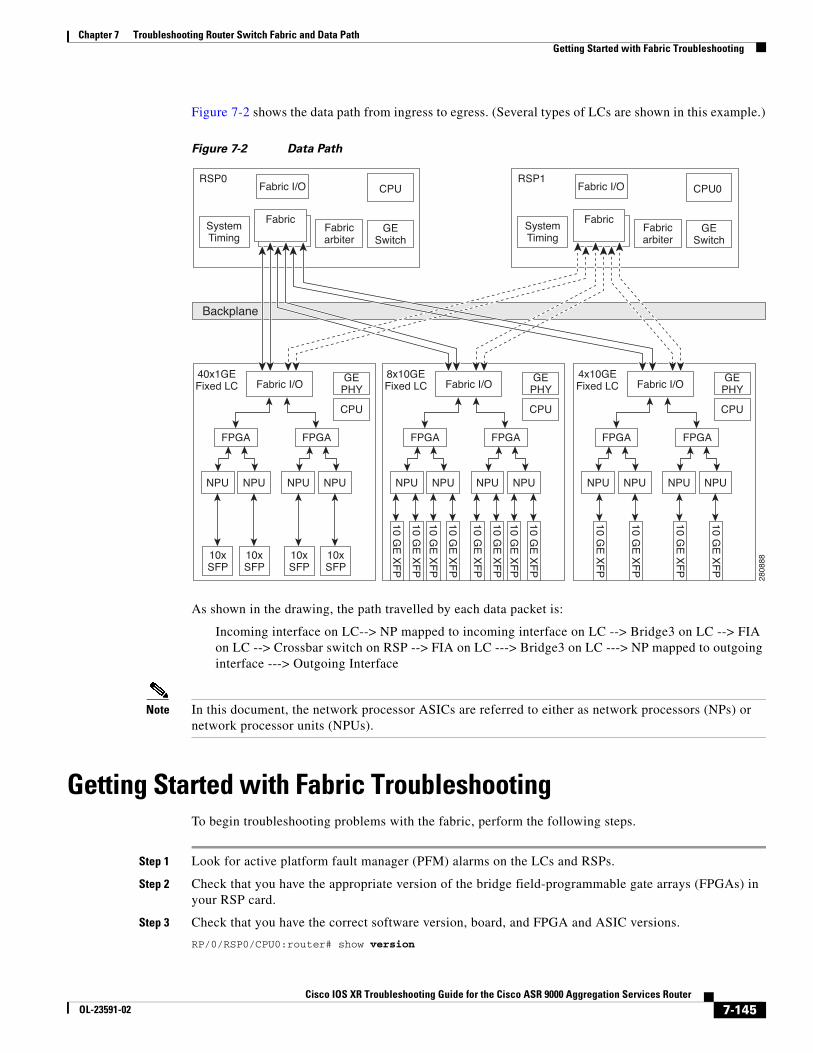
Figure 7-2 shows the data path from ingress to egress. (Several types of LCs are shown in this example.)
Figure 7-2 Data Path
As shown in the drawing, the path travelled by each data packet is:
Incoming interface on LC--> NP mapped to incoming interface on LC --> Bridge3 on LC --> FIA on LC --> Crossbar switch on RSP --> FIA on LC ---> Bridge3 on LC ---> NP mapped to outgoing interface ---> Outgoing Interface
Note In this document, the network processor ASICs are referred to either as network processors (NPs) or network processor units (NPUs).
Getting Started with Fabric TroubleshootingTo begin troubleshooting problems with the fabric, perform the following steps.
Step 1 Look for active platform fault manager (PFM) alarms on the LCs and RSPs.
Step 2 Check that you have the appropriate version of the bridge field-programmable gate arrays (FPGAs) in your RSP card.
Step 3 Check that you have the correct software version, board, and FPGA and ASIC versions.
RP/0/RSP0/CPU0:router# show version
2808
88
Backplane
RSP0
Fabricarbiter
CPU
GESwitch
FabricFabric
Fabric I/O
SystemTiming
RSP1
Fabricarbiter
CPU0
GESwitch
FabricFabric
Fabric I/O
SystemTiming
40x1GEFixed LC
10xSFP
10xSFP
10xSFP
10xSFP
CPU
GEPHYFabric I/O
NPU NPU
FPGA
NPU NPU
FPGA
8x10GEFixed LC
10 GE
XF
P
10 GE
XF
P
10 GE
XF
P
10 GE
XF
P
CPU
GEPHYFabric I/O
NPU NPU
FPGA
10 GE
XF
P
10 GE
XF
P
10 GE
XF
P
10 GE
XF
P
NPU NPU
FPGA
4x10GEFixed LC
10 GE
XF
P
10 GE
XF
P
CPU
GEPHYFabric I/O
NPU NPU
FPGA
10 GE
XF
P
10 GE
XF
P
NPU NPU
FPGA
7-145Cisco IOS XR Troubleshooting Guide for the Cisco ASR 9000 Aggregation Services Router
OL-23591-02
Chapter 7 Troubleshooting Router Switch Fabric and Data Path Troubleshooting Packet Drops
RP/0/RSP0/CPU0:router# show inventory raw RP/0/RSP0/CPU0:router# show hw-module fpd location all
Step 4 Check if there are any errors detected by the system diagnostics.
RP/0/RSP0/CPU0:router# show diag
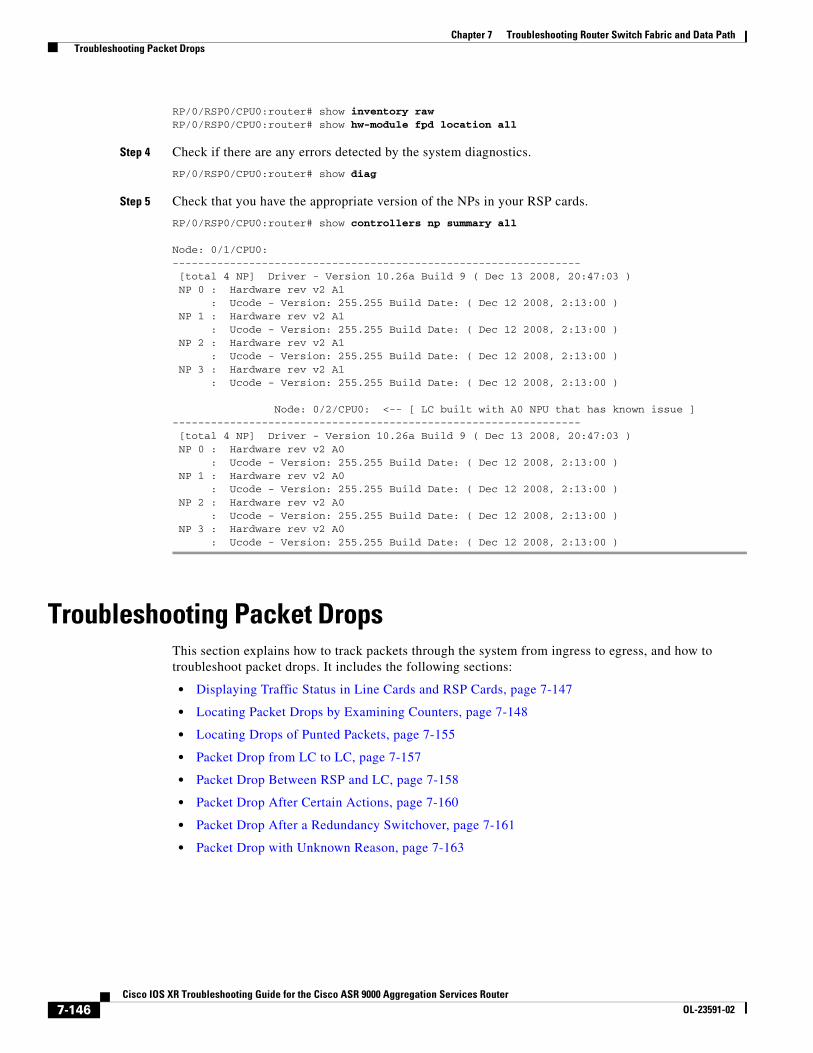
Step 5 Check that you have the appropriate version of the NPs in your RSP cards.
RP/0/RSP0/CPU0:router# show controllers np summary all
Node: 0/1/CPU0:---------------------------------------------------------------- [total 4 NP] Driver - Version 10.26a Build 9 ( Dec 13 2008, 20:47:03 ) NP 0 : Hardware rev v2 A1 : Ucode - Version: 255.255 Build Date: ( Dec 12 2008, 2:13:00 ) NP 1 : Hardware rev v2 A1 : Ucode - Version: 255.255 Build Date: ( Dec 12 2008, 2:13:00 ) NP 2 : Hardware rev v2 A1 : Ucode - Version: 255.255 Build Date: ( Dec 12 2008, 2:13:00 ) NP 3 : Hardware rev v2 A1 : Ucode - Version: 255.255 Build Date: ( Dec 12 2008, 2:13:00 ) Node: 0/2/CPU0: <-- [ LC built with A0 NPU that has known issue ]---------------------------------------------------------------- [total 4 NP] Driver - Version 10.26a Build 9 ( Dec 13 2008, 20:47:03 ) NP 0 : Hardware rev v2 A0 : Ucode - Version: 255.255 Build Date: ( Dec 12 2008, 2:13:00 ) NP 1 : Hardware rev v2 A0 : Ucode - Version: 255.255 Build Date: ( Dec 12 2008, 2:13:00 ) NP 2 : Hardware rev v2 A0 : Ucode - Version: 255.255 Build Date: ( Dec 12 2008, 2:13:00 ) NP 3 : Hardware rev v2 A0 : Ucode - Version: 255.255 Build Date: ( Dec 12 2008, 2:13:00 )
Troubleshooting Packet DropsThis section explains how to track packets through the system from ingress to egress, and how to troubleshoot packet drops. It includes the following sections:
• Displaying Traffic Status in Line Cards and RSP Cards, page 7-147
• Locating Packet Drops by Examining Counters, page 7-148
• Locating Drops of Punted Packets, page 7-155
• Packet Drop from LC to LC, page 7-157
• Packet Drop Between RSP and LC, page 7-158
• Packet Drop After Certain Actions, page 7-160
• Packet Drop After a Redundancy Switchover, page 7-161
• Packet Drop with Unknown Reason, page 7-163
7-146Cisco IOS XR Troubleshooting Guide for the Cisco ASR 9000 Aggregation Services Router
OL-23591-02

Chapter 7 Troubleshooting Router Switch Fabric and Data Path Troubleshooting Packet Drops
Displaying Traffic Status in Line Cards and RSP CardsFigure 7-3 shows the traffic path on the LC and the corresponding CLI commands you use to display the status at each point in the path.
Figure 7-3 LC Traffic Path and Corresponding CLI Commands
2813
43
1
4
1
32
PWR
7-147Cisco IOS XR Troubleshooting Guide for the Cisco ASR 9000 Aggregation Services Router
OL-23591-02
Chapter 7 Troubleshooting Router Switch Fabric and Data Path Troubleshooting Packet Drops
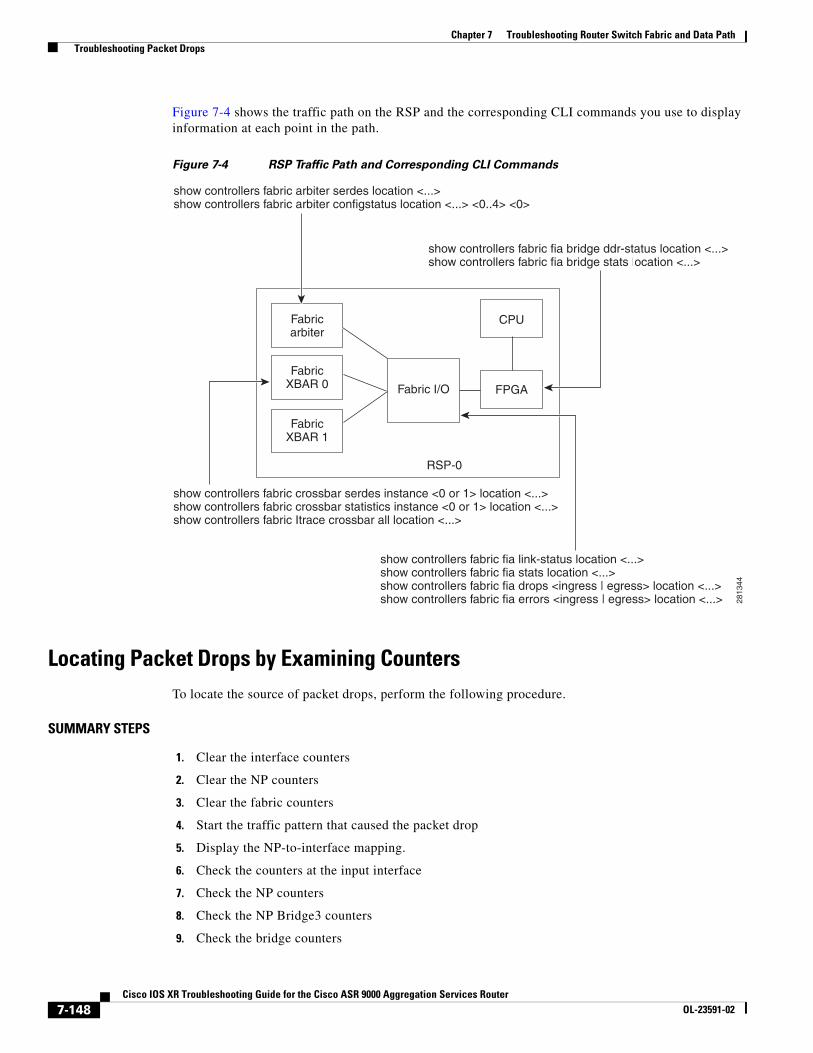
Figure 7-4 shows the traffic path on the RSP and the corresponding CLI commands you use to display information at each point in the path.
Figure 7-4 RSP Traffic Path and Corresponding CLI Commands
Locating Packet Drops by Examining CountersTo locate the source of packet drops, perform the following procedure.
SUMMARY STEPS
1. Clear the interface counters
2. Clear the NP counters
3. Clear the fabric counters
4. Start the traffic pattern that caused the packet drop
5. Display the NP-to-interface mapping.
6. Check the counters at the input interface
7. Check the NP counters
8. Check the NP Bridge3 counters
9. Check the bridge counters
2813
44
Fabricarbiter
FabricXBAR 0
FabricXBAR 1
CPU
FPGA
RSP-0
show controllers fabric fia bridge ddr-status location <...>show controllers fabric fia bridge stats location <...>
show controllers fabric fia link-status location <...>show controllers fabric fia stats location <...>show controllers fabric fia drops <ingress | egress> location <...>show controllers fabric fia errors <ingress | egress> location <...>
Fabric I/O
show controllers fabric crossbar serdes instance <0 or 1> location <...>show controllers fabric crossbar statistics instance <0 or 1> location <...>show controllers fabric Itrace crossbar all location <...>
show controllers fabric arbiter serdes location <...>show controllers fabric arbiter configstatus location <...> <0..4> <0>
7-148Cisco IOS XR Troubleshooting Guide for the Cisco ASR 9000 Aggregation Services Router
OL-23591-02
Chapter 7 Troubleshooting Router Switch Fabric and Data Path Troubleshooting Packet Drops
10. Check the fabric interface ASIC (FIA) counters
11. Check the crossbar counters
Note For the procedure to troubleshoot drops of punted packets, see the Locating Drops of Punted Packets, page 7-155.
DETAILED STEPS
Step 1 Clear the interface counters.
RP/0/RSP0/CPU0:router# clear counters all
Clear "show interface" counters on all interfaces [confirm]
Step 2 Clear the NP counters.
RP/0/RSP0/CPU0:router# clear controller np counters all
Step 3 Clear fabric counters.
a. Clear FIA and bridge counters on the LC and RSP.
RP/0/RSP0/CPU0:router# clear controller fabric fia location
b. Clear fabric crossbar counters.
RP/0/RSP0/CPU0:router# clear controller fabric crossbar-counters location
Step 4 Start the traffic pattern that caused the packet drop.
Step 5 Run the following command to display the NP-to-interface mapping.
RP/0/RSP0/CPU0:router# show controllers np ports all
Step 6 Check the counters at the input interface.
RP/0/RSP0/CPU0:router# show interfaces type location
Step 7 Check the NP counters to verify that traffic is flowing in NP counters along the data path.
RP/0/RSP0/CPU0:router# show controllers np counters {np0|np1|np2|np3|all} location node-id {| include DROP}
RP/0/RSP0/CPU0:router# show controllers np counters np3 location 0/0/CPU0
RP/0/RSP0/CPU0:router# show controllers np counters np3 location 0/0/CPU0 | include DROP
The show controllers np command displays information about counters that helps you troubleshoot drops in the LCs. The names of the internal NP counters have the general format STAGE_DIRECTION_ACTION, for example, PARSE_FABRIC_RECEIVE_CNT, RESOLVE_EGRESS_DROP_CNT, and MODIFY_FRAMES_PADDED_CNT.
The values of stage, directon, and action are as follows:
• There are five stages in the NP:
– Parse
– Search-I
– Modify
– Search-II
7-149Cisco IOS XR Troubleshooting Guide for the Cisco ASR 9000 Aggregation Services Router
OL-23591-02

Chapter 7 Troubleshooting Router Switch Fabric and Data Path Troubleshooting Packet Drops
– Resolve
• Examples of the direction are:
– Ingress
– Egress
– Next_hop
• Examples of the action are:
– Drop_count
– Down
There are additional counters, such as DROP, PUNT, and DIAGS, that provide important information but are not associated with a specific internal NP stage. Drop and punt counters are kept as an aggregate total per stage.
Example
RP/0/RSP0/CPU0:router# show controllers np ports all
Thu Jan 1 02:18:48.264 UTC Node: 0/0/CPU0:----------------------------------------------------------------NP Bridge Fia Ports -- ------ --- ---------------------------------------------------0 1 0 GigabitEthernet0/0/0/30 - GigabitEthernet0/0/0/39 1 1 0 GigabitEthernet0/0/0/20 - GigabitEthernet0/0/0/29 2 0 0 GigabitEthernet0/0/0/10 - GigabitEthernet0/0/0/19 3 0 0 GigabitEthernet0/0/0/0 - GigabitEthernet0/0/0/9
RP/0/RSP0/CPU0:router# show interfaces tenGigE 0/1/0/0
Thu Jan 1 01:10:01.908 UTCTenGigE0/1/0/0 is up, line protocol is up Interface state transitions: 1 Hardware is TenGigE, address is 001e.bdfd.1736 (bia 001e.bdfd.1736) Layer 2 Transport Mode MTU 1514 bytes, BW 10000000 Kbit reliability 255/255, txload 0/255, rxload 0/255 Encapsulation ARPA, Full-duplex, 10000Mb/s, LR, link type is force-up output flow control is off, input flow control is off loopback not set, Maintenance is enabled, ARP type ARPA, ARP timeout 04:00:00 Last clearing of "show interface" counters never 5 minute input rate 0 bits/sec, 0 packets/sec 5 minute output rate 0 bits/sec, 0 packets/sec 0 packets input, 0 bytes, 0 total input drops 0 drops for unrecognized upper-level protocol Received 0 broadcast packets, 0 multicast packets 0 runts, 0 giants, 0 throttles, 0 parity 0 input errors, 0 CRC, 0 frame, 0 overrun, 0 ignored, 0 abort 0 packets output, 0 bytes, 0 total output drops Output 0 broadcast packets, 0 multicast packets 0 output errors, 0 underruns, 0 applique, 0 resets 0 output buffer failures, 0 output buffers swapped out 1 carrier transitions
7-150Cisco IOS XR Troubleshooting Guide for the Cisco ASR 9000 Aggregation Services Router
OL-23591-02

Chapter 7 Troubleshooting Router Switch Fabric and Data Path Troubleshooting Packet Drops
In the following example, there were some ingress and egress drops in the RESOLVE stage. All of these drops in the ingress (9 drops) and egress (6 drops) were caused by the next hop being unreachable (a total of 15 drops for IPv4 next hop down).
RP/0/RSP0/CPU0:router# show controllers np counters np3 location 0/0/CPU0 | include DROP Mon Nov 15 12:18:35.289 EST
30 RESOLVE_INGRESS_DROP_CNT 9 0 31 RESOLVE_EGRESS_DROP_CNT 6 0 295 DROP_IPV4_NEXT_HOP_DOWN 15 0
The following example shows a typical output from the same command, but without the modifier | include DROP.
RP/0/RSP0/CPU0:router# show controllers np counters np3 Mon Nov 15 12:20:35.289 EST
Node: 0/0/CPU0:----------------------------------------------------------------Show global stats counters for NP3, revision v3
Read 20 non-zero NP counters:Offset Counter FrameValue Rate (pps)------------------------------------------------------------------------------- 23 PARSE_FABRIC_RECEIVE_CNT 417 0 30 RESOLVE_INRESS_DROP_CNT 9 0
31 RESOLVE_EGRESS_DROP_CNT 6 053 MODIFY_FRAMES_PADDED_CNT 3230 0
67 PARSE_MOFRR_SWITCH_MSG_RCVD_FROM_FAB 920 0 70 RESOLVE_INGRESS_L2_PUNT_CNT 1081 0 71 RESOLVE_EGRESS_L3_PUNT_CNT 4613 0 74 RESOLVE_LEARN_FROM_NOTIFY_CNT 3484 0 75 RESOLVE_BD_FLUSH_DELETE_CNT 104 0 83 RESOLVE_MOFRR_HASH_UPDATE_CNT 463 0 87 RESOLVE_MOFRR_SWITCH_MSG_INGNORED 407 0 111 DIAGS 536 0295 DROP_IPV4_NEXT_HOP_DOWN 15 0
.
.
.
Step 8 Check the NP Bridge3 counters.
RP/0/RSP0/CPU0:router# show controllers np fabric-counters all ?
all All NP instances np0 NP0 instance np1 NP1 instance np2 NP2 instance np3 NP3 instance
RP/0/RSP0/CPU0:router# show controllers np fabric-counters all <np instance or all> location <location>
RP/0/RSP0/CPU0:router# show controllers np fabric-counters all np3 location 0/5/CPU0
Check the NP-bridge rx/tx counters for each NP on the LC. View the packet sent and received counts, bytes transferred, packet counters categorized by packet size, and so forth. The fields of interest are:
xaui_a_t_transmited_packets_cnt: The number of packets sent by the NP to the bridge
xaui_a_r_received_packets_cnt: The number of packets sent by the bridge to the NP
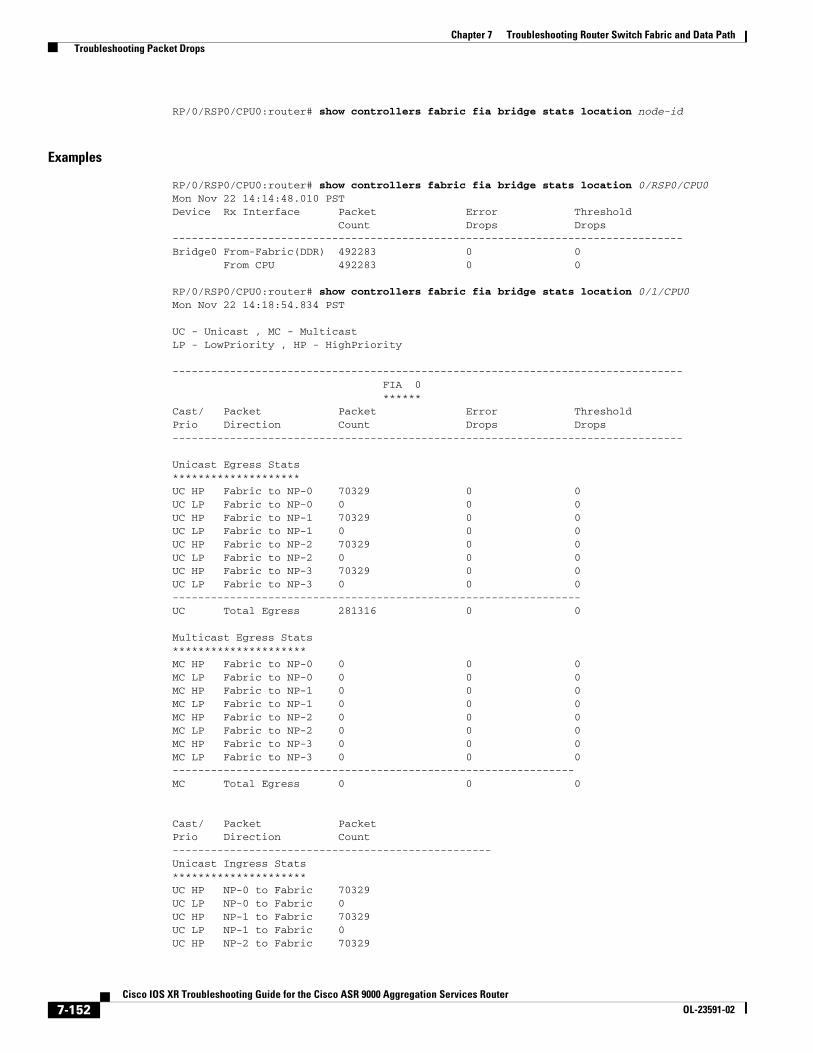
Step 9 Check the bridge counters
7-151Cisco IOS XR Troubleshooting Guide for the Cisco ASR 9000 Aggregation Services Router
OL-23591-02
Chapter 7 Troubleshooting Router Switch Fabric and Data Path Troubleshooting Packet Drops
RP/0/RSP0/CPU0:router# show controllers fabric fia bridge stats location node-id
Examples
RP/0/RSP0/CPU0:router# show controllers fabric fia bridge stats location 0/RSP0/CPU0 Mon Nov 22 14:14:48.010 PSTDevice Rx Interface Packet Error Threshold Count Drops Drops --------------------------------------------------------------------------------Bridge0 From-Fabric(DDR) 492283 0 0 From CPU 492283 0 0
RP/0/RSP0/CPU0:router# show controllers fabric fia bridge stats location 0/1/CPU0Mon Nov 22 14:18:54.834 PST
UC - Unicast , MC - MulticastLP - LowPriority , HP - HighPriority
-------------------------------------------------------------------------------- FIA 0 ******Cast/ Packet Packet Error Threshold Prio Direction Count Drops Drops --------------------------------------------------------------------------------
Unicast Egress Stats********************UC HP Fabric to NP-0 70329 0 0 UC LP Fabric to NP-0 0 0 0 UC HP Fabric to NP-1 70329 0 0 UC LP Fabric to NP-1 0 0 0 UC HP Fabric to NP-2 70329 0 0 UC LP Fabric to NP-2 0 0 0 UC HP Fabric to NP-3 70329 0 0 UC LP Fabric to NP-3 0 0 0 ----------------------------------------------------------------UC Total Egress 281316 0 0
Multicast Egress Stats*********************MC HP Fabric to NP-0 0 0 0 MC LP Fabric to NP-0 0 0 0 MC HP Fabric to NP-1 0 0 0 MC LP Fabric to NP-1 0 0 0 MC HP Fabric to NP-2 0 0 0 MC LP Fabric to NP-2 0 0 0 MC HP Fabric to NP-3 0 0 0 MC LP Fabric to NP-3 0 0 0 ---------------------------------------------------------------MC Total Egress 0 0 0
Cast/ Packet Packet Prio Direction Count --------------------------------------------------Unicast Ingress Stats*********************UC HP NP-0 to Fabric 70329 UC LP NP-0 to Fabric 0 UC HP NP-1 to Fabric 70329 UC LP NP-1 to Fabric 0 UC HP NP-2 to Fabric 70329
7-152Cisco IOS XR Troubleshooting Guide for the Cisco ASR 9000 Aggregation Services Router
OL-23591-02

Chapter 7 Troubleshooting Router Switch Fabric and Data Path Troubleshooting Packet Drops
UC LP NP-2 to Fabric 0 UC HP NP-3 to Fabric 70329 UC LP NP-3 to Fabric 0 --------------------------------------------------UC Total Ingress 281316
Multicast Ingress Stats***********************MC HP NP-0 to Fabric 0 MC LP NP-0 to Fabric 0 MC HP NP-1 to Fabric 0 MC LP NP-1 to Fabric 0 MC HP NP-2 to Fabric 0 MC LP NP-2 to Fabric 0 MC HP NP-3 to Fabric 0 MC LP NP-3 to Fabric 0 --------------------------------------------------MC Total Ingress 0
Ingress Drop Stats (MC & UC combined)**************************************PriorityPacket Error Threshold Direction Drops Drops --------------------------------------------------LP NP-0 to Fabric 0 0 HP NP-0 to Fabric 0 0 LP NP-1 to Fabric 0 0 HP NP-1 to Fabric 0 0 LP NP-2 to Fabric 0 0 HP NP-2 to Fabric 0 0 LP NP-3 to Fabric 0 0 HP NP-3 to Fabric 0 0 -------------------------------------------------- Total IngressDrops 0 0
Step 10 Check the FIA counters
RP/0/RSP0/CPU0:router# show controllers fabric fia stats location locationExamples:RP/0/RSP0/CPU0:router# show controllers fabric fia stats location 0/RSP0/CPU0
Wed Aug 25 12:36:43.151 DST
FIA:0 DDR Packet counters:=========================From Punt 686545 To Punt 582387
FIA:0 SuperFrame counters:=========================To Unicast Xbar[0] 821335 To Unicast Xbar[1] 0 To Unicast Xbar[2] 0 To Unicast Xbar[3] 0 To MultiCast Xbar[0] 7758 To MultiCast Xbar[1] 0 To MultiCast Xbar[2] 15807 To MultiCast Xbar[3] 0
From Unicast Xbar[0] 629854 From Unicast Xbar[1] 0 From Unicast Xbar[2] 1
7-153Cisco IOS XR Troubleshooting Guide for the Cisco ASR 9000 Aggregation Services Router
OL-23591-02
Chapter 7 Troubleshooting Router Switch Fabric and Data Path Troubleshooting Packet Drops
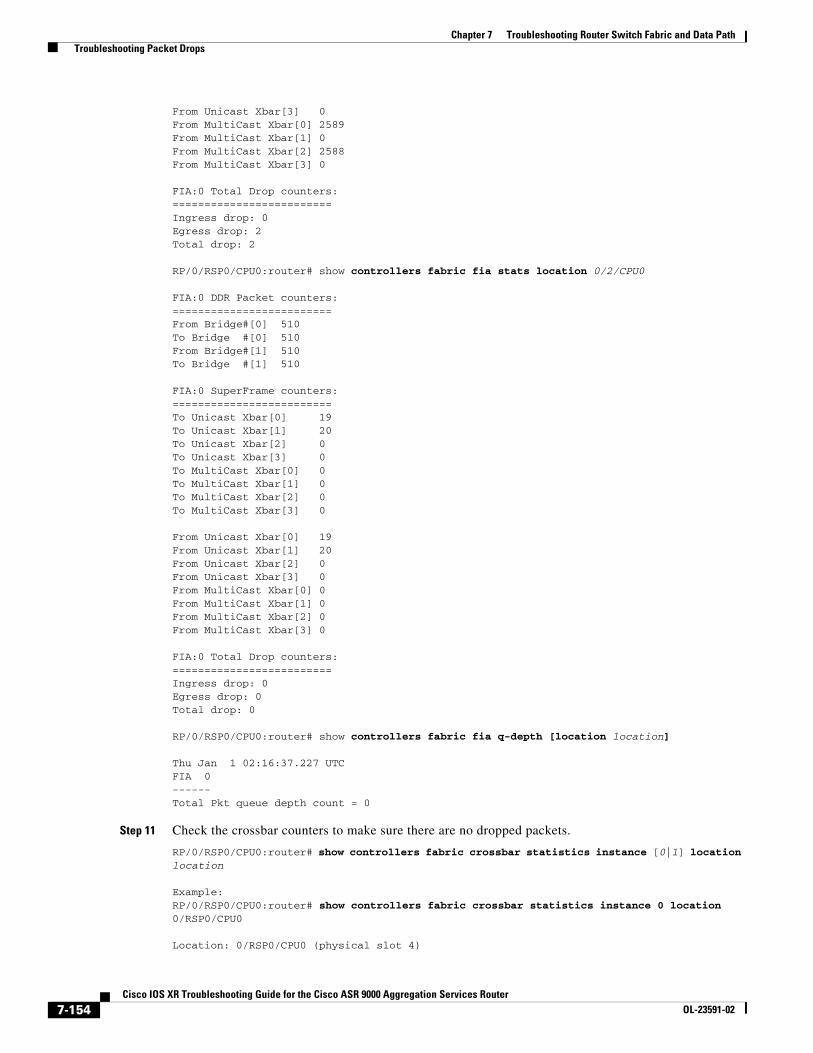
From Unicast Xbar[3] 0 From MultiCast Xbar[0] 2589 From MultiCast Xbar[1] 0 From MultiCast Xbar[2] 2588 From MultiCast Xbar[3] 0
FIA:0 Total Drop counters:=========================Ingress drop: 0 Egress drop: 2 Total drop: 2
RP/0/RSP0/CPU0:router# show controllers fabric fia stats location 0/2/CPU0
FIA:0 DDR Packet counters:=========================From Bridge#[0] 510 To Bridge #[0] 510 From Bridge#[1] 510 To Bridge #[1] 510
FIA:0 SuperFrame counters:=========================To Unicast Xbar[0] 19 To Unicast Xbar[1] 20 To Unicast Xbar[2] 0 To Unicast Xbar[3] 0 To MultiCast Xbar[0] 0 To MultiCast Xbar[1] 0 To MultiCast Xbar[2] 0 To MultiCast Xbar[3] 0
From Unicast Xbar[0] 19 From Unicast Xbar[1] 20 From Unicast Xbar[2] 0 From Unicast Xbar[3] 0 From MultiCast Xbar[0] 0 From MultiCast Xbar[1] 0 From MultiCast Xbar[2] 0 From MultiCast Xbar[3] 0
FIA:0 Total Drop counters:=========================Ingress drop: 0 Egress drop: 0 Total drop: 0
RP/0/RSP0/CPU0:router# show controllers fabric fia q-depth [location location]
Thu Jan 1 02:16:37.227 UTCFIA 0------Total Pkt queue depth count = 0
Step 11 Check the crossbar counters to make sure there are no dropped packets.
RP/0/RSP0/CPU0:router# show controllers fabric crossbar statistics instance [0|1] location location
Example:RP/0/RSP0/CPU0:router# show controllers fabric crossbar statistics instance 0 location 0/RSP0/CPU0
Location: 0/RSP0/CPU0 (physical slot 4)
7-154Cisco IOS XR Troubleshooting Guide for the Cisco ASR 9000 Aggregation Services Router
OL-23591-02
Chapter 7 Troubleshooting Router Switch Fabric and Data Path Troubleshooting Packet Drops
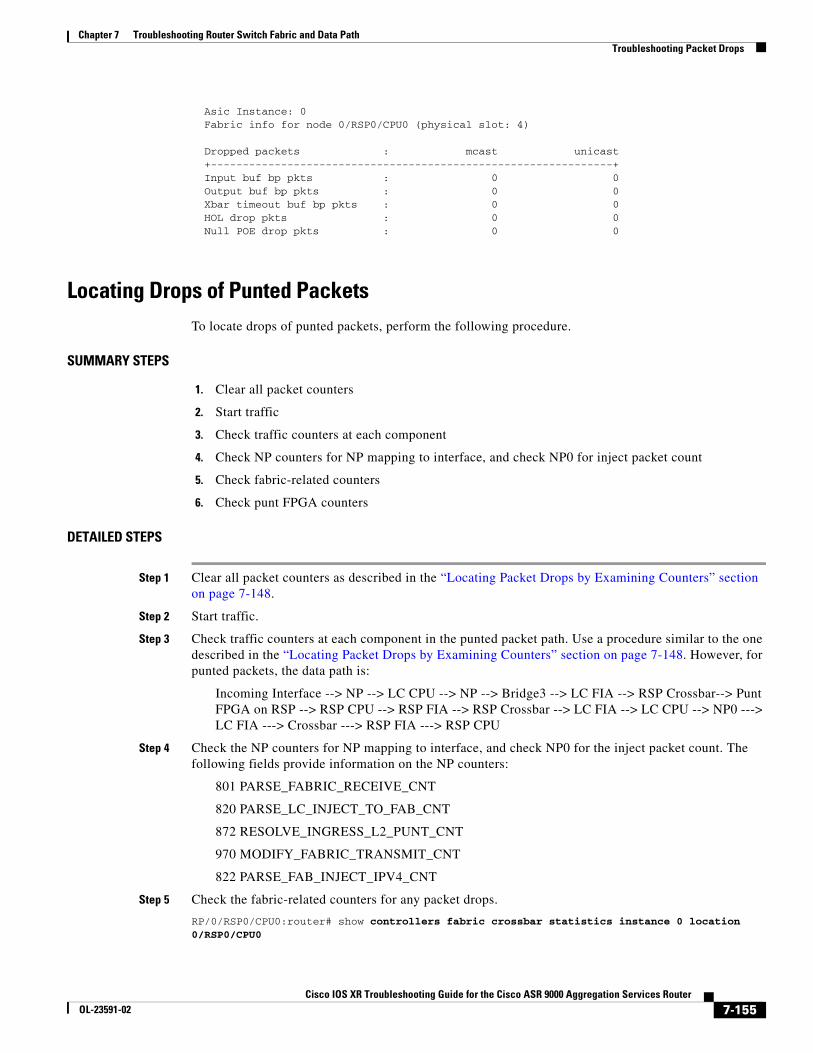
Asic Instance: 0 Fabric info for node 0/RSP0/CPU0 (physical slot: 4)
Dropped packets : mcast unicast +---------------------------------------------------------------+ Input buf bp pkts : 0 0 Output buf bp pkts : 0 0 Xbar timeout buf bp pkts : 0 0 HOL drop pkts : 0 0 Null POE drop pkts : 0 0
Locating Drops of Punted PacketsTo locate drops of punted packets, perform the following procedure.
SUMMARY STEPS
1. Clear all packet counters
2. Start traffic
3. Check traffic counters at each component
4. Check NP counters for NP mapping to interface, and check NP0 for inject packet count
5. Check fabric-related counters
6. Check punt FPGA counters
DETAILED STEPS
Step 1 Clear all packet counters as described in the “Locating Packet Drops by Examining Counters” section on page 7-148.
Step 2 Start traffic.
Step 3 Check traffic counters at each component in the punted packet path. Use a procedure similar to the one described in the “Locating Packet Drops by Examining Counters” section on page 7-148. However, for punted packets, the data path is:
Incoming Interface --> NP --> LC CPU --> NP --> Bridge3 --> LC FIA --> RSP Crossbar--> Punt FPGA on RSP --> RSP CPU --> RSP FIA --> RSP Crossbar --> LC FIA --> LC CPU --> NP0 ---> LC FIA ---> Crossbar ---> RSP FIA ---> RSP CPU
Step 4 Check the NP counters for NP mapping to interface, and check NP0 for the inject packet count. The following fields provide information on the NP counters:
801 PARSE_FABRIC_RECEIVE_CNT
820 PARSE_LC_INJECT_TO_FAB_CNT
872 RESOLVE_INGRESS_L2_PUNT_CNT
970 MODIFY_FABRIC_TRANSMIT_CNT
822 PARSE_FAB_INJECT_IPV4_CNT
Step 5 Check the fabric-related counters for any packet drops.
RP/0/RSP0/CPU0:router# show controllers fabric crossbar statistics instance 0 location 0/RSP0/CPU0
7-155Cisco IOS XR Troubleshooting Guide for the Cisco ASR 9000 Aggregation Services Router
OL-23591-02

Chapter 7 Troubleshooting Router Switch Fabric and Data Path Troubleshooting Packet Drops
RP/0/RSP0/CPU0:router# show controllers fabric fia stats [location location]
Example: RP/0/RSP0/CPU0:router# show controllers fabric fia stats location 0/5/CPU0
RP/0/RSP0/CPU0:router# show controllers fabric fia bridge stats [location location]
Examples:RP/0/RSP0/CPU0:router# show controllers fabric fia bridge stats location 0/RSP0/CPU0
Wed Aug 25 14:12:03.916 DST
Device Rx Interface Packet Error Threshold Count Drops Drops --------------------------------------------------------------------------------Bridge0 From-Fabric(DDR) 603698 0 0 From CPU 711734 0 0
RP/0/RSP0/CPU0:router# show controllers fabric fia bridge stats location 0/5/CPU0
Wed Aug 25 14:12:20.867 DST
UC - Unicast , MC - MulticastLP - LowPriority , HP - HighPriority
-------------------------------------------------------------------------------- FIA 0 ******Cast/ Packet Packet Error Threshold Prio Direction Count Drops Drops --------------------------------------------------------------------------------
Unicast Egress Stats********************UC HP Fabric to NP-0 28 0 0 UC LP Fabric to NP-0 0 0 0 UC HP Fabric to NP-1 28 0 0 UC LP Fabric to NP-1 0 0 0 UC HP Fabric to NP-2 28 0 0 UC LP Fabric to NP-2 0 0 0 UC HP Fabric to NP-3 28 0 0 UC LP Fabric to NP-3 0 0 0 ----------------------------------------------------------------UC Total Egress 112 0 0
Multicast Egress Stats*********************MC HP Fabric to NP-0 205 0 0 MC LP Fabric to NP-0 2 0 0 MC HP Fabric to NP-1 205 0 0 MC LP Fabric to NP-1 2 0 0 MC HP Fabric to NP-2 205 0 0 MC LP Fabric to NP-2 2 0 0 MC HP Fabric to NP-3 205 0 0 MC LP Fabric to NP-3 2 0 0 ---------------------------------------------------------------MC Total Egress 828 0 0
--More--
Step 6 To check for packets punted to and injected from the LC or RP CPU, run the following commands.
RP/0/RSP0/CPU0:router# show spp interface location node-id
7-156Cisco IOS XR Troubleshooting Guide for the Cisco ASR 9000 Aggregation Services Router
OL-23591-02
Chapter 7 Troubleshooting Router Switch Fabric and Data Path Troubleshooting Packet Drops
RP/0/RSP0/CPU0:router# show spp node-counters location node-id
RP/0/RSP0/CPU0:router# show spp node location node-id
RP/0/RSP0/CPU0:router# show spp sid stats location node-id
RP/0/RSP0/CPU0:router# show spp client location node-id
Note To clear the spp counters, run the command clear spp {client | interface | node-counters} location node-id. This command clears client statistics, interface statistics, and per-node counters, depending on the keyword you use.
Step 7 To query the punt switch for the statistics on the LC CPU, run the following command.
RP/0/RSP0/CPU0:router# show controllers punt-switch switch-stats location node-id
Packet Drop from LC to LCIn this scenario, you have configured the system, RSP and LC have come up and are stable, LC to LC traffic is going through, but some packets are dropped.
The possible causes are:
• Traffic dropped at interface
• Traffic dropped at NP3
• Traffic dropped at bridge
• Traffic dropped at the fabric I/O
• Synchronization between the fabric I/O and the fabric NP or fabric arbiter NP has a problem
• Traffic has wrong vqi
• Oversubscribed traffic
• Unknown failures
Locate the Problem and Take Corrective Action
Follow this procedure to locate the problem. After you locate the problem, take corrective action based on your findings. Corrective action might include, for example, configuration updates or hardware/software version upgrades.
Step 1 If not already done, perform the procedures in the “Getting Started with Fabric Troubleshooting” section on page 7-145 to verify that you have the correct versions of the hardware and software.
Step 2 Collect the sync status of fabric on the LC.
show controllers fabric fia link-status location <0/1/CPU0>
show controllers fabric fia bridge ddr-status location <0/1/cpu0>
show controllers fabric fia bridge sync-status location 0/1/cpu0
Step 3 Collect configuration information.
show run
7-157Cisco IOS XR Troubleshooting Guide for the Cisco ASR 9000 Aggregation Services Router
OL-23591-02
Chapter 7 Troubleshooting Router Switch Fabric and Data Path Troubleshooting Packet Drops
Step 4 dump PFM errors on both source and destination LC.
show pfm location <0/1/cpu0>
Step 5 Collect the fabric I/O/Bridge counters on both source and destination card.
show interfaces
show controllers np counters all
show controllers fabric fia stats location 0/1/CPU0
show controllers fabric fia bridge stats location 0/1/CPU0
Step 6 Collect redundancy information.
show redundancy
Where to Go Next
If you have not been able to locate or correct the problem, you might be able to clear it by performing the following steps. However, these steps might delete information that would help you perform additional troubleshooting with Cisco Technical Support. Some of the steps involve stopping or reducing traffic streams, which might not be appropriate on a deployed system. Consult with your network administrator before you perform any of these steps.
Caution Before you follow these next steps, consider contacting Cisco Technical Support. Some of these steps can cause loss of data that would be useful for future analysis and troubleshooting, or could cause loss of traffic.
Step 1 Perform ‘reset –h’ at LC ROMMON and reboot the LC again to see if this clears the problem.
Step 2 Pull out the LC and reinsert it to see if it can boot up.
Step 3 Stop other streams of traffic to see if this failed stream can go through.
Step 4 Reduce the rate of the traffic to see if the drop continues.
Packet Drop Between RSP and LCIn this scenario, you have configured the system, RSP and LC have come up and are stable, but one of the following problems occurred:
• Protocol or ping traffic (punt path traffic) has some drops
• Initially the ping/protocol packets are not going through, but later recover.
The possible causes are:
• Traffic dropped at interface
• Traffic dropped at NP3
• Traffic dropped at bridge
7-158Cisco IOS XR Troubleshooting Guide for the Cisco ASR 9000 Aggregation Services Router
OL-23591-02

Chapter 7 Troubleshooting Router Switch Fabric and Data Path Troubleshooting Packet Drops
• Traffic dropped at the fabric I/O
• Sync between the fabric I/O and the fabric NP or fabric arbiter NP has a problem
• Traffic has wrong vqi
• Traffic drop at Punt FPGA
• sn database sync issue
• Unknown failures
Locate the Problem and Take Corrective Action
Follow this procedure to locate the problem. After you locate the problem, take corrective action based on your findings. Corrective action might include, for example, configuration updates or hardware/software version upgrades.
Step 1 If not already done, perform the procedures in the “Getting Started with Fabric Troubleshooting” section on page 7-145 to verify that you have the correct versions of the hardware and software.
Step 2 Collect the sync status of fabric on the linecard.
show controllers fabric fia link-status location <0/1/CPU0>
show controllers fabric fia bridge ddr-status location <0/1/cpu0>
show controllers fabric fia bridge sync-status location 0/1/cpu0
Step 3 Collect configuration information.
show run
Step 4 Dump the PFM errors for the card.
show pfm location <0/1/cpu0>
show pfm location <0/rsp0/cpu0>
Step 5 Collect the fabric I/O/bridge counters on both RSP and LC.
show interfaces
show controllers np counters all
show controllers fabric fia stats location 0/1/CPU0
show controllers fabric fia bridge stats location 0/1/CPU0
show controllers fabric fia stats location 0/rsp0/CPU0
Where to Go Next
If you have not been able to locate or correct the problem, you might be able to clear it by performing the following steps. However, these steps might delete information that would help you perform additional troubleshooting with Cisco Technical Support. Some of the steps involve stopping or reducing traffic streams, which might not be appropriate on a deployed system. Consult with your network administrator before you perform any of these steps.
7-159Cisco IOS XR Troubleshooting Guide for the Cisco ASR 9000 Aggregation Services Router
OL-23591-02

Chapter 7 Troubleshooting Router Switch Fabric and Data Path Troubleshooting Packet Drops
Caution Before you follow these next steps, consider contacting Cisco Technical Support. Some of these steps can cause loss of data that would be useful for future analysis and troubleshooting, or could cause loss of traffic.
Step 1 Perform ‘reset –h’ at LC ROMMON and reboot the LC again to see if this clears the problem.
Step 2 Pull out the LC and reinsert it to see if it can boot up.
Step 3 Stop other streams of traffic to see if this failed stream can go through.
Step 4 Determine whether the drop is a single burst in the beginning or is continuous.
Step 5 Determine if the drop is associated with particular packet size.
Packet Drop After Certain ActionsIn this scenario, the system is configured, RSP and LC have come up, and traffic is flowing properly for some time. However, after certain action such as configuration change, online insertion and removal (OIR) of LC/RSP, LC reload, or software upgrade, some traffic drop or complete traffic loss is observed.
The possible causes are:
• Traffic dropped at interface
• Traffic dropped at NP3
• Traffic dropped at bridge
• Traffic dropped at the fabric I/O
• Sync between the fabric I/O and the fabric NP or fabric arbiter NP has a problem
• Traffic has wrong vqi
• Traffic drop at Punt FPGA
• sn database sync issue
• Unknown failures
Locate the Problem and Take Corrective Action
Follow this procedure to locate the problem. After you locate the problem, take corrective action based on your findings. Corrective action might include, for example, configuration updates or hardware/software version upgrades.
Step 1 Perform the procedures in the “Getting Started with Fabric Troubleshooting” section on page 7-145 to verify that you have the correct versions of the hardware and software.
Step 2 Collect the sync status of fabric on the linecard.
show controllers fabric fia link-status location <0/1/CPU0>
show controllers fabric fia bridge ddr-status location <0/1/cpu0>
show controllers fabric fia bridge sync-status location 0/1/cpu0
Step 3 Collect configuration information.
7-160Cisco IOS XR Troubleshooting Guide for the Cisco ASR 9000 Aggregation Services Router
OL-23591-02

Chapter 7 Troubleshooting Router Switch Fabric and Data Path Troubleshooting Packet Drops
show run
Step 4 Dump the PFM errors for the card.
show pfm location <0/1/cpu0>
show pfm location <0/rsp0/cpu0>
Step 5 Collect the fabric I/O/bridge counters on both the RSP and LC.
show interfaces
show controllers np counters all
show controllers fabric fia stats location 0/1/CPU0
show controllers fabric fia bridge stats location 0/1/CPU0
show controllers fabric fia stats location 0/rsp0/CPU0
Step 6 Collect redundancy information.
show redundancy
Where to Go Next
If you have not been able to locate or correct the problem, you might be able to clear it by performing the following steps. However, these steps might delete information that would help you perform additional troubleshooting with Cisco Technical Support. Some of the steps involve stopping or reducing traffic streams, which might not be appropriate on a deployed system. Consult with your network administrator before you perform any of these steps.
Caution Before you follow these next steps, consider contacting Cisco Technical Support. Some of these steps can cause loss of data that would be useful for future analysis and troubleshooting, or could cause loss of traffic.
Step 1 Perform ‘reset –h’ at LC ROMMON and reboot the LC again to see if this clears the problem.
Step 2 Pull out the LC and reinsert it to see if it can boot up.
Step 3 Stop other streams of traffic to see if this failed stream can go through.
Step 4 Repeat Step 1 through Step 3 to determine whether the results are reproducible.
Packet Drop After a Redundancy SwitchoverIn this scenario, you have configured the system, RSP and LC have come up, and traffic is flowing properly for some time. However, after a switchover (by a command or OIR), you see some traffic drop or complete traffic loss.
The possible causes are:
• Traffic dropped at interface
7-161Cisco IOS XR Troubleshooting Guide for the Cisco ASR 9000 Aggregation Services Router
OL-23591-02
Chapter 7 Troubleshooting Router Switch Fabric and Data Path Troubleshooting Packet Drops
• Traffic dropped at NP3
• Traffic dropped at bridge
• Traffic dropped at the fabric I/O
• Sync between the fabric I/O and the fabric NP or fabric arbiter NP has a problem
• Traffic has wrong vqi
• Traffic drop at Punt FPGA
• sn database sync issue
• Fabric is stuck
• Unknown failures
Locate the Problem and Take Corrective Action
Follow this procedure to locate the problem. After you locate the problem, take corrective action based on your findings. Corrective action might include, for example, configuration updates or hardware/software version upgrades.
Step 1 Perform the procedures in the “Getting Started with Fabric Troubleshooting” section on page 7-145 to verify that you have the correct versions of the hardware and software.
Step 2 Collect the sync status of fabric on the linecard before and after the switchover.
show controllers fabric fia link-status location <0/1/CPU0>
show controllers fabric fia bridge ddr-status location <0/1/cpu0>
show controllers fabric fia bridge sync-status location 0/1/cpu0
Step 3 Collect configuration information.
show run
Step 4 Dump the PFM errors for the card.
show pfm location <0/1/cpu0>
show pfm location <0/rsp0/cpu0>
Step 5 Collect the fabric I/O/bridge counters on both the RSP and LC.
show interfaces
show controllers np counters all
show controllers fabric fia stats location 0/1/CPU0
show controllers fabric fia bridge stats location 0/1/CPU0
show controllers fabric fia stats location 0/rsp0/CPU0
Step 6 Collect redundancy information.
show redundancy
7-162Cisco IOS XR Troubleshooting Guide for the Cisco ASR 9000 Aggregation Services Router
OL-23591-02

Chapter 7 Troubleshooting Router Switch Fabric and Data Path Troubleshooting Packet Drops
Where to Go Next
If you have not been able to locate or correct the problem, you might be able to clear it by performing the following steps. However, these steps might delete information that would help you perform additional troubleshooting with Cisco Technical Support. Some of the steps involve stopping or reducing traffic streams, which might not be appropriate on a deployed system. Consult with your network administrator before you perform any of these steps.
Caution Before you follow these next steps, consider contacting Cisco Technical Support. Some of these steps can cause loss of data that would be useful for future analysis and troubleshooting, or could cause loss of traffic.
Step 1 Stop other streams of traffic to see if this failed stream can go through again.
Step 2 Repeat Step 1 several times to determine if the result is reproducible.
Step 3 Perfom a switchover back to the other side to determine whether both directions are having the same traffic problems.
Step 4 After obtaining the necessary approvals from your network and system administrators (because this step will stop all traffic on this unit), reboot the entire system and check to see if it recovers.
Packet Drop with Unknown ReasonIn this scenario, you have configured the system, RSP and LC have come up, and traffic is flowing properly for a significant time (at least several days). However, for an unknown reason, the system experiences traffic drops or complete traffic loss.
The possible causes are:
• Traffic dropped at interface
• Traffic dropped at NP3
• Traffic dropped at bridge
• Traffic dropped at the fabric I/O
• Sync between the fabric I/O and the fabric NP or fabric arbiter NP has a problem
• Traffic has wrong vqi
• Traffic drop at Punt FPGA
• Fabric is stuck
• Unknown failures
Locate the Problem and Take Corrective Action
Follow this procedure to locate the problem. After you locate the problem, take corrective action based on your findings. Corrective action might include, for example, configuration updates or hardware/software version upgrades.
Step 1 Perform the procedures in the “Getting Started with Fabric Troubleshooting” section on page 7-145 to verify that you have the correct versions of the hardware and software.
7-163Cisco IOS XR Troubleshooting Guide for the Cisco ASR 9000 Aggregation Services Router
OL-23591-02
Chapter 7 Troubleshooting Router Switch Fabric and Data Path Troubleshooting Packet Drops
Step 2 Collect the sync status of fabric on the linecard before and after the switchover.
show controllers fabric fia link-status location <0/1/CPU0>
show controllers fabric fia bridge ddr-status location <0/1/cpu0>
show controllers fabric fia bridge sync-status location 0/1/cpu0
Step 3 Dump the PFM errors for the card.
show pfm location <0/1/cpu0>
show pfm location <0/rsp0/cpu0>
Step 4 Collect the fabric I/O/bridge counters on both the RSP and LC.
show interfaces
show controllers np counters all
show controllers fabric fia stats location 0/1/CPU0
show controllers fabric fia bridge stats location 0/1/CPU0
show controllers fabric fia stats location 0/rsp0/CPU0
Step 5 Collect redundancy information.
show redundancy
Step 6 Check for drops on the the fabric I/O interface (FIA drop counters) on the LC in both the ingress (to fabric) and egress (from fabric) directions.
show controllers fabric fia drops egress location show controllers fabric fia drops ingress location show controllers fabric fia error egress location show controllers fabric fia error ingress location
Step 7 Check for drops on the bridge. Counters are a combination of high priority (HP), low priority (LP), unicast, multicast, DDR, and DDR-threshold packets. They are furthur segregated into critical and informational based on their severity. All Ethernet linecards have 2 bridges. Use the following command to obtain this information.
show controllers fabric fia bridge stats location <linecard location>
Step 8 Check if there are any drops on Punt FPGA on RSP.
show controllers fabric fia bridge stats location 0/RSP0/CPU0
Where to Go Next
If you have not been able to locate or correct the problem, you might be able to clear it by performing the following steps. However, these steps might delete information that would help you perform additional troubleshooting with Cisco Technical Support. Some of the steps involve stopping or reducing traffic streams, which might not be appropriate on a deployed system. Consult with your network administrator before you perform any of these steps.
7-164Cisco IOS XR Troubleshooting Guide for the Cisco ASR 9000 Aggregation Services Router
OL-23591-02
Chapter 7 Troubleshooting Router Switch Fabric and Data Path Troubleshooting RSP and LC Crashes
Caution Before you follow these next steps, consider contacting Cisco Technical Support. Some of these steps can cause loss of data that would be useful for future analysis and troubleshooting, or could cause loss of traffic.
Step 1 Stop other streams of traffic to see if this failed stream can go through again.
Step 2 Reboot the LCs one at a time and check if the traffic recovers.
Step 3 After obtaining the necessary approvals from your network and system administrators (because this step will stop all traffic on this unit), reboot the entire system and check to see if it recovers.
Step 4 Reconfigure the system to see if it recovers.
Troubleshooting RSP and LC CrashesThis section explains how to troubleshoot the following problems:
• Active RSP Is Crashing, page 7-165
• Standby RSP Is Crashing, page 7-166
• LC Is Crashing, page 7-167
Active RSP Is CrashingIn this scenario, the active RSP keeps crashing and the RSP console shows that the active fabric manager or fia_rsp (the fabric I/O process) terminates repeatedly.
The possible causes are:
• Initialization of the fabric I/O fails for some reason
• Fabric self-test fails
• The synchronization between the fabric I/O and the fabric NP or fabric arbiter NP has a problem
• Unknown failures
Locate the Problem and Take Corrective Action
Follow this procedure to locate the problem. After you locate the problem, take corrective action based on your findings. Corrective action might include, for example, configuration updates or hardware/software version upgrades.
Step 1 Perform the procedures in the “Getting Started with Fabric Troubleshooting” section on page 7-145 to verify that you have the correct versions of the hardware and software.
Step 2 Collect the sync status of fabric on the RSP card.
show controllers fabric fia link-status location <0/RSP0/CPU0>
show controllers fabric fia bridge sync-status location
show controllers fabric fia bridge sync-status location 0/1/cpu0
7-165Cisco IOS XR Troubleshooting Guide for the Cisco ASR 9000 Aggregation Services Router
OL-23591-02

Chapter 7 Troubleshooting Router Switch Fabric and Data Path Troubleshooting RSP and LC Crashes
Step 3 Dump the PFM errors for the card.
show pfm location <0/rsp0/cpu0>
Step 4 Collect the fabric I/O/Punt counters.
show controllers fabric fia stats location <0/rsp0/CPU0>
Where to Go Next
If you have not been able to locate or correct the problem, you might be able to clear it by performing the following steps. However, these steps might delete information that would help you perform additional troubleshooting with Cisco Technical Support. Some of the steps involve stopping or reducing traffic streams, which might not be appropriate on a deployed system. Consult with your network administrator before you perform any of these steps.
Caution Before you follow these next steps, consider contacting Cisco Technical Support. Some of these steps can cause loss of data that would be useful for future analysis and troubleshooting, or could cause loss of traffic.
Step 1 Perform ‘reset –h’ at LC ROMMON and reboot the RSP again to see if this clears the problem.
Step 2 Pull out the RSP and reinsert it to see if it can boot up.
Step 3 Swap the slot (put the RSP card into the other RSP slot) and see if it can boot up properly.
Standby RSP Is CrashingIn this scenario, the active RSP is up and running, but the standby RSP keeps crashing. The RSP console shows that the standby fabric manager or fia_rsp (the fabric I/O process) terminates repeatedly.
The possible causes are:
• Initialization of the standby fabric I/O fails for some reason
• Fabric self-test on the standby card fails
• The sync between the fabric I/O and the fabric NP or fabric arbiter NP has a problem
• Communication between the active and standby card is not working
• Unknown failures
Locate the Problem and Take Corrective Action
Follow this procedure to locate the problem. After you locate the problem, take corrective action based on your findings. Corrective action might include, for example, configuration updates or hardware/software version upgrades.
Step 1 If not already done, perform the procedures in the “Getting Started with Fabric Troubleshooting” section on page 7-145 to verify that you have the correct versions of the hardware and software.
7-166Cisco IOS XR Troubleshooting Guide for the Cisco ASR 9000 Aggregation Services Router
OL-23591-02
Chapter 7 Troubleshooting Router Switch Fabric and Data Path Troubleshooting RSP and LC Crashes
Step 2 Collect the sync status of fabric on the RSP card.
show controllers fabric fia link-status location <0/RSP0/CPU0>
Step 3 Dump the PFM errors for the card.
show pfm location <0/rsp0/cpu0>
Step 4 Dump the redundancy status.
show redundancy
Step 5 Collect the fabric I/O/ punt counters.
show controllers fabric fia stats location <0/1/CPU0>
Where to Go Next
If you have not been able to locate or correct the problem, you might be able to clear it by performing the following steps. However, these steps might delete information that would help you perform additional troubleshooting with Cisco Technical Support. Some of the steps involve stopping or reducing traffic streams, which might not be appropriate on a deployed system. Consult with your network administrator before you perform any of these steps.
Caution Before you follow these next steps, consider contacting Cisco Technical Support. Some of these steps can cause loss of data that would be useful for future analysis and troubleshooting, or could cause loss of traffic.
Step 1 Perform ‘reset –h’ at the ROMMON and reboot the standby RSP again to see if this clears the problem.
Step 2 Pull out the RSP and reinsert it to see if it can boot up.
Step 3 Swap the slot (put the RSP card into the other RSP slot) and see if it can boot up properly.
LC Is Crashing In this scenario, a LC keeps crashing and the RSP console shows that fia_lc (the fabric I/O process) terminates repeatedly.
The possible causes are:
• Initialization of the LC fabric I/O fails for some reason
• Fabric self-test on the LC fails
• The synchronization between the fabric I/O and the fabric NP or fabric arbiter NP has a problem
• Communication between the LC and the RSP is not working properly
• There is a sync problem between the fabric I/O and the bridge
• Unknown failures
7-167Cisco IOS XR Troubleshooting Guide for the Cisco ASR 9000 Aggregation Services Router
OL-23591-02
Chapter 7 Troubleshooting Router Switch Fabric and Data Path Troubleshooting Complete Loss of Traffic
Locate the Problem and Take Corrective Action
Follow this procedure to locate the problem. After you locate the problem, take corrective action based on your findings. Corrective action might include, for example, configuration updates or hardware/software version upgrades.
Step 1 If not already done, perform the procedures in the “Getting Started with Fabric Troubleshooting” section on page 7-145 to verify that you have the correct versions of the hardware and software.
Step 2 Collect the sync status of the fabric on the LC.
show controllers fabric fia link-status location <0/1/CPU0>
show controllers fabric fia bridge ddr-status location <0/1/cpu0>
show controllers fabric fia bridge sync-status location 0/1/cpu0
Step 3 Dump the PFM errors for the card.
show pfm location <0/1/cpu0>
Step 4 Collect the fabric I/O/ bridge counters.
show controllers fabric fia stats location <0/1/CPU0>
show controllers fabric fia bridge stats location <0/1/CPU0>
Where to Go Next
If you have not been able to locate or correct the problem, you might be able to clear it by performing the following steps. However, these steps might delete information that would help you perform additional troubleshooting with Cisco Technical Support. Some of the steps involve stopping or reducing traffic streams, which might not be appropriate on a deployed system. Consult with your network administrator before you perform any of these steps.
Caution Before you follow these next steps, consider contacting Cisco Technical Support. Some of these steps can cause loss of data that would be useful for future analysis and troubleshooting, or could cause loss of traffic.
Step 1 Perform ‘reset –h’ at the LC ROMMON and reboot the LC again to see if this clears the problem.
Step 2 Pull out the LC and reinsert it to see if it can boot up.
Step 3 Swap the slot (pull out the LC and insert it into another LC slot) and see if it can boot up properly.
Step 4 Put a different LC of same type to see if that card can booting up properly.
Troubleshooting Complete Loss of TrafficThis section explains how to troubleshoot scenarios in which the system is active but traffic does not go through. It includes the following topics:
• No Traffic from LC to LC, page 7-169
7-168Cisco IOS XR Troubleshooting Guide for the Cisco ASR 9000 Aggregation Services Router
OL-23591-02
Chapter 7 Troubleshooting Router Switch Fabric and Data Path Troubleshooting Complete Loss of Traffic
• No Traffic Between RSP and LC, page 7-170
No Traffic from LC to LCIn this scenario, you have configured the system and the RSP and LC have come up and are stable, but no LC-to-LC traffic is going through.
The possible causes are:
• Traffic dropped at the interface
• Traffic dropped at NP3
• Traffic dropped at the bridge
• Traffic dropped at the fabric I/O
• Sync between the fabric I/O and the fabric NP or fabric arbiter NP has a problem
• Traffic has wrong vqi
• Unknown failures
Locate the Problem and Take Corrective Action
Follow this procedure to locate the problem. After you locate the problem, take corrective action based on your findings. Corrective action might include, for example, configuration updates or hardware/software version upgrades.
Step 1 Perform the procedures in the “Getting Started with Fabric Troubleshooting” section on page 7-145 to verify that you have the correct versions of the hardware and software.
Step 2 Collect the sync status of fabric on the LC.
show controllers fabric fia link-status location <0/1/CPU0>
show controllers fabric fia bridge ddr-status location <0/1/cpu0>
show controllers fabric fia bridge sync-status location 0/1/cpu0
Step 3 Collect configuration information.
show run
Step 4 Dump the PFM errors for the card.
show pfm location <0/1/cpu0>
show pfm location <0/rsp0/cpu0>
Step 5 Collect the fabric I/O/bridge counters on both the source and destination cards.
show interfaces
show controllers np counters all
show controllers fabric fia stats location 0/1/CPU0
show controllers fabric fia bridge stats location 0/1/CPU0
Step 6 Collect redundancy information.
show redundancy
7-169Cisco IOS XR Troubleshooting Guide for the Cisco ASR 9000 Aggregation Services Router
OL-23591-02
Chapter 7 Troubleshooting Router Switch Fabric and Data Path Troubleshooting Complete Loss of Traffic
Where to Go Next
If you have not been able to locate or correct the problem, you might be able to clear it by performing the following steps. However, these steps might delete information that would help you perform additional troubleshooting with Cisco Technical Support. Some of the steps involve stopping or reducing traffic streams, which might not be appropriate on a deployed system. Consult with your network administrator before you perform any of these steps.
Caution Before you follow these next steps, consider contacting Cisco Technical Support. Some of these steps can cause loss of data that would be useful for future analysis and troubleshooting, or could cause loss of traffic.
Step 1 Perform ‘reset –h’ at the LC ROMMON and reboot the LC again to see if this clears the problem.
Step 2 Pull out the LC and reinsert it to see if it can boot up and carry traffic.
Step 3 Stop other streams of traffic to see if this failed stream can go through.
Step 4 Run online diagnostics to locate errors in the system. For additional information on diagnostics, see the “Using Diagnostic Commands” section on page 1-59.
No Traffic Between RSP and LCIn this scenario, you have configured the system and the RSP and LC have come up and are stable, but no protocol or ping traffic (punt path traffic) is going through.
The possible causes are:
• Traffic dropped at the interface
• Traffic dropped at NP3
• Traffic dropped at the bridge
• Traffic dropped at the fabric I/O
• Sync between the fabric I/O and the fabric NP or fabric arbiter NP has a problem
• Traffic has wrong vqi
• Traffic dropped at the punt FPGA
• Traffic dropped at the protocol level
• Unknown failures
Locate the Problem and Take Corrective Action
Follow this procedure to locate the problem. After you locate the problem, take corrective action based on your findings. Corrective action might include, for example, configuration updates or hardware/software version upgrades.
7-170Cisco IOS XR Troubleshooting Guide for the Cisco ASR 9000 Aggregation Services Router
OL-23591-02
Chapter 7 Troubleshooting Router Switch Fabric and Data Path Troubleshooting Complete Loss of Traffic
Step 1 If not already done, perform the procedures in the “Getting Started with Fabric Troubleshooting” section on page 7-145 to verify that you have the correct versions of the hardware and software.
Step 2 Collect the sync status of fabric on the LC.
show controllers fabric fia link-status location <0/1/CPU0>
show controllers fabric fia bridge ddr-status location <0/1/cpu0>
show controllers fabric fia bridge sync-status location 0/1/cpu0
Step 3 Collect configuration information.
show run
Step 4 Dump the PFM errors for the card.
show pfm location <0/1/cpu0>
show pfm location <0/rsp0/cpu0>
Step 5 Collect the fabric I/O/bridge counters on both the RSP and LC.
show interfaces
show controllers np counters all
show controllers fabric fia stats location 0/1/CPU0
show controllers fabric fia bridge stats location 0/1/CPU0
show controllers fabric fia stats location 0/rsp0/CPU0
Step 6 Collect redundancy information.
show redundancy
Where to Go Next
If you have not been able to locate or correct the problem, you might be able to clear it by performing the following steps. However, these steps might delete information that would help you perform additional troubleshooting with Cisco Technical Support. Some of the steps involve stopping or reducing traffic streams, which might not be appropriate on a deployed system. Consult with your network administrator before you perform any of these steps.
Caution Before you follow these next steps, consider contacting Cisco Technical Support. Some of these steps can cause loss of data that would be useful for future analysis and troubleshooting, or could cause loss of traffic.
Step 1 Perform ‘reset –h’ at the LC ROMMON and reboot the LC again to see if this clears the problem.
Step 2 Pull out the LC and reinsert it to see if it can boot up and carry traffic.
Step 3 Pull out the RSP card and reinsert it to see if it can boot up and carry traffic.
Step 4 Stop other streams of traffic to see if this failed stream can go through.
7-171Cisco IOS XR Troubleshooting Guide for the Cisco ASR 9000 Aggregation Services Router
OL-23591-02

Chapter 7 Troubleshooting Router Switch Fabric and Data Path Gathering Fabric Information Before Calling TAC
Step 5 Run online diagnostics to locate errors in the system. For additional information on diagnostics, see the “Using Diagnostic Commands” section on page 1-59.
Gathering Fabric Information Before Calling TACIf you need support from Cisco to troubleshoot the fabric, we recommend that you gather the following information if time permits:
• Output of the following commands (this will display software version, and the line card, fabric card, FPGA, and ASIC versions)
show version show inventory raw show diag show hw-module fpd location
• Information on chassis type
(admin) show inventory
• Platform-related information
show platform
• Ingress interface(s), egress interface(s), and expected packet path
• Drop counters
• Logs (capture all logs on the RSP console port)
7-172Cisco IOS XR Troubleshooting Guide for the Cisco ASR 9000 Aggregation Services Router
OL-23591-02