troy mockenhaupt chi-hang ( alex) lin pejman ( pj )...
TRANSCRIPT
Unified Modeling Language(UML)
Troy Mockenhaupt
Chi-Hang ( Alex) Lin
Pejman ( PJ ) Yedidsion

Overview
Definition History Behavior Diagrams Interaction Diagrams Structural Diagrams Tools Effect on Software Engineering

Definition
A standard language for specifying, visualizing,and constructing software artifacts
Non-restrictive Expressive and visual modeling language Independent of language and process
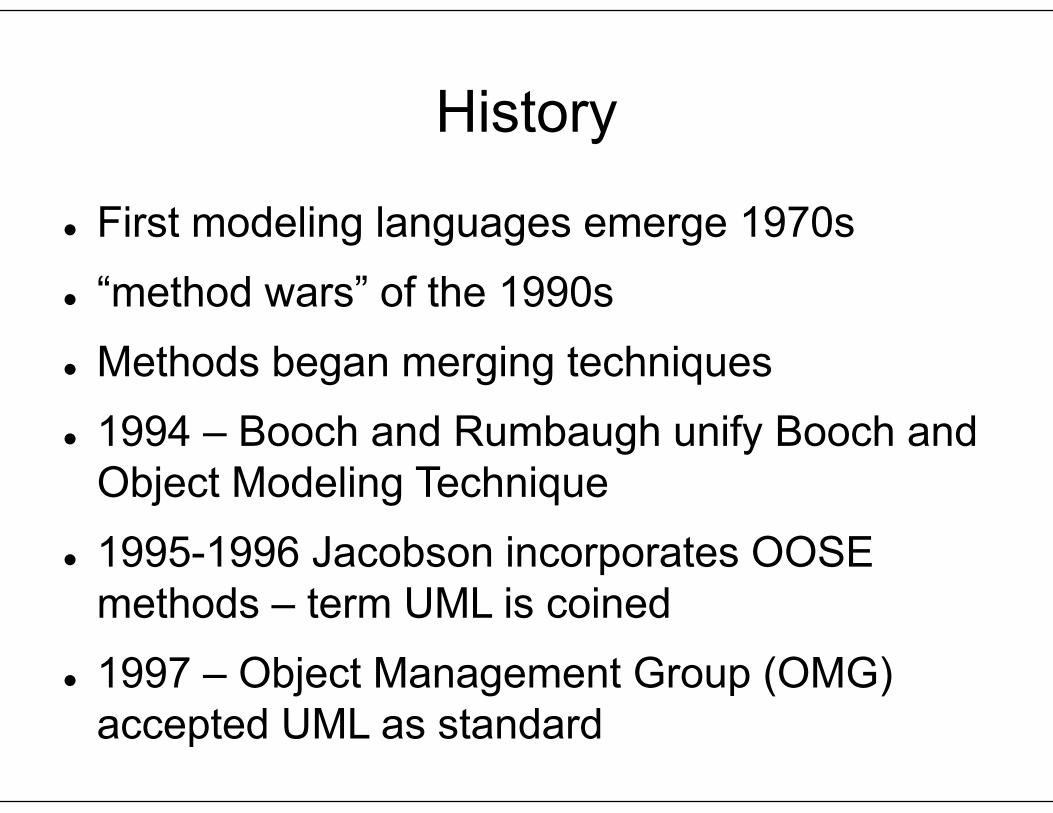
History
First modeling languages emerge 1970s “method wars” of the 1990s Methods began merging techniques 1994 – Booch and Rumbaugh unify Booch and
Object Modeling Technique 1995-1996 Jacobson incorporates OOSE
methods – term UML is coined 1997 – Object Management Group (OMG)
accepted UML as standard
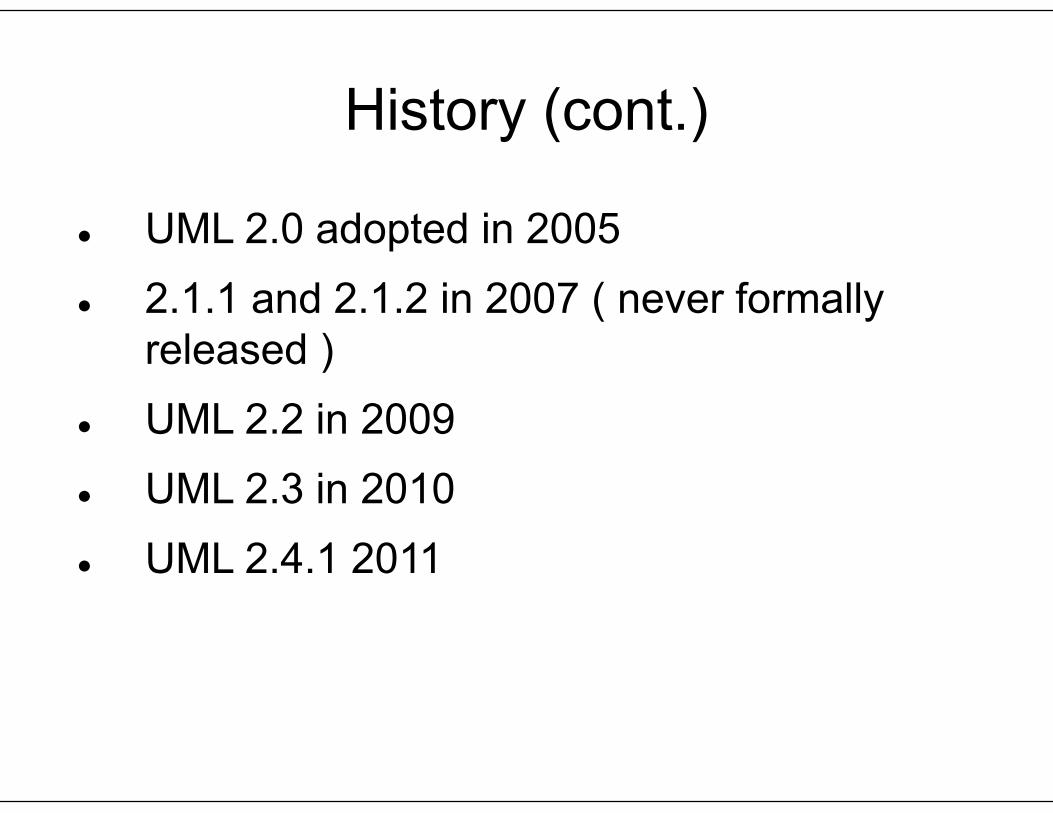
History (cont.)
UML 2.0 adopted in 2005 2.1.1 and 2.1.2 in 2007 ( never formally
released ) UML 2.2 in 2009 UML 2.3 in 2010 UML 2.4.1 2011
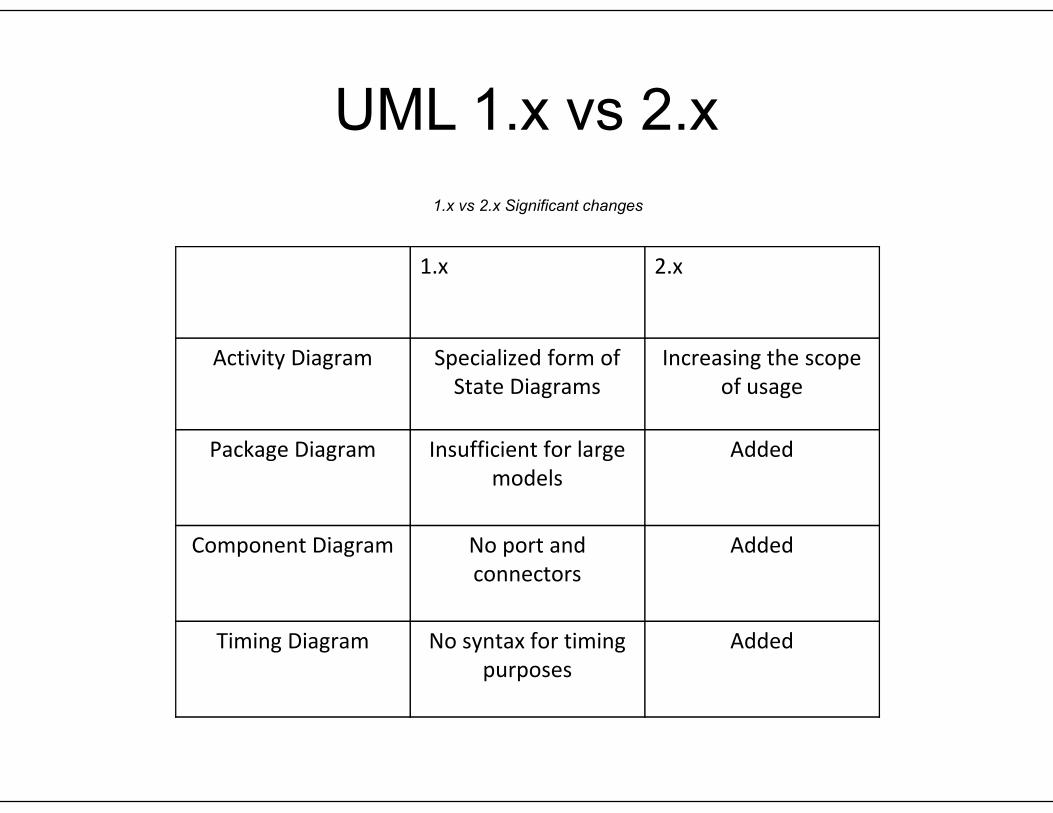
UML 1.x vs 2.x1.x vs 2.x Significant changes
1.x 2.x
Activity Diagram Specialized form ofState Diagrams
Increasing the scopeof usage
Package Diagram Insufficient for largemodels
Added
Component Diagram No port andconnectors
Added
Timing Diagram No syntax for timingpurposes
Added
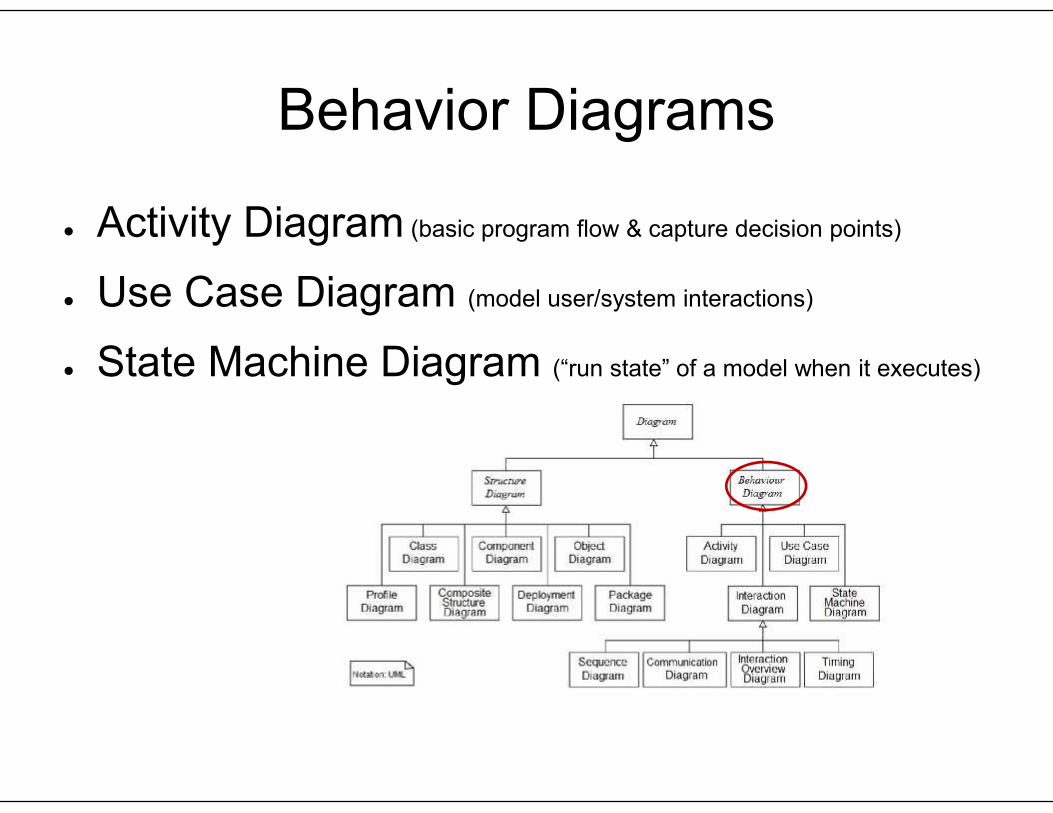
Behavior Diagrams
● Activity Diagram (basic program flow & capture decision points)
● Use Case Diagram (model user/system interactions)
● State Machine Diagram (“run state” of a model when it executes)
Activity Diagram
● Shows the overall flow of control● Comprises: choice, iteration, and concurrency● Business and operational step-by-step
workflows of components in a system● A form of flowchart that has capability to
express concurrency● Graphical representations of workflows of
stepwise activities and actions
Activity Diagram (cont.)
● Similar to state machine diagrams● Business process modeling● Object-oriented equivalent of flow charts and
data flow diagrams from structureddevelopment
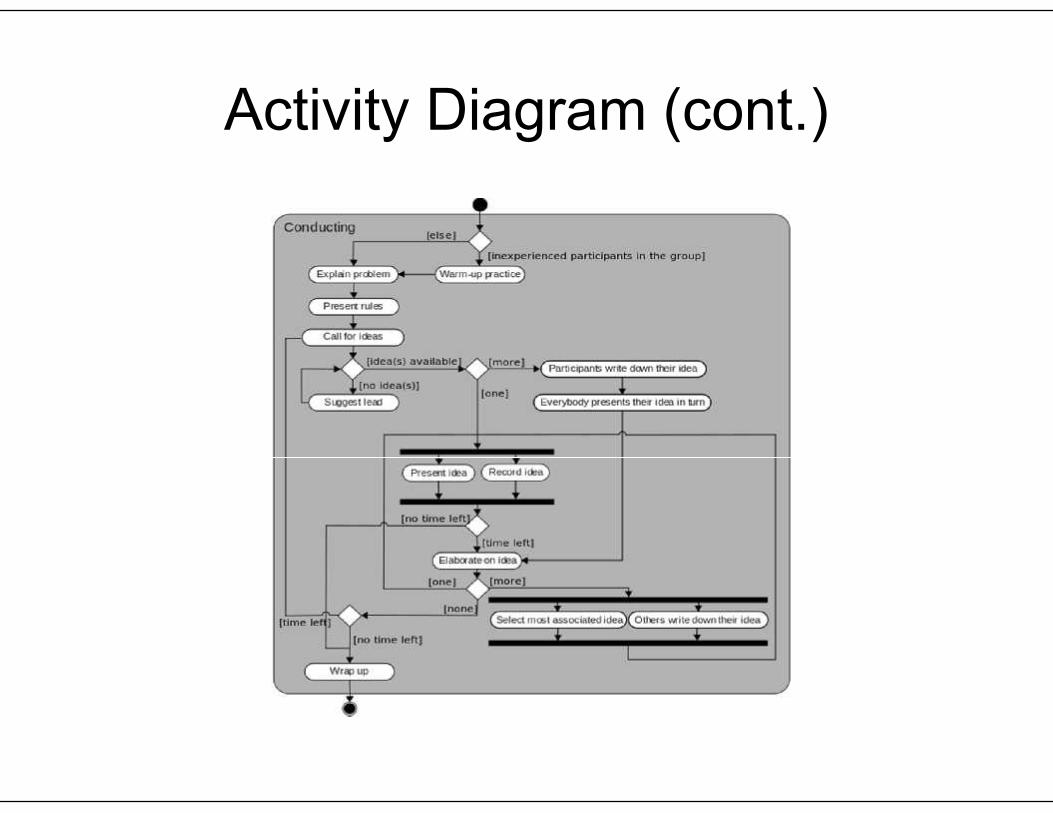
Activity Diagram (cont.)
Use Case Diagram
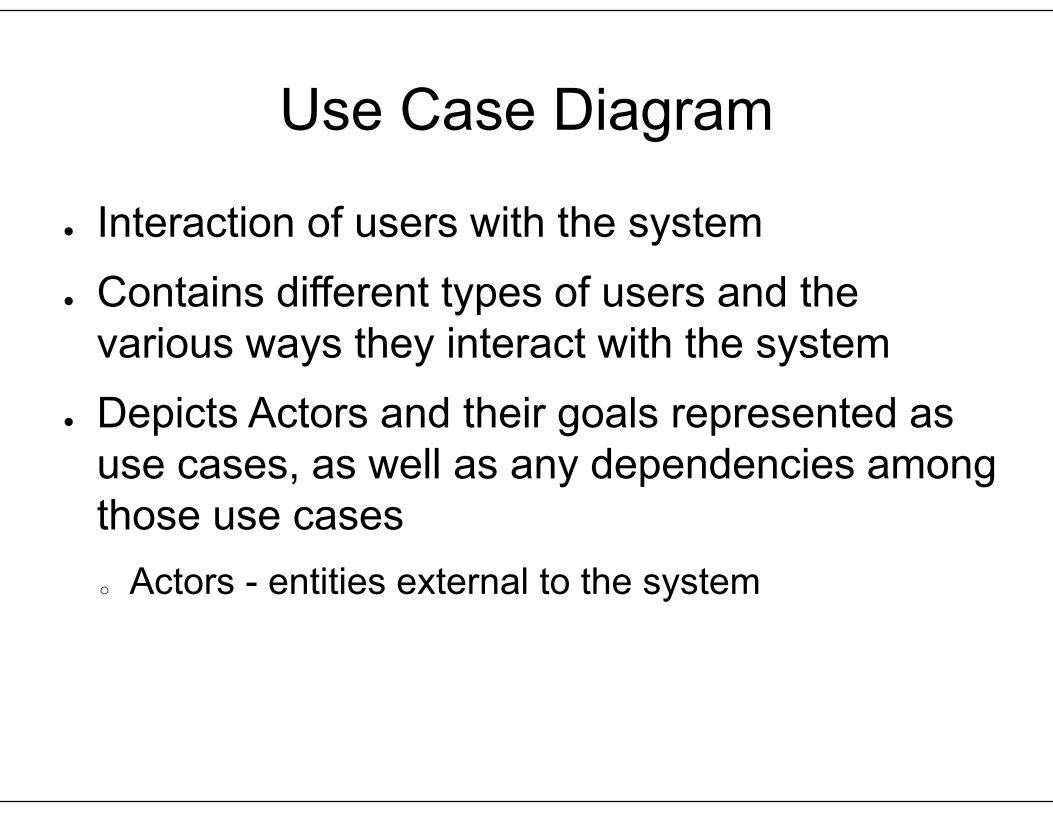
● Interaction of users with the system● Contains different types of users and the
various ways they interact with the system● Depicts Actors and their goals represented as
use cases, as well as any dependencies amongthose use caseso Actors - entities external to the system

Use Case Diagram (cont.)
● A use case typically includes:o Name and Descriptiono Requirements (formal functional requirements)
o Constraints (condition or restriction)
o Scenarios (formal description of the flow of events)
o Scenario diagrams (specific sequence of events between the systemand the external actors)
o Additional information (case specific)

Use Case Diagram (cont.)
● Not a standalone model, but one that can be usedin conjunction with other models
● Outline general behavior, therefore use casediagram should “focus on business goals rather thansystem goals”
● Not a technical outline of functionality, butprovides the business reasoning and outcomes of thesystem

Use Case Diagram (cont.)
State Machine Diagram
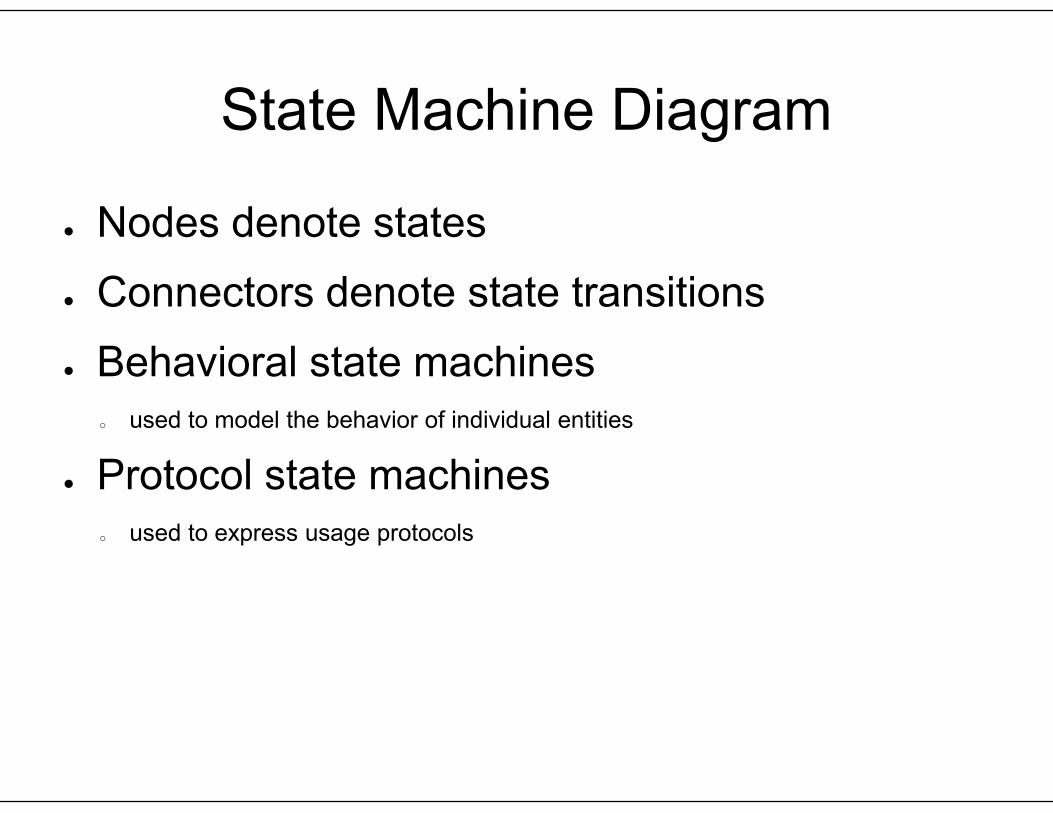
● Nodes denote states● Connectors denote state transitions● Behavioral state machines
o used to model the behavior of individual entities
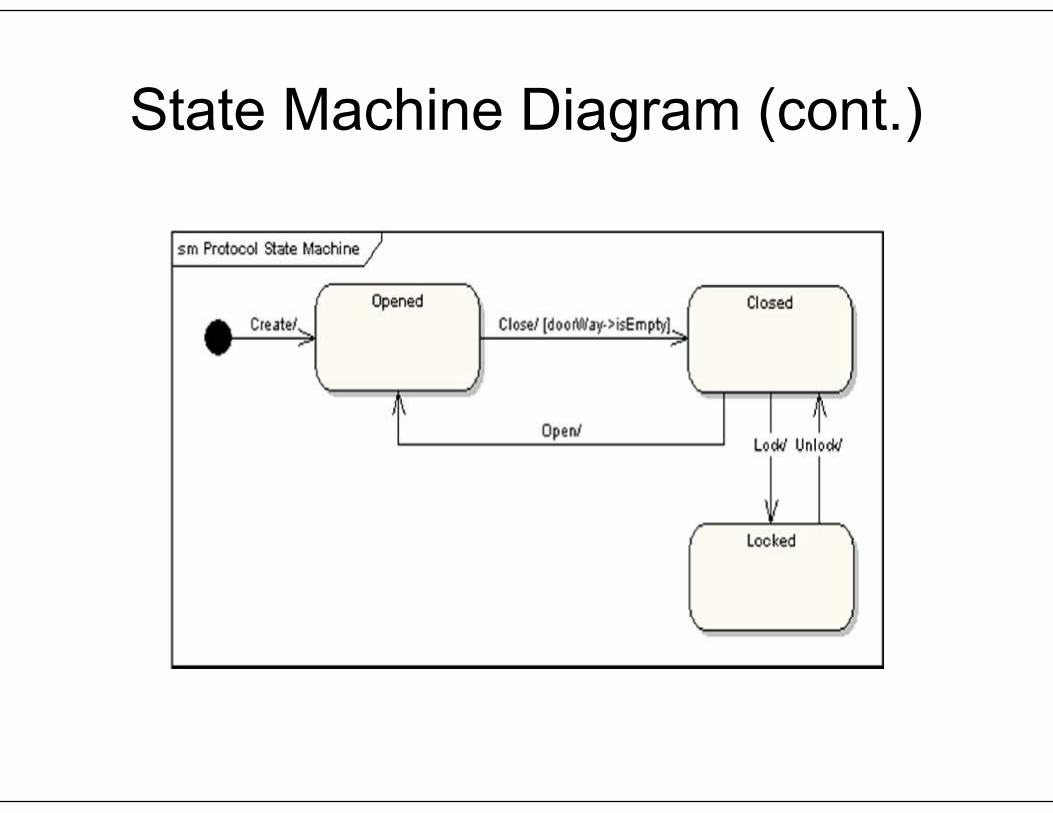
● Protocol state machineso used to express usage protocols

State Machine Diagram (cont.)
● Organize the way a device, computer program,or other (often technical) process works--alwaysin exactly one of a number of possible states
● Overcome some of the limitations of traditionalfinite-state machines
● Support actions that depend on both the stateof the system and the triggering event
State Machine Diagram (cont.)
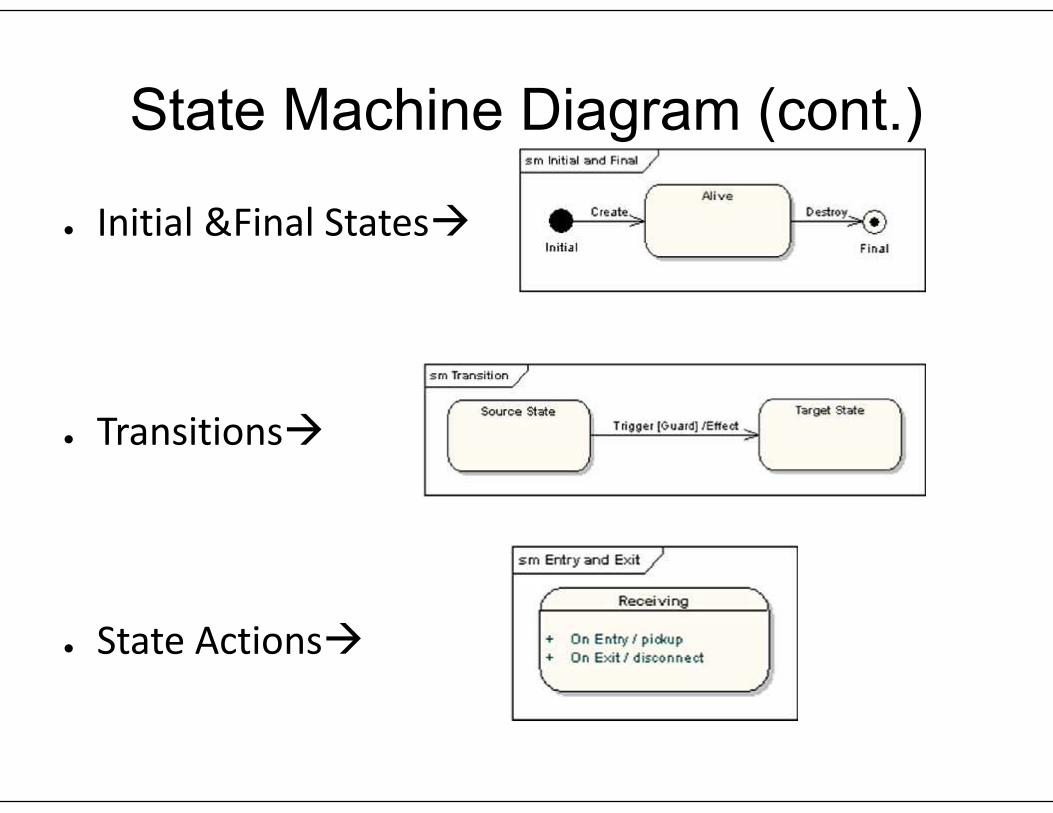
● Initial &Final States
● Transitions
● State Actions
State Machine Diagram (cont.)

Interaction Diagrams
Communication Diagram Interaction Overview Diagram Sequence Diagram Timing Diagram
Communication Diagram
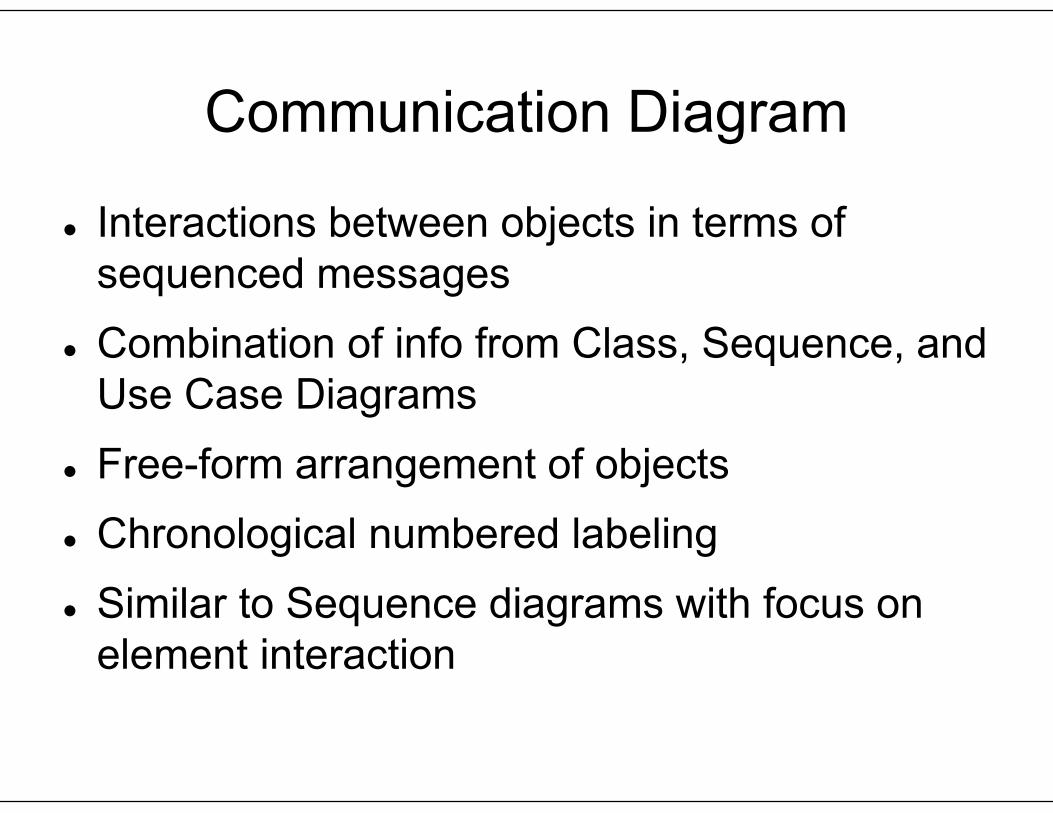
Interactions between objects in terms ofsequenced messages
Combination of info from Class, Sequence, andUse Case Diagrams
Free-form arrangement of objects Chronological numbered labeling Similar to Sequence diagrams with focus on
element interaction

Communication Diagram (cont.)

Interaction Overview Diagram
Visualize control flow with nodes Frames of interaction diagrams Interaction diagrams are building blocks Deconstruct complex scenarios Activity diagram – initial, join, fork, decision,
merge, and final Interaction occurrences and elements

Interaction Overview Diagram(cont.)

Sequence Diagram
Detailed flow for use case realization Two-Dimensional Object instances and interactions Interaction order Sequence of object interactions Object lifelines

Sequence Diagram (cont.)
Timing Diagram
Explore behavior of one or more objects duringa given time period
Similar to sequence diagram with axes reversed Concise and Robust notation
Timing Diagram (cont.)
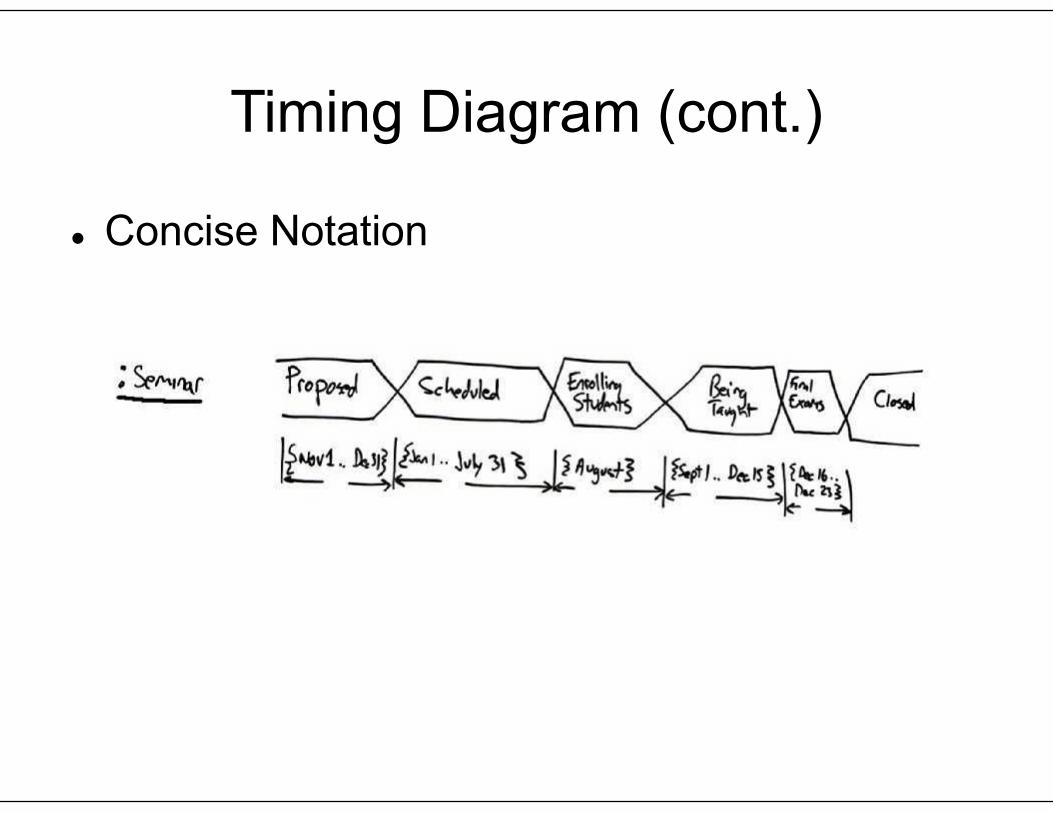
Concise Notation
Timing Diagram (cont.)
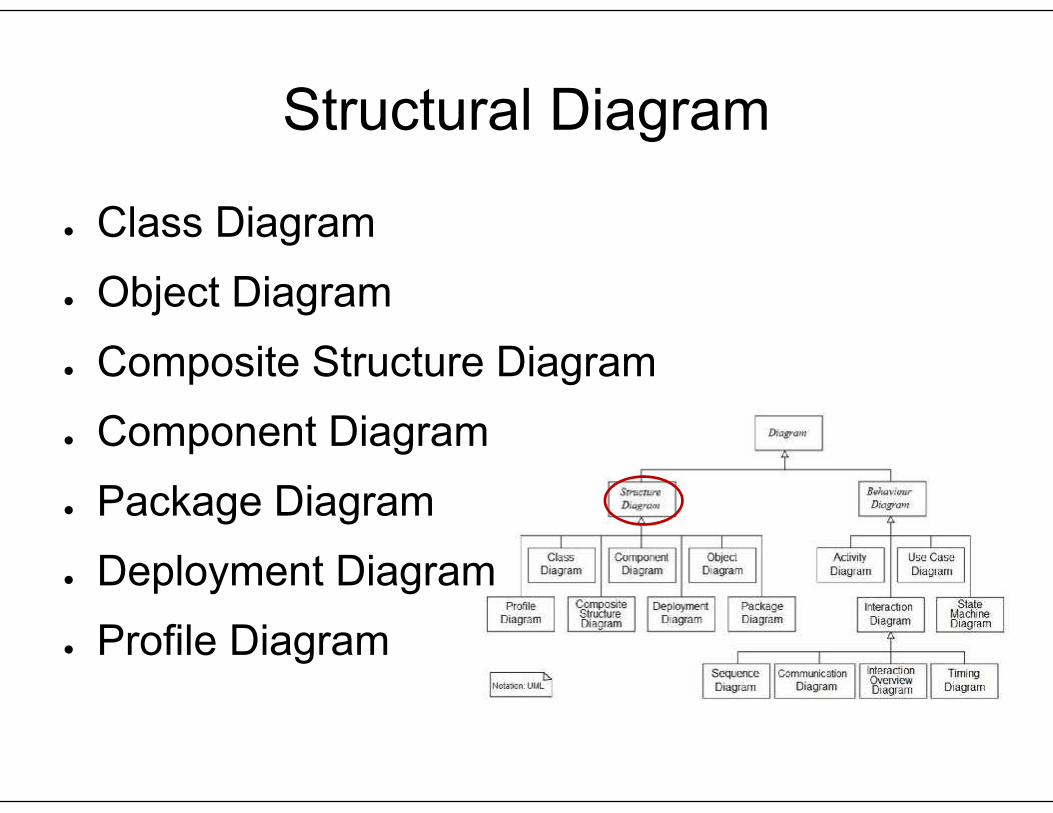
Structural Diagram
● Class Diagram● Object Diagram● Composite Structure Diagram● Component Diagram● Package Diagram● Deployment Diagram● Profile Diagram
Class Diagram
● Define Classes Diagram
● Introduce Class Diagram1. Notations
● Relationships between classes

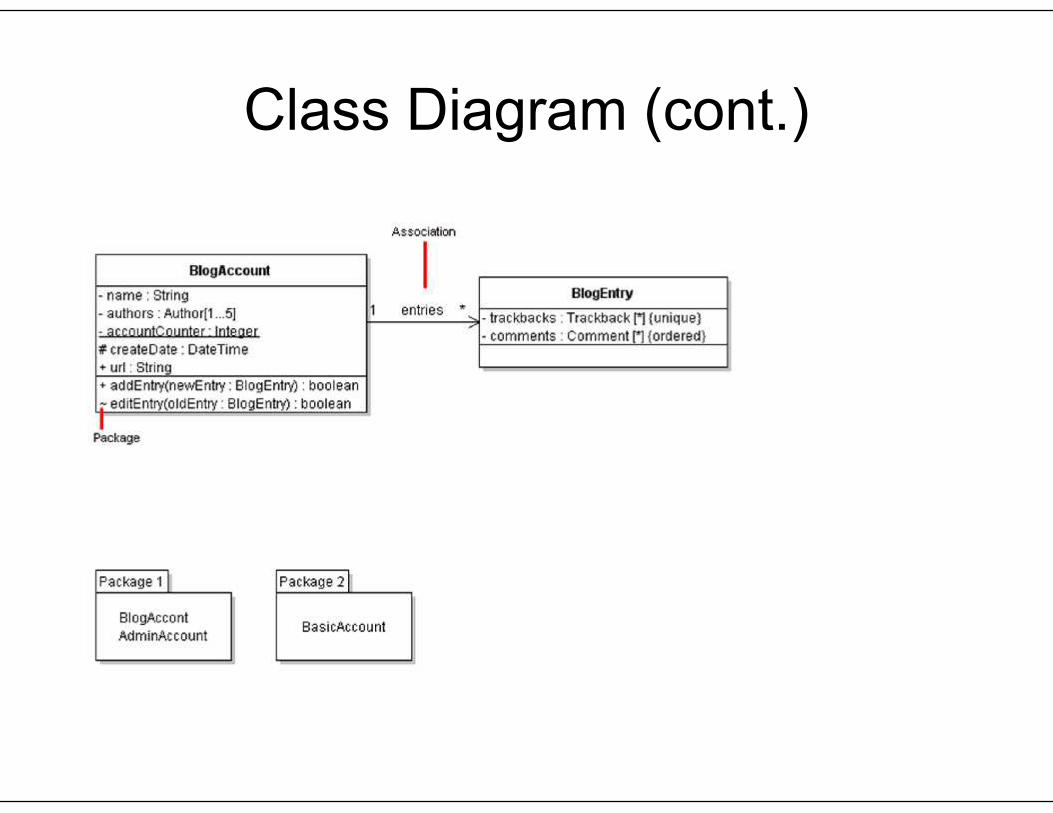
Class Diagram (cont.)
● Class Diagram describes set of classes,interfaces and their relationships
● Class Diagram Notations:1. Class Name2. Properties of the classes with data types3. Method names with data types4. Visibility: +, #, ~, - (in the order of visibility)5. Static members
Class Diagram (cont.)

Class Diagram (cont.)
● Dependency – A class needs to know about another class● Association – A class contains the reference of an object to
another class● Aggregation – A class owns another class● Composition – A class is made of other classes● Inheritance – A class is a type of another class● Constraints –
1. Invariants – must always be true2. Pre conditions – check before execution3. Post conditions – checked after execution
● Abstract Classes – Generic class, leaves implementation forsub classes
● Interfaces – Defines methods which must be implemented

Class Diagram (cont.)Relationships between classes

Class Diagram (cont.)
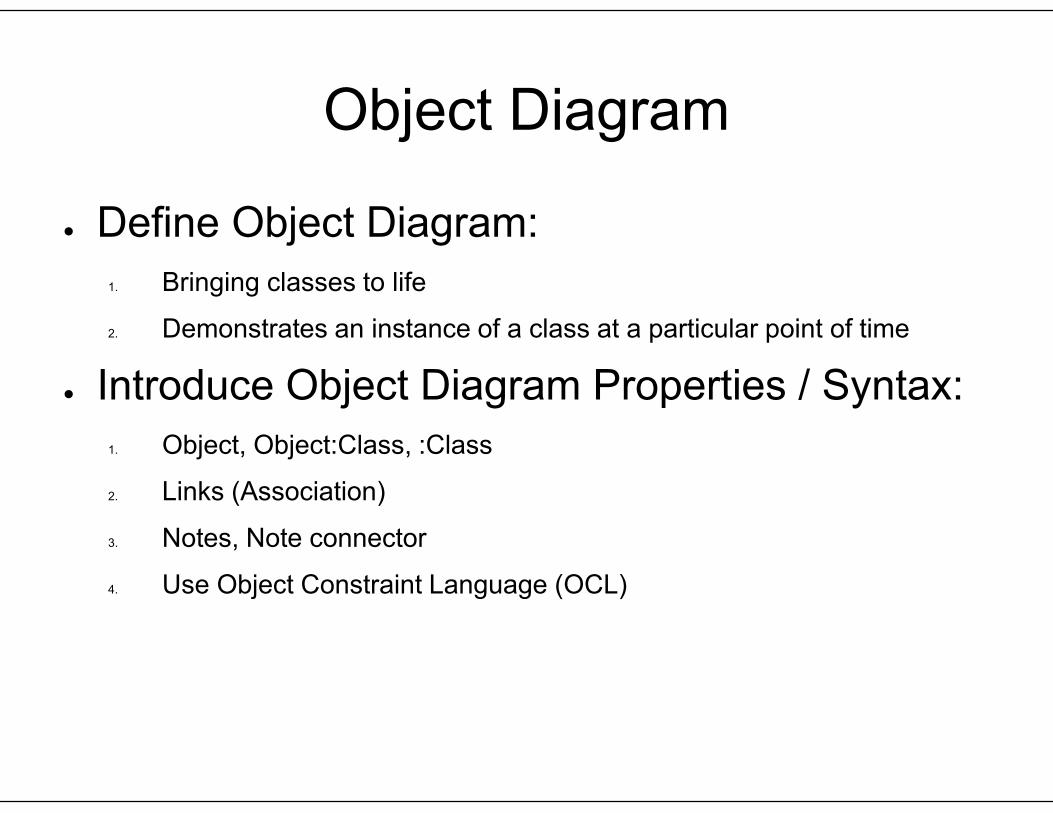
Object Diagram
● Define Object Diagram:1. Bringing classes to life
2. Demonstrates an instance of a class at a particular point of time
● Introduce Object Diagram Properties / Syntax:1. Object, Object:Class, :Class
2. Links (Association)
3. Notes, Note connector
4. Use Object Constraint Language (OCL)

Object Diagram (cont.)

Composite Structure Diagram
● Define Composite Diagram1. How objects create a big picture
2. How objects work together to achieve goals
● Deficiency of Class Diagram● Introduce Composite Diagram● Class Diagram V.S. Composite Diagram

Composite Structure Diagram(cont.)

Composite Structure Diagram(cont.)
Component Diagram
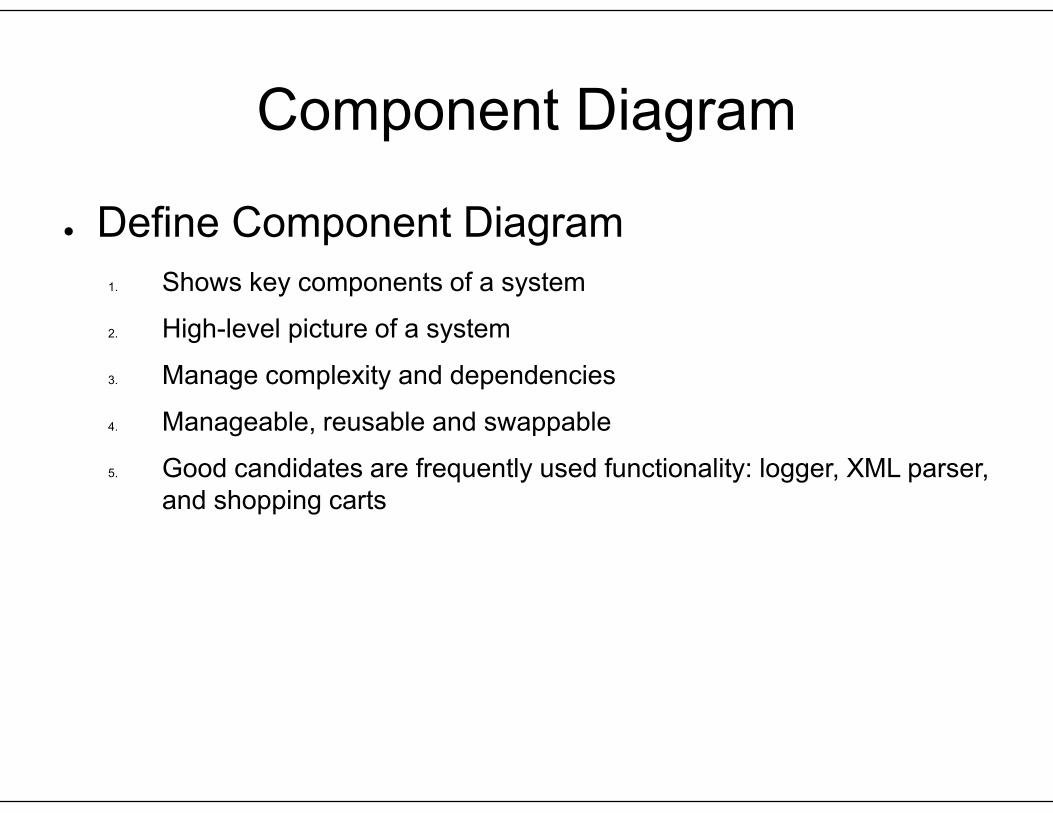
● Define Component Diagram1. Shows key components of a system
2. High-level picture of a system
3. Manage complexity and dependencies
4. Manageable, reusable and swappable
5. Good candidates are frequently used functionality: logger, XML parser,and shopping carts
Component Diagram (cont.)
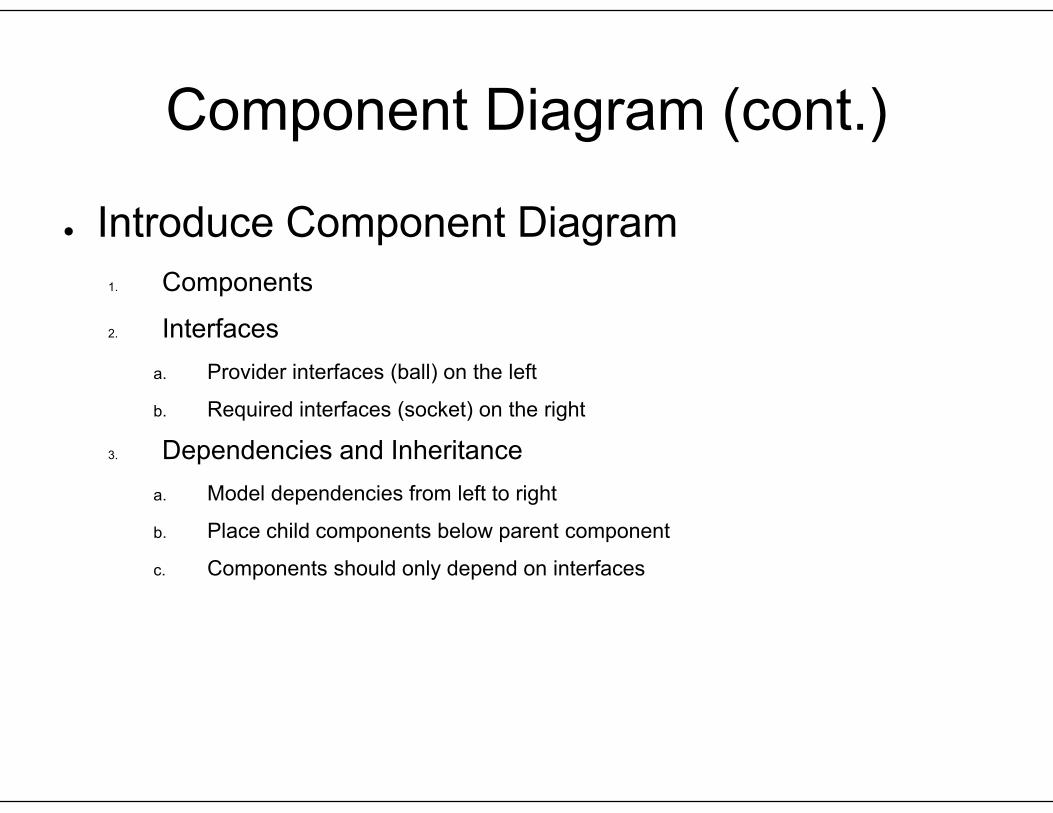
● Introduce Component Diagram1. Components
2. Interfacesa. Provider interfaces (ball) on the left
b. Required interfaces (socket) on the right
3. Dependencies and Inheritancea. Model dependencies from left to right
b. Place child components below parent component
c. Components should only depend on interfaces
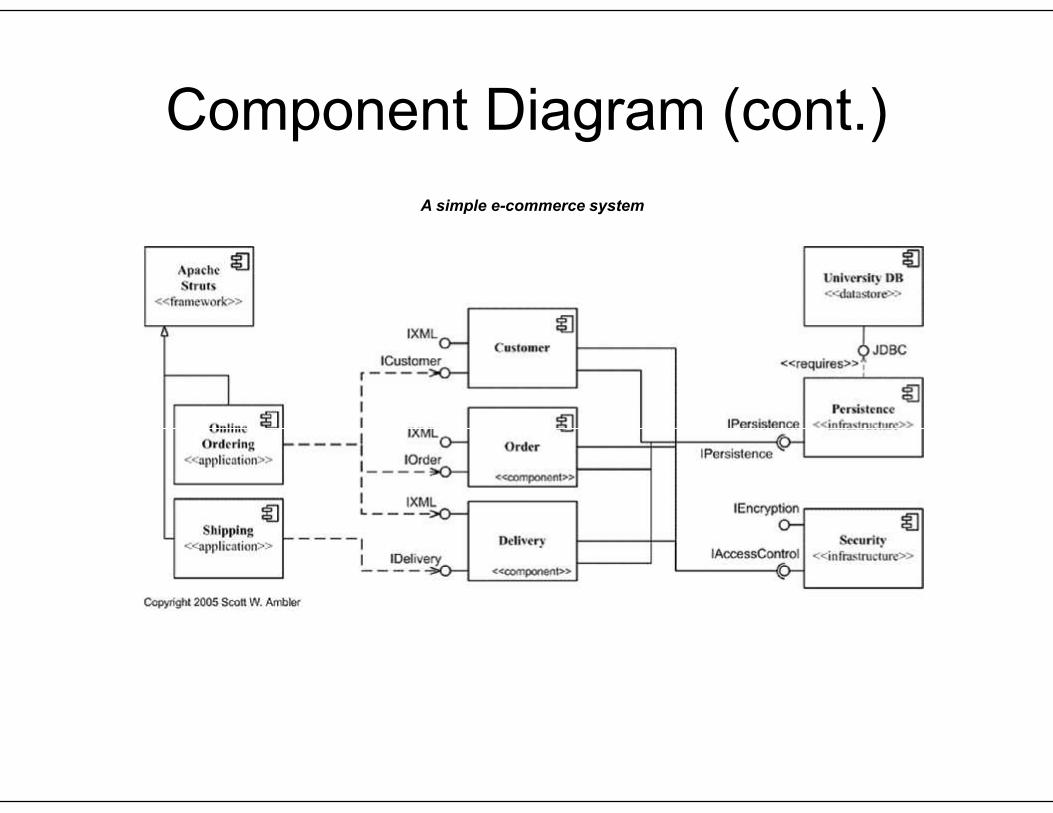
Component Diagram (cont.)A simple e-commerce system

Package Diagram
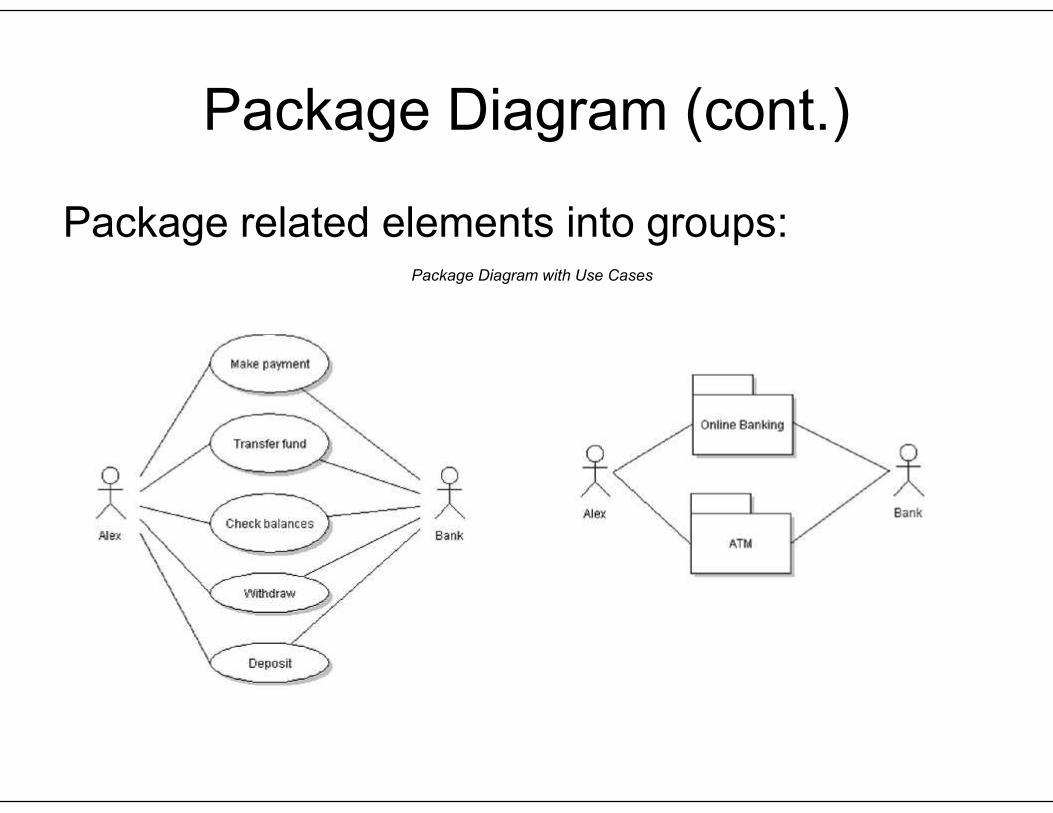
● Define Package Diagram:1. Organize most UML elements2. Manage dependencies among packages3. Package related elements into groups
Package Diagram (cont.)
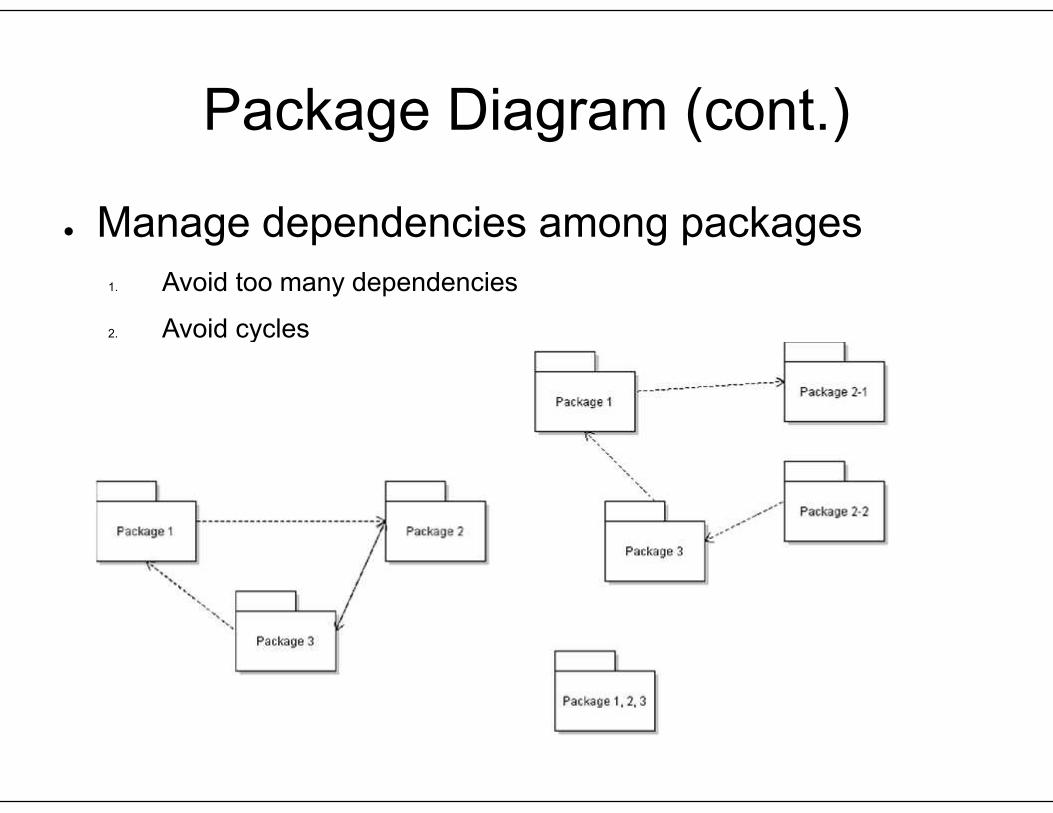
● Manage dependencies among packages1. Avoid too many dependencies
2. Avoid cycles
Package Diagram (cont.)
Package related elements into groups:Package Diagram with Use Cases
Deployment Diagram
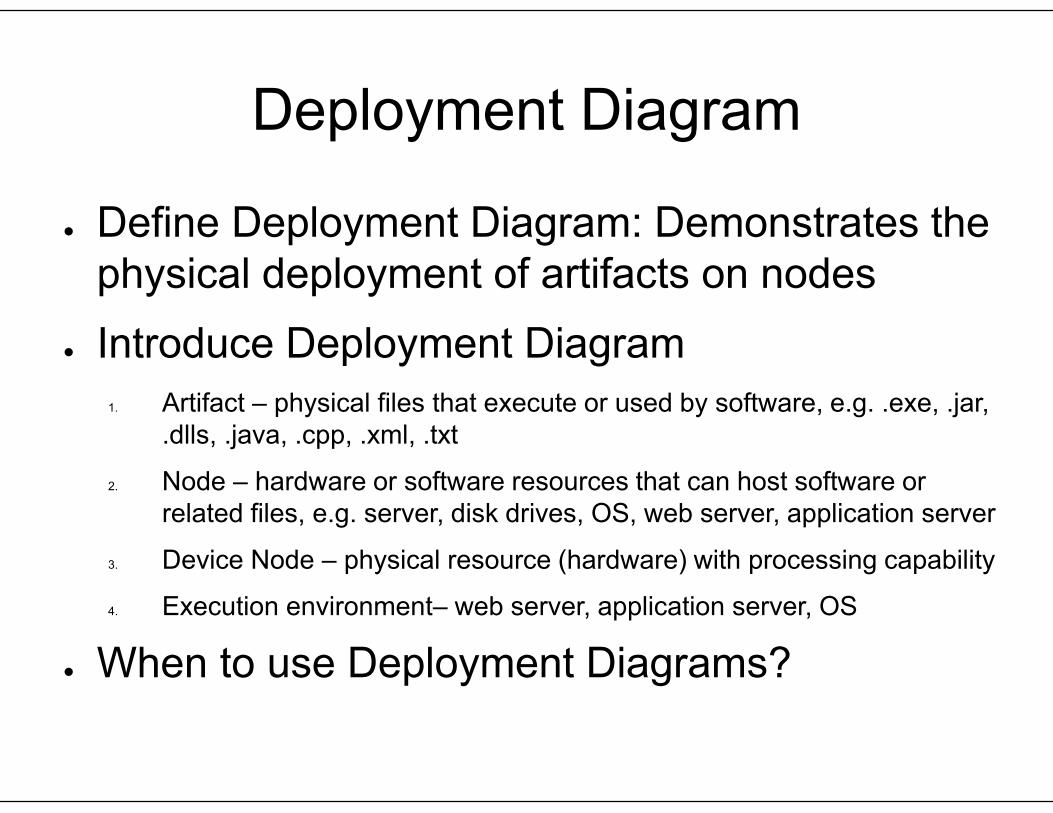
● Define Deployment Diagram: Demonstrates thephysical deployment of artifacts on nodes
● Introduce Deployment Diagram1. Artifact – physical files that execute or used by software, e.g. .exe, .jar,
.dlls, .java, .cpp, .xml, .txt
2. Node – hardware or software resources that can host software orrelated files, e.g. server, disk drives, OS, web server, application server
3. Device Node – physical resource (hardware) with processing capability
4. Execution environment– web server, application server, OS
● When to use Deployment Diagrams?

Deployment Diagram (cont.)Early stage
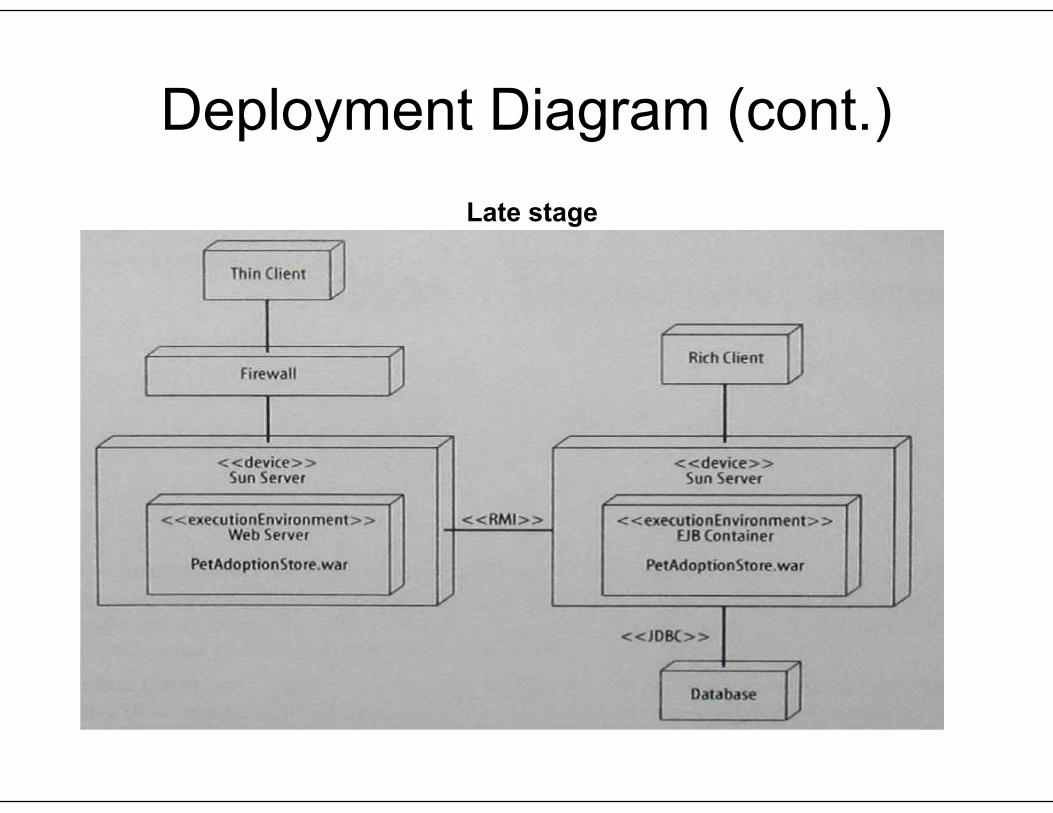
Deployment Diagram (cont.)Late stage
Profile Diagram
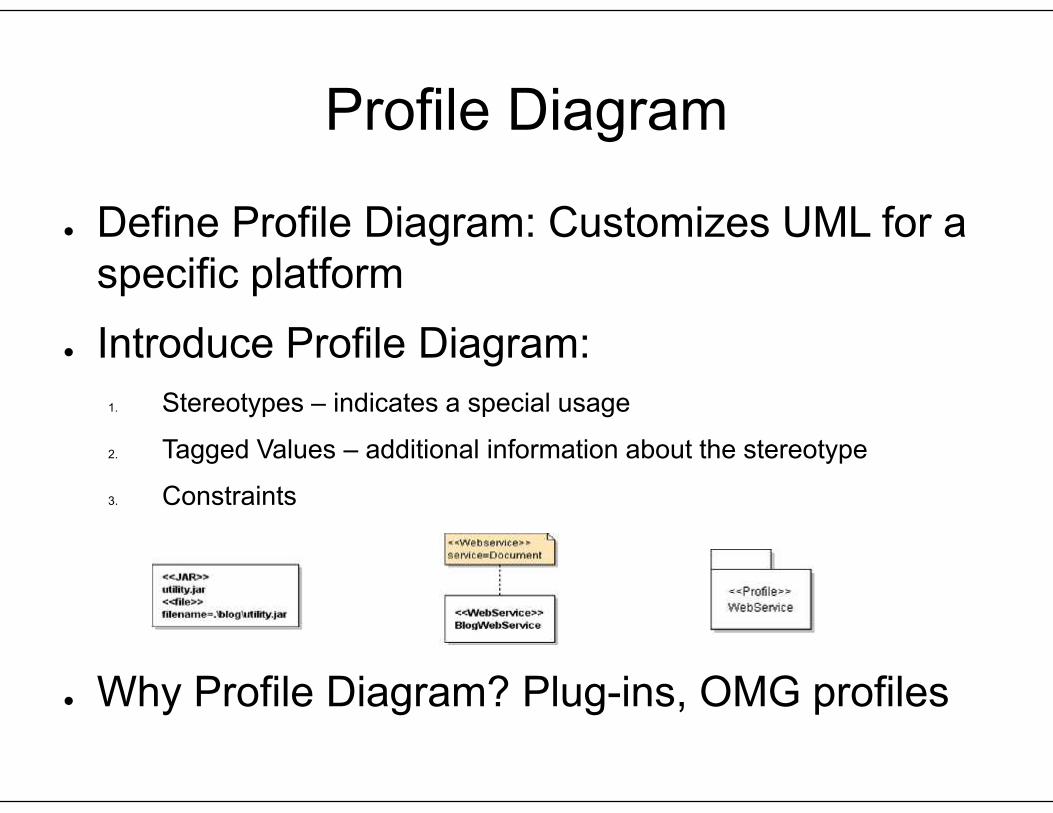
● Define Profile Diagram: Customizes UML for aspecific platform
● Introduce Profile Diagram:1. Stereotypes – indicates a special usage
2. Tagged Values – additional information about the stereotype
3. Constraints
● Why Profile Diagram? Plug-ins, OMG profiles

UML Tools
● Software applications that support some or allof the notations and semantics
● Types of Functionality supported:● Diagramming - creating and editing
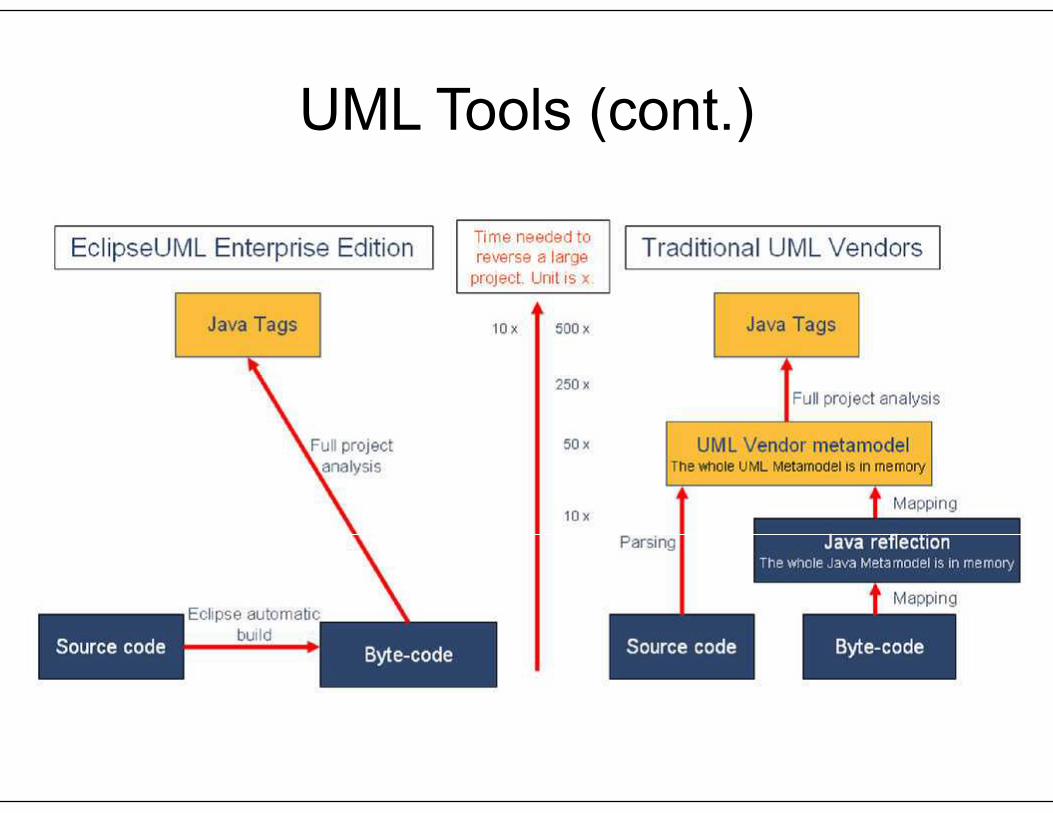
● Round-trip engineering:Code generation- derives from the diagrams part or all of the source
code for the software system
Reverse engineering- reads program source code as input and derivesmodel data and corresponding graphical UML diagrams

UML Tools (cont.)
● Limitations:o UML diagrams lack the detail that is needed to
contain the same information as is covered with theprogram source
o Source code often has more detailed informationthan in design diagrams
● Future use and development of tools

UML Tools (cont.)
● Examples of current UML modeling tools: IBM Rational Rose, ArgoUML, BOUML, Dia, Enterprise
Architect, MagicDraw UML, Modelio, PowerDesigner,Rational Rhapsody, Rational Software Architect, StarUML,and Umbrello
● Examples of development environmentsoffering UML modeling tools: Eclipse (also includes reverse engineering architecture),
NetBeans, and Visual Studio
UML Tools (cont.)

Effect on Software Engineering
Improve communication with allstakeholders
Useful for communicating designs A thinking aid during design phase Independent of programming languages Reduce development and maintenance cost Great tool for training new developers Standardization allows for advancement of
tools and concepts

Effect on Software Engineering(cont.)
Can over complicate development process ifnot used properly
Can get bogged down in notation and details Can over complicate and over lengthen design
documents Relatively significant learning curve to fully
master

Review
Defined UML Provided a History Covered Behavior Diagrams, Interaction
Diagrams, and Structural Diagrams Introduced some UML Tools Discussed the Effect on Software
Engineering

Unified Modeling Language(UML)
THE END