trs 1803 low cost aerial and spatial data
TRANSCRIPT

TRS 1803 March 31, 2018
Low Cost Aerial and Spatial Data Prepared by Pro-West & Associates, Inc.
Introduction MnDOT Office of Transportation System Management (OTSM) desires to reduce the cycle time for collecting ro ad dat a updates from county sources and, opportunistically, capture additional data about road and ancillary uses, e.g. bicycle access. Specifically, this project researched free or low-cost aerial or spatial data from government and other sources to determine if the imagery and spatial data would provide a source of sufficient resolution, accuracy and low cost to maintain MnDOT’s various mapping needs.
Additionally, a process of comparing imagery (satellite or aerial imagery) to identify change detection (as shown in Figure 1 to illustrate how change detection may provide information on road realignment) was requested as a method of approaching the issue of maintaining geospatial road features and associated attributes.
Currently, response for a request for updated road information from Minnesota counties can take six to nine months, and the information may contain errors or deficiencies. The lag in receiving information is compounded by the need to freeze data for reporting processes annually. In the best case, these data issues produce a 1.5 to 2-year lag between official MnDOT data products and local authoritative data. In the worst case, local responses are incomplete and inaccuracies persist over long periods.
MnDOT requests a minimal amount of information from local governments to lessen the extensive labor impact of such requests, and requires a data maintenance source and process that allows accurate, repeatable, automated and timely updates of road data. The agency highly values the ability to automatically extract data from external data sources.
Figure 1. Example change detection characteristic

2
Technical Advisory Panel
Panel Member Role Organization Arturo Botello Geographical Information & Mapping
(GIM) Unit, Research Specialist MnDOT Office of Transportation System Management
Lindsey Danielson GIM Unit – State Bicycle Map MnDOT Office of Transportation System Management Peter Morey Data Systems & Coordination (DSC)
Unit, Section Director MnDOT Office of Transportation System Management
Michael Petesch Bicycle & Pedestrian Unit, Planner MnDOT Office of Transit Jeffrey Saholt GIM, Section Director MnDOT Office of Transportation System Management Adam Smith Photogrammetrics Unit MnDOT Office of Land Management Tim Tabor DSC Unit, Linear Reference System (LRS)
Supervisor MnDOT Office of Transportation System Management
Ben Timerson Transportation Data & Analysis (TDA), Program Manager
MnDOT Office of Transportation System Management
Dan Warzala Research Services, Project Coordinator MnDOT Office of Transportation System Management John Wilm Linear Reference System (LRS) Unit MnDOT Office of Transportation System Management Tina Markeson Roadside Vegetation, Manager MnDOT Office of Environmental Stewardship Brandon Crissinger Data Automation Research Pro-West & Associates, Inc. Lucas Scharenbroich Imagery Research Pro-West & Associates, Inc. Jacqueline Amor Imagery Research Pro-West & Associates, Inc. Annette Theroux Project Management Pro-West & Associates, Inc.
Summary of Project Findings Many types of low-cost aerial and spatial data are available from local and commercial sources that satisfy aspects of MnDOT’s data needs. However, no single source or software platform provides the desired combination of low-cost, frequent updates, high resolution and spectral range necessary to apply out-of-the-box analysis tools that can simply detect the presence of roads, let alone extract surface type and other attribute information.
For annual data collection, the most promising source of data is the geospatial road data developed and maintained by Minnesota counties in support of the NG9-1-1 effort and local emergency response. As mandated by state law, counties provide up-to-date geospatial data to the Minnesota Geospatial Information Office (MnGeo) four times per year1. While no tools currently exist to return the specific road-change report parameterized in this scope, the fact that the authoritative source maintains and periodically updates the NG9-1-1 datasets implies that it would be practical to develop comparison workflows (geospatial features and attributes) using out-of-the-box GIS tools, which could significantly reduce the amount of manual effort currently required.
The remainder of this document catalogs and details the wide range of data, imagery, software and technology evaluated for the project.
1 Minnesota State Statute §403.025, Subdivision 1
1Minnesota State Statute §16E.30 Subd.11 (b)

Data This section details the non-imagery, spatial data sources identified during the research phase of this project, including cost, availability and suitability to support the needs of MnDOT.
Data already being collected The datasets below are being collected actively and are relevant to the project requirements.
NG9-1-1 Road Centerline Data This data is being developed by Minnesota counties and aggregated by MnGeo into a single, state-wide centerline dataset. Counties are mandated by state law2 to provide the data to MnGeo four times per year. The data is the most current, most well-maintained and most accurate source of road data identified in this project.
Costs This data is available from MnGeo at no cost for use by state government agencies.
Technical Specifications No metadata is available, at this time. The acquisition and aggregation process is not defined fully. The data are available to all state agencies.
Standards, which are nearly complete, drive the creation of the “All Roads Network”. The Minnesota Geospatial Advisory Council (GAC), Standards Committee met in November 2017 to approve the Minnesota Address Point Data Standard for NG9-1-1 data as the statewide standard. The standard is expected to be approved by the GAC in March 2018.
MnGeo plans to write an Extract/Transform/Load (ETL) tool to transform the local government data from the NG9-1-1 format to MnDOT’s Linear Referencing System (LRS) standard, and transform state centerline data from the LRS format to the NG9-1-1 standard. The best practice for providing consistent and timely data to MnDOT will be by utilizing a repeatable process facilitated by an ETL tool.
Suitability The consistent, periodic road updates allow tracking new roads early in a process, possibly before construction takes place and any imagery changes are visible. With frequent updates to ensure timely reports of change, while also containing road data supporting the issuance of addresses for new construction, this dataset is extremely applicable to addressing MnDOT’s needs.
OpenStreetMap (OSM) Data Costs The data are available free of charge.
Technical Specifications No metadata is available.
Suitability As the OSM data depends on public contributions to update the underlying dataset, it is most accurate in urban areas. Accuracy in rural areas depends on the engagement of local OSM volunteers and no objective measure of completeness exists. If there were a reference dataset to compare to, MnDOT should simply use the reference data directly.
OSM does have the advantage of being able to integrate into the most software packages for tool development and analysis.
2 Minnesota State Statute §16E.30 Subd.11 (b)

4
NavMart NavMart is a reseller of HERE Map Data.
Costs $4,000
Technical Specifications Layers include major highways, major highway shields, secondary highways, secondary highway shields, railroads, zones, administrative area boundaries, oceans, islands, waterway polygons & segments, land use features, and streets.
Suitability Unless MnDOT executes a custom engagement, the data are only available in Esri Shapefile format. There is no declaration on how often the data are updated and no information on the ability to retrieve historical datasets.
Tele Mart Acquired by TomTom in 2007, Tele Mart is a vendor of the Tele Atlas dataset.
Costs Contact Tele Mart for quote.
Technical Specifications Data contains coverage of the U.S., Canada, Mexico and Europe and is purchased at the state and county level. Data are updated quarterly.
http://www.tele-mart.com/documents/MultiNetInfoSheettm.pdf
Suitability The Tele Atlas data is no longer a premier source of data for large sites due to agreements to provide data to Google expired in 2009 and loss of MapQuest in 2009.
Data currently extracted from Imagery No automatically derived road datasets, derived from imagery, were identified for the State of Minnesota. Pilot projects exist in other states and counties using satellite data for automated road detection. Notably, Digital Globe Corporation is performing the process on a commercial scale in Australia using data from the WorldView-3 satellite and generating updated rooftop and swimming pool extraction on an ongoing update basis. Following automation model training, the process can take hours for the extraction to complete. More details of this technique can be found here: (http://gbdxstories.digitalglobe.com/swimming-pools/ ) .

Imagery Imagery is a ubiquitous data product, but the specific characteristics of the various image acquisitions satellites and techniques can vary considerably. All the datasets found during this project’s research are satellite data products. No low-altitude (airplane or drone) imagery appears to be available generally, except for scheduled flights performed by Eagle View, but those flights typically occur on a multi-year schedule. In addition, imagery research identified no commercial sources of LIDAR data. Free The following satellite imagery data sources that provide data free of charge were identified.
USGS Earth Explorer The USGS Earth Explorer is an interactive web viewer that provides a single point of access to numerous satellite image data sets.
Costs Free
Technical Specifications See the section of the technical specification of the individual satellite instruments and their suitability to the project in Appendix A.
Suitability As this is not a primary source of data, it is not directly applicable to this project.
Google Earth Pro Google Earth Pro is a software product from Google, Inc. that provides access to the imagery used by Google in its popular Google Maps product.
Costs Free
Technical Specifications Compiles multiple aerial imagery sources (30-meter resolution to <15-meter resolution) and uses the best available source for the area you are viewing.
Suitability The Google Earth Imagery is not suitable as a primary data source as it is a composite image that produces “cloud-free” images useful as a general backdrop for mapping applications. Google utilizes Landsat-7 and Landsat-8 instruments, which have a maximum resolution of 15 meters; insufficient to resolve roads with high accuracy.
NOAA Data Access Viewer NOAA Data Access Viewer is a web-based viewer utilizing a shopping cart model to view various NOAA datasets.
Costs Free
Technical Specifications Only available around coastlines.

6
Suitability NOAA data sources are unsuitable due to a lack of annual updates and low spatial and spectral resolution of the data products, which preclude applying automated road extraction methods to the imagery. The primary data sets target land cover changes on a decadal time scale.
JAXA’s Global
Costs Free
Technical Specifications ALOS World 3D (30 meter)
Suitability JAXA’s Global is unsuitable due to lack of high resolution needed for analysis.
ESA Earth Observer Catalog Costs Free
Technical Specifications Capability to download imagery such as Envisat, ERS, Landsat, IKONOS, DMC, ALOS, SPOT, Kompsat, Proba, IRS, SCISAT. The data ranges from 3-meter to 30-meter resolution. See the technical specification section for individual satellite instruments and their suitability to the project in Appendix A.
Paid
Suitability As this is not a primary source of data, it is not directly applicable to this project.
The following satellite image data source were identified that provide their data for a fee. Various limitations and restrictions for each data source are detailed.
Digital Globe Costs $7,500
The cost includes an annual update for a web streaming service. MnDOT would not be able to conduct analysis utilizing data from a web streaming service. If interested, MnDOT could inquire further regarding downloadable data.
$500,000 (per year) Includes downloadable, analyzable data for the state of Minnesota.
Technical Specifications The web streaming service provides WorldView-1, -2, and -3 (0.31-meter), GeoEye-1 (0.46-meter satellite imagery. Annual updates for Minnesota are possible but not guaranteed.
Suitability Based on the publicly available technical specifications this data is not suitable due to the update ability of the imagery. In order to acquire data, the data is purchased through DigitalGlobe or Satellite Imagery Corporation (SIC). Contacts provided, if requested.

Satellite Imagery Corporation (SIC) Costs $6,800
The cost includes an annual update for a web streaming service. MnDOT would not be able to conduct analysis utilizing data from a web streaming service. If interested, MnDOT could inquire further regarding downloadable data.
Technical Specifications The web streaming service provides WorldView-1, -2, and -3 (0.31-meter), GeoEye-1 (0.46-meter) satellite imagery. Annual updates for Minnesota are possible but not guaranteed.
Suitability Based on the publicly available technical specifications this data is not suitable due to the update ability of the imagery. The data is purchased through DigitalGlobe or SIC. Pro-West will provide contacts from both companies upon request.
Planet Labs Costs Detailed cost information from Planet Labs was unavailable without a signed Non-Disclosure Agreement. Pro-West received a ballpark estimate over $500,000.
Technical Specifications SkySat1 & 2 (0.9-meter)
Suitability Based on the publicly available technical specifications this data is not suitable due to lack of guarantee for annual update of imagery.
NearMap
Costs Cost to purchase a statewide imagery product is approximately $100,000. Smaller defined areas can be purchased for $5,000 per GB.
Technical Specifications Three-inch resolution for the NearMap PhotoMaps™ orthophoto product are only available around the Minneapolis metropolitan area, Duluth and Moorhead; all other locations for satellite imagery within the State are at lower resolution.
Suitability Based on the publicly available technical specifications this data is not suitable because it is only available within three areas of Minnesota at a suitable high resolution.
Airbus Defence & Space
Costs Detailed cost information from Airbus Defence & Space is unavailable. Airbus Defence & Space will provide a detailed quote upon receipt of imagery specifics.
Technical specifications 1.5 -meter multispectral resolution (uses SPOT and Pleiades satellites).

12
Suitability Based on the publicly available technical specifications this data is not suitable due to lack of guarantee for annual update of imagery. Airbus, Defence & Space is not a low-cost solution.
Polar Geospatial Center (PGC) – University of Minnesota Costs The PGC acquires data on an ongoing basis that may be useful as a source of imagery for digitizing new roads, or creating an automated change detection process, however, the PGC imagery is limited to organizations connected to federal projects, and cannot be used in any manner that would compete with commercial imagery sources.
Suitability Based on the restrictions for federal projects and non-compete agreements with commercial imagery sources, this imagery is not suitable.
SatShot.com Costs The cost of acquiring imagery through SatShot is similar to other imagery sources. Currently, the business is using imagery for agriculture related projects by acquiring imagery for the agriculture areas of the state (Red River Valley and South of I-94). MnDOT would need to supplement the currently available imagery to cover the entire state. An estimate of $1-2 million would be required to acquire satellite imagery at one-meter resolution for the entire state.
Technical Specifications SPOT 6 and 7 satellite imagery. Urban areas would require the .5-meter resolution imagery product, and rural areas would require a one-meter resolution imagery product. 3-8 satellite imagery shots are acquired within the agricultural region from April through September.
Suitability Lanny Faleide, owner of SatShot, could develop a $200,000 more economic model for purchasing satellite imagery for change detection. The proposed solution would not provide automatic change detection, which requires higher resolution imagery, but instead utilizes a manual vector trace process for MnDOT change detection needs. The cost of the manual vector trace solution requires discussion with MnDOT to determine requirements.
The automated changed detection solution proposed by Lanny would be like those discovered during the literature research for general suitability below. An automated process requires set up, testing, quality control, and an auto-trace process by SatShot.
General Suitability To perform effective feature extraction and automated comparison over multiple years, a literature review of research and methods was conducted. Listed below are the literature review summary results related to MnDOT‘s data priority needs reported during the project kick-off meeting.
• Mapping performed on at least an annual basis • Automate from aerial photos and change detection • Compare current data to a new data source to extract data changes • Process that creates a redline to incorporate into existing data for the entire state • Spatial accuracy better than 40 feet +-
Based on the literature reviewed, Pro-West found no work that addresses all MnDOT’s data priority needs. The literature review is detailed by application domain and a review of the strengths and weaknesses of the authors’ approaches as related to the MnDOT needs.
Impervious Surfaces
Pro-West reviewed several works on impervious surfaces (Deng 2012, Li 2016, Sherba 2014, Karila 2017) to establish a baseline for the feasibility of extracting road information from satellite imagery, specifically, the review examined the ability to detect pavement vs non-pavement and considered the feasibility of multi-surface classification (dirt, gravel, concrete, etc.).
Based on our review, impervious surface detection is difficult due to either insufficient spatial resolution of the source imagery, which makes accurate road detection infeasible in urban environments, or occluding phenomena, such as building shadows or cloud cover (Yeng 2016). Cloud cover is especially problematic for MnDOT, since obtaining a cloud-free image mosaic could require many image acquisition passes. It is common for cloud cover to persist for several days at a time over greater Minnesota.
In addition to the general image acquisition characteristics, it has been shown (Deng 2012, Akay 2016) that separating bodies of water from impervious surfaces is difficult since they have similar spectral characteristics as low-albedo impervious surfaces. The use of Normalized Difference Water Index (NDWI) can be an effective means of masking out surface water, but requires the satellite data to contain Near-Infrared (NIR) and Short-Wave Infrared (SWIR) channels thus rendering this technique unsuitable for some imagery, specifically high-resolution monochromatic channels from satellites, low-spectral imagery (Momeni 2016), and regular Red/Green/Blue (RGB) imagery from low-altitude aircraft or drones.
Even with appropriate image sources, impervious surface detection techniques discussed in literature require significant human-directed pre-processing and fine-tuning of the general technical approach. This heavily discounts the possibility of adapting such methods in a fully automated process.
Land Cover Change Land cover and change detection techniques (Akay 2016, Li 2016) were found to be lacking in key MnDOT data priorities as well. A primary weakness was a focus on either urban change or rural change, but no research of the applicability of change detection over all land use types (Akay 2016, Li 2016, Momeni 2016, Yang 2016). The urban focus is especially acute when discussing surface classification. Since an urban environment is a heterogeneous mixture of surface types at the typical satellite resolution, much effort is required to separate mixtures of surface types prior to performing any classification (Momeni 2016, Yang 2016). MnDOT’s needs do not include detailed surface classification and, as such, the general methods discussed by the literature are not directly applicable. Nearly all the literature reviewed, used either a decision tree classifier or clustering method to produce a single surface classification per image pixel and further analysis was then performed on the segmented images, even when a pixel-based approach is suboptimal when used in conjunction with Very High Resolution (VHR) imagery

12
(Momeni 2016).
This issue of specialized rural vs urban methodologies extends to the specific research of road detection where the authors assume the use of satellite data for road detection only for remote, rural areas. Research in this area also showed the same issues with data acquisition schedules (Akay 2016, Li 2016) and use of data from old or decommissioned satellites (Akay 2016; SPOT 5).
In some cases, the goal of the research was not to directly estimate change detection on a localized basis, but only to validate the statistical land use characteristics over large areas against ground-truth land use maps (Akay 2016, Momeni 2016). Such research did not yield appropriate methodologies to meet MnDOT’s needs.
One technique discussed with partial applicability to MnDOT, is the use of auxiliary data to guide the classification and segmentation of images (Akay 2016). This technique is feasible using the Minnesota county NG9-1-1 road data to extract more accurate spectral profiles of the road corridors from the satellite imagery. However, since the NG9-1-1 data already contains attribute data of interest to MnDOT and would be acting as the primary source of data for MnDOT’s needs, this approach is likely to be useful only for future data extraction and estimation projects.
LiDAR Approaches The works of Sherba (2014) and Karila (2017) provide an alternative approach to road detection that utilizes LiDAR data rather than imagery. This application is quite specialized, as they attempt to detect abandoned logging roads (deeply rural data) with heavy canopy cover. While this is not an analogous situation for most roads in rural or urban settings, it does have some applicability to detecting minimum maintenance roads or older city and county roads with encroaching canopy cover to create better estimates of road width.
Like aerial imagery, LiDAR-based road detection suffers from false positives where water surfaces and water features, such as streams, were incorrectly classified as roads. However, since LiDAR only presents ranging data, the use of techniques like NDWI are not applicable unless MnDOT utilizes a data fusion approach by combining LiDAR data with aerial imagery. Lighting changes and shadows present analysis challenges, as well.
Even with extensive hand-tuning of the segmentation and path-growing techniques used, the LiDAR- derived roads network only achieves approximately 86% accuracy (Sherba 2014). Sherba (2014) dealt with a challenging environment due to very sparse detections points of the roads and a high false-positive detections rate. However, other image segmentation and classification techniques achieved better, but not completely accurate, detection rates (Yang 2016) than on well-imaged roads, not obscured completely by canopy cover. The most recent progress in this area by Karila (2017), utilized a multispectral laser ranging system. This technology has the potential to combine the spectral advantages of satellite imaging with the resolution and depth detection of LiDAR, albeit over a much smaller area of interest. In fact, the limited field of cover for LiDAR makes this infeasible as an annual data gathering process for an area as large as Minnesota.
The two-class results (Road vs Other) achieved an accuracy of greater than 94% and some success was made in the detection of single lane vs two lane roads (approximately 85%). These modest overall accuracy scores, even for such high resolution (eight samples per square meter) data demonstrates the overall difficulty of the road classification problem and strongly implies analysis methods based on satellite imagery would only be able to achieve comparable performance.

Satellite Sources
ASTER Specifications The satellite imagery is 15-meter multispectral resolution. The satellite was launched in 1999.
Suitability The resolution quality is not suitable for change detection analysis.
CARTOSAT Specifications The satellite imagery is two-meter Panchromatic resolution only. The satellite was launched in 2005.
Suitability The resolution quality is not suitable for change detection analysis.
CBERS-2 Specifications The satellite imagery is two-meter multispectral resolution only panchromatic. The satellite was launched in 2005.
Suitability The satellite only receives panchromatic band data, and is not suitable for change detection analysis.
Dove Specifications The satellite imagery is 3-meter multispectral resolution with a 1- to3-year orbital life. The satellite is part of an 88-fleet of nanosatellites, launched most recently in February 2017.
Suitability The resolution quality is not suitable for change detection analysis.
FORMOSAT-2 Specifications The satellite imagery is eight-meter multispectral resolution.
Suitability The satellite was decommissioned in 2004.
Gaofen-2 Specifications The satellite imagery is 3.2-meter multispectral resolution. The satellite was launched in 2014.
Suitability The resolution quality is not suitable for change detection analysis.
GeoEeye-1 Specifications The satellite imagery is 1.84-meter multispectral resolution. The satellite, launched in 2008, has an orbital life that will end in 2023.
Suitability The resolution quality is not suitable for change detection analysis.
12
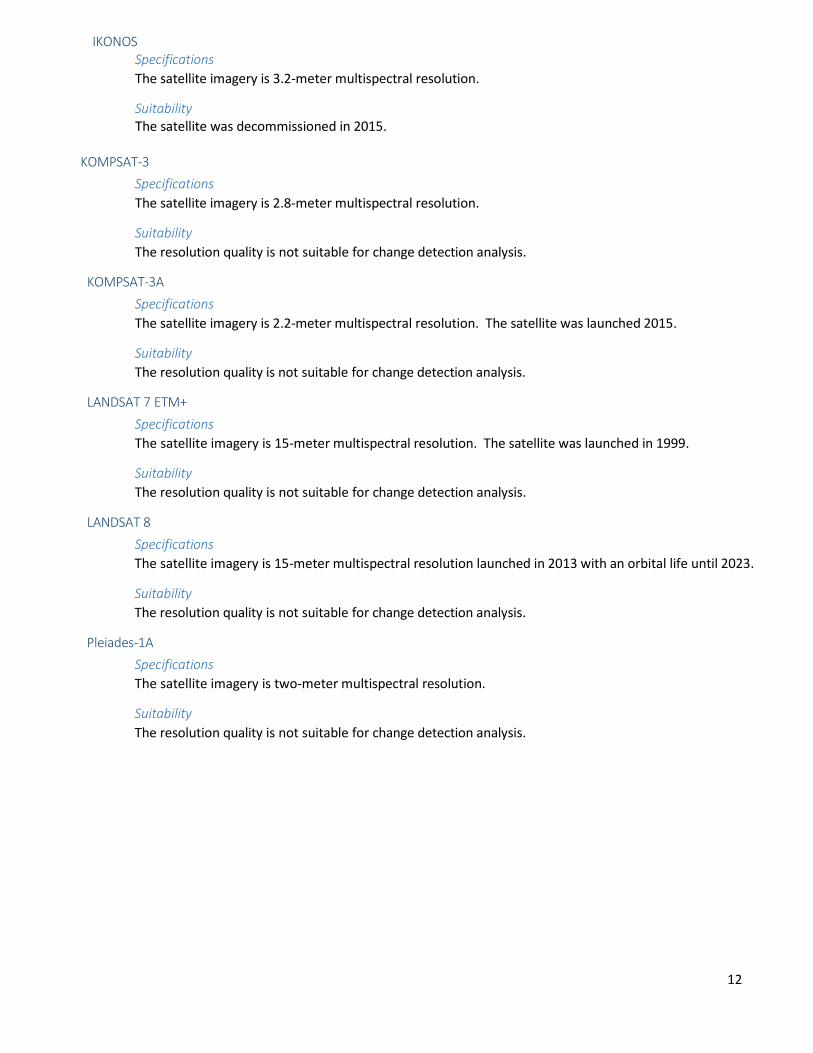
IKONOS Specifications The satellite imagery is 3.2-meter multispectral resolution.
Suitability The satellite was decommissioned in 2015.
KOMPSAT-3
Specifications The satellite imagery is 2.8-meter multispectral resolution.
Suitability The resolution quality is not suitable for change detection analysis.
KOMPSAT-3A Specifications The satellite imagery is 2.2-meter multispectral resolution. The satellite was launched 2015.
Suitability The resolution quality is not suitable for change detection analysis.
LANDSAT 7 ETM+ Specifications The satellite imagery is 15-meter multispectral resolution. The satellite was launched in 1999.
Suitability The resolution quality is not suitable for change detection analysis.
LANDSAT 8 Specifications The satellite imagery is 15-meter multispectral resolution launched in 2013 with an orbital life until 2023.
Suitability The resolution quality is not suitable for change detection analysis.
Pleiades-1A Specifications The satellite imagery is two-meter multispectral resolution.
Suitability The resolution quality is not suitable for change detection analysis.
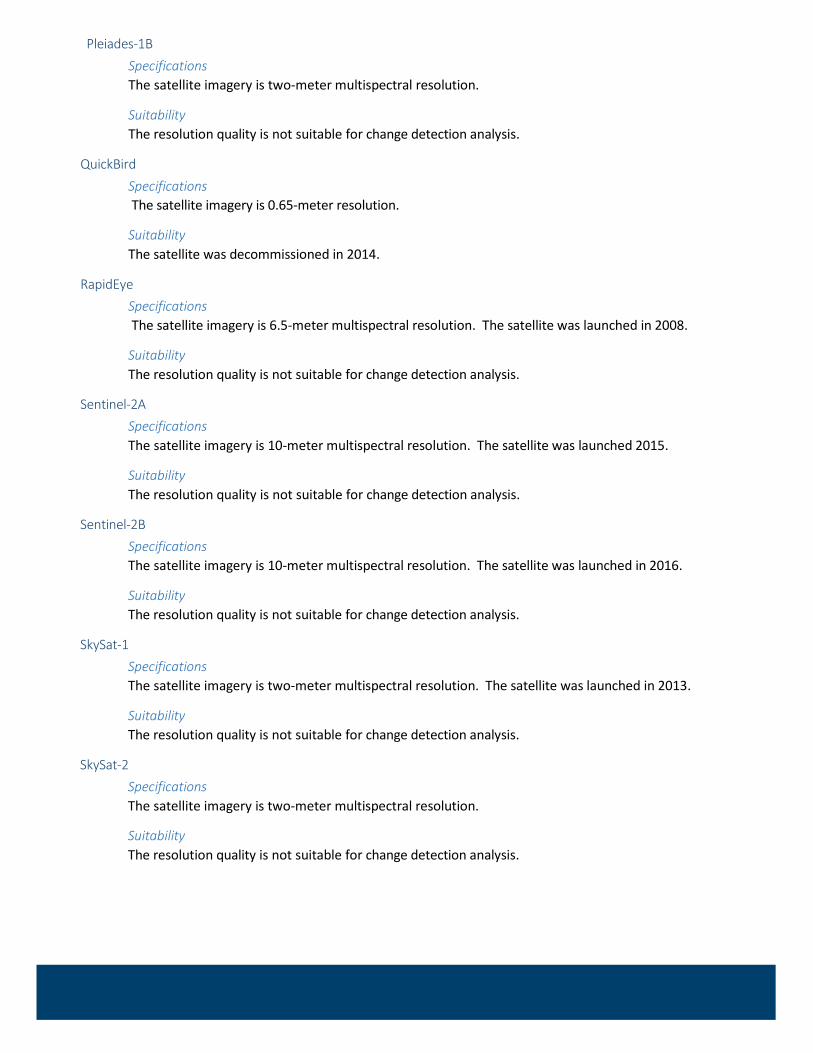
Pleiades-1B Specifications The satellite imagery is two-meter multispectral resolution.
Suitability The resolution quality is not suitable for change detection analysis.
QuickBird Specifications The satellite imagery is 0.65-meter resolution.
Suitability The satellite was decommissioned in 2014.
RapidEye Specifications The satellite imagery is 6.5-meter multispectral resolution. The satellite was launched in 2008.
Suitability The resolution quality is not suitable for change detection analysis.
Sentinel-2A Specifications The satellite imagery is 10-meter multispectral resolution. The satellite was launched 2015.
Suitability The resolution quality is not suitable for change detection analysis.
Sentinel-2B Specifications The satellite imagery is 10-meter multispectral resolution. The satellite was launched in 2016.
Suitability The resolution quality is not suitable for change detection analysis.
SkySat-1 Specifications The satellite imagery is two-meter multispectral resolution. The satellite was launched in 2013.
Suitability The resolution quality is not suitable for change detection analysis.
SkySat-2 Specifications The satellite imagery is two-meter multispectral resolution.
Suitability The resolution quality is not suitable for change detection analysis.

14
SPOT-5 Specifications The satellite imagery is 10-meter multispectral resolution.
Suitability The satellite was decommissioned in 2015.
SPOT-6 Specifications The satellite imagery is six-meter multispectral resolution. The satellite was launched in 2012.
Suitability The resolution quality is not suitable for change detection analysis.
SPOT-7 Specifications The satellite imagery is six-meter multispectral resolution. The satellite was launched in 2014.
Suitability The resolution quality is not suitable for change detection analysis.
TerraSAR-X Specifications The satellite produces X- band and 2-D SAR data. The satellite was launched in 2007.
Suitability The data is not suitable for change detection analysis.
TH-01 Specifications The satellite imagery is 10-meter multispectral resolution.
Suitability The satellite was decommissioned in 2015.
TripleSat Specifications The satellite imagery is 3.2-meter multispectral resolution.
Suitability The resolution quality is not suitable for change detection analysis.
WorldView-1 Specifications The satellite imagery is 0.5-meter Panchromatic only.
Suitability This type of data is not suitable for change detection analysis.

WorldView-2 Specifications The satellite imagery is 1.84-meter multispectral resolution. The satellite was launched 2009.
Suitability The resolution quality is not suitable for change detection analysis.
WorldView-3 Specifications The satellite imagery is 1.24-meter multispectral resolution. The satellite was launched in 2014 with an orbital life of 10-12 years.
Suitability The resolution quality is not suitable for change detection analysis.
WorldView-4 Specifications The satellite imagery is 0.34-meter multispectral resolution. The satellite was launched in 2016 with an expected orbital life of 10-12 years.
Suitability The resolution quality is suitable for change detection analysis. The satellite is a new satellite but not a low-cost option.

16
Software A wide variety of GIS tools and specialized image analysis tools exist for free or low-cost. However, in the context of this project’s needs, no software tool provided the specific ability to perform change detection comparison or automatically extract roads from image data of the quality available from the low-cost sources identified above. Software, such as ENVI, provide general capabilities that allow experts to develop specialized and research-level tools that can perform the road detection task with varying levels of accuracy and specificity.
The general conclusion is that it would not be cost-effective to employ a general software tool to the problem as MnDOT would be required to hire or train staff with the requisite skills in image analysis, machine vision and machine learning, which would allow the development of a tool in-house, the application, or other research to the specific problem at hand.
Free There are several free software’s and toolboxes available for extraction and object-based analysis. Information about these tool boxes is not published, and accuracy and efficiency is unknown. See Appendix A for specifications on each software. Below is a list of researched free software and toolboxes.
• QGIS Semi-Automatic Classification Plugin: The Sentinel Toolbox • GRASS: Geographic Resources Analysis Support System • SAGA GIS: System for Automated Geoscientific Analyses • ORFEO Toolbox (OTB): Optical and Radar Federated Earth Observation • PolSARPro: Polarimetric SAR Data Processing and Educational Tool aims to facilitate the accessibility and
exploitation of multi-polarized SAR datasets. • Opticks: Opticks is an expandable remote sensing and imagery analysis software platform that is free and open
source. Opticks was developed by Ball Aerospace & Technologies Corp. and other organizations for the United States Intelligence Community.
• OSSIM: Open Source Software Image Map • InterImage: Open source remote sensing software for automatic image interpretation • ILWIS: Integrated Land and Water Information System • gvSIG: Open source GIS (Spanish) with remote sensing analysis capabilities. • Whitebox GAT: Whitebox Geospatial Analysis Tools is an open-source desktop GIS and remote sensing
software package for general applications of geospatial analysis and data visualization. • E-foto: The goal of the Project E-foto photogrammetric kit is to provide the full implementation of a
digital photogrammetric workstation as free, open sourced software.
Paid These software tools, utilized in the publication of emerging research, are heavily documented to be efficient and accurate; however, none contains out-of-the-box tools that can perform a classification or extraction of road features from imagery directly. Expert-level specialists are required to build custom tools that utilize the foundational capabilities of these software components for each specific task. It is not feasible for MnDOT to build such tools in-house assuming a general GIS technician or analyst skills set.
ESRI Spatial Analyst: Segment Mean Shift tool
Software cost is $2,500 per single user.
ERDAS IMAGINE
Software cost is $7,500 per single license user.
Trimble eCOGNITION
Software cost to a Trimble developer is $20,880.

ENVI
Software cost is $8,370 per single license user.

18
Technologies A deep history of extracting surface features and road features, specifically, is available from the image research community spanning back several decades. However, to date, there is no canonical imagery source that can produce data at high enough spectral and spatial resolutions to unambiguously detect roads with sufficient accuracy so that an automated process can be developed. For example, it is very difficult to discriminate between gravel roads, compacted soils or ruts in agricultural land.
Since there is no canonical source of imagery, there is also no single, agreed best practice or technique for extracting road networks from the underlying imagery other than basic data processing methods. These include using the normalized differences between spectral bands, rather than raw spectral values to reduce the influence of detection bias and transient artifacts in the data (Momeni 2016). No tool exists in an out-of-the-box form that can be used by non-specialists. Rather, each individual or institution has tended to develop their own best practices and techniques by applying different machine vision and machine learning techniques to one or more data sets that are readily available. Replicating each published result would require specialist resources that MnDOT neither has nor has likely interest in acquiring since there is no guarantee that a bespoke system meets MnDOT’s business needs.
The most notable and applicable technology that was uncovered during this project’s research phase, is the existence of a Digital Globe partner, Public Sector Mapping Agencies (PSMA), that are automatically extracting a country-wide road network with automated width determination from high-resolution Digital Globe data on an annual basis with greater than one meter accuracy. However, the scope of that project was in the millions of dollars and a project of comparable cost requires MnDOT to be interested in dedicating sufficient resources toward a new effort, and certain desired MnDOT attributes, such as pavement type, were not within the scope of the Australia project.

Appendices
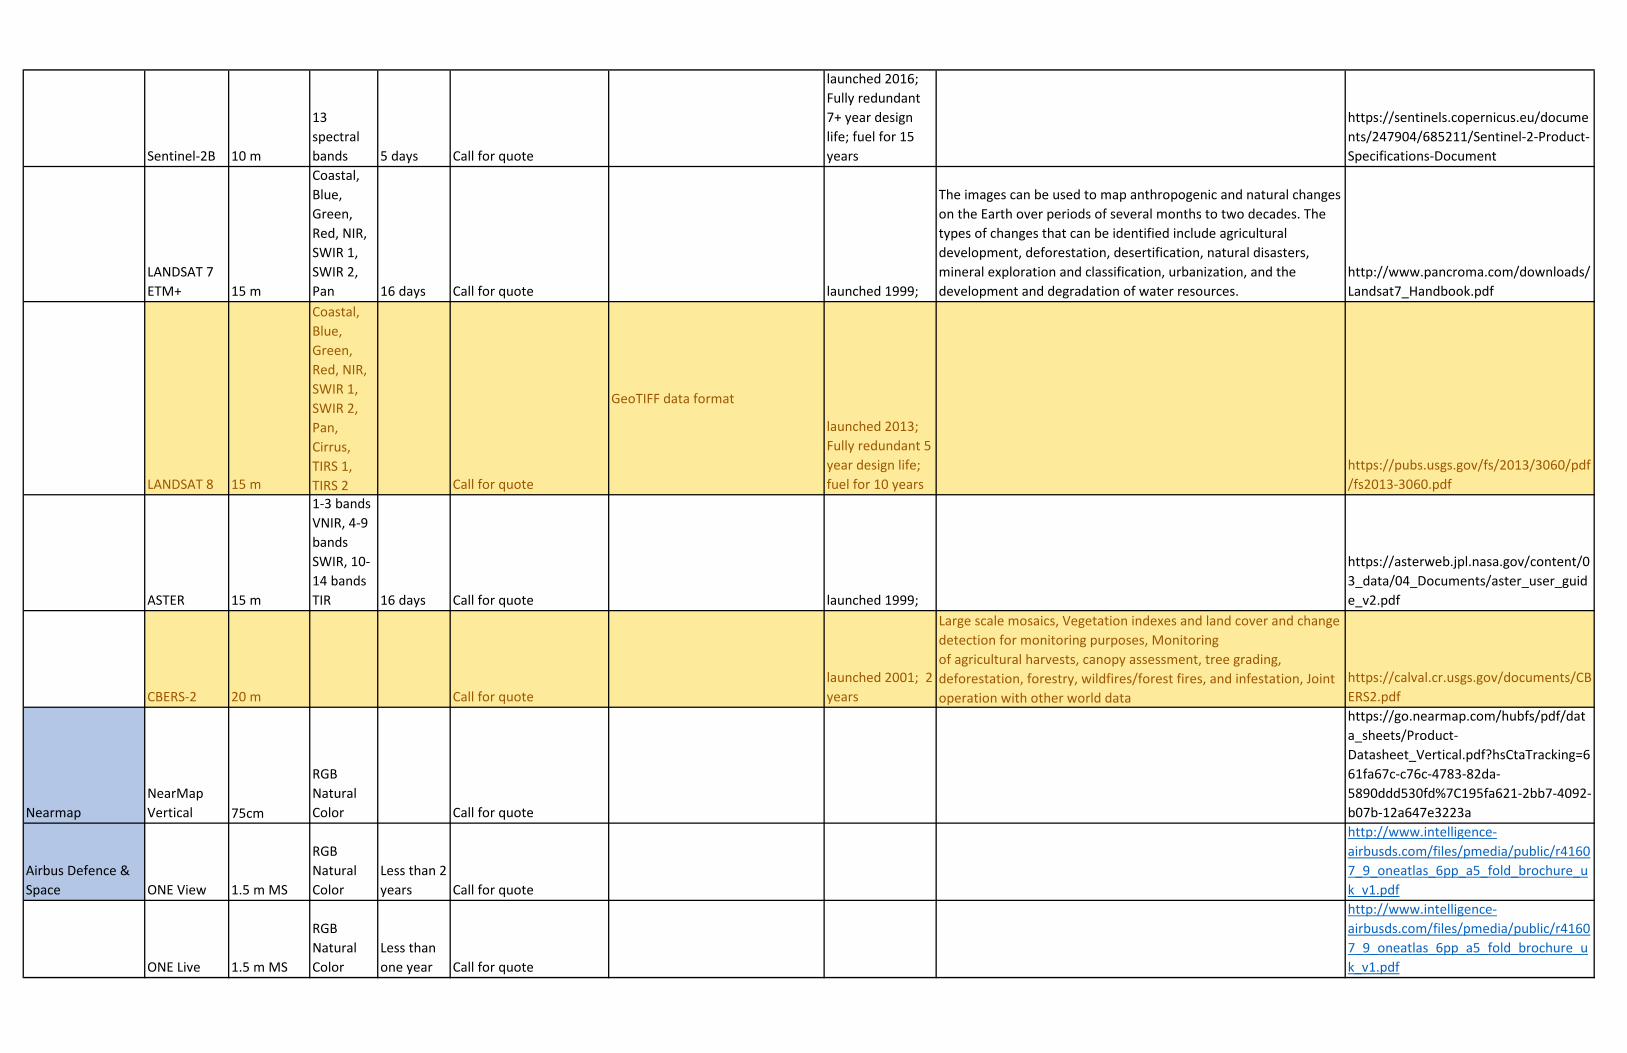
Appendix A: Low Cost Aerial and Spatial Data Specifications Spreadsheet
Attached pdf of the Low Cost Aerial and Spatial Data Specifications Spreadsheet
Specification Color Specification Description Light red/pink Decommissioned Satellites Light yellow Satellites with operational lifetime expiring within 5 years Blue Various imagery companies Green Road data Grey Miscellaneous categories
References (Deng et al. 2012), Extraction and Analysis of Impervious Surfaces Based on a Spectral Un-Mixing Method Using Pearl River Delta of China Landsat TM/ETM+ Imagery from 1998 to 2008, Sensors, ISSN 1424-8220
(Li et al. 2016), Examining Urban Impervious Surface Distribution and Its Dynamic Change in Hangzhou Metropolis, Remote Sensing, March 2016
(Akay and Sertel 2016), Urban Land Cover/Use Change Detection Using High Resolution SPOT 5 and SPOT 6 Images and Urban Atlas Nomenclature, The International Archives of the Photogrammy, Remote Sensing and Spatial Information Sciences, Volume XLI-B8
(Momeni et al. 2016), Mapping complex Urban Land Cover from Spaceborne Imagery: The Influence of Spatial Resolution, Spectral Band Set and Classification Approach, Remote Sensing, January 2016
(Sugumaran et al. 2007), Transportation Infrastructure Extraction Using Hyperspectral Remote Sensing, Remote Sensing of Impervious Surfaces, Taylor & Francis Group, LLC.
(Yang and He 2016), Automated mapping of impervious surfaces in urban and suburban areas: Linear spectral unmixing of high spatial resolution imagery, International Journal of Applied Earth Observation and Geoinformation 54 (2017) 53-64
(Zhou et al.2008), Object-based Land Cover Classification and Change Analysis in the Baltimore Metropolitan Area Using Multitemporal High Resolution Remote Sensing Data, Sensors, 8, 1613-1636
(Karila et al. 2017), Feasibility of Multispectral Airborne Laser Scanning Data for Road Mapping, IEEE Geoscience and Remote Sensing Letters, Vol 14, No. 3, March
(Sherba et al. 2014), Object-Based Classification of Abandoned Logging Roads under Heavy Canopy Using LiDAR, Remote Sensing, 6, 4043-4060

Data source Satellite Resolution BandsAcquisition Schedule Price Data Format Operational Life Comment PDF
Digital Globe WorldView-4 50-80cm Annual
$7,500 for web service of streaming data. $500,000 for downloadable mosaic of annual imagery
» MyDigitalGlobe » OGC Standards » Esri - ImageConnect » Google Earth - EarthService
https://content.satimagingcorp.com.s3.amazonaws.com/static/satellite-sensor-specification/WorldView-3-PDF-Download.pdf
WorldView-3 50-80cm Annual
$7,500 for web service of streaming data. $500,000 for downloadable mosaic of annual imagery
» MyDigitalGlobe » OGC Standards » Esri - ImageConnect » Google Earth - EarthService
http://content.satimagingcorp.com.s3.amazonaws.com/media/pdf/WorldView-3-PDF-Download.pdf
WorldView-2 50-80cm Annual
$7,500 for web service of streaming data. $500,000 for downloadable mosaic of annual imagery
» MyDigitalGlobe » OGC Standards » Esri - ImageConnect » Google Earth - EarthService
https://dg-cms-uploads-production.s3.amazonaws.com/uploads/document/file/21/Standard_Imagery_DS_10-7-16.pdf
WorldView-1 50-80cm Annual
$7,500 for web service of streaming data. $500,000 for downloadable mosaic of annual imagery
» MyDigitalGlobe » OGC Standards » Esri - ImageConnect » Google Earth - EarthService
https://content.satimagingcorp.com.s3.amazonaws.com/static/satellite-sensor-specification/WorldView-1-PDF-Download.pdf
GeoEye-1 50-80cm Annual
$7,500 for web service of streaming data. $500,000 for downloadable mosaic of annual imagery
» MyDigitalGlobe » OGC Standards » Esri - ImageConnect » Google Earth - EarthService
https://dg-cms-uploads-production.s3.amazonaws.com/uploads/document/file/21/Standard_Imagery_DS_10-7-16.pdf
Satellite Imagery Cooperation WorldView-4
0.31 m P, M 0.34-1.0 m
P, B, R, G,NIR, Red edge, coastal, yellow, near-IR1
>4.5 access/day $6,800 2016; 10-12 years SIC reseller of
https://content.satimagingcorp.com.s3.amazonaws.com/static/satellite-sensor-specification/WorldView-4-Satellite-Specifications
WorldView-3
0.31-0.34 m P, M 1.24-1.38
P, B, R, G,NIR, Red edge, coastal, yellow, near-IR1 4.5 days $6,800 2014; 10-12 years
http://content.satimagingcorp.com.s3.amazonaws.com/media/pdf/WorldView-3-PDF-Download.pdf
WorldView-2 1.84 m
P, B, R, G,NIR, Red edge, coastal, yellow, near-IR1 1-4 days $6,800
Launched 2009; 7.25 year mission life
https://content.satimagingcorp.com.s3.amazonaws.com/static/satellite-sensor-specification/WorldView-2-PDF-Download.pdf
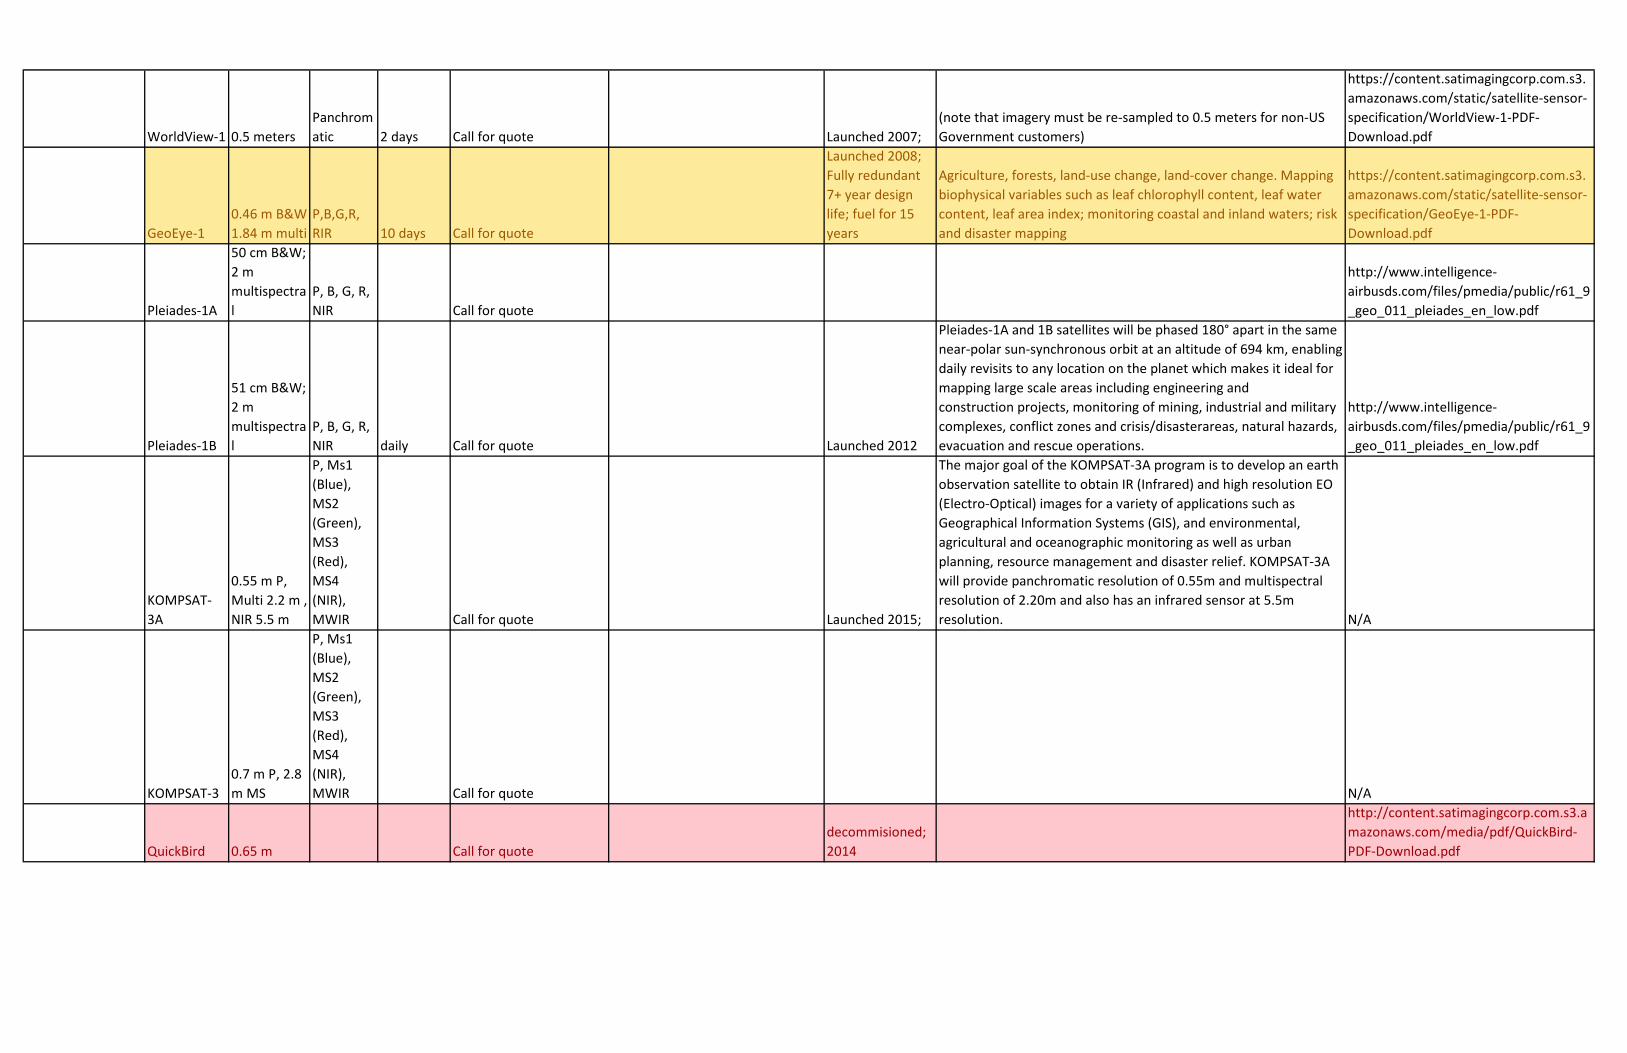
WorldView-1 0.5 metersPanchromatic 2 days Call for quote Launched 2007;
(note that imagery must be re-sampled to 0.5 meters for non-US Government customers)
https://content.satimagingcorp.com.s3.amazonaws.com/static/satellite-sensor-specification/WorldView-1-PDF-Download.pdf
GeoEye-10.46 m B&W 1.84 m multi
P,B,G,R, RIR 10 days Call for quote
Launched 2008; Fully redundant 7+ year design life; fuel for 15 years
Agriculture, forests, land-use change, land-cover change. Mapping biophysical variables such as leaf chlorophyll content, leaf water content, leaf area index; monitoring coastal and inland waters; risk and disaster mapping
https://content.satimagingcorp.com.s3.amazonaws.com/static/satellite-sensor-specification/GeoEye-1-PDF-Download.pdf
Pleiades-1A
50 cm B&W; 2 m multispectral
P, B, G, R, NIR Call for quote
http://www.intelligence-airbusds.com/files/pmedia/public/r61_9_geo_011_pleiades_en_low.pdf
Pleiades-1B
51 cm B&W; 2 m multispectral
P, B, G, R, NIR daily Call for quote Launched 2012
Pleiades-1A and 1B satellites will be phased 180° apart in the same near-polar sun-synchronous orbit at an altitude of 694 km, enabling daily revisits to any location on the planet which makes it ideal for mapping large scale areas including engineering and construction projects, monitoring of mining, industrial and military complexes, conflict zones and crisis/disasterareas, natural hazards, evacuation and rescue operations.
http://www.intelligence-airbusds.com/files/pmedia/public/r61_9_geo_011_pleiades_en_low.pdf
KOMPSAT-3A
0.55 m P, Multi 2.2 m , NIR 5.5 m
P, Ms1 (Blue), MS2 (Green), MS3 (Red), MS4 (NIR), MWIR Call for quote Launched 2015;
The major goal of the KOMPSAT-3A program is to develop an earth observation satellite to obtain IR (Infrared) and high resolution EO (Electro-Optical) images for a variety of applications such as Geographical Information Systems (GIS), and environmental, agricultural and oceanographic monitoring as well as urban planning, resource management and disaster relief. KOMPSAT-3A will provide panchromatic resolution of 0.55m and multispectral resolution of 2.20m and also has an infrared sensor at 5.5m resolution. N/A
KOMPSAT-30.7 m P, 2.8 m MS
P, Ms1 (Blue), MS2 (Green), MS3 (Red), MS4 (NIR), MWIR Call for quote N/A
QuickBird 0.65 m Call for quotedecommisioned; 2014
http://content.satimagingcorp.com.s3.amazonaws.com/media/pdf/QuickBird-PDF-Download.pdf

Gaofen-20.8 m P, 3.2 m MS
P, Ms1 (Blue), MS2 (Green), MS3 (Red), MS4 (NIR), MWIR 5 days Call for quote launched 2014 N/A
TripleSat0.8 m P, 3.2 m MS
P, B, G, R, NIR daily Call for quote
Launched 2015; Expected Mission Life: at least 7 years for each of three identical satellites N/A
IKONOSDECOMISSIONED 2015
DECOMISSIONED 2015
DECOMISSIONED 2015 Call for quote
decommisioned :1999
https://content.satimagingcorp.com.s3.amazonaws.com/static/satellite-sensor-specification/IKONOS-PDF-Download.pdf
PlanetScope SkySat-10.9 m P, 2 m MS
P, B, G, R, NIR Call for quote launchd; 2013
SkySat-1 is a high performance satellite producing sub-meter resolution imagery and high-definition video and is the smallest satellite ever flown that is capable of capturing imagery at better than 1 meter resolution.
https://www.planet.com/products/satellite-imagery/files/Planet_Imagery_Product_Specs.pdf
PlanetScope SkySat-2 0.8 m P, 1.1 m MS
P, B, G, R, NIR Call for quote
https://www.planet.com/products/satellite-imagery/files/Planet_Imagery_Product_Specs.pdf
TerraSAR -X
X-Band and 2-D SAR 11 days Call for quote
launch 2007; 5 years
TerraSAR-X Staring Spotlight mode provides the highest spatial resolution presently available on a commercial spaceborne SAR system. The TerraSAR-X Staring Spotlight mode provides a means to assess man-made objects more precisely. Image measurements of size, shape and positions are more accurate, target interpretation is more reliable. N/A
SPOT-61.5 m P, 6 m MS
P, B, G, R, NIR daily Call for quote
launched 2012; 10 years
SPOT-6 is an optical imaging satellite capable of imaging the Earth with a resolution of 1.5 meter panchromatic and 6 meter multispectral (blue, green, red, near-IR) and will offer imaging products to customers in defense, agriculture, deforestation, environmental monitoring, coastal surveillance, engineering, oil, gas and mining industries.
http://www.intelligence-airbusds.com/files/pmedia/public/r2928_9_int_012_spot6-7_en_low-2.pdf
SPOT-71.5 m P, 6 m MS
P, B, G, R, NIR daily Call for quote launched 2014;
http://www.intelligence-airbusds.com/files/pmedia/public/r2928_9_int_012_spot6-7_en_low-2.pdf
Other Satellites Call for quote
FORMOSAT-2
DECOMISSIONED 2004
DECOMISSIONED
DECOMISSIONED Call for quote
DECOMISSIONED 2004
http://www.intelligence-airbusds.com/files/pmedia/public/r2929_9_formosat2_product_sheet_en.pdf

TH-01DECOMISSIONED
DECOMISSIONED
DECOMISSIONED Call for quote
DECOMISSIONED 2015
supports applications for 3D terrain mapping and production of 10m DSM/DEM and DTM elevation models and contours to support engineering, surveying and mapping projects. N/A
ALOSDECOMISSIONED 2011
DECOMISSIONED
DECOMISSIONED Call for quote
DECOMISSIONED 2011
http://global.jaxa.jp/activity/pr/brochure/files/sat01.pdf
CARTOSAT 2.m PBlack and white 5 days Call for quote
Launched 2005; n/a
The data from CARTOSAT-1 is expected to provide enhanced inputs for large scale mapping applications and stimulate newer applications in the urban and rural development, land and water resources management, disaster assessment, land cover change detection, relief planning and management, environmental impact assessment and various other Geographical Information Systems (GIS) applications N/A
SPOT-5DECOMISSIONED 2015
DECOMISSIONED
DECOMISSIONED Call for quote DECOMISSIONED
http://www.intelligence-airbusds.com/files/pmedia/public/r233_9_geo_0013_spot_en_low.pdf
SPOT-61.5m P, 6.0m MS
P, B, G, R, NIR daily Call for quote
launched 2012; 10 years
SPOT-6 is an optical imaging satellite capable of imaging the Earth with a resolution of 1.5 meter panchromatic and 6 meter multispectral (blue, green, red, near-IR) and will offer imaging products to customers in defense, agriculture, deforestation, environmental monitoring, coastal surveillance, engineering, oil, gas and mining industries.
http://www.intelligence-airbusds.com/files/pmedia/public/r2928_9_int_012_spot6-7_en_low-2.pdf
SPOT-71.5m P, 6.0m MS
P, B, G, R, NIR daily Call for quote
lanched 2014; 10 years
SPOT-6 and SPOT-7 are the de facto solution to cover wide areas in record time, making national maps regular updating as well as thematic map creation possible.
http://www.intelligence-airbusds.com/files/pmedia/public/r2928_9_int_012_spot6-7_en_low-2.pdf
Dove 3 m MS P, B, G, R, NIR Call for quote 1-3 years
Dove satellite constellation holds the world record of the most satellites launched at once from one rocket and will collect imagery up to 2 million km² per day. The Dove satellite constellation is a fleet of nanosatellites deployed from the International Space Station to take images of Earth. The satellite constellation is operated by Planet Labs Inc., 88 nanosatellites called Doves weighing only 11 pounds each, provides 3 meter multispectral image resolution for a variety of mapping applications including several humanitarian and environmental applications, from monitoring deforestation and urbanization to improving natural disaster relief and agricultural yields around the world. The constellation revisits more frequently than any existing government or commercial satellites. N/A
RapidEye
6.5 m NADIR, Orthorectified 5 m
B, G, R, Red Edge, NIR 5.5 days Call for quote
launched 2008; 7 years
The RapidEye constellation of five satellites stands apart from other providers of satellite based geospatial information in their unique ability to acquire high resolution, large-area image data on a daily basis.
https://www.planet.com/products/satellite-imagery/files/Planet_Imagery_Product_Specs.pdf
Sentinel-2A 10 m
13 spectral bands 5 days Call for quote
launched 2015; Fully redundant 7+ year design life; fuel for 15 years
Agriculture, forests, land-use change, land-cover change. Mapping biophysical variables such as leaf chlorophyll content, leaf water content, leaf area index; monitoring coastal and inland waters; risk and disaster mapping
https://sentinels.copernicus.eu/documents/247904/685211/Sentinel-2-Product-Specifications-Document
Sentinel-2B 10 m
13 spectral bands 5 days Call for quote
launched 2016; Fully redundant 7+ year design life; fuel for 15 years
https://sentinels.copernicus.eu/documents/247904/685211/Sentinel-2-Product-Specifications-Document
LANDSAT 7 ETM+ 15 m
Coastal, Blue, Green, Red, NIR, SWIR 1, SWIR 2, Pan 16 days Call for quote launched 1999;
The images can be used to map anthropogenic and natural changes on the Earth over periods of several months to two decades. The types of changes that can be identified include agricultural development, deforestation, desertification, natural disasters, mineral exploration and classification, urbanization, and the development and degradation of water resources.
http://www.pancroma.com/downloads/Landsat7_Handbook.pdf
LANDSAT 8 15 m
Coastal, Blue, Green, Red, NIR, SWIR 1, SWIR 2, Pan, Cirrus, TIRS 1, TIRS 2 Call for quote
GeoTIFF data format
launched 2013; Fully redundant 5 year design life; fuel for 10 years
https://pubs.usgs.gov/fs/2013/3060/pdf/fs2013-3060.pdf
ASTER 15 m
1-3 bands VNIR, 4-9 bands SWIR, 10-14 bands TIR 16 days Call for quote launched 1999;
https://asterweb.jpl.nasa.gov/content/03_data/04_Documents/aster_user_guide_v2.pdf
CBERS-2 20 m Call for quotelaunched 2001; 2 years
Large scale mosaics, Vegetation indexes and land cover and change detection for monitoring purposes, Monitoring of agricultural harvests, canopy assessment, tree grading, deforestation, forestry, wildfires/forest fires, and infestation, Joint operation with other world data
https://calval.cr.usgs.gov/documents/CBERS2.pdf
NearmapNearMap Vertical 75cm
RGB Natural Color Call for quote
https://go.nearmap.com/hubfs/pdf/data_sheets/Product-Datasheet_Vertical.pdf?hsCtaTracking=661fa67c-c76c-4783-82da-5890ddd530fd%7C195fa621-2bb7-4092-b07b-12a647e3223a
Airbus Defence & Space ONE View 1.5 m MS
RGB Natural Color
Less than 2 years Call for quote
http://www.intelligence-airbusds.com/files/pmedia/public/r41607_9_oneatlas_6pp_a5_fold_brochure_uk_v1.pdf
ONE Live 1.5 m MS
RGB Natural Color
Less than one year Call for quote
http://www.intelligence-airbusds.com/files/pmedia/public/r41607_9_oneatlas_6pp_a5_fold_brochure_uk_v1.pdf

Polar Geospatial Center - University of Minnesota
Multiple satellites
The Polar Geospatial Center receives multiple satellite imagery from Digital Globe, but is not allowed to use the imagery in a manner that would compete with other commercial imagery providers. The imagery can only be used in connection with federal contracted work.
SatShot.comRelationship with AirBus 1 m
Multii-spectral and infrared Annual $1-2 MM for entire state
» MyDigitalGlobe » OGC Standards » Esri - ImageConnect » Google Earth - EarthService
Currently, the agricultural areas of Minnesota have been acquired. Additional acquisition would be needed.
Data Download SitesUSGS Earth Explorer NAIP 0.6 m CNIR 9/11/2016 Free
Orbview-31m P, 4 m MS 3 days Free
Google Earth Multiple Multiple2015 in Minnesota Free
NOAA Data access Viewer NAIP
Coastal areas only Free
JAXA's GlobalALOS World 3D 30m Free
Earth Observation Link ESA's EO Catalogue Free
Road Data
NavMart $4,000
Esri Shapefile, MapInfo TAB, Oracle ODF and can dicuss format type
TeleMartyou can specify Called for quote You can specify

Software/toolboxes Price Comments Esri Compatible Pdf
The Sentinel Toolbox Free
Sentinel-2 has become the gold standard for open satellite data. In order to process the vast amounts of data collected by Sentinel-2A/2B, users can use the Sentinel Toolbox. One of the highlights of the Sen2cor plugin which allows users to correct for atmospheric effects and classify images. If you download Sentinel-1 synthetic aperture radar data, you can process your data with the Sentinel-1 toolbox. For example, you can perform interferometry, speckle filtering and coregistration.
YES
https://sentinel.esa.int/web/sentinel/toolboxes
QGIS Semi-automatic Classification Plugin
Free
In terms of remote sensing plugins, the semi-automatic classification plugin offers the most practical solution for optical images. Because you can download Sentinel, Landsat, ASTER and MODIS imagery directly using the plugin, this feature makes the plugin most convenient for is supervised image classification. Furthermore, it also provides tools to its pre- and post-processing of imagery. No wonder why it’s in the top 5 downloaded plugins for QGIS.
NO
https://plugins.qgis.org/plugins/SemiAutomaticClassificationPlugin/
GRASS: Geographic Resources Analysis Support System Free
It offers image classification, PCA, edge detection, radiometric corrections, 3D, geostatistics analysis and filtering options. Another key feature of GRASS is the LiDAR processing and analysis. You can filter LiDAR points, create contours and generate DEMs. Next time you see a LAS file, see what GRASS can do with it.
NO
http://grass.osgeo.org/
SAGA GIS: System for Automated Geoscientific Analyses Free
SAGA GIS is ideal for most remote sensing needs because of its rich library grid, imagery and terrain processing modules. In terms of classification, it has your basic supervised but it’s not as intuitive and user-friendly as other remote sensing software. For analyses and manipulation, it flourishes with terrain tools like TPI, TWI and soil classification. It also has some rudimentary tools for photogrammetry and support vector machine (SVM). Although it has a vast library of raster-based tools, the only downfall of SAGA GIS is the lack of documentation for some of them.
NO
http://www.saga-gis.org/en/index.html
ORFEO Toolbox (OTB): Optical and Radar Federated Earth Observation Free
The ORFEO toolbox was a cooperative project developed by France and Italy primarily built on the shoulders of the open source community. This image processing library specifically aims at high spatial resolution data. ORFEO provides a wide range of remote sensing functions including radiometry, PCA, change detection, pan sharpening, image segmentation, classification and filtering. One really interesting aspect of this software is the capability to do Large-Scale Mean-Shift segmentation (LSMC). This type of object based image analysis is a rare feature seen in software nowadays.
NO
https://www.orfeo-toolbox.org/
PolSARPro Free
For synthetic aperture radar, you may want to look into PolSARPro. This software can handle dual and full polarization SAR from ENVISAT-ASAR, ALOS-PALSAR, RADARSAT-2 and TerraSAR-X. There’s a wide range of tools like importing, conversion, filtering, decompositions, inSAR processing and calibration. Another neat part of this software is the graph processing framework where users can automate workflow. This functionality is similar to ArcGIS model builder and easy to set up. Overall, PolSARPro is a very sophisticated piece of open source remote sensing software. You need to take a look at PolSARPro if you’re working with full or dual polarization SAR data.
NO
https://earth.esa.int/web/polsarpro
Opticks Free
The neat part about Opticks software is the long list of extensions you can add. There are plugins for raster math, radar processing and hyper/multispectral. Before downloading an extension, make sure to check the compatibility. Actually, you might have to scale back your Opticks version in order for the extension to work properly YES http://opticks.org/

OSSIM: Open Source Software Image Map Free
Not only has it been actively developed for almost two decades but interesting enough, it’s being funded through US departments such as in intelligence and defense. OSSIM is a high performance open source remote sensing software application. Some of the key features is compatibility with more than 100 raster and vector formats and over 4000 different projections and datums. It supports a long list of sensors but some may require additional plug-ins. If you need some remote sensing direction for high spatial resolution imagery, OSSIM might be the answer you have been searching for.
NO
http://trac.osgeo.org/ossim/
InterImage Free
InterImage is a bit different from the other open source remote sensing software on this list. It specializes in automatic image interpretation, which is pretty neat. The core theme of automatic image interpretation is object-based image analysis (OBIA). This involves segmentation, exploring their spectral, geometric and spatial properties and then classification. Although InterImage was developed in Brazil, documentation is available in English.
NO
http://www.lvc.ele.puc-rio.br/projects/interimage/
ILWIS: Integrated Land and Water Information System Free
For more than 25 years, ILWIS has been used from GIS enthusiasts. Actually, since its first release it has over 27,000 downloads. But it wasn’t until recently that it has become available for public use. It is equipped with stereoscopy and anaglyph tools to create stereo pairs from two aerial photographs. Alternatively, if you have satellite data, ILWIS has image classification techniques to create land cover classes. ILWIS was originally built for researchers and students. For this reason, effort was concentrated on developing a user-friendly environment.
NO
http://52north.org/communities/ilwis
gvSIG Free
gvSIG is known for its wide variety of rich features. And this applies to its remote sensing capabilities too. For example, users can perform supervised classification, band algebra and decision trees. On top of that, gvSIG software delivers a more diverse range of tools like Tassled Cap which is ideal for monitoring vegetation health/vigor and urban growth. Further to this, the vegetation indices toolbar analyzes chlorophyll and plant health, if you have multispectral data.
NO
http://www.gvsig.com/en
Whitebox GAT Free
There’s a hydrology theme that surrounds Whitebox GAT because it actually replaced Terrain Analysis System (TAS) – an Esri tool for hydro-geomorphic applications. Where it shines is LIDAR! It’s like the swiss-army knife of LiDAR data with even a tool that can convert it to shape file. Although the cartographic tools are bare, overall Whitebox GAT has a solid 410 tools for all your GIS needs.
YEShttp://www.uoguelph.ca/~hydrogeo/Whitebox/
E-foto Free
E-foto is the digital photogrammetry specialist in the group of open source remote sensing software. The core functionality is photo triangulation, stereoscopic modeling, digital elevation model extraction and terrain correction. This software provides a fully functional photogrammetry tool set to use at no cost. E-foto has loads of tutorials and examples to get you well on your way to being a photogrammetry expert.
NO
http://www.efoto.eng.uerj.br/enESRI Spatial Analyst: Segment Mean Shift tool $2500 per single license YESERDAS IMAGINE $7500 single license user, $1380 renewalTrimble eCOGNITION $20,880

ENVI
Commerical price: $8370 single license user perpetual use, annual updates not included, $1260 for maintnance renewal (annual) . GSA price: $7379

Methodologyhttps://www.ncbi.nlm.nih.gov/pmc/articles/PMC3304143/pdf/sensors-12-01846.pdf Deng et al 2012 ENVIhttps://www.int-arch-photogramm-remote-sens-spatial-inf-sci.net/XLI-B8/789/2016/isprs-archives-XLI-B8-789-2016.pdf Akay and Sertel 2016 eCognitionhttp://www.ugpti.org/smartse/research/citations/downloads/Sugumaran-Remote_Sensing_of_Impervious_Surfaces-2007.pdf Sugumaran-Remote_Sensing_of_Impervious_Surfaces-2007 N/Ahttp://www.mdpi.com/2072-4292/8/2/88/htm Momeni et al 2016 eCognitionhttp://www.sciencedirect.com.ezproxy.library.und.edu/science/article/pii/S0303243416301635 Yang and He 2017 ENVIhttp://www.sciencedirect.com.ezproxy.library.und.edu/science/article/pii/S0169204616000426 Zhang et al. 2016 N/Ahttp://www.mdpi.com/2072-4292/8/3/265/html Li et al 2016 N/Ahttp://mdpi.com/1424-8220/8/3/1613/htm Zhou et al. 2008 eCognitionhttp://www.mdpi.com/2072-4292/6/5/4043 Sherba et al. 2014 ArcGIS and eCognitionhttp://ieeexplore.ieee.org/abstract/document/7829363/?reload=true Karila et al. 2017 eCognition and MATLAB

County Data2014 Roads http://www.dot.state.mn.us/maps/gdma/gis-data.html
Aitkin Yes https://www.co.aitkin.mn.us/departments/GIS/GIS-home.htmlAnoka Yes https://www.anokacounty.us/1990/Data-DownloadsBecker Yes http://www.co.becker.mn.us/online_services/GIS_data.aspxBeltrami Yes http://www.co.beltrami.mn.us/Departments/GIS/GIS.htmlBenton Yes https://www.co.benton.mn.us/E-Services.phpBig Stone Yes http://www.bigstonecounty.org/gis/gis.vbhtmlBlue Earth Yes http://www.blueearthcountymn.gov/413/MapsBrown Yes https://www.co.brown.mn.us/gis-a-property-infoCarlton Yes http://www.co.carlton.mn.us/gis_mappingCarver Yes http://data-carver.opendata.arcgis.com/datasets?t=InfrastructureCass Yes http://www.co.cass.mn.us/services/land/maps/Chippewa Yes http://www.co.chippewa.mn.us/maps.htmChisago Yes http://www.co.chisago.mn.us/428/Maps-DataClay Yes http://claycountymn.gov/658/GIS-DataClearwater Yes http://www.co.clearwater.mn.us/index.asp?Type=B_LIST&SEC=%7BC3EA334C-2D16-4252-B563-7908C6E147D2%7DCook Yes http://cookcountymn.maps.arcgis.com/home/index.htmlCottonwood Yes http://www.co.cottonwood.mn.us/county-departments/information-systems/Crow Wing Yes http://crowwing.us/186/GIS---County-MapsDakota Yes https://gis.co.dakota.mn.us/dcgis/Dodge Yes http://www.co.dodge.mn.us/departments/land_records/gis.phpDouglas Yes http://www.co.douglas.mn.us/dc/gis.aspxFaribault Yes https://beacon.schneidercorp.com/Application.aspx?AppID=373&LayerID=8056&PageTypeID=1&PageID=0Fillmore Yes http://www.co.fillmore.mn.us/gisFreeborn Yes https://beacon.schneidercorp.com/Application.aspx?AppID=333&LayerID=3791&PageTypeID=1&PageID=2405Goodhue Yes http://www.co.goodhue.mn.us/342/GISGrant Yes http://www.co.grant.mn.us/630/GIS-Interative-County-MapHennepin Yes http://www.hennepin.us/gisopendataHouston Yes http://www.co.houston.mn.us/E911.aspxHubbard Yes https://getdata-hubbardcounty.opendata.arcgis.com/Isanti Yes https://beacon.schneidercorp.com/Application.aspx?AppID=511&LayerID=7920&PageTypeID=2&PageID=3860Itasca Yes http://www.co.itasca.mn.us/625/MapsJackson Yes http://www.co.jackson.mn.us/index.asp?SEC=82513334-8565-41DD-9985-4EB7515E607E&Type=B_BASICKanabec Yes http://www.kanabeccounty.org/departments/gis.phpKandiyohi Yes http://gis.co.kandiyohi.mn.us/Kittson Yes http://136.234.13.165/link/jsfe/index.aspxKoochiching Yes http://www.co.koochiching.mn.us/289/DisclaimerLac qui Parle Yes https://lqpco.com/index.php/gis-mapping/Lake Yes http://www.co.lake.mn.us/departments/information_systems/gis.phpLake of the woods Yes http://oak.co.lake-of-the-woods.mn.us/link/jsfe/index.aspxLe Seueur Yes http://www.co.le-sueur.mn.us/departments/gis/index.phpLincoln Yes http://www.lincolncounty-mn.us/Departments/gis_maps.htmLyon Yes http://www.lyonco.org/gisMcLeod Yes http://www.co.mcleod.mn.us/gis_(mapping_and_surveying)/gis_data.phpMahnomen Yes http://www.co.mahnomen.mn.us/highway_department.htmlMarshall Yes http://gismap.co.marshall.mn.us/link/jsfe/index.aspx

Martin Yes http://www.co.martin.mn.us/index.php/directions-mapsMeeker Yes http://www.co.meeker.mn.us/documentcenter/view/2378Mille Lacs Yes http://www.co.mille-lacs.mn.us/mappingMorrison Yes http://www.co.morrison.mn.us/index.asp?SEC=AD579630-799E-4B92-BA3F-E8412EBD146F&Type=B_BASICMower Yes http://www.co.mower.mn.us/GIS.htmlMurray Yes http://murraycountymn.com/maps/Nicollet Yes http://www.co.nicollet.mn.us/465/County-MapsNobles Yes http://www.co.nobles.mn.us/departments/it/gis/Norman Yes http://www.co.norman.mn.us/index.asp?SEC=44C7CAA6-A4DC-4F09-B24E-0DE2487B16DD&Type=B_BASICOlmsted Yes https://webapp.co.olmsted.mn.us/shoppingcart/site/Planning/GIS/DataCatalog/categories.aspx?CTypeid=4Otter Tail Yes http://www.co.otter-tail.mn.us/616/MapsPennington Yes http://gismap.co.pennington.mn.us/link/jsfe/index.aspxPine Yes http://www.co.pine.mn.us/index.asp?Type=B_BASIC&SEC=%7BEC1BB4C9-6E8F-4CCA-8C94-37A90DB3EF7F%7DPipestone Yes http://www.pipestone-county.com/maps.phpPolk Yes http://www.co.polk.mn.us/index.asp?SEC=9B803F78-A3E2-4A5E-BF2C-D8A544C4449CPope Yes http://www.co.pope.mn.us/gis.phpRamsey Yes http://openramsey-ramseygis.opendata.arcgis.com/Red Lake Yes https://www.arcgis.com/home/item.html?id=99beedd681964704b664b41ccc711da0Redwood Yes https://beacon.schneidercorp.com/Application.aspx?AppID=800&LayerID=12803&PageTypeID=1&PageID=0Renville Yes http://www.renvillecountymn.com/about_us/county_maps/gis.phpRice Yes http://www.co.rice.mn.us/152/Geographic-Information-SystemsRock Yes http://rock.houstoneng.com/Roseau Yes http://gis.co.roseau.mn.us/link/jsfe/index.aspxScott Yes https://www.scottcountymn.gov/1183/GIS-Data-and-MapsSherburne Yes https://www.co.sherburne.mn.us/publicworks/mapping/gis.phpSibley Yes http://www.co.sibley.mn.us/gis_(geographic_information_system)/index.phpSt.louis Yes http://www.stlouiscountymn.gov/mapsStearns Yes https://co.stearns.mn.us/PropertyRoads/GISDataforDownloadSteele Yes http://www.co.steele.mn.us/divisions/land_use_and_records/gis/index.phpStevens Yes http://www.co.stevens.mn.us/index.aspx?nid=956Swift Yes http://www.swiftcounty.com/recordsTodd Yes http://www.co.todd.mn.us/departments/gis_mapping_services/gis_mappingTraverse Yes no GIS contact, county website : https://www.co.traverse.mn.us/Wabasha Yes http://www.co.wabasha.mn.us/index.php/departments/gis-departmentWadena Yes http://www.co.wadena.mn.us/194/GISWaseca Yes http://gis.co.waseca.mn.us/jsfe/index.aspxWashington Yes https://www.co.washington.mn.us/92/County-MapsWatonwan Yes https://beacon.schneidercorp.com/Application.aspx?AppID=216&LayerID=2931&PageTypeID=1&PageID=0Wilkin Yes https://www.arcgis.com/home/item.html?id=0c60ea3af27d4508bf34480fc61fca9aWinona Yes http://www.co.winona.mn.us/page/2696Wright Yes https://www.co.wright.mn.us/215/GIS-MappingYellow Medicine Yes http://gis.co.ym.mn.gov/Link/jsfe/index.aspx