truck freight - missourieconomy.org · missouri economic research and information center missouri...
TRANSCRIPT

Missouri Economic Research and Information Center
Missouri Freight Transportation Economy on the Move
Truck Freight

Missouri Economic Research and Information Center
Truck Industry The Missouri highway system is the longest state road system in the Mid-
West spanning 32,800 miles and crossing over 10,224 bridges. The
highway freight industry that relies on this system currently employs
39,867 workers; 38,491 in general, specialized, and intercity freight
trucking positions and 1,376 in road transportation support activities.
Warehousing and storage industries are closely related to freight shipping
activities and employ over 16,500 workers in the state.
An Economic Driver The trucking industry employment has a large impact on Missouri’s
economy generating an estimated $5.1 billion annually in Gross State
Product, $2.6 billion in personal income and $172 million in new net
Missouri general revenues. The more than 39,800 direct workers
generate an estimated 33,900 indirect and induced spin-off jobs annually
in Missouri through purchases of industry intermediate inputs and
employee consumer spending.
Commodity Flows Shipment values and tonnage for all modes combined increased in
Missouri by roughly 20% over the five years surveyed. Truck shipments
accounted for over 74% of the value and over 78% of the total tonnage.
Over $162 billion in Missouri commodities are shipped by truck.
Pharmaceuticals, mixed freight, and chemicals represent nearly 22% of
the total value of those Missouri commodities. Over $110 billion are
imported by truck to Missouri. High value imports include
pharmaceuticals, motorized vehicles and parts, and mixed freight.

Missouri Economic Research and Information Center
Trends in Truck Shipments 2002-2007 Shipment values and tonnage for all modes combined increased in Missouri by roughly 20% over the five years surveyed. Missouri companies shipped nearly $226 billion and 305 million tons of commodities throughout the U.S. Truck shipments accounted for over 74% of the value and over 78% of the tonnage or $167.7 billion and 240.7 million tons. The Commodity Flow Survey breaks out truck shipping into for-hire and private truck only modes and truck intermodal modes (truck/rail, truck/water). The most recent survey reports a significant increase in truck only shipping values (20%) and tonnage (21%). Shipping increases occurred across 30 commodity classifications. Substantial dollar gains were found in chemical products, meat/fish, fuel oils, coal/petroleum products, and grain/alcohol/tobacco shipments. Likewise, the intermodal truck and rail shipments increased substantially in both value (334%) and tonnage (421%). Truck and water intermodal, previously suppressed in 2002, now shows a growth in value to $149 million and 5.9 million tons.

Missouri Economic Research and Information Center
0%
20%
40%
60%
80%
1,000 - 9,999 lbs
10,000 -49,999 lbs
50,000 -99,999 lbs
More than 100,000 lbs
Distribution of Value by Shipment Weight
Truck
Truck and Rail
Truck and Water
0 1000 2000 3000 4000 5000
Less than 50 lbs
50 - 99 lbs
100 - 499 lbs
500 - 749 lbs
750 - 999 lbs
1,000 - 9,999 lbs
10,000 - 49,999 lbs
50,000 - 99,999 lbs
More than 100,000 lbs
Distance of Truck Shipments by Weight
Truck and Water
Truck and Rail
Truck
Shipment Weights The distribution of shipment weight by truck mode primarily falls into four categories. The 10 to 50 thousand lbs group represents about 51% of total truck tonnage and 47% of the total value.
Shipment Distance Missouri Truck-Only shipments average 153 miles to destination. Truck and Rail intermodal averages 795 miles and Truck and Water intermodal averages 1,760 miles to destination.

Missouri Economic Research and Information Center
Missouri’s Truck Shipments to States ($B)
Missouri’s higher value truck shipments are distributed mainly in the central region with Illinois receiving nearly 11% of the total trucking shipment value. Shipments within Missouri account for over 42% of value. Higher value intermodal shipments by truck and water combinations move predominately to California ($12M) and Missouri ($3M). Higher value intermodal truck and rail shipments move mainly to the coastal states of California, Texas, Georgia, and Florida.
Destination Value($bil)
Missouri 68.70
Illinois 17.46
Kansas 7.65
Texas 6.14
Arkansas 5.04
Indiana 4.24
Pennsylvania 3.62
Tennessee 3.60
California 3.53
Michigan 3.46

Missouri Economic Research and Information Center
Missouri’s Truck Shipments to States (Kilotons)
Missouri’s heaviest truck cargo tends to stay close to home with destinations mainly in the surrounding states and within Missouri itself. Intermodal shipments by truck and water delivered the most tonnage in commodities to Louisiana (1,333 KT) and Missouri (1,277 KT). States receiving the highest number of tonnage via truck and rail intermodal included Texas (524 KT), California (518 KT), Arkansas (207 KT), and Oklahoma (142 KT).
Destination Tons (thous)
Missouri 168,354
Illinois 15,183
Kansas 7,056
Arkansas 5,339
Oklahoma 3,206
Texas 2,877
Indiana 2,368
Tennessee 2,293
Kentucky 1,778
Iowa 1,762

Missouri Economic Research and Information Center
Missouri’s Truck Imports from States ($B)
Missouri receives the highest dollar value of truck shipments from the central and eastern part of the U.S. with Kansas, Illinois, and Tennessee delivering a large portion of those commodities. West Virginia is a major truck and water intermodal shipper which transfers fuel oil to Missouri. Michigan ($2.1B) along with California, Indiana, and Washington top the list of intermodal truck and rail shippers to Missouri.
Origin Value($bil)
Kansas 15.15
Tennessee 13.68
Illinois 13.14
Indiana 7.63
Ohio 4.98
New York 4.72
Michigan 4.46
Texas 4.42
Wisconsin 4.15
Iowa 3.91

Missouri Economic Research and Information Center
Missouri’s Truck Imports from States (Kilotons)
Missouri receives the highest tonnage of commodities by truck from the central part of the U.S. Kansas ships the highest tonnage to Missouri, mainly in the form of sand, mixed freight, and gravel. West Virginia is also the top truck and water intermodal shipper to Missouri by tonnage. Michigan, Kansas, and Ohio top the list of intermodal truck and rail shippers to Missouri.
Origin Tons (thous)
Kansas 20,279
Illinois 14,224
Oklahoma 3,213
Iowa 2,985
Indiana 2,929
Arkansas 2,742
Texas 2,443
Tennessee 1,719
Nebraska 1,676
Ohio 1,519

Missouri Economic Research and Information Center
Missouri’s Top Truck Commodity Shipments to States
Over $162 billion in Missouri commodities are shipped by truck only modes. Higher value shipments average 192 miles to destination while higher tonnage shipments average 86 miles. Pharmaceuticals, mixed freight, and chemicals make nearly 22% of the total value of Missouri commodities shipped by truck. These high dollar commodities predominantly move to the surrounding states and east. Gravel, nonmetallic minerals, and prepared foodstuff make up 47% of the total tonnage shipped from Missouri with the majority of tons staying in the central region.
Truck Shipments within Missouri

Missouri Economic Research and Information Center
Top Missouri Commodities Shipped to States
MO Commodities Value($bil)
Pharmaceutical products 12.77
Mixed freight 11.75
Chemical products and preparations, nec 10.60
Motorized and other vehicles (including parts) 9.66
Other prepared foodstuffs and fats and oils 9.30
Miscellaneous manufactured products 9.21
MO Commodities Tons (thous)
Gravel and crushed stone 70,035
Nonmetallic mineral products 28,911
Other prepared foodstuffs and fats and oils 9,864
Wood products 6,986
Fuel oils 6,132
Animal feed and products of animal origin, nec 5,905
Missouri’s Intermodal Shipments to States Missouri truck and water intermodal shipments account for $149 million and 5.1 million tons of which are made up of primarily Machinery, Waste/Scrap, Sand, and Chemicals. This mode averages 1,760 miles to destination. Missouri truck and rail intermodal shipments account for $5.3 billion and 5.9 million tons. Motorized vehicles and parts, paper/paperboard articles, and machinery constitute over 55% of the total value of shipments. Waste/scrap, motorized vehicles and parts, and chemical products represent the commodities with the highest tonnage shipped by this mode. This mode averages 795 miles to destination.
Missouri Economic Research and Information Center
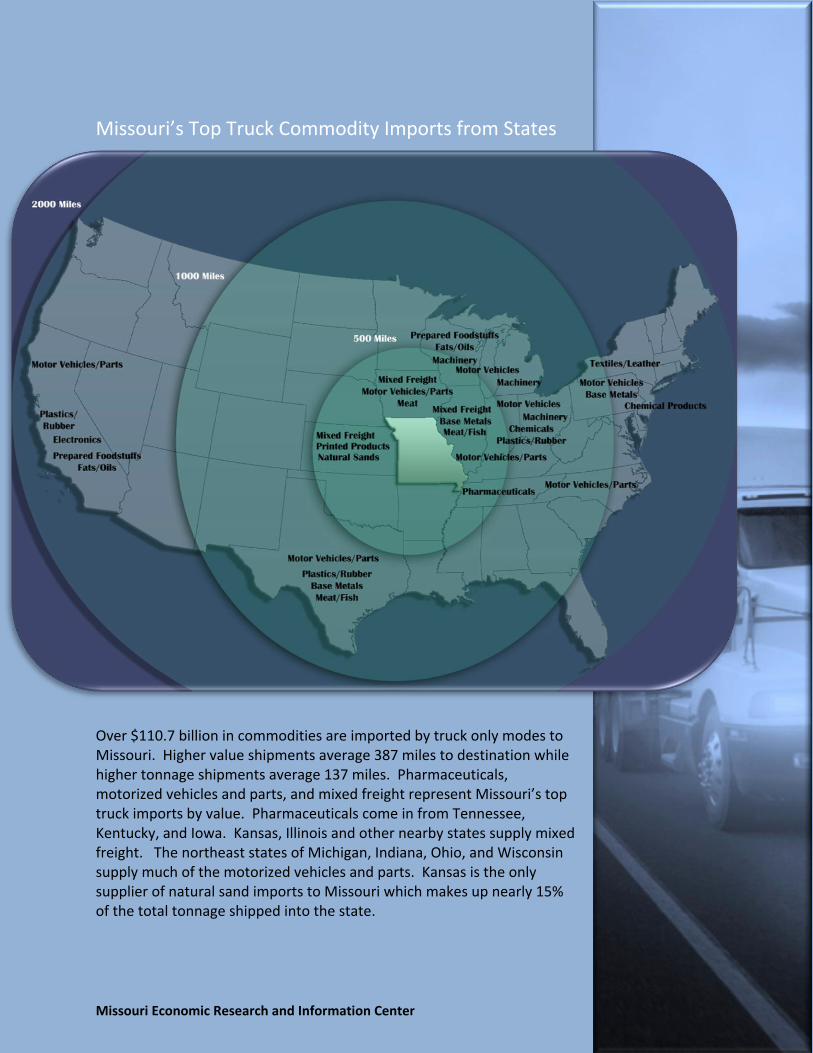
Missouri’s Top Truck Commodity Imports from States
Over $110.7 billion in commodities are imported by truck only modes to Missouri. Higher value shipments average 387 miles to destination while higher tonnage shipments average 137 miles. Pharmaceuticals, motorized vehicles and parts, and mixed freight represent Missouri’s top truck imports by value. Pharmaceuticals come in from Tennessee, Kentucky, and Iowa. Kansas, Illinois and other nearby states supply mixed freight. The northeast states of Michigan, Indiana, Ohio, and Wisconsin supply much of the motorized vehicles and parts. Kansas is the only supplier of natural sand imports to Missouri which makes up nearly 15% of the total tonnage shipped into the state.

Missouri Economic Research and Information Center
Top Missouri Commodities Imported from States
MO Imported Commodities Value($bil)
Pharmaceutical products 10.96
Motorized and other vehicles (including parts) 10.92
Mixed freight 8.22
Other prepared foodstuffs and fats and oils 5.73
Plastics and rubber 5.70
Machinery 4.64
MO Imported Commodities Tons (thous)
Natural sands 9654
Other prepared foodstuffs and fats and oils 4021
Nonmetallic mineral products 3199
Base metal 2715
Mixed freight 2638
Animal feed and products of animal origin, nec 2228
Missouri’s Intermodal Imports from States Missouri truck and water intermodal imports are made up of fuel oils, coal fertilizers, transportation equipment, base metals, and waste/scrap. This mode averages 917 miles to destination for fuel oils and 81 miles for coal. Origin states are mainly from the central region and West Virginia. Missouri truck and rail intermodal imports account for $7.4 billion and 3.4 million tons. Motorized vehicles and parts and base metals, mainly from Michigan and Indiana, constitute over 20% of the total value of shipments or $1.5 billion. Motorized vehicles and parts and nonmetallic minerals represent the commodities with the highest tonnage imported by this mode.

Missouri Economic Research and Information Center
Average
68 Miles
Value
$67.6 B
Tons
136.1 M
Shipments 5.4 M
Average
384 Miles
Value
$94.6 B
Tons
93.5 M
Shipments 3.7 M
For-Hire Trucking vs. Private Trucking Truck only shipments are further broken out by for-hire trucking and private trucking categories. These two classifications differ in many ways. For-hire trucking typically ships about 5.6 times further than private trucking and carries over 2 times the value per ton ($1,012 per ton). Private trucking shipments tend to deliver locally within Missouri or just across the state border with nearly 1.5 times the amount of annual shipments than for-hire trucks. Private trucks carry a slightly lighter shipment on average, but deliver 46% more tons of commodities as as whole. The top Missouri commodities by value differ for the two groups as well. For-hire trucks carry more pharmaceuticals ($11.8 B), chemicals ($8.8 B), miscellaneous manufactured products ($7.0 B), machinery ($6.5 B), and electronics ($6.1 B). Private trucks carry more mixed freight ($8.7 B), motorized vehicles and parts ($4.9 B), fuel oils ($4.7 B), plastics/rubber ($3.8 B), and gasoline ($3.8 B). Top commodites by tonnage differ very little between the groups, however private trucks carry a much higher volume of gravel and nonmetallic mineral products.
For-Hire Trucking
Private Trucking

Missouri Economic Research and Information Center
Rural Town
Interstate
Rail Hubs
Distribution
Centers
Urban Centers
Ports
Airports
Transportation Enhancements – Truck Freight Scenario: Rural Business Attraction
Investment in transportation infrastructure can reap many positive benefits for industry and consumers alike. Road enhancements, even in rural locations, can increase access to resources and attract businesses and labor to the area. A sample study performed in a rural Missouri community examined the effect of a road improvement which would increase the average truck speed by 10 mph between the community and the nearest urban center. Results from the transportation model estimated a direct impact of $3.2 million (0.2% increase to communtiy output) from potential business attraction and an additional $6.7 million in indirect and induced purchases over the life of the project.

Missouri Economic Research and Information Center
Sources U.S. Census, American Fact Finder Commodity Flow Survey Regional Economic Models Incorporated TREDIS Transportation Modeling United States Railroad Retirement Board U.S. Bureau of Labor Statistics, Quarterly Census of Employment and Wages
Note
The recent release of the American Fact Finder Commodity Flow Survey
by the U.S. Census describes the values, tonnage, and distance of state to
state shipments. The information updates a 2002 survey and includes
detailed estimates by modal activity (truck/barge/rail), commodity, and
industry. Intermodal activities (ie. truck and water, truck and rail) are
also estimated using this survey. While origins and destinations are cited
in this report, data collection limitations measure the origin of movement
and may not represent the commodity origin of production or final
destination of the commodity.
Prepared by Tony Brite