truck, tractor/traller braking system performance - deep blue: home
TRANSCRIPT

Sunupy Final Report , Contract FH-11-7290
January 1970
BUS, TRUCK, TRACTOR/TRAlLER BRAKING SYSTEM PERFORMANCE
Ray W. Murphy Rudolf Limpert Leonard Segel
Highway Safety Research Institute The university of Michigan Ann Arbor
for National Highway Traffic Safety Administration U.S. Department of Transportation
The opinions, finding, and conclusions expressed in this publication are those of the authors and not necessarily those of the National Highway Traffic Safety Administration.


1 . Report No. 2. Government Accession No. 3. Recipient's Catalog No.
I 4 . Title and Subtitle
7 . Author(s) 1 8. Performing Organnation Report No.
5 . Report Date
BUS, TRUCK, TRACTOR-TRAILER BRAKING SYSTEM PERFORMANCE
March 1971 6 . Performing Organization Code
Highway Safety Research Institute University of Michigan Huron Parkway & Baxter Road Ann Arbor, Michigan 48105
R.W. Murphy, R. Limpert, L, Segel 9. Performing Organization Name and Address
1 2 . Sponroring Agency Name and Address
PF-lOla
10. Work Unit No.
National Highway Traffic Safety Administration U.S. Department of Transportation Washington, D.C. 20591
1 1 . Contract or Grant No.
FH-11-7290
1 3 . Type of Report and Period Covered
Summary Final Report 7/69 - 3/71 14. Sponsoring Agency Code
1 5 . Supplelnentary Notes
16. Abstract
The objectives of this study were to determine the range of braking per- formance currently exhibited by buses, trucks, and tractor-trailers and to establish the maximum braking performance capabilities of these vehicles based upon full utilization of the technology related to brake system design. Both vehicle testing and ana,lytical techniques, including dynamic modeling and simulation, were used to accomplish these objectives. Performance mea- sures were defined which serve to quantify the degree to which a. given vehicle-braking system possesses those qualities necessary for adequate braking performance. Using these measures, a braking performance standard is recommended based upon a comparative analysis of (1) current braking perfor- mance, (2) the maximum performance achievable by full exploitation of exist- ing technology, and (3) performance a,s constrained by a host of associated factors.
I Unclassified I Unclassified I I Form DOT F 1700.7 (8-69)
17. Key Words brake performance, brakes, brake systems, trucks, buses, tractor- trailers
18. Dlstribution Statement
Availability is unlimited. Docu- ment may be released to the Clear- inghouse for Federal Scientific In- formation, Springfield, Virginia; 32151. f o r sale to the n u .
19. Security Claasif.(of t h ~ , report) 20. Security Class~f.(of this page) 21. No. of Pages 22. Price


ACKNOWLEDGMENTS
The authors wish t o acknowledge t h a t many indiv idua ls and organizat ions made outstanding cont r ibu t ions t o t h i s program, not only by supplying vehi- c l e s and t echn ica l da ta , bu t a l s o by providing t echn ica l ass i s tance .

TABLE OF CONTENTS
Page
LIST OF TABLES
LIST OF FIGURES
ABSTRACT
1.0. INTRODUCTION
1.1. Statement of the Problem 1.2. Objectives
2.0. SUMMARY OF TASKS
2.1. L i t e r a tu re Review 2.2. Vehicle-Brake System Performance Tests 2.3. Analy t ica l Program 2 . . Recommenda.tions f o r a Safety Standard
3.0. RESULTS
3.1. Test Resul ts , Baseline Vehicles 3.1.1. Brake e f fec t iveness t e s t s 3.1.2. Brake f a i l u r e t e s t s 3.1.3. Fade and recovery t e s t s 3.1.4. Brake r a t i n g t e s t s 3.1.3. Brake response time t e s t s 3.1.6. System f a i l u r e s
3.2. Test Resul ts , Vehicles Equipped With Advanced Systems 3.2.1. Truck equipped with d i sc brakes 3.2.2. Tra ,c tor - t ra i le rs equipped with advanced
sys terns
3.3. Test Surfaces and Tire-Road In te r face Tests 3.4. Analyt ica.1 Results
3.4.1. Braking performance 3.4.2. Proportioning schemes
4.0. RECOMMENDATIONS
4.1 . Performance Measures 2 Maximum Achievable Performance 4.3. Recommendations f o r a, Standard
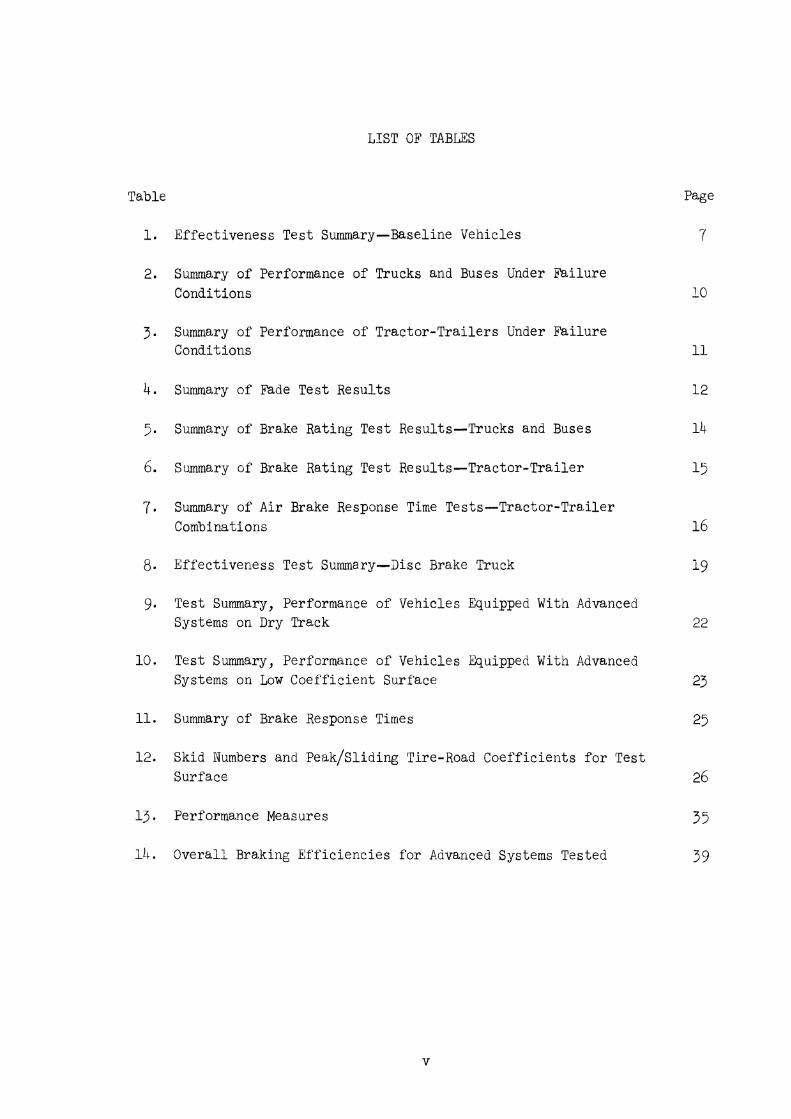
LIST OF TABLES
Table
1. E f f e c t i v e n e s s Tes t Summary-Baseline Vehicles
2. Summary of Performance of Trucks and Buses Under F a i l u r e Condi t ions
3. Summary of Performance of T r a c t o r - T r a i l e r s Under F a i l u r e Condi t ions
4. Summary o f Fade Tes t Resu l t s
3. Summary of Brake Rat ing Tes t Results-Trucks and Buses
6. Summary of Brake Ra.ting Tes t Resu l t s -Trac to r -Tra i l e r
7 . Summary of A i r Brake Response Time Tes t s -Trac to r -Tra i l e r Combinations
8. E f f e c t i v e n e s s Tes t Surmary-Jisc Brake Truck
9. Tes t Summary, Performance of Vehicles Equipped With Advanced Systems on Dry Tra.ck
10 . Tes t Summary, Performance o f Vehicles Equipped With Advanced Systems on Low C o e f f i c i e n t Surface
11. Summary of Brake Response Times
2 Skid Numbers and peak/s l id ing Tire-Road C o e f f i c i e n t s f o r Tes t Sur face
13. Performa.nce Measures
lit. O v e r a l l Bra.king E f f i c i e ~ c i e s f o r Advanced Systems Tested
Page
7

LIST OF FIGURES
Figure
1. Interrelationship of project tasks and subtasks.
2. Maximum deceleration capability, baseline vehicles.
3. Effectiveness test results, disk brake truck.
4. Braking performance diagram for 2-S1 tractor-trailer.
5. Braking efficiency for 2-S1 tractor-trailer.
Page
5
8
18
28
29
6. Maximum deceleration performance ranges, baseline and ad- vanced systems. 37
7 . Improvement in maximum deceleration performance with ad- vanced systems. 3 8
8. Deceleration-pedal force gain for disk brake truck and HSRI recommended limits. 41

1 .0 INTRODUCTION
This r e p o r t p resents f indings, conclusions, and recommendations derived by the Highway Safety Research I n s t i t u t e (HSRI) of The Universi ty of Michiga,n
i n a research program f o r the National Highway Traf f ic Safety Administration (NHTSA) e n t i t l e d , "BUS, Truck, Trac tor -Tra i le r Braking System Performance Study. " The broad objec t ives of t h i s program a r e the formulation of techniques and the production of da ta designed t o a id NHTSA i n f u l f i l l i n g i t s mandate t c i s sue reasonable and des i rab le s a fe ty standards.
1.1 STATEMENT OF THE PROBLEM
The complex r e l a t ionsh ip between cur ren t braking c a p a b i l i t i e s of commer- c i a l vehic les and the frequency of accidents with these vehicles due t o def i - c ienc ies i n braking performance i s ne i the r completely understood nor s t a t i s - t i c a l l y documented. There i s , nevertheless , ample i n t u i t i v e bas i s t o hypoth- e s i z e t h a t such a r e l a t i o n s h i p e x i s t s a.nd, f u r t h e r , t h a t t he re a r e c e r t a i n s p e c i f i c vehicle braking performance c h a r a c t e r i s t i c s which, during e i t h e r t he normal dr iv ing process o r emergency s i t u a t i o n s , cause t h e p o t e n t i a l f o r l o s s of cont ro l t o r i s e above a threshold beyond which even the s k i l l and experi- ence of the profess iona l d r ive r a r e of l i t t l e a v a i l . It i s known t h a t t he braking performance of buses, t rucks , a,nd t r a c t o r - t r a , i l e r s va,ries s i g n i f i - ca.ntly over a. wide range, and i s , on the avera.ge, l e s s than tha,t f o r passen- ger ca,rs , and c e r t a i n l y l e s s than the ma,ximum performance a.chieva.ble. Thus it can be argaed t h a t t h i s performance d i f f e r e n t i a l , i f g r ea t enough, can c o n s t i t u t e a s i g n i f i c a n t s a fe ty haza,rd s ince a l l vehic le types a r e subjected t o t h e same t r a f f i c and phys ica l environments. The performance demands of these environments a.nd t h e integra, t ion of vehic le types wi th in tile environ- ments i nd ica t e a need f o r uniform a.nd higher bra.king performance l e v e l s t o be achieved by commercia,l vehic les . The study described herein addresses t h i s need by fccusing on t h e establishment of braking system performance require- ments f o r buses, t rucks , and t r a c t o r - t r a i l e r s ,
1 . 2 OBJECTIVES
The s p e c i f i c ob jec t ives of t h i s study a r e t h ree fo ld :
.To determine, by mea,ns of vehic le t e s t i n g , t he range of braking performance cu r ren t ly exhibi ted by buses, t rucks , and t r a c t o r - t r a i l e r s .
.To e s t a b l i s h t h e maximum braking performance c a p a b i l i t i e s of these vehic les based on f u l l u t i l i z a t i o n of t he technology

r e l a t ed t o brake system design.
.To recommend a r a t i o n a l braking performance standard based upon a comparative ana lys is of (1) cur ren t braking performance, (2) t h e maximum performance achievable by f u l l exp lo i t a t i on of e x i s t - ing technology, and (3) performance a s constrained by a hos t of assoc ia ted f ac to r s .

2 .0 SUMMAEY OF TASKS
I n order t o meet the objec t ives of t h i s program, four major e~pe r i rnen ta~ l a.nd analyt ica.1 t a sks were ca r r i ed out .
2.1 LITERATURE REVIEW
The fore ign and domestic l i t e r a t u r e was surveyed with t h e objec t ive of f ind ing information pe r t i nen t t o accurate analyses of braking systems, exper- imental t e s t procedures, and mea.ns of measuring and evaluat ing the braking performance of buses, t rucks , and t r a c t o r - t r a i l e r s . Factors considered i m - por tan t i n the review were brake system design, braking performance, brake usage, brake t e s t i n g , brake f a i l u r e , and performance standards.
2.2 VEHICLE-BRAKE SYSTEM PERFORMANCE TESTS
I n order t o determine t h e braking performance c a p a b i l i t i e s of vehic les equipped with standard braking systems, t h ree i n t e g r a l t rucks , t h ree buses, and four t r a , c t o r - t r a i l e r combinations were subjected t o a s e r i e s of e f fec- t iveness , fade and recovery, and brake r a t i n g t e s t s . So t h a t t he improvement i n performance through use of more e f f e c t i v e brakes and advanced braking sys- tems could be determined, t h ree add i t i ona l vehic les were t e s t e d , namely:
1. An i n t e g r a l t ruck equipped with d i sk bra,kes a.nd a f u l l power hydraul ic brake ac tua t ion system.
2. A t r a c t o r - t r a i l e r equipped with proportioning valves, ada,ptive braking system,* and t r a i l e r bra.ke s~ynchronization device.
3. P. t r a c t o r - t r a , i l e r equipped with a. wheel an t i l ock system.**
The d i sk brake t ruck was subjected t o e f fec t iveness , fade and recovery, and brake r a t i n g t e s t s , while t he two t r a c t o r - t r a i l e r vehic les were t e s t e d pr imar i ly f o r e f fec t iveness and minimum stopping capab i l i t y .
*Designation used throughout t h i s r epo r t f o r t he system developed by Bendix- Westinghouse.
**Designation used throughout t h i s r epo r t f o r t he system developed by Eaton, Yale, and Towne.

2.3 ANALYTICAL PROGRAM
The analytical study was directed toward establishing mathematical and computation procedures for predicting braking performance based upon vehicle and braking system design factors. Analysis of the performance of several of the test vehicles demonstrated the feasibility of making accurate predictions of brake effectiveness, braking efficiency, pedal force gain, and thermal response. Dynamic modeling and simulation were employed to determine the extent to which vehicle braking performance can be improved with increased effectiveness, refinements in brake torque distribution, and load and decel- eration sensitive proportioning systems.
2.4 RECOMMENDATIONS FOR A SAFETY STANDARD
Based upon the results of the three aforementioned tasks, performance requirements are suggested which would effectively upgrade the braking per- formance of these vehicles to a level approaching that of passenger cars. Procedures and tests for ensuring compliance with the requirements are also suggested.
The interrelation of the tasks and important subtasks is shown in block diagram form in Figure 1.


3.0 RESULTS
3.1 TEST RESULTS, BASELINE VEHICLES
The t e s t r e s u l t s f o r the t en basel ine vehicles (veh ic l e s equipped with standard braking systems) a r e summarized i n t h i s section. For spec i f i c d e t a i l s on vehicle spec i f i ca t ions and the r e s u l t s of each ind iv idua l t e s t , the reader i s re fer red t o the F ina l Report volume.
3.1.1 Brake Effect iveness Tests
The vehicles were t e s t e d f o r brake effect iveness , i n the loaded and empty condit ion t o the point of wheel lockup i f the brakes had s u f f i c i e n t torque capacity. I f the behicle remained s t ab l e beyond the point of f i r s t wheel lockup, pedal fo rce was increased t o lock up a s many wheels a s possible. Resul ts f o r a l l the e f fec t iveness t e s t s a r e summarized i n Table 1, and a graph- i c a l summary of the dece lera t ion c a p a b i l i t i e s of the base l ine vehicles i s given i n Figure 2,
The average maximum dece lera t ion achieved (without wheel lock occurring) with the t e s t ed t rucks i s 15.5 f t / s e c 2 i n the empty condit ion and 17.0 f t / s e c 2 i n the loaded condition. I f wheel locking i s permitted, t he f i gu res become 19.2 and 17.7 f t / sec2 , respect ively. These r e s u l t s show t h a t brake torque capaci ty has been proportioned t o give bes t performance f o r t h e loaded condi- t i on .
For t he t e s t buses, the average maximum decelerat ion, wheels unlocked, i s 18.5 f t / s ec2 empty and 19.9 ft,/sec2 loaded, with the performance of t he empty buses increas ing t o 2'1.7 f t / sec2 , when some wheels a r e locked. It should be noted t h a t i t was impossible t o lock wheels on any of the buses when f u l l y loaded.
For t he t r a c t o r - t r a i l e r s t e s t ed , the average maximum decelerat ion, wheels unlocked, i s 15.0 f t / s ec2 empty and 16.5 f t / s ec2 loaded, with the performance empty increas ing t o 19.4 f t / s e c 2 when wheels a r e locked.
Although the t rucks exhib i t a wide range i n performance, t he loaded buses exh ib i t uniform performance. A r a t h e r remarkable va r i a t i on i n performance i s noted f o r t he t r a c t o r - t r a i l e r combinations, notwithstanding the f a c t t h a t t h e same t r a c t o r was used i n two of the combinations (2-S1 and 2-52) and the same t r a i l e r was used i n two combinations (2-S2 and 3 - ~ 2 ) .
Overall , the t e n vehicles achieved an average maximum decelerat ion, wheels unlocked, of 16.5 f t / sec2 , empty, and 17.7 f t / sec2 , loaded, and 19.4 f t / s ecP ,
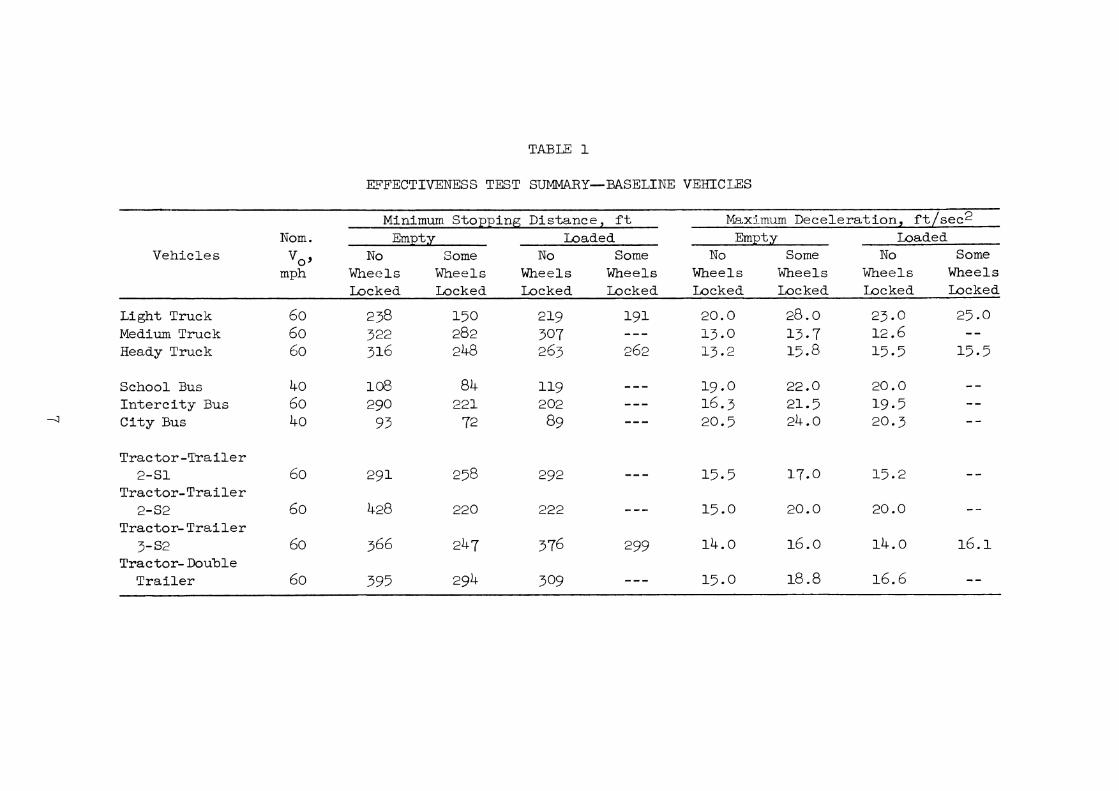
TABLE 1
EFFECTIVENESS TEST SUMMARY-BASELINE VEHICLES
Minimum Stopping Distance, f t ry'iximm Deceleration, f t / s ec2 Nom . Empty Loaded Empty Loaded
Vehicles vo J No Some No Some No Some No Some
mph Wheels Wheels Wheels Wheels Wheels Wheels Wheels Wheels Locked Locked Locked Locked Locked Locked Locked Locked
Light Truck 60 2 38 150 219 191 20.0 28.0 23 . O 25.0 Medium Truck 60 322 282 307 --- 13.0 13.7 12.6 - - Heady Truck 60 316 248 263 262 13.2 17.8 15.5 15.5
School Bus 40 108 84 119 --- l g . O 22.0 20.0 -- I n t e r c i t y BUS 6 o 290 221 202 --- 16.3 21.5 19.5 - -
-4 City Bus 40 9 3 72 89 --- 20.5 24.0 20.3 - -
Tractor -Tra i le r 2-s1 60 291 258 292 -- - 15.5 17.0 15.2 - -
Tractor-Trai ler 2-s2 60 428 220 222 --- 15.0 20.0 20.0 - -
Tractor- T r a i l e r 3- s2 60 366 247 3 76 299 14.0 16. o 14.0 16.1
Tractor- Double T r a i l e r 60 395 294 309 - - - 15. 0 18.8 16.6 - -


empty, and 18.1 f t / s e c 2 loaded, i f some wheels a r e permitted t o lock during the stop. The measured range of performance i s g r e a t e s t f o r t he t rucks (12.6 t o 28.0 f t / s e c 2 ) and l e a s t f o r the t r a c t o r - t r a i l e r s (14.0 t o 20.0 f t / s ec2 ) . Bus performance ranged from 16.3 t o 24.0 f t / sec2 .
It should be noted t h a t seven out of the t e n vehicles , when t e s t ed i n the loaded condit ion, did not have s u f f i c i e n t torque capaci ty t o lock up any wheels on the sur face used i n t h i s t e s t program. It should a l s o be pointed out t h a t seven of the t en vehicles , when empty, could not exceed t h e performance of t h e loaded vehicle without locking up some wheels, which locking causes e i t h e r l o s s of s t e e r i n g con t ro l or may lead t o l a t e r a l i n s t a b i l i t y .
3.1.2 Brake Fa i lu re Tests
The brake f a i l u r e modes selected f o r t e s t depended upon the design of t h e brake system, In the l i g h t t ruck, t h ree f a i l u r e modes were possible: f r o n t hydraul ic l i n e f a i l u r e , r e a r hydraul ic l i n e f a i l u r e , and power boost f a i l u r e . The medium t ruck was not designed with separate f r o n t and r e a r brake systems, and thus t h i s vehicle was t e s t ed only with the power boost f a i l u r e . The heavy t ruck and the c i t y bus, each equipped with a i r brakes, did not con- t a i n an emergency system except f o r t he mechanical hand brake at tached t o the d r ive shaf t . The school and i n t e r c i t y buses had, however, separate emergency brake systems, which, when actuated under f a i l u r e of t he serv ice brake system, supplied a i r pressure t o t he r e a r brakes. An opening of t he r e a r door of t he c i t y bus a l s o actuated the r e a r brakes through the normal serv ice system. A summary of t e s t r e s u l t s obtained with the t rucks and buses i n each of t he f a i l u r e modes t e s t e d i s given i n Table 2.
Decelerat ion performance was measured on t r a c t o r - t r a i l e r combinations i n t e s t s conducted a t 20 mph i n which brake f a i l u r e was simulated by opening the t r a i l e r emergency air l i n e a t the t r a c t o r pro tec t ion valve. It was not con- s idered p r a c t i c a l t o conduct these t e s t s from 60 mph because of t he s t rong p o s s i b i l i t y t h a t damage t o t he suspension and brake supporting s t r u c t u r e would r e s u l t from such a severe brake appl ica t ion a t high speed. Two of the t r a c t o r s were equipped with spring brakes. These brakes were a l s o t e s t ed from 23 mph. Resul t s obtained f o r the combinations i n t he empty and loaded condit ions a r e given i n Table 3.
3.1.3 Fade and Recovery Tests
Table 4 summarizes t h e f ind ings obtained i n t h e fade and recovery t e s t s conducted on the base l ine vehicles . The fade t e s t procedure spec i f ied t h a t a l l vehic les be decelerated from t e s t speed a t 15 f t / s ec2 ( o r the maximum de- c e l e r a t i o n a s determined from the e f fec t iveness t e s t i f the vehicle could not

SUMMARY OF PEW'ORMANCE OF TRUCKS AND BUSES UNDER FAILURE CONDITIONS
Vehicles Type of F a i l m e Brakes Used Vo, Max. Decel., f t / s e c 2 Min. Stopping D i s t . , f t mph Empty Loaded Empty ~ o a d e d
Trucks Light
Medium Heavy
P 0
Buses School I n t e r c i t y Ci ty
Front Brakes Rear Brakes Power Boost { Power Boost Service Brakes
Service Brakes Service Brakes
Rear Brakes Only Fron t Brakes Only Serv ice Brakes Serv ice Brakes Hand Brake
knergenc y Emergency Hand Brake Rear Brakes
-- -
*Indicates lock-up of one o r more wheels.

SUYMARY OF PERFOMNCE OF TRACTOR-TRAILERS UNDEB FAILURE CONDITIONS
Maximum Minimum vo 9
Loading Vehicles Type of Fa i lu re Brakes Used Decel., Stopping Wheel Lockup
mph Condition f t / s e c 2 Di s t . , f t
2-Sl Opening T r a i l e r Emergency A i r Line T r a i l e r 2 0 Empty 6.5 9 4 Both T r a i l e r Wheels
Opening T r a i l e r Emergency A i r Line T r a i l e r 20 Loaded 7.5 85 None
2-S2 Opening T r a i l e r Emergency A i r Line T r a i l e r 20 Empty 9 5 70 A l l T r a i l e r Wheels
Opening T r a i l e r Left Tandem, Right Emergency A i r Line T r a i l e r 20 Loaded 12.0 4 5 Rear
P P 3-S2 Opening T r a i l e r
Emergency A i r Line T r a i l e r 20 Empty 7.0 102 A l l T r a i l e r Wheels
Opening T r a i l e r Left Tandem, Right Emergency A i r Line T r a i l e r 20 Loaded 9.0 100 Tandem
Service Sys tern Trac tor Spring Brakes 20 Empty 8.0 8 3 A l l Trac tor Drive Wheels
Service System Trac tor Spring Brakes 20 Loaded 6.2 110 None
2-S1-2 Opening T r a i l e r Right Front and Le f t
Emergency A i r Line T r a i l e r 20 Empty 13.3 48 Rear On F u l l T r a i l e r
Opening T r a i l e r Emergency A i r Line T r a i l e r 2 0 Loaded 7.8 9 1 None
Service System Trac tor Spring Brakes 20 Empty 5 . 4 100 Both Rear T rac to r Wheels
Service System Trac tor Spring Brakes 20 Loaded 3.2 155 None

TABLE 4
SUMMARY OF FADE TEST RESULTS
Tes t Numb e r Veloci ty Average Average Highest Vehicles Decel., of Snubs ~ n i t i a l / F i n a l , A t P e l , A t l m 2 > Lining Temp. , Hottes t Brake
f t / s e c 2 Achieved sec sec sec OF
Trucks Light 1 5 12 60110 5 - 9 5 5 520 Left Rear Medium 12 3 60/10 7 - 5 125 335 Right Rear Heavy 14 5 60110 5.2 213 405 Left Tandem
Buses School 15 9 4 0 1 1 ~ 5.9 29 445 Left Front
I n t e r c i t y 15 9 60/10 6 .3 85 600 Left Drive I-J rc Ci ty 15 10 40110 3 .4 48 315 Right Front
Tractor-Trai lers 2-Sl 15 10 5o/lo 5.6 222 390 Lef t Rear Tractor
2-S2 15 10 45/10 4 - 3 l o 5 380 Lef t Rear Tractor 3- ~2 14.5 10 50/10 5 - 3 157 405 Right Rear Tractor 2- Sl- 2 12.0 10 50/10 7 .0 144 460 Left Rear Tractor
A t 2 - l i s t he time from i n i t i a l brake pedal app l i ca t i on a t i n i t i a l v e l o c i t y t o brake pedal r e l ea se a t lower snub veloci ty .
A t l - 2 i s the acce le ra t ion time from lower snub ve loc i t y back t o i n i t i a l t e s t ve loc i t y .

achieve 15 f t / s e c 2 ) t o 1 0 mph and a c c e l e r a t e d a s r a p i d l y a s p o s s i b l e back t o t e s t speed, t h e snubs con t inu ing u n t i l t h e spec i f i ed d e c e l e r a t i o n l e v e l could no longer be maintained. The recovery t e s t a s s p e c i f i e d i n SAE 5786 was con- ducted immediately a f t e r t h e f a d e t e s t .
I n conducting t h e f a d e t e s t on t h e c i t y bus and t h e t r a c t o r - t r a i l e r s , i t soon became obvious t h a t t h e s p e c i f i e d procedure would n o t f ade t h e brakes even a f t e r t e n snubs. The t e s t s were terminated a t t h i s po in t . The t e s t pro- cedure a l s o proved i m p r a c t i c a l i n t h a t it was n o t p o s s i b l e t o mainta in t h e requ i red 15 f t / s e c 2 d e c e l e r a t i o n on t h e 3-S2 t r a c t o r - t r a i l e r combination o r on t h e doubles combination because of i n c i p i e n t wheel lockup.
3.1.4 Brake Rat ing Tes t s
The procedure s p e c i f i e d f o r t h i s t e s t , r equ i red t h a t t h e t e s t veh ic le be towed on a f l a t su r face a t a cons tan t v e l o c i t y wi th brakes app l ied a t a l i n e p r e s s u r e equ iva len t t o t h a t r equ i red t o mainta in cons tan t v e h i c l e v e l o c i t y on a 7% descending grade. The v e h i c l e was t o be towed with l i n e p r e s s u r e held c o n s t a n t u n t i l t h e towbar f o r c e a s measured by a load c e l l i n t h e towbar de- c reased (due t o f a d e ) by 15%. The towing f o r c e over t h e d u r a t i o n of t h e t e s t was averaged, t h e r o l l i n g r e s i s t a n c e sub t rac ted , and t h e average braking f o r c e c a l c u l a t e d , from which t h e energy absorp t ion r a t e of t h e brake (horsepower) and t h e t o t a l energy absorbed were determined. Two measures were formulated f o r r a t i n g t h e brakes. The f i r s t measure i s based on horsepower and l i n i n g a r e a g i v i n g some i n d i c a t i o n of t h e r a t e of ecergy absorp t ion , t h e second i s based upon t o t a l energy absorbed and t h e weight of t h e veh ic le . A summary of t e s t d a t a f o r t h e t r u c k s and buses i s given i n Table 5 and f o r t r a c t o r s and t r a i l e r s i n Table 6.
3.1.5 Brake Response Time T e s t s
To measure t h e brake response t ime of t h e t r a c t o r - t r a i l e r combinations p r e s s u r e t r ansducers were f i t t e d t o t h e output of t h e b rake-con t ro l ( t r e a d l e ) va lve , and a t each a x l e of t h e v e h i c l e on which brakes were mounted, except only one t ransducer was mounted a t a tandem ax le . Resu l t s of t h e response- t ime t e s t s a r e summarized i n Table 7 both f o r a p p l i c a t i o n and r e l e a s e .
The brake a p p l i c a t i o n t imes shown i n Table 7 were measured from t h e i n s t a n t p r e s s u r e s t a r t e d t o r i s e a t t h e output of t h e t r e a d l e valve t o t h e i n s t a n t a t which t h e p r e s s u r e reached 60 p s i a t a given axle .* Rel?ase t imes were measured
"Thi d e f i n i t i o n i s s l i g h t l y d i f f e r e n t from t h a t g iven i n SAE 5982, which s p e c i f i e s t h a t a p p l i c a t i o n t ime be meamred "from t h e s t a r t of pedal movement t o a p r e s s u r e bui ldup of 60 p s i . "

TABLE 5
SUMMARY OF BWKE FLAYING TEST RESULTS-TRUCKS AND BUSES
Vehicle Tes t Tes t Average Power/ ~ n e r ~ ~ / Maximum Hot t e s t Vehicles Weight, Velocity, Duration, Brake Power, Lining Area, Weight, Brake Temp.,
h p / f t 2 f t - l b / l b OF Brake
l b mph sec hp
Trucks. Light 10,732 45 165 66.5 28.7 563 470 Lef t Front Medium 25,500 22 85 85.8 20.8 156 2 75 Right Rear Heavy 39, coo 23 90 146. 0 24.4 186 425 Lef t Tandem
Buses School 24,500 25 120 l o g . 0 32.0 293 466 Left Front I n t e r c i t y 35,940 23 195 151.0 19.9 451 435 Lef t Drive
P Ci ty 32,145 24 240 124.0 20.3 510 425 Lef t Front +-


from the i n s t a n t pressure began t o drop a t t he output of t he t r e a d l e valve t o t h e i n s t a n t a t which the pressure a t a given ax le dropped t o 5 ps i . These measurements i nd ica t e t h a t t he average response time f o r t h e r e a r ax le of t he t r a c t o r (when the t r a c t o r s were t e s t e d i n combination with a s emi t r a i l e r ) was 0.24 sec. Average response time f o r the ax le on the semi t r a i l e r s was 0.28 sec. Release times were considerably longer, averaging 0.55 sec f o r the r e a r ax l e on t h e t r a c t o r and 0.79 sec f o r t he ax l e on the semi t r a i l e r s . Applica- t i o n and r e l ease times were considerably longer on t h e doubles combination due t o the l a r g e r volumes of a i r t h a t had t o be moved through t h e system.
3.1.6 System Fa i lu re s
Several vehicle suspension and brake system f a i l u r e s occurred during the t e s t i n g of the base l ine vehicles . None of these f a i l u r e s was considered extraordinary s ince the vehic les and systems were subjected t o a s e r i e s of high l e v e l dece lera t ions t h a t generated s t r e s s e s and cyc les of s t r e s s not normally encountered i n service.
3.2 TEST RESULTS, VEHICLES EQUIPPED WITH ADVANCED SYSTEMS
3.2.1 Truck Equipped with Disc Brakes
The medium t ruck equipped with Bendix d isk brakes and f u l l power hydraul ic ac tua t ion system was subjected t o t he same s e r i e s of t e s t s a s the base l ine vehic les : e f fec t iveness , brake f a i l u r e , fade and recovery, and brake r a t ing . The r e s u l t s of the e f fec t iveness t e s t a r e given i n Figure 3. These da t a poin t up two important f a c t o r s :
1, The vehic le has a maximum dece lera t ion c a p a b i l i t y (w i th no wheels locked on the given t e s t sur face) of b e t t e r than 21 f t / s ec2 , t h i s performance being b e t t e r than nine of t he ten basel ine vehic les and considerably b e t t e r than both the medium or heavy truck.
2. The vehic le has the c a p a b i l i t y of locking up a l l fou r wheels i n t he loaded condit ion, demonstrating t h a t i t does have brake torque suf- f i c i e n t t o u t i l i z e t he f r i c t i o n a l fo rces i n the t i r e - road i n t e r f a c e t o a maximum extent .
With separa te ly powered f r o n t and r e a r brake systems, i t was possible t o f a i l e i t h e r system and maintain braking c a p a b i l i t y on one axle. Table 8 summarizes the minimum stopping d is tances and maximum dece lera t ions achieved i n t he brake e f fec t iveness and brake f a i l u r e t e s t s . Loss of the r e a r brakes decreases the maximum dece lera t ion c a p a b i l i t y of the empty vehicle by 35% and


of t h e loaded vehicle by 4376, while l o s s of t he f r o n t brakes decreases t h e maximum dece lera t ion c a p a b i l i t y by 47% and 43%, empty and loaded, respec t ive ly .
Two fade t e s t s were conducted on t h i s vehic le , with t he r e s u l t s demon- s t r a t i n g the superior fade r e s i s t a n c e of d i s k brakes. In t he f i r s t t e s t t he pedal fo rce required t o maintain 15 f t / s ec2 dece lera t ion from 60-10 mph increased from 47 l b on the f i r s t snub t o 65 l b on the 15th snub. In t he second t e s t t he pedal fo rce increased from 47 l b on the f i r s t snub t o 84 l b on t h e 15th snub. In both cases t he brake temperature, a s measured by thermo- couples i n t h e l i n i n g pads, was i n excess of 1270°F. To make a f a i r comparison with the r e s u l t s of t he base l ine vehic les , i t should be noted t h a t f o r the two t e s t s t he average snub dece lera t ion time was 5.8 sec and 5.7 sec and the average time t o acce lera te back t o t e s t speed was 76.4 sec and 81.8 sec.
In the hrake r a t i n g t e s t an average power input t o t he brakes of 91.3 hp was maintained f o r 670 sec with l e s s than 2w0 decrease i n brake fo rce a t a constant pedal pressure. The t e s t was terminated a f t e r 670 sec because, by t h i s time, the temperatures of a l l t he brakes exceeded 1200CF. In comparison with the base l ine vehic les , t h i s vehic le produced an energy and parer r a t i n g of 1215 f t - l b of thermal energy absorbed per pound of vehic le weight and 71.4 hp f o r square f o o t of l i n i n g , respec t ive ly .
3.2.2 Trac tor -Tra i le rs Equipped with Advanced Systems
For the two t r a c t o r - t r a i l e r combinations equipped with advanced systems, changes i n some of the t e s t procedures were made because the t e s t ob jec t ives were d i f f e r e n t from those of t h e other eleven vehicles . For example, i n t e s t i n g t h e While 6 x 4 t r a c t o r and the Fruehauf tandem ax le platform t r a i l e r ( h e r e i n a f t s r r e f e r r ed t o a s Vehicle #12), f i v e d i f f e r e n t vehic le and loading configurat ions were used, t h e e f fec t iveness of t he t r a c t o r f r o n t and r e a r brakes was var ied , and the aforementioned brake con t ro l systems, i . e . , : pro-
por t ion ingvalves , adapt ive braking, and t r a i l e r brake synchronization, were employed i n var ious combinations. The purpose i n t e s t i n g Vehicle #12 was t o determine the bes t braking performance which could be achieved using a standard t e s t vehic le , equipped with commercially ava i l ab l e brakes, and employing s t a t e - of - the-ar t brake con t ro l systems. The e f f ec t iveness of t h e t r a c t o r brakes was varied by changing the wedge angles and brake chambers on the f r o n t brakes, and t he s lack ad jus t e r lengths on the r e a r brakes. Five d i f f e r e n t vehicle and load configurat ions were t e s t e d using Vehicle #12, namely,
1. t r a c t o r - t r a i l e r , empty 2. t r a c t o r - t r a i l e r , loaded, high center of g rav i ty
3. t r a c t o r - t r a i l e r , loaded, low center of g rav i ty 4. t r a c t o r only, b o b t a i l conf igura t ion
5. t r a c t o r only, loaded t o gross ax l e weight r a t i n g

Pr io r t o commencement of t e s t s with Vehicle #12, the following advanced brake con t ro l systems were i n s t a l l e d :
*Proport ioning valves f o r the t r a c t o r r e a r brakes and t r a i l e r brakes, supplied by Borg-Warner.
*Adaptive braking system, with a sensor and c o n t r o l l e r mounted on each of t he t e n wheels of the combination t o prevent wheel lockup during braking, supplied by Bendix-Westinghouse.
T r a i l e r brake synchronization ( ~ y n c r o n ) system, which e f f ec t ive ly appl ies t he t r a i l e r brakes a s soon a s the t r e a d l e valve i s depressed, supplied by the Berg Manufacturing Company.
During the course of the t e s t program conducted with Vehicle #12, the bas ic a i r brake system of both the t r a c t o r and t r a i l e r was a l t e r e d by i n s t a l - l a t i o n of a high capac i ty brake con t ro l ( t r e a d l e ) valve, quick r e l ea se valves on each t r a i l e r brake ac tua tor , l a r g e r capaci ty l i n e s t o the f r o n t t r a c t o r brakes, and replacement of connectors, f i t t i n g s , and t e e s which tended t o r e s t r i c t a i r flow.
To evaluate t he braking performance of Vehicle #12 under various condi- t i o n s of loading and brake e f fec t iveness , a s modified by the various brake con t ro l systems and combinations of systems, 59 minimum-stopping-distance t e s t s * and f i v e e f fec t iveness t e s t s were conducted.
The l a s t vehic le t e s t ed i n the program was a t r a c t o r - t r a i l e r combination, furnished by Eaton, Yale, and Towne. This vehicle (he re ina f t e r designated Vehicle #14), a 4 x 2 Brockway COE t r a c t o r with an Arrow lowboy 35 f t t r a i l e r , was extensively modified f o r use i n development of the Eaton, Yale, and Towne wheel an t i l ock system, with which t h e vehicle was equipped. Three e f f ec t ive - ness t e s t s , f i v e minimum-stopping-distance t e s t s , and four brake response time t e s t s were conducted on Vehicle #14.
Summaries of the t e s t r e s u l t s f o r Vehicles #12 and #14 a r e given i n Table 9 f o r s tops on the dry surface and Table 10 f o r s tops on the low c o e f f i c i e n t surface. In Table 9 r e s u l t s from the e f fec t iveness t e s t s a r e a l s o included, a long with r e s u l t s from the d isk brake t ruck. ( A complete compilation of t h e da t a from t h e e f fec t iveness and minimum stopping d is tance t e s t s a r e included i n t he F i n a l Report volume. )
*In the minimum stopping d is tance t e s t the d r ive r was in s t ruc t ed t o apply maximum brake pedal force a s r ap id ly a s poss ib le t o s top the vehicle i n t he s h o r t e s t d i s tance from t e s t speed without locking up any wheels, Tests were conducted on both dry (h igh coe f f i c i en t ) and wet s l ippery (low c o e f f i c i e n t ) surf aces.


TABLE 10
TES'I SUMMARY, PERFORMANCE OF VEHICLE2 EQUIPPED WITH ADVANCED SYSTEMS O N M W COEFFICIENT SURFACE
( ~ l l Stopping Distances Corrected t o 60 mph I n i t i a l Test Veloc i ty)
Minimum Stopping Maximum Deceleration, Vehicles Distance, f t f t / s ec2
Empty Loaded Empty Loaded
Vehicle #12 Trac tor -Tra i le r Standard Brakes With Adaptive System
ana Syncron
Vehicle #12 Trac tor -Tra i le r Most Ef fec t ive Brakes with
Antilock and Syncron 476 550
Vehicle #12 Tractor Standard Brakes 8 74 With Proportioning 1194 With Adaptive System 510
vehic le # l 2 Tractor Most Ef fec t ive Brakes 1048 With Adaptive System 513
Vehicle #14 Trac tor -Tra i le r Standared Brakes 939 5 . 2 With Antilock 689 516 7.5 8 .2
Vehicle #12 Tractor With Antilock 655
For Vehicle #12 i n t he empty condit ion on the dry surface, using the standard braking system, wheels lockup on the leading ax le of t he t r a i l e r a t dece lera t ions a s low a s 17 f t / s ec2 . Maximum dece lera t ion c a p a b i l i t y of t he veh ic l e was 19.6 f t / s ec2 .
When using proportioning valves, wheels s t a r t e d t o lockup on the leading ax le of t he t r a i l e r a t dece lera t ions a s low a s 11.8 f t / sec2 . Lockup of wheels on any other ax les was prevented by use of the proportioning valves, but a t t h e expense of decreasing the maximum dece lera t ion c a p a b i l i t y t o 15.7 f t / s ec2 . It can be shown t h a t load t r a n s f e r within the two e l l i p t i c spr ing suspensions, such a s e x i s t s on the t r a i l e r of t h i s combination, causes t he leading ax le t o be more severely unloaded than the t r a i l i n g axle . Since one valve was used

t o proportion brakes f o r both axles , the s e t t i n g of the valve had t o be based on the average load car r ied by the suspension, which allowed premature lockup of the wheels on the leading axle.
Using the adaptive system, the maximum decelerat ion achieved was 18.9 f t / sec2 , a decelerat ion t h a t i s 96% of the maximum value obtained with the unaugmented vehicle i n stops t h a t included wheel lockups. Notwithstanding these moderately high decelerat ions with the empty vehicle , s t a b i l i t y problems were not encountered when the adaptive system was used. When the adaptive system was operat ional on the t r a c t o r with a proportioning valve used only on the t r a i l e r , wheel lock on the t r a i l e r leading axle was prevented up t o a decelerat ion of 18.1 f t / sec2 . For the empty combination, t h i s scheme proved t o be almost a s e f f ec t ive i n preventing wheel lock a s the f u l l y adaptive ( ant i lock) system. A maximum decelerat ion of 19.5 f t / s ec2 was achieved with lockup of th ree wheels on the t r a i l e r .
The e f fec t iveness t e s t conducted with the loaded vehicle a f t e r i n s t a l l i n g the most e f f ec t ive brakes specif ied f o r the program indicated a maximum decelerat ion capab i l i t y of 15.1 f t / s ec2 with lockup occurring on some wheels.
The following conclusions can be drawn from an examination of the da ta from the effect iveness and minimum stopping dis tance t e s t s on Vehicle #12:
1. For t he t r a c t o r - t r a i l e r combination, best performance ( a s measured both by stopping dis tance and maximum decelerat ion) was obtained when the adaptive system was used with the t r a i l e r brake synchronization system. This f inding holds f o r both wet and dry surfaces, and f o r both the empty and loaded vehicle.
2. Proportioning valves were not a s e f f ec t ive on the t r a c t o r - t r a i l e r combination a s would have been the case i f braking e f f o r t on the tandem axles of the t r a i l e r had been proportioned t o dynamic ax le load, i . e . : l e s s braking e f f o r t on the leading axle , and more braking e f f o r t on the t r a i l i n g axle.
The dry surf ace braking performance of the single-element t r a c t o r , both loaded and i n the bob ta i l configuration, was improved t o an equal degree by use of the proportioning valve or the adaptive system. On the low coe f f i c i en t surface, however, t he decelerat ion performance of the empty t r a c t o r was severely degraded by the proportioning valve, which device s e t the brake-line pressure r a t i o ( f r o n t t o r e a r ) a t 5 t o 1. I n these l a t t e r t e s t s , the l i n e pressure had t o be kept below 30 p s i t o prevent the f ron t wheels from locking on the low coe f f i c i en t surface. Since the proportioning valve kept t he pressures a t the r e a r brakes below 6 p s i , t h a t i s , a t or near the pushout pressure, the r e a r brakes did l i t t l e or no work i n these stops, r e s lu t ing i n low decelera- t i o n s and long stopping dis tances.

Results from the e f fec t iveness and minimum stopping dis tance t e s t s on Vehicle #14 ind ica ted t h a t t h i s vehic le was equipped with brakes capable of locking the wheels on a dry surface a t r e l a t i v e l y low l e v e l s of pedal force. In the loaded condition using the standard braking system the l e f t r ea r t r a c t o r wheel locked a t a decelerat ion of 14.0 f t / s ec2 on the dry surface. For t he same t e s t conducted with the an t i lock system operat ional , the vehicle achieved a maximum decelerat ion of 15.2 f t / sec2 . The empty combination was able t o achieve 14.8 f t / s ec2 with the an t i l ock system operat ional , while the t r a c t o r ( b o b t a i l configurat ion) was ab le t o achieve 19.0 f t / sec2 . On the low coef- f i c i e n t surface, use of the an t i lock system improved braking performance considerably.
A summary of r e s u l t s from brake response time t e s t s f o r Vehicles #12 and #14 i s given i n Table 11. Averaged r e s u l t s f o r the three basel ine t r ac to r - t r a i l e r combinations a r e included f o r comparison.
S U W R Y OF BRAKE RESPONSE TIMES
~ ~ ~ l i c a t i o n / ~ e l e a s e Time, sec Vehicles Tractor T r a i l e r
Rear Axle Rear Axle
Average Baseline Vehicles 0.24/0.55 0.28/0.79 #12 Standard System 0.27/0.30 0.40/0.70 # 12 with Syncron 0.27/0.30 0.30/0.40 #14 Standard System 0.23/0.36 0.36/0.64 #14 with Antilock 0.23/0.44 0.27/0.60
It should be noted t h a t on Vehicle #12, use of proportioning valves and/or t he adaptive system did not s ign i f i can t ly change the response times of the standard system. Syncron however improves ( i . e . , decreases) t r a i l e r brake appl ica t ion time by about 25% and r e l ease time by b e t t e r than 4%. On Vehicle #14, when the an t i l ock system i s used, l i t t l e change i s noted i n appl ica t ion response time, except on the r e a r ax le where the response time i s decreased s ign i f i can t ly , i . e . , from 0.36 t o 0.27 sec. L i t t l e change i s noted i n r e l ea se times, except t h a t the r e a r ax le brakes on the t r a c t o r a r e somewhat improved i n t h i s regard.

3.3 TEST SURFACES AND TIRE-ROAD INTERFACE TESTS
A l l vehicle brake performance t e s t i n g reported herein was accomplished a t the Bendix Automotive Development Center, New Car l i s l e , Indiana, during the time period September 1969 t o October 1970. Tests requir ing a surface with a high coeff ic ient of f r i c t i o n were conducted on the high speed oval t r ack and the approach road t o the skid pad, while those t e s t s requir ing a surface with a low coeff ic ient of f r i c t i o n were conducted on a port ion of the skid pad i n which the asphalt surface had been t rea ted with a sealant and wetted using a sprinkler truck.
The skid number of the t e s t surfaces was measured twice during the program using a skid t r a i l e r equipped with AsTM-249 t i r e s , and checked each week during which t e s t s were conducted using an instrumented passenger car a l s o equipped with the ASTM-249 t i r e s . An inves t iga t ion was a l s o made using specia l ins t ru - mentation I n the d isk brake truck t o determine the peak and s l id ing coeffi- c i en t s f o r a typ ica l t ruck t i r e . * Results a re given i n Table 12.
TABLE 12
SKID NUMBERS 4x1 PEAK/SLIDING TIRE-ROAD COEFFICIENTS FOR TEST SURFACE
Tire-Road Coefficient f o r Skid
Surface Typical Truck Tire No.
Peak Sl id ing Oval Track
( asphalt - dry) 87 0.75 0.60
Approach Road t o Skid Pad ( asphalt-dry ) 87
Skid Pad ( sealed asphalt- wet) 21-24 0.35 0.26
3.4 ANALYTICAL RESULTS
The purpose of the ana ly t i ca l study was t o e s t ab l i sh mathematical procedures f o r predict ing vehic le braking performance, speci f ica l ly : brake effect iveness,
"Remington Premium Highway Universal, 10.00 x 20, tube type, load range F.

braking ef f ic iency , pedal fo rce gain, and thermal response. Analyt ical
methods found i n t h e l i t e r a t u r e were evaluated and extended f o r use i n t he study.
The t e s t r e s u l t s ind ica ted t h a t the loaded vehic les experienced consider- ab l e brake fade when being dece lera ted from speeds of 60 mph. The t e s t da t a a l s o showed t h a t wheel lockup occurred prematurely on ax les of a tandem-axle p a i r mounted on e i t h e r a t r a c t o r or t r a i l e r . The ana lys is developed t o pre- d i c t maximum dece lera t ion c a p a b i l i t y necessar i ly had t o include fade e f f e c t s a s we l l a s dynamic load t r a n s f e r occurring on tandem-axle suspensions. Since t h i s ana lys i s r e su l t ed i n a r a t h e r extensive s e t of a lgebra ic and d i f f e r e n t i a l equations, d i g i t a l , analog, and hybrid computer techniques were developed t o perform the ca lcu la t ions .
3.4.1 Braking Performance
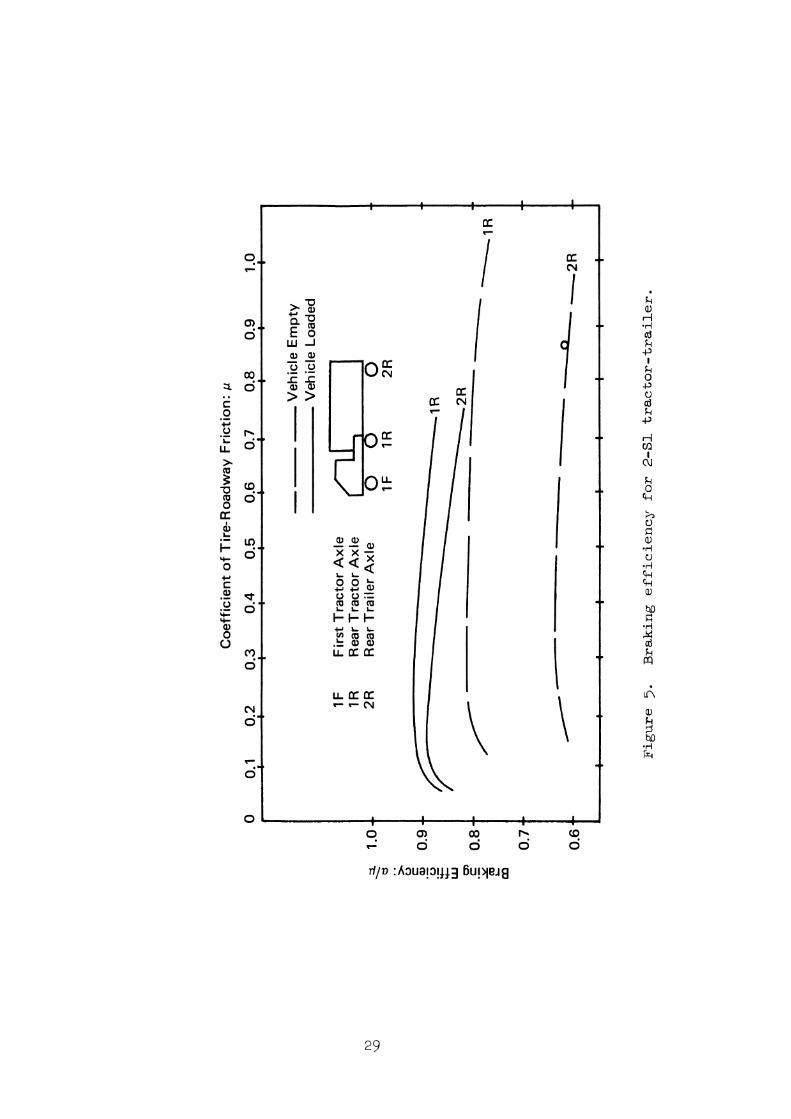
For eleven of t h e t h i r t e e n vehic les t e s t ed , braking performance diagrams were constructed, i n which by use of a n a l y t i c a l expressions, r e l a t i onsh ips between pedal force , brake l i n e pressure, vehicle dece lera t ion capab i l i t y ( loaded and unloaded) and t i re - road f r i c t i o n c o e f f i c i e n t required t o prevent wheel lockup on a given ax le a r e depicted." Figure 4 shows the brake perfor- mance diagram f o r the 2-S1 combination t e s t ed , wherein the experimental po in ts a r e denoted by small c i r c l e s . Curves f o r braking e f f i c i ency f o r t h i s vehicle a r e given i n Figure 5 . In these diagrams good agreement i s shown between t h e o r e t i c a l and t e s t r e s u l t s which a r e genera l ly t y p i c a l of the r e s u l t s f o r the o ther vehic les t e s t ed . The major conclusion t h a t can be drawn from t h i s phase of t he a n a l y t i c a l program i s t h a t accurate pred ic t ions of braking per- formance can be made based upon vehic le and brake system design da t a f o r buses, t rucks , and t r a c t o r - t r a i l e r s .
The r e l a t i o n s h i p between brake fo rce d i s t r i b u t i o n and braking e f f i c i ency was a l s o considered i n assess ing t h e braking performance of vehic les t e s t ed . It was demonstrated t h a t those vehic les which exhibi ted the best performance, a s measured by maximum dece lera t ion achievable, were those whose brake fo rce d i s t r i b u t i o n was a t or near optimum, whereas those vehicles showing l e s s e r performance c a p a b i l i t i e s could have achieved b e t t e r performance with a d i f - f e r e n t brake force d i s t r i b u t i o n . For example, t he 2-S1 combination had a brake fo rce d i s t r i b u t i o n given by
*Exceptions were the heavy t ruck and the c i t y bus, f o r which diagrams could not be constructed because necessary design information was not ava i l ab l e from the vehicle manufacturers.

1 F First Tractor Axle 1 R Rear Tractor Axle 2R Rear Trailer Axle
Pedal Force (Ib)
0.6 0.8 1 .O
&Trailer Wheels Locked
Figure 4. Braking performance diagram f o r 2 - S 1 t r a c t o r - t r a i l e r .

where
$1, = brake fo rce on f r o n t a x l e l t o t a l brake force
4 R = brake fo rce on r e a r a x l e / t o t a l brake force
8, = brake fo rce on t r a i l e r a x l e / t o t a l brake fo rce
The optimum brake fo rce d i s t r i b u t i o n f o r t h i s vehicle was determined t o be 0.20 : 0.42 : 0.38 ind ica t ing i n s u f f i c i e n t braking e f f o r t on the f r o n t ax le and too much on the t r a i l e r axle . Test da t a support t h i s ana lys i s i n t h a t one t r a c t o r r e a r wheel and one t r a i l e r wheel approached wheel s l i d e when t h e empty vehicle decelerated a t 17 f t / s ec2 . Although b e t t e r performance can be achieved by modifying the brake f o r c e d i s t r i b u t i o n , a f i xed d i s t r i b u t i o n should not be expected t o produce braking e f f i c i e n c i e s f o r combination vehic les much higher than 75%.
Also included i n t h i s study a r e e f f o r t s t h a t have been d i r ec t ed towards developing techniques t o p red ic t brake thermal response. The ana lys is was hindered by severa l f a c t o r s , namely: ( a ) t he instrumentat ion used i n the experimental program did not lend i t s e l f t o an accurate co r r e l a t ion of ca l - cu l a t ions and experimental r e s u l t s , ( b ) l i n i n g mater ia l parameters such a s thermal conduct ivi ty , spec i f i c hea t , and densi ty , could not be measured and thus had t o be estimated, ( c ) the loca t ion of the thermocouples i n s t a l l e d i n t he brake l i n i n g was not known with s u f f i c i e n t accuracy, and ( d ) t h e convective heat t r a n s f e r c o e f f i c i e n t could be ne i the r accura te ly computed nor accura te ly determined from experiment. Notwithstanding these d i f f i c u l t i e s , ca l cu la t ions were made t o p red ic t brake temperatures a s funct ions of t i n e .
F i n i t e d i f fe rence methods were employed t o compute the temperatures a s a funct ion of time a t various poin ts i n t he l i n ing , T = f ( x , t ) , t h a t would ensue i n three of the t e s t procedures, namely, t he fade t e s t , t he recovery t e s t , and the brake r a t i n g t e s t . This procedure was d i c t a t ed by t h e neces s i ty t o introduce the convective hea t t r a n s f e r coe f f i c i en t , h, a s a var iab le dependent upon vehicle speed. The thermal p rope r t i e s needed f o r t he ana lys i s were ob- ta ined from published da t a and a d i g i t a l computer program was wr i t t en t o f a c i l - i t a t e t he numerical work involved. Although reasonably good agreement was obtained between theory and t e s t f o r one of t he vehicles , agreement between theory and t e s t was l e s s s a t i s f a c t o r y f o r other vehicles , t he re being, i n genera l , discrepancies of t h e order of 2%. It can be concluded from these r e s u l t s t h a t i n order t o develop techniques f o r pred ic t ing brake thermal res- ponse based upon vehic le and brake system design da ta , f u r t h e r a n a l y t i c a l work supported by ca re fu l ly instrumented t e s t s w i l l be required.

3.4.2 Proportioning Schemes
Dynamic modeling and simulation were employed i n t h i s study t o i nves t i - ga te the e f fec t iveness of load and decelerat ion-sensi t ive brake proportioning schemes i n improving braking performance over a wide range of loadings and t e s t surfaces.
The dynamic simulation developed f o r t h i s study i s based on a model t h a t represents e i t h e r a two-axle t ruck or t r a c t o r , or a three-axle t r a c t o r - t r a i l e r combination. Motions a r e constrained t o the plane of symmetry ( v e r t i c a l plane) . Spec i f ica l ly t he wheels can bounce and spin, the chass i s can heave and p i tch , and the vehicle can acce lera te (dece l e ra t e ) i n s t r a igh t - l i ne motion. The braking system i s modeled i n a manner such t h a t var iable time l ags and delays i n torque response can be introduced. Any desired brake force d i s t r i bu t ion can be spec i f ied ,
To determine the improvement i n performance t h a t could be expected f o r a three-axle t r ac to r - t r a i l e r combination ( 2 - ~ 1 ) using s t a t i c load- s ens i t i ve pro- port ioning valves, a t y p i c a l two-axle t r a c t o r and 27 f t van t r a i l e r were used a s a bas i s f o r the study. Brake torque f o r each axle was calculated from t y p i c a l design information. I n t h i s preliminary inves t iga t ion , no account was taken of the l o s s of brake effect iveness t h a t i s caused by fade during a s ing le stop. The following f indings were obtained:
1. Without proportioning the loaded vehicle achieves a maximum decelera- t i o n of 16.7 f t / s e c 2 before the t r a i l e r wheels lockup,
2. The empty vehicle without proportioning achieves a maximum decelerat ion of 16.9 f t / s ec2 before the t r a i l e r wheels lockup.
3. The empty vehicle with the brakes proportioned t o the s t a t i c loads on the ax les can achieve a maximum decelerat ion of 23.8 f t / s ec2 without encountering wheel lockup, an improvement i n stopping capab i l i t y of about 4M0.
A second study was conducted t o determine i f a f ea s i lbe proportioning scheme could be developed which would d i s t r i b u t e the brake forces f o r maximum braking ef f ic iency over a wide range of loadings and surface conditions. The 2-S1 combination vehicle t e s t ed i n the program, namely, the Ford F-7000 t r a c t o r i n combination with the Trailmobile 35 f t van t r a i l e r , was selected a s t he prototype f o r t h i s study. Parameter data defining the vehicle and brake system were determined and introduced i n t o the simulation. The e f f e c t s of brake res - ponse time, fade, and pushout pressures were included. Preliminary runs were made t o check t h a t t he simulation r e s u l t s matched t e s t r e s u l t s obtained f o r the vehic le i n t he empty and loaded condition.

Simulated braking runs were made f o r t h e base l ine and i d e a l l y proportioned vehic les f o r a v a r i e t y of loading condit ions and two t i r e - road i n t e r f a c e con- d i t i o n s : ppeak/usliding = 0.76/0.70 and 0.325/0.3. Results ind ica ted t h a t by means of t h i s i dea l i zed proportioning scheme i t i s poss ib le t o achieve b e t t e r than 9% braking e f f i c i ency f o r a t r a c t o r - t r a i l e r on the 0.7 and 0.3 surfaces, except f o r two cases on the dry surface, namely, the ful ly- loaded vehicle and the bob ta i l , The study a l s o showed t h a t changing the height of t he center of g rav i ty from 16 in . t o 48 ic. from t h e t r a i l e r deck had a neg l ig ib l e e f f e c t on s t r a i g h t - l i n e braking performance.

4.0 RECOMMENDATIONS
In order t o eva lua te t he f indings obtained i n the experimental and a n a l y t i c a l phases of t h i s study, and t o formulate recommendations f o r improving the braking performance of commercial vehicles , i t appeared des i r ab l e t o categorize braking performance i n t o a number of d i s t i n c t f a c e t s or qua l i t i e s .
The mechanics of t h e braking process suggest t h a t t he re a r e a t l e a s t f i v e f a c e t s 3f braking performance t h a t a r e deserving of considerat ion f c r commercial vehicles. These f ace t s ( o r measures of braking performance)
11 11 11 11 s h a l l be r e f e r r ed t o a s "effect iveness , thermal capaci ty, c o n t r o l l a b i l - I t 11
i t y , e f f ic iency ," and "response" and a r e defined below.
Brake "effect iveness" i s a measure of t h e gain of a brake i n terms of torque output per un i t input of l i n e pressure a t the brake chamber. When t h e braking l e v e l i s low such t h a t the t i r e s a r e not being forced t o operate near t h e i r adhesion or f r i c t i o n l i m i t , t h e t o t a l braking force a c t - ing on a vehic le i s l i n e a r l y r e l a t e d t o the t o t a l torque being generated by a l l of t he brakes. Under these condit ions, dece lera t ion per un i t value of brake l i n e pressure serves a s an ove ra l l measure of t he braking e f f ec t ive - ness of t h e vehicle. For pneumatic systems character ized by a l i m i t value of l i n e pressure, a f i n i t e value of e f fec t iveness f o r a given brake means t h a t t he re i s an upper l i m i t t o t h e brake torque t h a t can be generated. I f t h i s maximum torque i s i n s u f f i c i e n t t o produce wheel lock, during the braking process, t h e maximum value of wheels-unlocked dece lera t ion t h a t can be achieved by t h e vehic le i s degraded.
The thermal e f f i c i ency of a brake can be character ized by t h e a b i l i t y of t h e brake t o absorb heat generated i n a s i n g l e s top and t o conduct or convect away heat generated i n a s e r i e s of stops. The combination of t h i s thermal e f f i c i ency (which i s mostly a c h a r a c t e r i s t i c of t h e brake drum) with the l i n i n g proper t ies determines the fade r e s i s t ance of t he brake. With t h e instrumentat ion used i n t h e t e s t s , thermal e f f ic iency could not be measured d i r e c t l y , and so thermal capaci ty or r e s i s t ance t o fade i s measured i n terms of t h e l e v e l of braking ef fec t iveness t h a t can be maintained during a s e r i e s of r ap id ly repeated snubs ( a s spec i f ied i n t h e fade t e s t procedure fo r t h i s program) or the number of snubs which can be accomplished i n a given time i n t e r v a l (SAE ~ 8 8 0 ) , or t h e decrease i n tow bar force i n a towing t e s t ( a s spec i f ied i n t h i s program f o r t h e brake r a t i n g t e s t ) . The fade t e s t a s conducted was not successfu l f o r t h e l a r g e commercial vehicles t e s t e d i n t h i s program because brake fade could not be

induced. However, i f t h e requirements for the i n i t i a l and f i n a l snub ve loc i t i e s a r e changed t o correspond with those of SAE 5786, t h a t i s , 40 mph t o 20 mph instead of 60 or 50 mph t o 10 rnph, fade can be induced and a measure of thermal capaci ty could be obtained. One such performance measure i s t he number of snubs t h a t can be produced a t a spec i f ied l e v e l of decelerat ion with t h e time t o acce lera te back t o t e s t speed between snubs not t o exceed a specif ied pericd. From the point of view of safety, a thermal capaci ty t e s t should be based upon the most severe duty cycle t h a t a vehicle might encounter i n general use.
Brake c o n t r o l l a b i l i t y i s used here i n t he sense of t h e d r ive r being ab le t o modulate brake force under a wide var ie ty of loading and road surface conditions t o minimize stopping dis tance while preventing wheel lockup. ~ e c e l e r a t i o n l ~ e d a l force gain i s a performance measure t h a t can be used t o charac te r ize brake con t ro l l ab i l i t y .
Braking ef f ic iency i s a measure of t he a b i l i t y of a vehicle t o u t i l i z e t he f r i c t i o n forces ava i lab le a t t h e t i re - road interface. S t r i c t l y speaking, it i s defined a s t h e r a t i o of t h e maximum wheels-unlocked de- ce l e ra t ion capab i l i t y of t he vehicle on a given surface t o t he peak t i r e - road f r i c t i o n coe f f i c i en t of t h a t surface. When braking ef f ic iency i s determined experimentally, t h e surface on which t h e vehicle i s t e s t ed must be measured t o determine t h e peak t i re - road f r i c t i o n coef f ic ien t . A t t h e present time, adequate means do not ex i s t f o r making such a measurement with la rge t ruck t i r e s . Therefore, a s an a l t e r n a t i v e , it i s proposed t h a t braking ef f ic iency be determined by ca lcu la t ing t h i s measure, using vehicle and brake system design data a s was accomplished f c r the t e s t vehicles i n t h i s program.
Brake response time i s defined a s t he time required fo r a brake t o reach a given l e v e l of effect iveness from the time t h a t the brake con t ro l (peda l ) i s act ivated. Measurements of response time i n an a c t u a l s top would therefore requi re torque sensors on each braked wheel. Consequently, a more common means f o r determining t h e response time of pneumatic brake systems i s t o measure the time from the in s t an t of pedal appl ica t ion ( r e - su l t i ng i n a f u l l , f a s t opening of the t r ead le valve) t o t h e in s t an t a given pressure l e v e l i s reached i n t h e brake chamber. Measurements show t h a t t he response times ty-pically exhibi ted by air-brake systems a r e s u f f i c i e n t t o influence t h e braking performance of commercial vehicles , a s measured e i t h e r by average decelerat ion or stopping distance. Synchroni- za t ion of brake timing i s important fo r preventing i n s t a b i l i t i e s i n a r t i cu l a t ed vehicles. Brake-release time i s s ign i f i can t when the d r ive r i s attempting t o modulate t he brake force t o prevent wheel lockup. There- fo re it i s apparent t h a t brake response i s a s ign i f i can t measure of commercial vehicle brake system performance.
The performance measures defined above a r e summarized i n Table 13.

TABLE 13
PERFORMANCE MEASURES
Qual i ty Measures Perf ormnce Measure Symbol Technique
1. Effectiveness Maximum Deceleration ax (wheels unlocked)
2. Thermal Capacity Number of Snubs Achieved n a t a Given Deceleration
3. Eff iciency Braking Eff iciency m ax/^
4. Cont ro l l ab i l i t y ~ e c e l e r a t i o n / ~ e d a l -a,/F Force Gain
3. Brake Response Application and Release 'a, T~ Times ( a i r brake sys- tems only)
Effectiveness Test
Fade Test
Calculation of Ef- f i c i ency and ire/ Road In te r face Test
Effectiveness Test
S t a t i c Response Time Test
4.2 MAXIMUM ACHIEVABLE PERFORMANCE
The maximum braking performance t h a t can be achieved by a vehicle on a given t e s t surface i s l imited by f i v e fac tors :
1. the f r i c t i o n a l forces ava i lab le a t t he t i re - road in te r face ,
2. t he effect iveness of t h e vehicle 's brakes, t h a t i s , t he maximum torque capaci ty of t h e brakes,
3. t h e braking ef f ic iency of t h e vehicle, t h a t i s , how well t h e brake torque i s balanced ax le t o axle such t h a t t he t i r e l r o a d f r i c t i o n a l f'orces a r e bes t u t i l i zed ,
4. t h e a b i l i t y of t he dr iver t o modulate t he pedal force such t h a t maximum decelerat ion and minimum stopping d is tance a r e achieved without l o s s of d i r ec t iona l cont ro l and s t a b i l i t y , and
5. t he time response of t h e brake system t o an applied pedal force.
Tire-road in t e r f ace t e s t s conducted fo r t h i s program indica te t h a t t he f r i c t i o n coe f f i c i en t of t ruck t i r e s , both peak and s l id ing , i s s i g n i f i -

c a n t l y l e s s than t h a t of passenger ca r t i r e s . The e f f ec t iveness t e s t s po in t up considerable va r i a t i on i n t i r e - road f r i c t i o n c o e f f i c i e n t among t h e various types of t ruck t i r e s . For example, t h e l i g h t t ruck was capable of locked wheel dece lera t ions of a s high a s 28 f t / sec2 , while t h e d i sk
2 brake t ruck was capable of only 22 f t / s ec with t h e wheels locked. Since t e s t s with both the Michigan Department of S t a t e Highways' skid t r a i l e r and an instrumented ca r ind ica ted t h a t t h e f r i c t i o n c o e f f i c i e n t of t h e t e s t t r a c k varied only s l i g h t l y over t h e e n t i r e per iod of t e s t i n g , t h e d i f f e r - ence i n locked wheel dece lera t ion must be a t t r i b u t e d t o d i f f e r ence i n t i r e t r ac t ion . The importance of t h i s observation cannot be overemphasized s ince it i s p o i n t l e s s t o increase t h e e f fec t iveness of brakes i f f r i c t i o n a l forces corresponding t o t h e increased brake torque c a p a b i l i t i e s cannot be produced a t t h e t i r e - road in te r face . The reader i s t he re fo re cautioned t o judge t h e performance c a p a b i l i t i e s of t h e l a r g e r t rucks and t r a c t o r - t r a i l e r s t e s t e d i n t h i s program i n l i g h t of t hese f ind ings on t ruck t i r e t r ac t ion .
The maximum wheels unlocked dece l e ra t ion achievable, a s determined e i t h e r from an ef fec t iveness t e s t o r a minimum stopping d i s t ance t e s t , i s a measure of not only t h e torque capac i ty of t h e brakes, but a l s o of how w e l l t h e vehic le u t i l i z e s t h e f r i c t i o n ava i l ab l e a t t h e t i r e - road interface. The maximum dece lera t ion obtained on the dry sur face i s summarized i n Figure 6 f o r a l l of t h e vehicles tes ted . With performance depicted i n t h i s fashion, it i s immediately obvious t h a t t h e vehicles equipped with advanced brake and brake-control systems d id not exhib i t braking performance t h a t was s i g n i f i c a n t l y b e t t e r than was achieved by t h e base l ine vehicles. I n f a c t it can be argued t h a t a t ruck , bus, o r t r a c t o r - t r a i l e r with brakes balanced f o r maximum braking performance can exceed t h e performance achieved on a dry sur face by advanced brake con t ro l systems. For example, t h e l i g h t t ruck , a l l t h e buses, and t h e 2-S2 t r a c t o r - t r a i l e r combination, exhib i ted perfornance on t h e dry surfaces a s good a s Vehicle #12 and considerably b e t t e r than Vehicle #14. The d i sk brake t ruck , hcw- ever , was outperformed only by the l i g h t t ruck , and t h i s r e s u l t may stem from a d i f f e r ence i n t i r e t r ac t ion . Figure 7 perhaps b e t t e r dep ic t s t he improvement i n performance t h a t can be expected by use of advanced brake- con t ro l systems. Since wheel lockup i s viewed a s undesirable, only t h e maximum dece lera t ions obtained up t o t h e poin t of wheel lockup a r e presented i n t h i s f igure. Considerable improvements i n performance a r e achieved f o r Vehicle #12 through use of t h e adapt ive braking system, e spec i a l ly i n t h e t e s t conducted on t h e low c o e f f i c i e n t surface, and i n t h e t e s t s conducted wi th t h e empty vehic le on t h e dry surface. It should be noted t h a t t he e f f ec t iveness of t h e brakes on Vehicle #12 was i n s u f f i c i e n t t o l ack up a l l t h e wheels on t h e dry sur face i n t h e loaded condition.
Vehicle #14 d id not perform a s we l l a s Vehicle #12, e i t h e r on t h e dry surface (even a f t e r making allowance f o r t h e s l i g h t l y l ~ w e r t i r e - road f r i c - t i o n c o e f f i c i e n t of t h e sur face upon which Vehicle #14 was t e s t e d ) o r t h e


IL LOW , 11 Dry 1 1 Low Coefficient Surface
II Coefficient
Improvements in Performance Using Advanced Control Systems
m Performance as Tested with Standard System
L V e h i c l e 12 Tractor-Trailer 2 - - - J I V e h i c l e 12 Tractor _IL --] L V e h i d e 14 Tractor-Trailer Vehicle l d Tractor-
Figure 7. Improvement i n maximum d e c e l e r a t i o n performance w i t h advanced systems.

wet surface. The empty t r a c t o r ( b o b t a i l ) of Vehicle #14 produced a maximum dece lera t ion of 19 f t / s ec2 on the dry surface while t h e combination, empty
2 o r loaded, produced 15 f t / s e c . Although the an t i lock system did improve performance of the combination a s measured by t h e maximum decelerat ion achievable without wheel locking, the improved performance was considerably l e s s than t h a t which could have been achieved by b e t t e r u t i l i z a t i o n cf t he forces i n t he t i re - road in te r face .
Using t h e eAqerimental data a t hand, it i s impossible t o ca l cu la t e exact ly t he braking ef f ic iency of the t e s t ed vehicles s ince the peak values of t i r e - road f r i c t i o n coe f f i c i en t , upon which ef f ic iency calculat ions must necessar i ly be based, have been determined i n an approximate manner. How- ever, using these approximate coef f ic ien ts , t h e e f f ic iency exhibi ted by each vehicle and system t e s t e d i s tabulated i n Table 14. Using ef f ic iency a s t h e c r i t e r i o n , t he d i sk brake t ruck showed best performance on the dry surface. The system which produced t h e best overa l l e f f ic iency measure was the adapt- ive braking system i n s t a l l e d on Vehicle #12. Next best was the an t i lock system i n s t a l l e d on Vehicle #14. The smallest performance gains were achieved with the proportioning system. As pointed out e a r l i e r , minor ad- justments i n t he proportioning valves, p lus design s teps t h a t prevent pre- mature lockup of t he wheels on the leading ax le of t he t r a i l e r would have markedly improved the performance obtained with the proportioning system. The simulation study described e a r l i e r has indicated the magnitude of per- formance improvements t h a t can be expected from use of proportioning systems.
TABLE 1 4
OVERALL B.NKING EFFICIENCIES FOR ADVANCED SYSTEMS TESTED
Dry Surface Vehicles Low Coefficient
System Empty Loaded Empty Loaded
Disk Brake Truck - - 9 0 88 - - - -
#12 Tractor-Trai ler Standard 4 8 67 - - 54 Proportioning 47 6 7 - - - - Adaptive 83 70 8 1 96
#12 Tractor Standard 4 6 70 4 3 4 7 Proportioning 82 7 0 3 0 47
Adaptive 82 80 80 7 5
#14 Tract or- T ra i l e r Standard - - 45 4 6 - - Ant i l o c k 66 68 66 72
#14 Tractor Ant i l ock 86 - - 6 3 - -

I f a vehic le i s equipped with an adaptive o r wheel an t i l ock brake system, t h e d r ive r does not have t o modulate t he pedal fo rce t o prevent wheel lock. However, fo r vehicles not so equipped, a recent study a t HSRI showed t h a t t h e d r i v e r ' s a b i l i t y i n modulating the brake-pedal force t o prevent wheel lockup i s d i r e c t l y dependent upon t h e decelerat ion-pedal force charac t ,e r i s t ic of t h e vehicle." Of a l l t he vehicles t e s t e d , t he d isk brake t ruck achieved the g rea t e s t maximum dece lera t ion without lockup of wheels. Figure 8 shows t h e decelerat ion-pedal force gain c h a r a c t e r i s t i c s of t h e d isk brake t ruck along with t h e recommended upper and lower l i m i t s derived from t h e HSRI study. It i s i n t e r e s t i n g t o note t h a t those baselirie vehi- c l e s i n which the d r ive r was ab le t o modulate t he pedal pressure such t h a t a high dece lera t ion was possible without wheel lockup a l l had dece lera t ion- pedal force c h a r a c t e r i s t i c s which were wi th in the l i m i t s suggested by t h e fISRI stud!. These vehicles included t h e l i g h t t ruck , t h e th ree buses, and .the 2-22 t r a c t o r - t r a i l e r combination. It the re fo re appears reasonable t o conclude t.hat these l i m i t s may a l s o serve a s a guidel ine i n s e l e c t i t ~ g the decelerat ion-pedal force c h a r a c t e r i s t i c s f o r buses, t rucks , and t r a c t o r - t , r a i l e r s .
Measurements of brake response time given i n Table 11, show t h a t t,he standard braking systems of' Vehicles #12 and #14 had appl ica t ion / re lease times t h a t were approximate1.y t h e same or s l i g h t l y longer than those of t h e basel ine t r a c t o r - t r a i l e r s . However when using S::ncron on Vehicle {l2 and the an t i l ock system on Vehicle 1/14) t h e response times of t h e t r a i l e r brakes were improved considerably.
1 . 3 RECOMMENDATIONS FOR A Sfl'ANllARI)
The above discussed f indings, a s derived both from analys is and t e s t , i nd i ca t e t h a t th ree major s teps w i l l have t o be taken t o s i g n i f i c a n t l y up- grade t h e maximum braking performance of comrne~cial vehicles.
F i r s t . The basic braking systems of t h e majori ty of these vehic les w i l l have t o be improved by use of more e f f e c t i v e brakes, b e t t e r balance,
and f a s t e r system response or1 a i r braked vehicles.
Second. The t r a c t i o n c h a r a c t e r i s t i c s of t i r e s used on the majori ty of medium and h e a ~ commercial vehic les w i l l have t o be improved so t h a t t h e advantage of improved brake e f fec t iveness can be f u l l y u t i l i z e d a t t he t i r e - road in te r face .
*E. G. Mortimer, -- e t a l . , -- Brake Force Requirement Study: Driver-Vehicle - - Braking Performance - - a s a Function of Brake System Design Variables, Con- t r a c t No. FH-11-6972, prepared f o r t he National Highway Safety Bureau, U. S. Department of Transportation, by the Highway Safety Research IR- s t i t u t e , The University of Michigan, Apr i l 10, 1970.

1.2 - I I I I 1
I I
I
1 .o.. -.
-. 0.8,- 0 - c 0 .- w 2 2 0.6,- a
-. $ n
-.
1
0.0 I I I
20 40 60 80 100 120
Pedal Force (Ibs)
Figure 8. Decelera . t ion-pedal f o r c e g a i n f o r d i s k brake t r u c k and HSRI recommended l imits.

Third. Advanced brake con t ro l systems w i l l have t o be employed t o allow rap id brake appl ica t ions without i n s t i g a t i n g vehic le i n s t a b i l i t y whether t h e vehic le be loaded o r empty, and operat ing on a dry o r s l i ppe ry surface.
A number of design a l t e r n a t i v e s e x i s t fo r achieving these objec t ives :
1. The ef fec t iveness and fade r e s i s t a n c e of t h e braking systems on medium and heavy t rucks can be improved s i g n i f i c a n t l y by use of d i s k brakes, powered e i t h e r by a vacuum a s s i s t un i t or a f u l l power hydraulic system.
2. The e f f e c t i v e ~ e s s of t h e braking systems of t r a c t o r s can be i m - proved by use of l a r g e brakes on t h e f ron t ax l e of t r a c t o r s with tandem r e a r ax les ( a design configurat ion i n which f r o n t brakes a r e genera l ly absent ) and by use of l a r g e r brakes on t h e f ron t ax- l e of two-axle t r a c t o r s .
3. The braking e f f i c i ency of many t rucks and t r a c t o r - t r a i l e r can be inrproved by c a r e f u l d i s t r i b u t i o n of braking e f f o r t among t h e ax l e s of t h e vehicle.
4. The brake response time of a i r braked systems can be improved s i g - n i f i c a n t l y through use of l a r g e r hoses, impr~ved connectors and f i t t i n g s , quick r e l e a s e valves, r e l a y valves oc t r a c t o r s , and t r a i l e r brake synchronization.
5. Braking performance can be impr~ved s i g n i f i c a n t l y on t rucks , buses, and t r a c t s r - t r a i l e r s through use of t h e advanced brake con t ro l systems, which were evaluated by t e s t and/or simulation i n t h i s program. These systems, ranked i n order of p o t e n t i a l f o r improv- ing braking performance, a r e :
a. wheel an t i l ock system b. dynamic load s e n s i t i v e proport ioning system c. s t a t i c load s e n s i t i v e proport ioning system.
In considering any of t h e above design a l t e r n a t i v e s , one must bear i n mind t h a t t h e commercial vehicle has evolved over t h e years a s a design compromise. The vehicle s t ruc tu re , suspension, and brake system have been designed f o r a given l e v e l of average braking performance, with a capabi l - i t y of accept ing a c e r t a i n amount of overload i n emergency s i t ua t ions . The pneumatic t i r e s a r e p a r t of t h i s design compromise, s ince t h e r e i s n ' t much poin t i n designing high t r a c t i v e c a p a b i l i t y i n t o t ruck t i r e s , a t t he ex- pense of increased r o l l i n g r e s i s t ance and higher wear r a t e s , i f t h a t t r a c - t i v e c a p a b i l i t y cannot be matched by brake torque c a p a b i l i t i e s a s con- s t r a ined by brake s i z e and brake design prac t ice . The aim of t h i s design

compromise has been t o produce vehic les which a r e s a fe and r e l i a b l e wi th in t h e i r performance range, and which a r e charac te r ized by high payload/vehi- c l e weight r a t i o s and minimal operat ing and maintenance costs . To i n t r o - duce a requirement f c r severely increased braking c a p a b i l i t y i n t o t h e com- mercial f l e e t , a s it has evolved, w i l l necessar i ly r equ i r e a r e e v a l u a t i m of t h e design of t h e e n t i r e system. The following poin ts a r e suggested f c r se r ious consideration.
1. More e f f e c t i v e brakes w i l l r equ i r e s t ronger suspensions and s tronger adjacent vehic le s t ruc tures .
2 Large brakes on t h e f ron t ax les of t r a c t o r s could r equ i r e new f r o n t ax le and s t ee r ing system designs, and, i n many cases , t h e use of power s teer ing.
3. With increased dece l e ra t i cn capab i l i t y , methods of cargo r e s t r a i n t w i l l have t o be reevaluated. On buses, passenger r e s t r a i n t sys- tems may have t o be u t i l i zed .
4. The r e l a t i v e l y high r a t i o of center of g rav i ty height above road- way t o t ruck width, t h a t i s common t o s t r a i g h t t rucks , caused vehic le s t a b i l i t y problems t o be encountered a t moderate decelera- t i o n s i n t h i s t e s t program. It i s expected t h a t t h e problem w i l l be worse a t higher decelerat ions. This problem may be a l l e v i a t e d by use of an t i l ock systems. However, a t t h i s po in t i n time, t h e problem i s not c l e a r l y defined and requi res much more study be- f o r e a d e f i n i t e so lu t ion can be suggested.
5. I f proportioning and/or an t i lock systems a r e t o be widely used, cognizance should be taken of maintenance and r e l i a b i l i t y problems assoc ia ted with each system. Load s e n s i t i v e proportioning systems r equ i r e mechanical, pneumatic, or other means of sensing changes i n load. Due t o wear, corrosion, and other degrading f ac to r s , t h e l e v e l of coulomb f r i c t i o n i n the suspension system may change, thus requi r ing per iodic inspect ion and adjustment o f t h e l inkage. Since an t i l ock systems f o r a i r braked vehicles a r e s t i l l i n the developmental s tage, r e l i a b i l i t y problems with both mechanical and e l ec t ron ic ccmponents were encountered i n t h e t e s t program. It i s mandatory t h a t an t i l ock systems have a high degree of r e l i a b i l i t y because of t h e human f a c t o r s irvolved. The t e s t program has pointed out t h a t regard less of load or sur face condition, t h e d r ive r w i l l make rap id , high-level brake appl ica t ions i f he knows t h e an t i l ock system i s operat ional , whereas he w i l l be extremely s e n s i t i v e t o load and surface condit ions when applying the brakes without t he an t i l ock system i n operation. Serious s t a b i l i t y problems a r e poss ib le i f t h e d r ive r app l i e s t h e brakes r ap id ly th inking t h a t the an t i l ock system i s opera t iona l where, indeed, it

i s not, due t o a component f a i l u re .
I n making spec i f i c recommendations fo r a standard, c a r e f u l considera- t i o n has been given t o t he necess i ty t o upgrade commercial vehicle braking performance a s quickly a s poss ib le t o acceptable leve ls . Careful considera- t i o n has a l s o been given t o those po in t s discussed i n t h e paragraph above. Taking i n t o account t h e system design problems which w i l l r e s u l t from i n - creased performance requirements, and t h e s t a t e of development of advanced systems, it i s recommended t h a t r u l e s be promulgated which r equ i r e upgrading t h e performance of t rucks , buses, and t r a c t o r - t r a i l e r s i n t h ree d i s c r e t e s teps , separated by appropr ia te per iods of time.* As a f i r s t s tep, i t i s recommended t h a t t h e r u l e s r equ i r e immediate ac t ion t o upgrade braking per- formance t o a l e v e l achievable by cu r ren t design p rac t i ce , t h a t i s , the bes t performance a l ready demonstrated by base l ine vehicles tes ted . For t h e second s tep , it i s recommended t h a t t h e r u l e s r equ i r e performance t o be i m - proved t o t h e l i m i t of t h e t i r e - r o a d i c t e r f a c e t r a c t i v e c a p a b i l i t i e s of t ruck t i r e s now ava i l ab l e with due regard t o r e a l i s t i c braking e f f i c i enc i e s . The second s t ep may r equ i r e use of load s e n s i t i v e proport ioning systems on c e r t a i n vehicles , and the re fo re s u f f i c i e n t lead time should be allowed f o r f u r t h e r development and t e s t i n g of t hese devices. Af te r an appropr ia te t ime i n t e r v a l t o allow f o r development and t e s t i n g of a r e l i a b l e an t i l ock system, t h e development of t ruck t i r e s with b e t t e r t r a c t i v e c h a r a c t e r i s t i c s , and t h e necessary design modif icat ions of vehicle brake, suspension, and s t r u c t u r a l systems, it i s recommended a s a t h i r d s t e p t h a t performance equal t o or approaching t h a t of passenger c a r s be required along with use of an a n t i l o c k system t o in su re vehicle s t a b i l i t y over a wide range of vehicle loadings and road sur face conditions. Summaries of t h e suggested performance requirements f o r each s t ep a r e given a s follows :
Maximum decelerat ior . c a p a b i l i t y - 16 ft/sec2**
Minimum braking e f f i c i ency - 65$ f o r sur faces having peak t ruck t i r e - r o a d f r i c t i o n c o e f f i c i e n t s between 0.2 and 0.8
*Recommendations f o r a spec i f i c time frame or schedule t o implement t hese s t eps cannot be made s ince information on lead times f o r in t roduct ion of design changes, development of new hardware and necessary manufacturing techniques i s not genera l ly ava i l ab l e from vehicle , brake, and h a k e com- ponent manufacturer s.
**It i s presumed t h a t t h i s dece lera t ion would be measured on a sur face having a peak t ruck t i r e - road f r i c t i o n c o e f f i c i e n t of a t l e a s t 0.75.
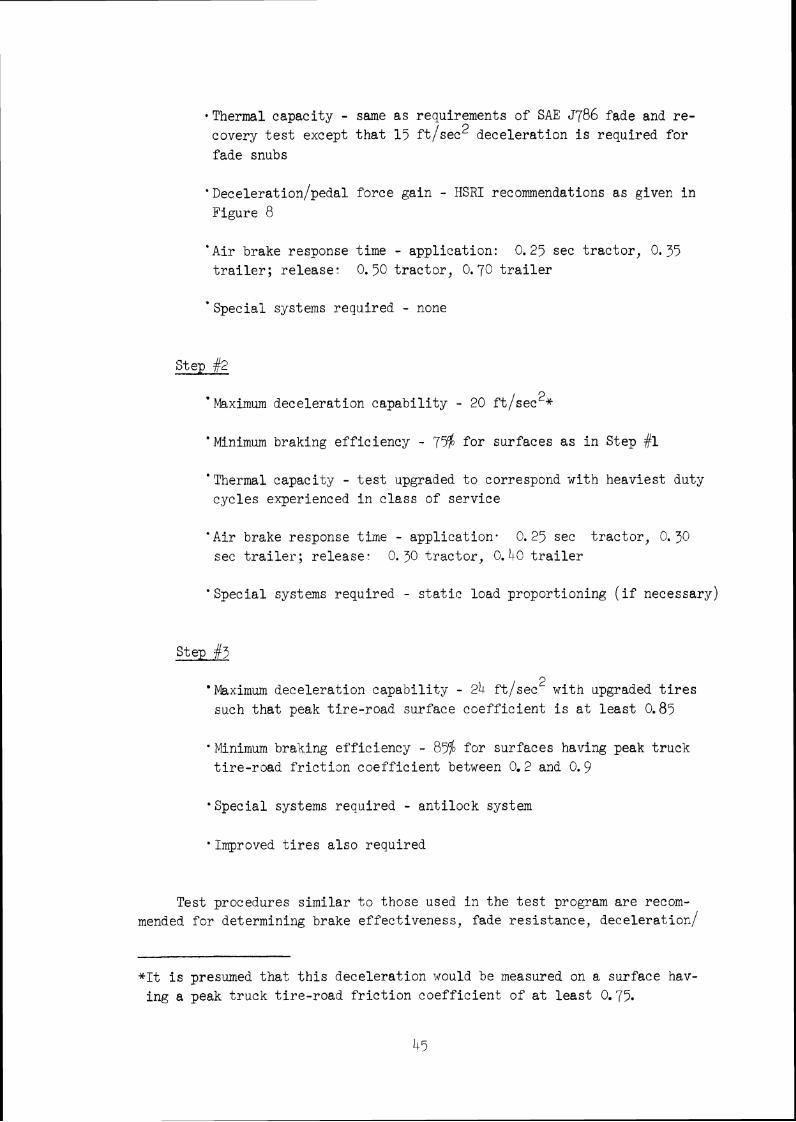
-Thermal capaci ty - same a s requirements of SAE 5786 fade and re - covery t e s t except t h a t 15 f t / sec2 decelerat ion i s required fo r fade snubs
' ~ e c e l e r a t i o n / ~ e d a l force gain - HSRI recommendations a s givec i n Figure 8
' A i r brake response time - applicat ion: 0.25 sec t r ac to r , 0.35 t r a i l e r ; re lease : 0. SC t r ac to r , 0.70 t r a i l e r
'Special systems required - none
Step #2
'hhaimum decelerat ion capabi l i ty - 20 ft/sec2*
'Minimum braking eff ic iency - 75% for surfaces a s i n Step #l
'Thermal capacity - t e s t upgraded t o correspond with heaviest duty cycles experienced i n c l a s s of service
' A i r brake response time - applicat ion. C.25 sec t r a c t o r , 0.30 sec t r a i l e r ; r e l ea se : 0. 30 t r ac to r , 0. 42 t r a i l e r
' Special systems required - s t a t i c load proportioning ( i f necessary)
2 Maximum decelerat ion capabi l i ty - 24 f t / s ec with upgraded t i r e s such t h a t peak t i re - road surface coef f ic ien t i s a t l e a s t 0.85
' Minimum braking ef f ic iency - 85$ fo r surfaces having peak t ruck t i re - road f r i c t i ~ n coef f ic ien t between 0.2 and G. 9
' Special systems required - ant i lock system
'Improved t i r e s a l so required
Test procedures s imi la r t o those used i n the t e s t program a r e recom- mended fo r determining brake effect iveness , fade res i s tance , decelerat ioc/
*It i s presumed t h a t t h i s decelerat ion vould be measured on a surface hav- ing a peak t ruck t i re - road f r i c t i o n coef f ic ien t of a t l e a s t 0.75.

pedal force gain cha rac t e r i s t i c s , and s t a t i c response time of a i r brake systems. I f stopping d is tance t e s t s a r e required, they should be made i n conjunction with the e f fec t iveness t e s t s t o ensure maximum unlocked wheel decelerat ions a r e achieved. Compliance with braking ef f ic iency requirements can be made by requi r ing desigc ca lcu la t ions s imi la r t o those ~ u t l i n e d i n t he F ina l Report volume, and by va l ida t ing t h e ca lcu la t ions by e f fec t iveness t e s t s on high coe f f i c i en t and low coe f f i c i en t surfaces.
Testing of t r a c t o r - t r a i l e r combinat ions presents a spec i a l challenge. Because of brake balance problems, a t r a c t c r which may perform very well with one t r a i l e r may perform poorly with another. Conversely, a t r a i l e r whose brakes were t e s t e d on a brake dygamometer and deemed adequate may perform wel l with one t r a c t o r but perform poorly with another. Also a t r a c t o r could perform wel l a s a loaded s t r a i g h t t ruck, but poorly i n corn- binati.cn with a t r a i l e r . For t h i s reasan it i s recommended t h a t t r a c t o r s be c e r t i f i e d t o p u l l only those t r a i l e r s with which it has been demonstrated by design ca lcu la t ion and t e s t t h a t performance of the combination vehicle i s adequate.

