true cost of fraud study
TRANSCRIPT
Annual Report
September 2015
2015 LexisNexis® Risk SolutionsTrue Cost of FraudSM Study
Merchants Contend with Increasing Fraud Losses as Remote Channels Prove Especially Challenging
2
2015 LexisNexis® True Cost of FraudSM Study
Table of contents
Introduction ...............................................................................................................................................................................................................4
Executive Summary ................................................................................................................................................................................................5
Overview ...............................................................................................................................................................................................................5
Key findings ..........................................................................................................................................................................................................5
Recommendations.................................................................................................................................................................................................. 7
General fraud trends ...............................................................................................................................................................................................8
Overall trends for merchants ........................................................................................................................................................................8
Fraud loss as a percentage of revenue shows no respite .................................................................................................................10
The channel conundrum .............................................................................................................................................................................. 12
Debit card fraud is on the rise ..................................................................................................................................................................... 14
Fraud mitigation: merchants’ attitudes and experiences ................................................................................................................ 15
Merchants struggle to manage remote channel fraud ...................................................................................................................... 18
Manual reviews and false positives add to fraud mitigation costs ...............................................................................................20
Financial institution perspectives ................................................................................................................................................................... 22
Merchant challenges ............................................................................................................................................................................................ 23
Large eCommerce merchants .................................................................................................................................................................. 23
Mcommerce merchants .............................................................................................................................................................................. 26
International merchants .............................................................................................................................................................................. 28
Methodology ...........................................................................................................................................................................................................30
Appendix ................................................................................................................................................................................................................... 31
3
2015 LexisNexis® True Cost of FraudSM Study
Table of figures
Figure 1: Cost per dollar of fraud losses by year ............................................................................................................................................8
Figure 2: Cost per dollar of fraud losses by merchant segment .............................................................................................................9
Figure 3: Fraud as a percentage of revenue by merchant type (2013–2015) ...................................................................................10
Figure 4: Number and value of prevented and successful fraudulent transactions ...................................................................... 11
Figure 5: Cost per dollar of fraud losses by sales channel ....................................................................................................................... 12
Figure 6: Percentage of lost/stolen merchandise attributed to fraudulent in-store pickups .................................................... 13
Figure 7: Distribution of fraud losses for merchants accepting specific payment types ............................................................ 14
Figure 8: Number of fraud prevention solutions used by merchant segment ................................................................................ 15
Figure 9: Dollar amount spent on fraud mitigation in the past 12 months ......................................................................................... 16
Figure 10: Fraud prevention and security costs by merchant segment ............................................................................................. 17
Figure 11: Number of fraudulent transactions prevented per successful attempt by channel ................................................. 18
Figure 12: Number of prevented fraudulent transactions per successful attempt by fraud prevention solutions currently used ......................................................................................................................................................................................................... 19
Figure 13:Transactions flagged as potentially fraudulent in the past 12 months by means of detection and review ......20
Figure 14: Percentage of flagged transactions declined .......................................................................................................................... 21
Figure 15: Cost per dollar of fraud losses by merchant segment ......................................................................................................... 23
Figure 16: Distribution of losses across fraud types for large eCommerce and all merchants ................................................ 24
Figure 17: Distribution of fraud losses for merchants accepting specific channels ..................................................................... 25
Figure 18: MCommerce merchants’ reasons for adopting mobile payments ................................................................................ 26
Figure 19: Top mobile channel challenges faced by mCommerce merchants, 2014–2015 ...................................................... 27
Figure 20: Top sales challenges faced by international merchants, 2014–2015 ........................................................................... 28
Figure 21: Acceptance of mCommerce payments by merchant segment, 2014¬–2015 .......................................................... 29
Figure 22: Attitudes toward the cost of controlling fraud by merchant segment, 2014—2015 ................................................. 31
Figure 23: Percentage of declined transactions that are false positives .......................................................................................... 32
4
2015 LexisNexis® True Cost of FraudSM Study
IntroductionThe annual LexisNexis® Risk Solutions study establishes the “true cost” of fraud as borne by U.S. merchants, along with key findings, and provides specific guidance for the industry. Recommendations for successfully mitigating these costs are presented based on an analysis of the underlying drivers of fraud, how different merchant segments are responding to these challenges, and through insight from financial industry leaders.
The key question that this report addresses for merchants is, “How do I grow my business and manage the true cost of fraud while strengthening customer trust and loyalty?”
Fraud definition
For the purpose of this study, fraud is defined as the following:
• Fraudulent and/or unauthorized transactions
• Fraudulent requests for a refund/return; bounced checks
• Lost or stolen merchandise, as well as redistribution costs associated with redelivering purchased items (including carrier fraud)
This research covers consumer-facing retail fraud methods and does not include information on insider fraud or employee theft.
Merchant definitions
• LexisNexis Fraud MultiplierSM is the total amount of costs related to fees, interest, merchandise replacement and
redistribution per dollar of fraud for which the merchant is held liable.
• Small merchants earn less than $1 million in average annual sales.
• Medium-size merchants earn $1 million to less than $50 million in average in annual sales.
• Large merchants earn $50 million or more in annual sales.
• International merchants operate from the U.S. and do business globally.
• Domestic merchants do not sell merchandise outside the U.S.
• Large eCommerce merchants accept payments through multiple channels but maintain a strong online presence, earning 10% to 100% of their revenue from the online channel and earning $50 million or more in annual sales.

5
2015 LexisNexis® True Cost of FraudSM Study
Executive SummaryOverviewMerchants experienced increased fraud losses again in 2015, and combatted challenges in a variety of areas that contributed to higher overall fraud mitigation costs and efforts. They lost an average of 1.32% of revenue to fraud and fraud related costs, a whopping 94% increase compared to 2014. The overall morale of merchants understandably took a hit as they not only dealt with increased fraud losses but also invested considerably more in fraud prevention to no avail — and sometimes to their detriment. Despite the use of automated systems in an attempt to more accurately and efficiently decision transactions, nearly three-fourths of all transactions flagged for fraud ended up requiring costly human intervention. Facing these and other challenges of online fraud (which is expected to continue to grow over the next few years), merchants have a daunting task in outpacing fraudsters.
Key findings The LexisNexis Fraud MultiplierSM hit an all-time low in 2015. Due to a surge in fraud through remote channels, merchants were liable for a greater proportion of chargebacks increasing their overall fraud losses and driving their costs per dollar lost to fraud lower.
Situation Effect On Fraud Multiplier
Shift in Fraud by Channel (Liabilities)
More remote (greater liability for chargebacks) Down
More in-person (reduced liability for chargebacks) Up
Shift in Types of Goods Sold
More physical merchandise (increased replacement/redistribution costs)
Up
More digital merchandise (reduced replacement/redistribution costs)
Down
Shift in Number or Size of Fraudulent Transactions for Which the Merchant is Liable
Higher number of fraudulent transactions (amount of losses held equal, more fees per $ of losses)
Up
Higher ticket value of fraudulent transactions (number of transactions held equal, greater losses per $ of fees)
Down
6
2015 LexisNexis® True Cost of FraudSM Study
Compared to online-only merchants, diversified merchants were spared the brunt of fraud through remote channels. An increase in fraud through remote channels caused an uptick in chargebacks, but this was dampened through the acceptance of varied payment channels by large eCommerce, mCommerce and international merchants.
2015 was an especially demoralizing year for merchants as fraud consumed even more revenue. All merchant segments were losing more revenue to fraud in 2015 and in the face of these losses more merchants believe that the additional costs of mitigation were prohibitive in 2015.
Compared to other merchant segments, large eCommerce merchants are most demoralized. This attitude makes sense given that merchants in this segment spend $115k annually on fraud mitigation while losing 1.39% revenue to fraud and its related costs, on average.
Merchants prevented more fradulent transactions overall, but online and Mail Order/Telephone Order (MOTO) transactions proved considerably more challenging. While merchants prevented more fraudulent transactions overall in the past year, merchants found it up to 7x more difficult to prevent transactions through remote channels compared to in-person.
Fraud mitigation is an excessively manual process. Even among the 25% of merchants using an automated system to flag fraud, three quarters of transactions flagged as fraudulent are ultimately decisioned by human beings.
Despite all of the effort dedicated to preventing fraud, a quarter of declines are false positives. The level of human effort involved in mitigating fraud is all the more troubling since roughly a quarter of declined transactions end up as false positives.
International merchants face the most acute false positive problem. This problem is sorely felt by international merchants, who decline the highest percentage of flagged transactions (27%), and were 4x as likely to list excessive manual orders as their top fraud mitigation challenge compared to 2014.
In-store pickups facilitate considerable shrink. In-store merchandise pickups, designed to increase convenience and efficiency, constitute a quarter of lost and stolen merchandise (shrink) among all major merchant segments.
7
2015 LexisNexis® True Cost of FraudSM Study
RecommendationsApply a holistic approach to managing fraud in the online and mobile channels. Ecommerce merchants benefit most from a holistic approach that includes multiple solutions such as CVV and transaction analysis, as the most effective at preventing fraudulent transactions, followed by device identification, geolocation, rules -based filters, and 3D Secure.
To control costs, closely track the effectiveness of automated systems and manual reviews in identifying fraud. With nearly three-quarters of transactions flagged as fraud involving some human intervention, analyzing the solutions and decisions that contribute to the need for human intervention is critical to avoiding the high costs associated with manual reviews of subsequent transactions.
Prioritize device identification and automated transaction scoring during digital goods purchases, adding geolocation for physical goods ordered online or on mobile device for in-store pickup. With the absence of a physical address to provide an additional point of verification, merchants are challenged by fraud involving digital goods sales and in-store pickups. Both automated transaction scoring and device identification are among the more effective tools used in online and mobile channels, with neither specifically reliant on a physical address to be accurate in identifying fraud risk. Merchants can leverage geolocation to identify higher-risk purchases where device locations may not closely correspond to the locations where products are to be picked up.
Despite reterminalization costs associated with EMV, continue to invest in eCommerce fraud mitigation solutions. Multichannel merchants face considerable costs associated with reterminalizing for EMV card acceptance, yet fraud in the online channel continues to rise. Reducing investment in eCommerce fraud mitigation could put these merchants at immediate risk of higher fraud losses today, while leaving them woefully underprepared for the expected growth in online fraud.
Merchants should partner with financial institutions to reduce both fraud and false-positive declines. Sharing intelligence on fraud trends at a macro level allows both cohorts to institute more effective controls and, in turn, reduce chargeback-related costs for both. Communicating about specific high-risk transactions could prevent merchants from inadvertently approving fraud or declining legitimate transactions, which will be critical as the volume of fraudulent eCommerce transactions is set to increase alongside legitimate transactions over the next few years.
8
2015 LexisNexis® True Cost of FraudSM Study
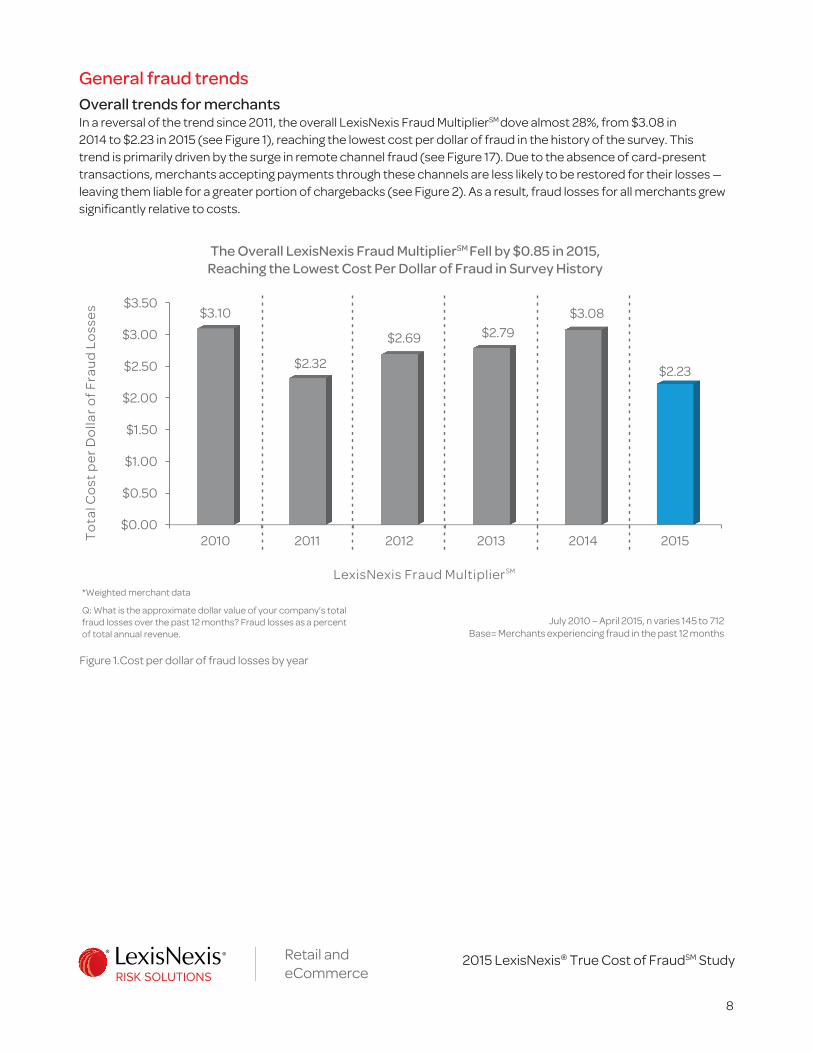
General fraud trendsOverall trends for merchantsIn a reversal of the trend since 2011, the overall LexisNexis Fraud MultiplierSM dove almost 28%, from $3.08 in 2014 to $2.23 in 2015 (see Figure 1), reaching the lowest cost per dollar of fraud in the history of the survey. This trend is primarily driven by the surge in remote channel fraud (see Figure 17). Due to the absence of card-present transactions, merchants accepting payments through these channels are less likely to be restored for their losses — leaving them liable for a greater portion of chargebacks (see Figure 2). As a result, fraud losses for all merchants grew significantly relative to costs.
The Overall LexisNexis Fraud MultiplierSM Fell by $0.85 in 2015, Reaching the Lowest Cost Per Dollar of Fraud in Survey History
$0.00
$0.50
$1.00
$1.50
$2.00
$2.50
$3.00
$3.50
2010 2011 2012 2013 2014 2015
$3.10
$2.32
$2.69 $2.79$3.08
$2.23
To
tal C
ost
pe
r D
olla
r o
f F
rau
d L
oss
es
LexisNexis Fraud MultiplierSM
Q: What is the approximate dollar value of your company’s total fraud losses over the past 12 months? Fraud losses as a percent of total annual revenue.
July 2010 – April 2015, n varies 145 to 712Base= Merchants experiencing fraud in the past 12 months
*Weighted merchant data
Figure 1.Cost per dollar of fraud losses by year

9
2015 LexisNexis® True Cost of FraudSM Study
Smaller Merchants and Those with No Physical Presence are Driving the Overall Trend as They Are Hit Harder with Chargebacks Compared to Larger, Physical-Presence Merchants
0%
10%
20%
30%
40%
50%
60%
Any amount of fraudulenttransactions for which your
company was held liable (e.g.,chargebacks)
Fees and interest paid to financialinstitutions due to fraudulent
purchases
Costs of replacing/redistributinglost or stolen merchandise
44%
24%
32%
55%
19%
25%27% 29%
44%
To
tal C
ost
pe
r D
olla
r o
f F
rau
d L
oss
es
LexisNexis Fraud MultiplierSM
Small merchants (under $1MM) Merchants without a physical presence *Merchants selling in-person and not online
July 2012 –March 2014, n varies 28 to 92Base = Merchants experiencing >$0
fraud in the past 12 months by segment
Q: In thinking about the total fraud losses suffered by your company, please indicate the distribution of various fraud costs over the past 12 months.
*Caution: Low base
Figure 2.Cost per dollar of fraud losses by merchant segment

10
2015 LexisNexis® True Cost of FraudSM Study
Fraud loss as a percentage of revenue shows no respiteMerchants share an increasingly dismal attitude toward the cost effectiveness of combating fraud. At least 29% of merchants agree that combating fraud costs too much (see Appendix, Figure 22), up from 20% of merchants in 2014. This attitude combined with the growing fraud losses have left the merchants demoralized. The upward trend of fraud losses as a portion of revenue for all merchants continues in 2015 at 1.32%, up from 0.68% in 2014 (see Figure 3). While all merchant segments took a substantial hit on fraud losses as a percentage of revenue, international and mCommerce merchants were hardest hit with 1.56% and 1.68% loss, respectively.
MCommerce and International Merchants Consistently Take the Greatest Hit to Revenue From Fraud, With an Upward Trend for All Merchants
Figure 3.Fraud as a percentage of revenue by merchant type (2013–2015)
0.00%
0.25%
0.50%
0.75%
1.00%
1.25%
1.50%
1.75%
AllMerchants*
Large eCommerceMerchants
mCommerceMerchants
InternationalMerchants
0.51% 0.53%
0.80%0.69%0.68%
0.85%
1.36%1.21%
1.32%1.39%
1.68%1.56%
Fra
ud
as
a %
of
reve
nu
e
2013 2014 2015
July 2012 –March 2015, n varies 41 to 712Base = Merchants experiencing >$0
fraud in the past 12 months by segment
*Weighted merchant data
Q: In thinking about the total fraud losses suffered by your company, please indicate the distribution of various fraud costs over the past 12 months.

11
2015 LexisNexis® True Cost of FraudSM Study
This trend isn’t surprising given the reported increase in the average monthly volume of prevented and successful fraudulent transactions, which totaled 333 transactions in 2015 (see Figure 4). Although merchants tackled 12% more fraud attacks in 2015 compared to 2014, they were able to keep their ticket values in check. While successful fraud attacks were almost stable, averaging $113 in 2015, merchants prevented higher-value fraudulent transactions averaging $133 per incident, up from $113 in 2014 (see Figure 4).
The Volume of Fraudulent Transactions Continues an Upward Trend in 2015, Though Merchants Prevent More High-Ticket Attempts
Figure 4.Number and value of prevented and successful fraudulent transactions
0
20
40
60
80
100
120
140
160
180
Number ofsuccessful fraudulent
transactions
Number of preventedfraudulent
transactions
809091 94
133
165156
177
# o
f tr
ansa
ctio
ns
2012 2013 2014 2015
Q. In a typical month, approximately how many fraudulent transactions are prevented by your company? Q. Thinking of the fraudulent transactions that are prevented, what is the average value of such a transaction? Q. In a typical month, approximately how many fraudulent transactions are successfully completed at your company? Q. Thinking of the fraudulent transactions that are successfully completed, what is the average value of such a transaction?
July 2012 - March 2015, n = 131 to 1,142Base: All merchants, large e Commerce
merchants experiencing specific fraud types
$0
$20
$40
$60
$80
$100
$120
$140
$160
Value of successfulfraudulent
transactions
Value of preventedfraudulent
transactions
$120
$149$155 $151
$114 $113$113
$133
$ a
mt.
of
tran
sact
ion
s

12
2015 LexisNexis® True Cost of FraudSM Study
$0.00
$0.50
$1.00
$1.50
$2.00
$2.50
$3.00
Online channel mCommercechannels
Mobile POS In person at thetraditional POS
Other channels
$2.27$2.08
$2.89
$2.38 $2.38
To
tal C
ost
pe
r D
olla
r o
f F
rau
d L
oss
es
LexisNexis Fraud MultiplierSM
Q: In thinking about the total fraud losses suffered by your company, please indicate the distribution of various fraud costs over the past 12 months.
March 2014, n varies 48 to 199Base: Merchants experiencing fraud through
specific channels in the past 12 months
*Weighted merchant data
The channel conundrumMerchants struggle to balance fraud mitigation and costs across various channels The plethora of payment channel options does not necessarily make fraud mitigation easier for merchants. They have to constantly evaluate their fraud risks against convenience and opportunities. In this digital age, merchants have little choice but to move goods via online sales channels. However, continued growth of fraud in the online and mobile channels leave merchants liable for increasing fraud losses.1 For multichannel merchants, the proportion of fraud losses suffered via the online channel has gone up by 31%, from 42% in 2014 to 55% in 2015 (See Figure 17).
Online channels experience a lower fraud multiplier ($2.27) compared to physical or other channels ($2.38 for both POS and other channels) (see Figure 5). Higher chargebacks in the online channel and a decreased likelihood of costs associated with replacement of physical goods, an expense that physical channels cannot ignore, contribute to this trend.
Due to Merchant Chargeback Liability, Heavy Fraud Losses Result in Lower Fraud Multipliers for Online and mCommerce
Figure 5.Cost per dollar of fraud losses by sales channel
13
2015 LexisNexis® True Cost of FraudSM Study
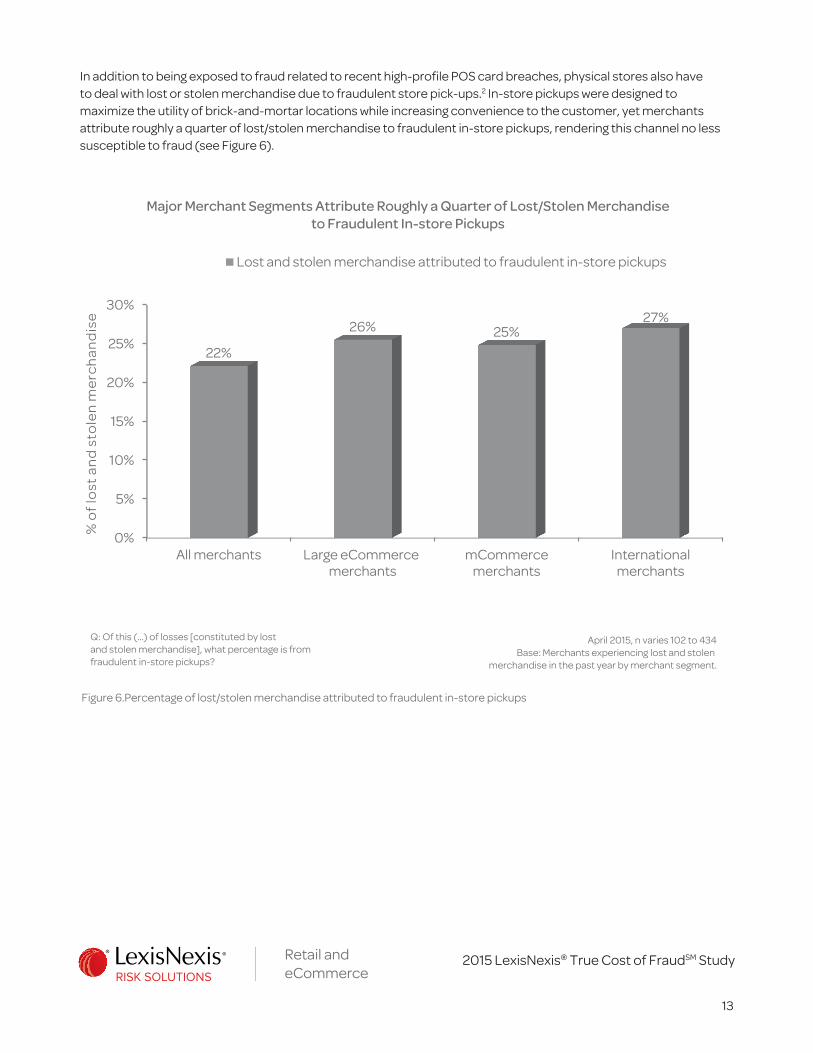
In addition to being exposed to fraud related to recent high-profile POS card breaches, physical stores also have to deal with lost or stolen merchandise due to fraudulent store pick-ups.2 In-store pickups were designed to maximize the utility of brick-and-mortar locations while increasing convenience to the customer, yet merchants attribute roughly a quarter of lost/stolen merchandise to fraudulent in-store pickups, rendering this channel no less susceptible to fraud (see Figure 6).
Major Merchant Segments Attribute Roughly a Quarter of Lost/Stolen Merchandise to Fraudulent In-store Pickups
Figure 6.Percentage of lost/stolen merchandise attributed to fraudulent in-store pickups
0%
5%
10%
15%
20%
25%
30%
All merchants Large eCommercemerchants
mCommercemerchants
Internationalmerchants
22%
26% 25%27%
% o
f lo
st a
nd
sto
len
me
rch
and
ise
Lost and stolen merchandise attributed to fraudulent in-store pickups
Q: Of this (...) of losses [constituted by lost and stolen merchandise], what percentage is from fraudulent in-store pickups?
April 2015, n varies 102 to 434Base: Merchants experiencing lost and stolen
merchandise in the past year by merchant segment.

14
2015 LexisNexis® True Cost of FraudSM Study
Debit card fraud is on the riseDebit card fraud surged in 2015, as debit card-accepting merchants attributed 30% of fraud to this payment type (see Figure 7). This trend was expected as the advent of EMV will make the misuse of counterfeit payment cards nearly impossible. Fraudsters have been expected to make a last-ditch effort to collect and use as much breached and skimmed card data as possible. Alternative payment fraud, on the other hand, continues to fluctuate year after year, leaving merchants without a barometer for assessing the risk associated with this payment method. This payment method accounted for 23% of fraudulent transactions in 2013, dropping to 13% in 2014, only to go back up to 21% of fraudulent transactions in 2015, for merchants accepting these payment types (see Figure 7).
Debit Card Fraud Surged in 2015 Due to Fraudsters’ Last-Ditch Effort to Use Stolen Data; Alternative Payment Fraud Escalated as Well
Figure 7.Distribution of fraud losses for merchants accepting specific payment types
*Weighted merchant data
Q: In thinking about which payment methods are most commonly linked to fraudulent transactions, please indicate the percentage distribution, to the best of your knowledge, of the payment methods used to commit fraud against your company.Means shown.
July 2011 – March 2014, n varies 58 to 246Base= Merchants experiencing fraud amount
greater than $ 0 in the past year and accept particular payments methods
0%
10%
20%
30%
40%
50%
60%
Debit cards Credit cards Alternative paymentmethods (PayPal,
Bill Me Later, eBillme,Google Checkout,
etc.)
Checks
20%
60%
9%
46%
15%
58%
23%
46%
16%
52%
13%
41%
30%
49%
21%
42%
Pe
rce
nta
ge o
f m
erc
han
ts a
cce
pti
ng
pay
me
nt
typ
e
2012 2013 2014 2015
15
2015 LexisNexis® True Cost of FraudSM Study
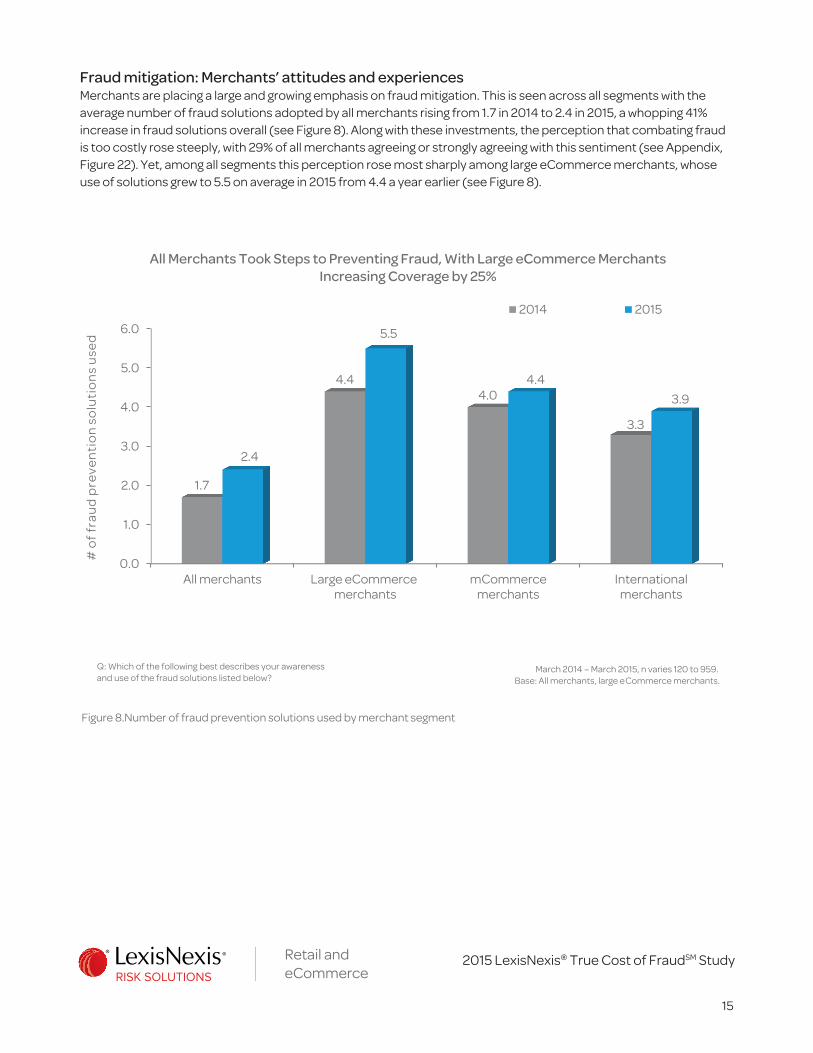
Fraud mitigation: Merchants’ attitudes and experiencesMerchants are placing a large and growing emphasis on fraud mitigation. This is seen across all segments with the average number of fraud solutions adopted by all merchants rising from 1.7 in 2014 to 2.4 in 2015, a whopping 41% increase in fraud solutions overall (see Figure 8). Along with these investments, the perception that combating fraud is too costly rose steeply, with 29% of all merchants agreeing or strongly agreeing with this sentiment (see Appendix, Figure 22). Yet, among all segments this perception rose most sharply among large eCommerce merchants, whose use of solutions grew to 5.5 on average in 2015 from 4.4 a year earlier (see Figure 8).
All Merchants Took Steps to Preventing Fraud, With Large eCommerce Merchants Increasing Coverage by 25%
Figure 8.Number of fraud prevention solutions used by merchant segment
0.0
1.0
2.0
3.0
4.0
5.0
6.0
All merchants Large eCommercemerchants
mCommercemerchants
Internationalmerchants
1.7
4.44.0
3.3
2.4
5.5
4.4
3.9
# o
f fr
aud
pre
ven
tio
n s
olu
tio
ns
use
d
2014 2015
March 2014 – March 2015, n varies 120 to 959.Base: All merchants, large eCommerce merchants.
Q: Which of the following best describes your awareness and use of the fraud solutions listed below?

16
2015 LexisNexis® True Cost of FraudSM Study
This indication of exhausted morale is understandable as merchants are forced to “chase bad money with good money,” increasing investment in fraud mitigation after experiencing steep losses associated with a rising number of fraudulent transactions. While all merchants spent on average $7,000 annually on fraud mitigation efforts, larger merchants that are more likely to serve clients through multiple channels spent upward of $100K. Large eCommerce merchants allocated $115K to fraud mitigation, mCommerce spent $133K, and international merchants assigned $102K to this area. This high amount of spend on fraud mitigation, as well as the high dollar volume of fraud losses and the number of attacks these merchants experience, leaves no doubt as to why merchants would express increasing exasperation at the lengths required to reduce fraud impact (see Figure 9).
Large eCommerce Merchants Spend the Greatest Amount on Fraud Mitigation
Figure 9.Dollar amount spent on fraud mitigation in the past 12 months
$0
$20,000
$40,000
$60,000
$80,000
$100,000
$120,000
$140,000
All merchants Large eCommercemerchants
mCommercemerchants
Internationalmerchants
$7,000
$115,000
$133,000
$102,000
To
tal s
pe
nd
on
fra
ud
mit
igat
ion
Total spend on fraud mitigation in the past 12 months
April 2015, n varies 92 to 959Base: All merchants, large eCommerce merchants, mCommerce merchants, International merchants.
Q: What is the total dollar amount your company spent on fraud mitigation in the past 12 months?

17
2015 LexisNexis® True Cost of FraudSM Study
Reduced to its respective components, fraud solutions make up the largest component of fraud mitigation efforts with all merchants spending an average of nearly $4K annually, followed by costs of physical security at $2K. When compared to the average merchant, not only do large eCommerce merchants have more solutions in place, but these solutions also take up the bulk of their fraud mitigation costs, with an annual spend of $60K (see Figure 10). This expense may be justified if the efforts kept manual review costs and efforts at a minimum. Merchants are spending thousands on automated systems that should be decisioning transactions, yet they spend thousands more on humans to manually review orders that fall through the cracks. Despite a number of fraud solutions in place, all merchants still spend an average of $1K in manual reviews. For large eCommerce merchants and mCommerce merchants, it is as high as $24K, followed by international merchants at $18K (see Figure 10).
Fraud Prevention Solutions are the Largest Component of Mitigation Costs, Followed by Physical Security
Figure 10.Fraud prevention and security costs by merchant segment
$0
$10,000
$20,000
$30,000
$40,000
$50,000
$60,000
Cost of fraudprevention solutions
Cost of manualreviews
Cost of physicalsecurity
Other fraudprevention costs
$4k $1k $2k $100
$60k
$24k $26k
$0
$55k
$24k
$35k
$1k
$38k
$26k
$37k
$600
To
tal A
nn
ual
Co
sts
All merchants Large eCommerce merchants mCommerce merchants International merchants
April 2015, n varies 92 to 959Base: All merchants, large eCommerce merchants, mCommerce merchants, International merchants.
Q: What is the percentage distribution of mitigation costs across the following areas in the past 12 months?

18
2015 LexisNexis® True Cost of FraudSM Study
Merchants struggle to manage remote channel fraudDue to the anonymity of remote channels, which includes online, mobile, mail and telephone channels, and the ability to conduct more fraudulent transactions in a shorter amount of time, fraud via these channels is up to seven times as difficult to prevent as in-person fraud (see Figure 11).
Fraud Through Remote Channels Is up to 7 Times as Difficult to Prevent as In-Person Fraud
Figure 11.Number of fraudulent transactions prevented per successful attempt by channel
0
2
4
6
8
10
All merchants Large eCommercemerchants
mCommercemerchants
Internationalmerchants
3.6
7.28.2
6.4
2.1
7.5
4.4 4.2
.8
10.8
3.2 3.6
.5
5.7
2.51.8
# P
reve
nte
d fr
aud
ule
nt
tran
sact
ion
s p
er
succ
ess
ful f
rau
du
len
t tr
ansa
ctio
n
In-Person Online Mobile Other (mail/telephone)
March 2014, March 2015, n varies 45 to 508Base: All merchants, large eCommerce merchants,mCommerce merchants, international merchants.
Q: Please indicate the distribution of the payment channels linked to prevented and successful fraudulent transactions.

19
2015 LexisNexis® True Cost of FraudSM Study
Merchants turned to a probable approach to containing fraud in online, mobile, and other remote channels by increasing the adoption of a number of fraud solutions compared to 2014. Not all fraud mitigation solutions are created equal, as some solutions prevent significantly more fraudulent transactions per successful one (see Figure 12). By casting a wider net with fraud solutions, merchants expect to keep fraud in remote channels in check. Yet we know this isn’t working as fraud losses as a percentage of revenue continue to trend up, rising from 0.68% in 2014 to 1.32% in 2015 (see Figure 3). Merchants need to either fine-tune the mix, turning up the dial on effective solutions and turning down those failing to do the job, or leverage something new. This is also where cooperation with other merchants and Financial Institutions (FIs) can come in handy — shared intelligence about fraud trends and the risk of individual transactions could provide insight on appropriate tools and making better decisions.
Merchants Struggling With Online, Mobile, and Other Remote Fraud Turn to a Variety of Solutions
Figure 12.Number of prevented fraudulent transactions per successful attempt by fraud prevention solutions currently used
0
1
2
3
4
5
6
7
8
9
10
8.4 8.2 8.2 7.87.0
5.7 5.4 5.3
7.8
6.6
8.3
6.1
5.0
6.5 6.15.7
3.63.0
4.6
2.83.6 3.5
3.0 3.3
# P
reve
nte
d fr
aud
ule
nt
tran
sact
ion
s p
er
succ
ess
ful f
rau
du
len
t tr
ansa
ctio
n
Online Mobile Other (mail/telephone)
April 2015, n varies 90 to 150Base: Merchants accepting specific
channels by type of solution used.
Automated transaction
scoring
Rules-based filters
Quiz/challenge questions
Transaction/customer
profile databases
Real-time transaction
tracking tools
Geolocation Device ID/ Device
fingerprinting
3-D Secure tools
Q: How many transactions does your company flag as potentially fraudulent in a typical month in the past year?
20
2015 LexisNexis® True Cost of FraudSM Study
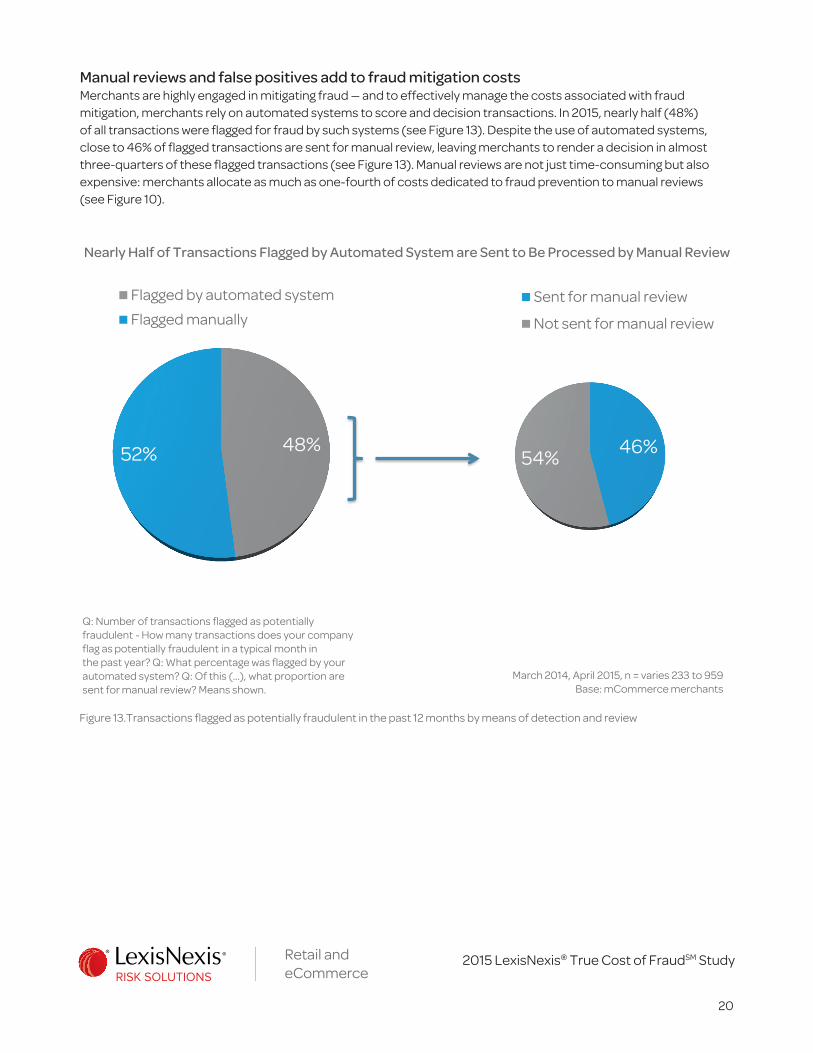
Manual reviews and false positives add to fraud mitigation costsMerchants are highly engaged in mitigating fraud — and to effectively manage the costs associated with fraud mitigation, merchants rely on automated systems to score and decision transactions. In 2015, nearly half (48%) of all transactions were flagged for fraud by such systems (see Figure 13). Despite the use of automated systems, close to 46% of flagged transactions are sent for manual review, leaving merchants to render a decision in almost three-quarters of these flagged transactions (see Figure 13). Manual reviews are not just time-consuming but also expensive: merchants allocate as much as one-fourth of costs dedicated to fraud prevention to manual reviews (see Figure 10).
Nearly Half of Transactions Flagged by Automated System are Sent to Be Processed by Manual Review
Figure 13.Transactions flagged as potentially fraudulent in the past 12 months by means of detection and review
48%52%
Flagged by automated system
Flagged manually
March 2014, April 2015, n = varies 233 to 959Base: mCommerce merchants
Q: Number of transactions flagged as potentially fraudulent - How many transactions does your company flag as potentially fraudulent in a typical month in the past year? Q: What percentage was flagged by your automated system? Q: Of this (...), what proportion are sent for manual review? Means shown.
46%54%
Sent for manual review
Not sent for manual review
21
2015 LexisNexis® True Cost of FraudSM Study
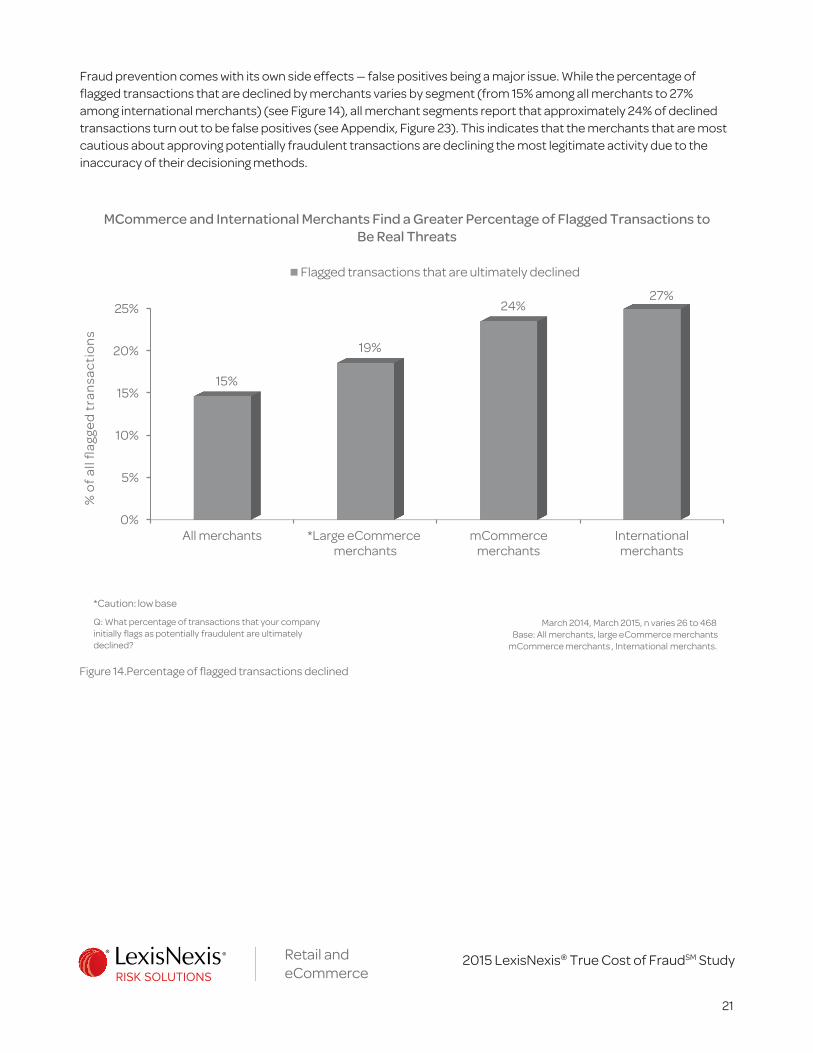
Fraud prevention comes with its own side effects — false positives being a major issue. While the percentage of flagged transactions that are declined by merchants varies by segment (from 15% among all merchants to 27% among international merchants) (see Figure 14), all merchant segments report that approximately 24% of declined transactions turn out to be false positives (see Appendix, Figure 23). This indicates that the merchants that are most cautious about approving potentially fraudulent transactions are declining the most legitimate activity due to the inaccuracy of their decisioning methods.
MCommerce and International Merchants Find a Greater Percentage of Flagged Transactions to Be Real Threats
Figure 14.Percentage of flagged transactions declined
0%
5%
10%
15%
20%
25%
All merchants *Large eCommercemerchants
mCommercemerchants
Internationalmerchants
15%
19%
24%27%
% o
f al
l flag
ged
tra
nsa
ctio
ns
Flagged transactions that are ultimately declined
March 2014, March 2015, n varies 26 to 468Base: All merchants, large eCommerce merchants
mCommerce merchants , International merchants.
Q: What percentage of transactions that your company initially flags as potentially fraudulent are ultimately declined?
*Caution: low base

22
2015 LexisNexis® True Cost of FraudSM Study
Financial Institution perspectivesIn conversations with FI executives, many expressed that they are also contending with the same issues being experienced by merchants, to varying degrees of success. But in addition to facing the challenges of the past year, many are also looking ahead, with the expectation that EMV will change how fraud is manifested in the payments space.
Industry concerns
1. Fraud will evolve as EMV approachesConsistent with merchant trends, FIs agree that debit card fraud is a growing challenge and attacks on debit cards had surpassed credit card fraud as a problem facing their industry. This isn’t surprising considering the pending EMV rollout in October. As retailers continue to reterminalize in the face of EMV liability shift, pressure is increasing for fraudsters to use breached magnetic-stripe data to counterfeit debit cards at the point of sale while credit cards become more secure for online transactions. According to FIs, account takeover is expected to continue rising, especially after counterfeit fraud begins to decline.
2. Card skimming is moving to small merchantsWhile larger merchants seem to be setting funds aside for fraud mitigation, smaller merchants bear the brunt of the increase in the amount of account data compromised in breaches. One issuer said the card skimming rates had doubled in 2015 from 2014. Again, this shift may be due to fraudsters reacting to the ongoing EMV rollout.
3. Chargeback ratesFinancial institution executives are split on their assessment of chargeback rates. While one executive insisted that rates have been stable and that they saw fewer chargebacks from merchants in 2015, another executive said they are consistently succeeding in transferring liability to merchants.
4. Impact of mobile wallet fraudContrary to what mCommerce merchants experienced in 2015 in terms of challenges, financial industry executives didn’t consider the mobile channel to be problematic and expected minimal fraud through this channel. Despite the initially high fraud rates through Apple Pay, none of the issuers interviewed expect mobile contactless fraud to be an ongoing problem — one of the few bright points shared universally among executives.

23
2015 LexisNexis® True Cost of FraudSM Study
Merchant challengesLarge eCommerce merchantsThe overall fraud multiplier for all merchants may have declined in 2015, but large eCommerce merchants saw an increase yet again in 2015, with the fraud multiplier rising from $2.33 in 2014 to $2.62 in 2015 (see Figure 15). The diversity of channels through which many large eCommerce merchants accept payments, along with replacement and redistribution costs related to cases of identity theft and friendly fraud likely contributed to this increase. In addition, fraud as a percentage of revenue increased from 0.85% in 2014 to 1.39% in 2015, an alarming 64% increase (see Figure 3).
The Fraud Multiplier Declined for All Merchants, but Larger Merchants with More Sales Channels and Geographies Suffered Disproportionately
Figure 15.Cost per dollar of fraud losses by merchant segment
$0.00
$0.50
$1.00
$1.50
$2.00
$2.50
$3.00
$3.50
All merchants Large eCommerce mCommerce Internationalmerchants
$2.79
$2.23 $2.35 $2.32
$3.08
$2.33 $2.42$2.30$2.23
$2.62 $2.41 $2.53
To
tal C
ost
pe
r D
olla
r o
f F
rau
d L
oss
es
LexisNexis Fraud MultiplierSM
2013 2014 2015
July 2012– March 2014, n varies 41 to 712Base = Merchants experiencing >$0
fraud in the past 12 months by segment
*Weighted merchant data
Q: In thinking about the total fraud losses suffered by your company, please indicate the distribution of various fraud costs over the past 12 months.

24
2015 LexisNexis® True Cost of FraudSM Study
More than 4 in 10 (44%) large eCommerce merchants believe combating fraud is too costly (see Appendix, Figure 22). As fraud losses continue to trend upward as a percentage of revenue, large eCommerce merchants are spending the most on fraud mitigation, averaging $115K in the past 12 months (see Figure 9). This is amid a 25% increase in the number of fraud prevention solutions this segment is using (see Figure 8).
Unsurprising for a segment that does considerable business through a remote channel, identity theft and friendly fraud are the sharpest pain points for large eCommerce merchants, with 26% of fraud losses being attributed to each of these types of fraud in the last 12 months (see Figure 16). Considering the challenges related to confirming customer identities remotely, merchants may be unintentionally underreporting the rate of identity theft as they cannot easily distinguish between identity and friendly fraud.
Identity Theft and Friendly Fraud are the Sharpest Pain Points for Large eCommerce Merchants
Figure 16.Distribution of losses across fraud types for large eCommerce and all merchants
0%
5%
10%
15%
20%
25%
30%
Friendly fraud Identity theft(unauthorized
transaction)
Fraudulentrequest for
return/refund (%attributed to total
fraud loss in thepast 12 months)
Lost or stolenmerchandise
Other
22%
16%
22%
29%
12%
26% 26%
22%24%
1%
% o
f m
erc
han
ts
All merchants Large eCommerce merchants
March 2014, n = 100, 581Base: All merchants, large eCommerce
merchants experiencing specific fraud types
Q10. Please indicate, to the best of your knowledge, the percentage distribution of the following fraud methods below, as they are attributed to your total annual fraud loss over the past 12 months.

25
2015 LexisNexis® True Cost of FraudSM Study
It is generally accepted that EMV will be highly effective in preventing counterfeit card fraud at the point of sale; however, it will do little to prevent Card-Not-Present (CNP) fraud from rising dramatically over the next few years. In fact, fraud is already moving online while merchant reterminalization for EMV is still underway. The online channel generated 55% of the fraud experienced by merchants that accept payments in the channel, up a staggering 31% since 2014 despite sales through the online channel comprising only 5% more revenue for online-selling merchants in the past year (from 39% to 41% of the total sales volume, on average) (see Figure 17). This segment will only face further problems with identity theft over the next few years, as CNP fraud is expected to grow from $10 billion to $19 billion.3
Online-Accepting Merchants Saw this Fraud Type Spike in 2015, While Physical-Presence Merchants Lost a Lesser Volume to In-store Fraud
Figure 17.Distribution of fraud losses for merchants accepting specific channels
0%
10%
20%
30%
40%
50%
60%
70%
Physical/In-store (include in-store/self-service kiosks)
Online Other
58%
31%
16%
62%
42%
32%
53%
42%
29%
38%
55%
33%
Pe
rce
nt
of
chan
ne
l-ac
cep
tin
gm
erc
han
ts
2012 2013 2014 2015
Q: Thinking about the total fraud losses suffered by your company in the past 12 months, to the best of your knowledge, what is the percentage distribution of fraud over the following sales channels.
July 2012 – April 2015, n varies 58 to 176*Base= Merchants experiencing fraud amount greater than $0 in the past year and accept payments through particular channels.

26
2015 LexisNexis® True Cost of FraudSM Study
MCommerce merchantsThe anticipation and excitement among merchants for the mobile channel may be wearing off. Having experienced significantly higher fraud losses as a percentage of revenue, increasing from 1.36% in 2014 to 1.68% in 2015 (See Figure 3), mCommerce merchants lost confidence in several benefits of mobile channel sales in 2015. The portion of mCommerce merchants aligning with positive aspects of mobile adoption has decreased significantly in most cases, but more specifically in convenience (85% in 2014 vs. 64% in 2015) and meeting customer expectations (61% in 2014 vs. 51% in 2015) (see Figure 18).
MCommerce Merchants Lost Confidence in Several Benefits of Mobile Channel Sales in 2015,Likely Due to High Fraud Losses
Figure 18.MCommerce merchants’ reasons for adopting mobile payments
0%
10%
20%
30%
40%
50%
60%
70%
80%
90%
It is convenientfor customers
It meetscustomer
expectations interms of
providing morepaymentoptions
It helps inefficient
processing ofpayments
It helps growbusiness
Need to remaincompetitive in
the market
Receiveincentives
from acquirers
Other
85%
61%
49%57%
53%
10%
2%
64%
51%46%
53%47%
20%
1%
% o
f m
erc
han
ts
mCommerce merchants 2014 mCommerce merchants 2015
March 2014, April 2015, n = 255, 420Base: mCommerce merchantsQ: What were the reasons for accepting mobile payments?

27
2015 LexisNexis® True Cost of FraudSM Study
Digital goods become a larger component of sales, with an 8% increase in merchants selling digital goods in 2015. Given that digital goods are sent to virtual addresses with far less permanence and reliability than physical ones, it is understandable that mCommerce merchants cite increasing difficulty in verifying addresses — 12% stated this as a challenge in 2015 vs. 9% in 2014 — and confirming package delivery — 21% stated this as a challenge in 2015 vs. 12% in 2014. Despite these challenges, mCommerce merchants have improved in their perceived ability to verify a customer’s ID compared to 2014, with only 26% citing this as a challenge in 2015 (see Figure 19).
MCommerce Merchants Cite Increasing Difficulty in Verifying Addresses and Package Delivery, but Make Strides in Identity Verification
Figure 19.Top mobile channel challenges faced by mCommerce merchants, 2014–2015
0%
5%
10%
15%
20%
25%
30%
35%
40% 38%
12%16%
9%6%
8%5% 4%
2% 0%
26%
21%
17%
12%9%
5% 5%3% 2% 1%
% o
f m
erc
han
ts
mCommerce merchants 2014 mCommerce merchants 2015
March 2014, April 2015, n = 255, 420Base: mCommerce merchants
Q: Please rank the top 3 challenges related to fraud faced by your company when selling merchandise to customers using Mobile channel. Top challenge shown
Verification of customer
identityConfirmation
of package delivery
Lack of effective fraud
prevention tools for
online/mobile channel orders
Address verification
Limited jurisdiction and
ability to reclaim
merchandise/ costs through
litigation
Delay in payment
confirmation
Emergence of new and varied
payment methods
Assessment of fraud risk by
country/region
Excessive manual order
reviewsOther

28
2015 LexisNexis® True Cost of FraudSM Study
International merchantsInternational merchants are no less susceptible to fraud than any other merchant segment, as seen in the increase in the fraud multiplier, rising from $2.30 in 2014 to $2.53 in 2015 (see Figure 15). International merchants continue to see an upward trend in fraud loss as a percentage of revenue, increasing from 1.21% in 2014 to 1.56% in 2015 (see Figure 3).
While international merchants may find verifying customer ID (38% fewer merchants cite this as a challenge) and confirming package delivery ( 53% fewer merchants cite this as a challenge) less challenging, identity theft and friendly fraud remain major loss drivers (see Figure 20).
Challenges Specific to International Merchants Pose More Difficulty in 2015, Indicating that Newcomers may Be Unprepared
Figure 20.Top sales challenges faced by international merchants, 2014–2015
Verification of customer
identity
Confirmation of package
deliveryLack of
specialized fraud
prevention tools for
international orders
Address verification
Limited jurisdiction and
ability to reclaim
merchandise/ costs through
litigation
Delay in payment
confirmation
Emergence of new and varied
payment methods
Assessment of fraud risk by
country/region
Excessive manual order
reviews
Other0%
5%
10%
15%
20%
25%
30% 29%
11%
4%5%
19%
7%
2%
11%
6%5%
3%
18%
12% 11% 10% 9% 9% 8% 8% 7% 7%
1%
% o
f m
erc
han
ts
International merchants 2014 International merchants 2015
March 2014, April 2015, n = 255, 420Base: International merchants
Q: Please rank the top 3 challenges related to fraud faced by your company when selling merchandise to customers outside the U.S. Top challenges shown.
Challenges in acceptance of international-
based payment methods

29
2015 LexisNexis® True Cost of FraudSM Study
International merchants rush to accept mCommerce payments — increasing from 29% of merchants in 2014 to 42% in 2015 (see Figure 21); however, they may find themselves facing the same challenges mCommerce merchants cite — friendly fraud, identity theft, and fraudulent returns — leaving them unprepared for these challenges, especially outside the U.S.
As International Merchants Rush to Accept mCommerce Payments, Their Identity Theft and Friendly Fraud Threats will Be Magnified
Figure 21.Acceptance of mCommerce payments by merchant segment, 2014¬–2015
0%
10%
20%
30%
40%
50%
60%
All merchants Large eCommerce merchants International merchants
15%
57%
29%
15%
59%
42%
% o
f m
erc
han
ts
Accepts mCommerce payments — 2014 Accepts mCommerce payments — 2015
March 2014 – March 2015, n varies 92 to 1,106Base: All merchants, large eCommerce
Merchants, international merchants
Q: Which of the following mobile payment channels do you currently accept? Mobile web browser, mobile app, or bill to mobile phone is selected.
This foray into new channels could complicate fraud mitigation and increase related mitigation costs. International merchants adopted 3.9 fraud solutions in 2015 compared to 3.3 in 2014 (see Figure 8), spending an average of $80,000 on fraud mitigation in the past 12 months (see Figure 9). International merchants are four times as likely to believe manual reviews are a top challenge compared to that of 2014 and spent nearly $18,000 in manual reviews (see Figure 10). With the expected growth of CNP fraud over the next few years, matters will only get worse.
30
2015 LexisNexis® True Cost of FraudSM Study
Methodology In March 2015, LexisNexis® Risk Solutions retained JAVELIN to conduct the sixth annual comprehensive research study on U.S. retail merchant fraud. LexisNexis conducted an online survey using a merchant panel comprising 959 risk and fraud decision-makers and influencers. The merchant panel includes representatives of all company sizes, industry segments, channels, and payment methods. The overall margin of sampling error is +/-3.16 percentage points at the 95% confidence interval; the margin of error is larger for subsets of respondents. Overall merchant data for all years in survey history were weighted according to the U.S. Census employee size and industry distribution.
Executive qualitative interviews were also conducted with Financial Institutions to obtain their perspective on fraud losses. A total of six interviews were completed with risk and fraud executives.

31
2015 LexisNexis® True Cost of FraudSM Study
Appendix
All Key Merchant Segments are Increasingly Demoralized by the Combo of High Fraud Losses and the Perception that Combating it is Too Costly
Figure 22.Attitudes toward the cost of controlling fraud by merchant segment, 2014—2015
0%
5%
10%
15%
20%
25%
30%
35%
40%
45%
All merchants Large eCommercemerchants
mCommercemerchants
Internationalmerchants
20%
25%27%
25%
29%
44%
41% 40%
% o
f m
erc
han
ts
2014 2015
March 2014, April 2015, n varies 111 to 1,142Base: All merchants, large eCommerce,
mCommerce, and International merchants.
Q: On a scale of 1 to 5, please indicate the extent to which you agree or disagree with each statement listed below: “It costs too much to control fraud.”Top two boxes shown.

32
2015 LexisNexis® True Cost of FraudSM Study
Despite Declining Different Portions of Flagged Transactions, the False-Positive Rate is Similar for All Segments
Figure 23.Percentage of declined transactions that are false positives
0%
5%
10%
15%
20%
25%
30%
All merchants Large eCommercemerchants
mCommercemerchants
Internationalmerchants
24%25%
27% 27%
% o
f tr
ansa
ctio
ns
wh
ich
are
FP
de
clin
es
Declined transactions which turn out to be false positives
March 2014, March 2015, n varies 52 to 403Base: All merchants, large eCommerce merchants
mCommerce merchants, International merchants.Q: What percentage of declined transactions turned out to be false positives?
33
2015 LexisNexis® True Cost of FraudSM Study
Sources1 Fixing CNP Fraud: Solutions for a Pre- and Post-EMV U.S. Market, Javelin Strategy & Research, October 2014.
2 2015 Data Breach Fraud Impact Report, Javelin Strategy & Research, June 2015.
3 Fixing CNP Fraud: Solutions for a Pre- and Post-EMV U.S. Market, Javelin Strategy & Research, October 2014.
LexisNexis and the Knowledge Burst logo are registered trademarks of Reed Elsevier Properties Inc., used under license. True Cost of Fraud is a service mark of LexisNexis Risk Solutions Inc. LexisNexis Fraud Multiplier is a service mark of Reed Elsevier Properties Inc. Copyright © 2015 LexisNexis. All rights reserved. NXR11181-00-0815-EN-US
For more informationCall: 866.818.0265Visit: lexisnexis.com/retail-ecommerceOr email [email protected]
About LexisNexis Risk SolutionsLexisNexis Risk Solutions (www.lexisnexis.com/risk) is a leader in providing essential information that helps customers across all industries and government assess, predict and manage risk. Combining cutting-edge technology, unique data and advanced analytics, LexisNexis Risk Solutions provides products and services that address evolving client needs in the risk sector while upholding the highest standards of security and privacy. LexisNexis Risk Solutions is part of RELX Group plc, a world-leading provider of information solutions for professional customers across industries.
About JAVELINJAVELIN, a division of Greenwich Associates, provides strategic insights into customer transactions, increasing sustainable profits for financial institutions, government, payments companies, merchants and other technology providers.
The views expressed by JAVELIN are not necessarily those of LexisNexis Risk Solutions.
The opinions and quotes expressed in this paper are those of the interviewees and do not necessarily reflect the positions of LexisNexis Risk Solutions.