trump’s hina trade war – what’s next?
TRANSCRIPT

1
‘Trump’s China Trade War –
What’s Next? ’
International Footwear Conference
Guangzhou, China
May 30, 2019
Peter T. Mangione
Managing Director
Global Footwear Partnerships LLC
Overview
• Trump’s ‘topsy turvydom’ – China trade and beyond
• US and China Economies
• US life style shift – impact on leather shoes
• Global Footwear Supply – sourcing ‘scramble’
• Takeaways

Trump: Narcissistic, Self-congratulatory, Mendacious, Conflicts of Interest, Media Wars, Tweets, Law Suits – Popularity Slips (40% approval)
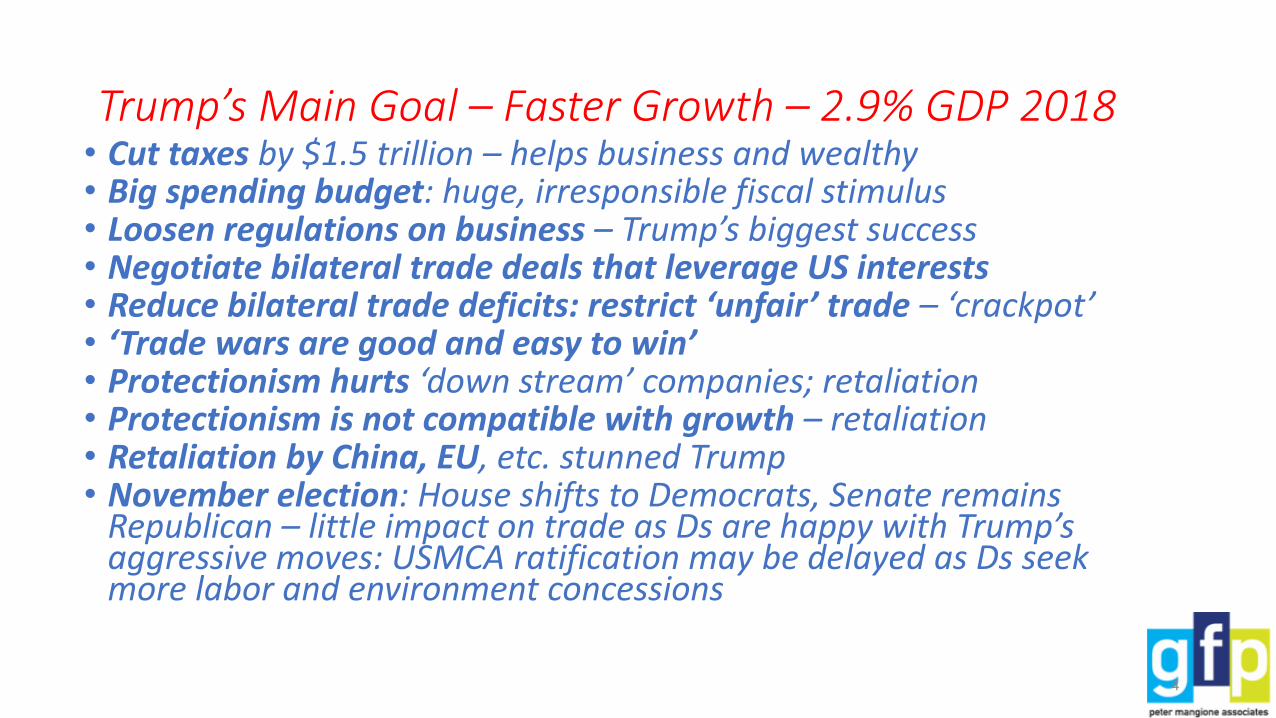
Trump’s Main Goal – Faster Growth – 2.9% GDP 2018• Cut taxes by $1.5 trillion – helps business and wealthy• Big spending budget: huge, irresponsible fiscal stimulus • Loosen regulations on business – Trump’s biggest success • Negotiate bilateral trade deals that leverage US interests• Reduce bilateral trade deficits: restrict ‘unfair’ trade – ‘crackpot’ • ‘Trade wars are good and easy to win’• Protectionism hurts ‘down stream’ companies; retaliation • Protectionism is not compatible with growth – retaliation • Retaliation by China, EU, etc. stunned Trump • November election: House shifts to Democrats, Senate remains
Republican – little impact on trade as Ds are happy with Trump’s aggressive moves: USMCA ratification may be delayed as Ds seek more labor and environment concessions
4

The Trump Trade – Aggressive Protectionism – Schizophrenic Trade Team
• Trump trade team is divided but protectionists are in the ascendency • Economic nationalists: ‘crack pot’ team of extremists -- Ross (Commerce) ,
Lighthizer (USTR), and Navarro (NTC)—all have close business ties with US steel industry; John Bolton, national security advisor, seasoned operator
• Internationalists: overall, weak -- Larry Kudlow (NEC) TV economist, free trader but inexperienced, Mnuchin (Treasury) capable but inexperienced, Mike Pompeo (State) former head of CIA, conservative military leader, no strong views on trade
• Trump sees trade as a ‘zero sum’ game determined by bilateral trade surpluses (US ‘wins’) or deficits (US ‘loses’) -- an absurd tool to measure trade – completely out of touch with reality
• He has a lot of power to take unilateral actions restricting trade but retaliation against US exports hurts Trump a lot – farm exports• Historically, all US presidents become free traders in office, only the rhetoric changes, but with Trump the world looks different!
5

Is there method to Trump’s trade madness?• Priorities: Obama – all sacrificed to global warming agenda; George W. Bush – after 9/11 all focus on
terrorism; Trump – US economy is top focus, unlike his predecessors; trade reciprocity essential for US growth
• Global trading system was in bad shape before Trump: US open market but others way behind:
• EU (managed trade, ossified, over regulated): T-TIP failure
• Japan, India, Brazil, etc. (highly protected despite some openings)
• China (implemented WTO accession commitments but aggressively pursuing state sponsored monopolistic and oligopolistic industrial policy, hampering foreign competitors, accelerated under Xi’s total control society, ‘Made in China 2025’: WTO not designed to interdict vast industrial state control
• Failure of Doha round 2005: WTO ‘death knell’; without liberalizing agenda, WTO is only weak judicial entity
• TPP good start on liberalization but not ambitious enough on key government involvement and limited to only 40% of global GDP; EU, China, Brazil, India, etc. outside
• An alternative is Trump’s ‘go it alone trade agenda’ – pursuing by a strange protectionist approach, nothing less than the drastic realignment of the dysfunctional WTO global trading order – he intends to open up the world trading system much like the WTO tried with Doha using tariffs as negotiating leverage
• His unilateral protectionism has gotten the attention of all the key players who are lining up to make deals: NAFTA, EU, Japan, India, and China: all of whom are disparate to save WTO from Trump!

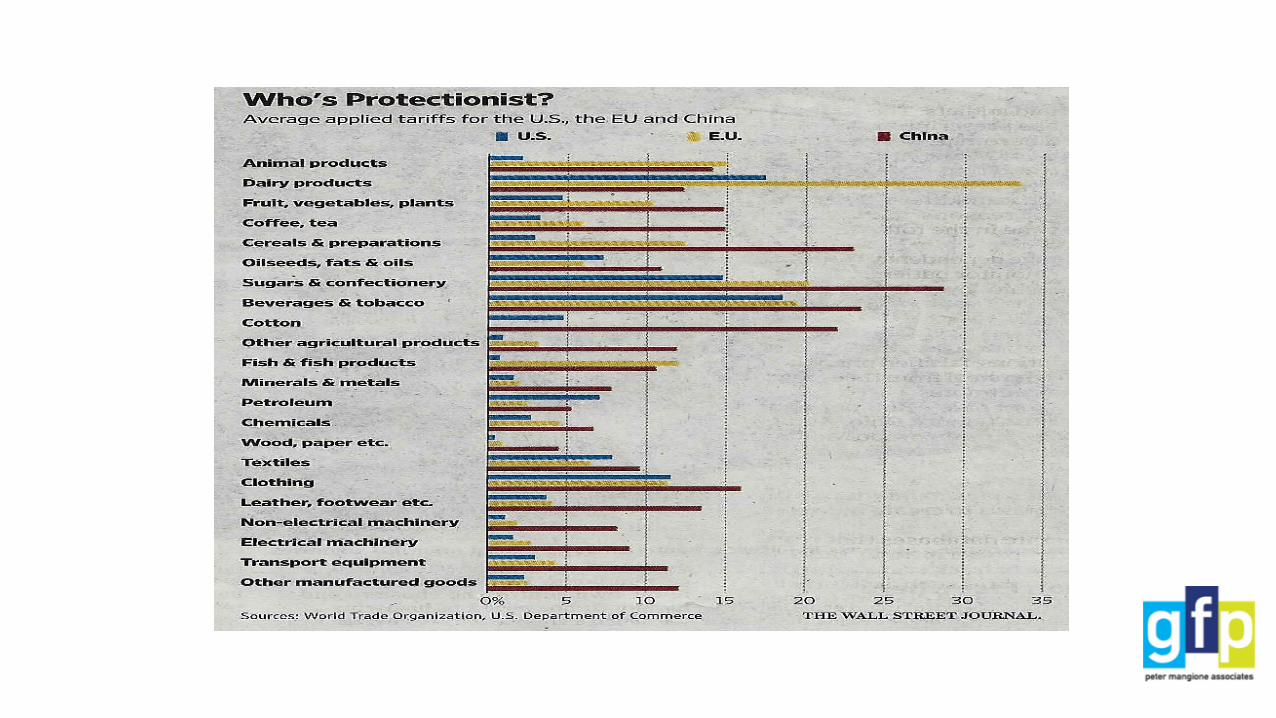
Trump’s Anti-trade Arsenal • Unfair Trade Practices, sec. 301, ‘unjustifiable’ restrictions on US trade, country specific: across the board duties can be imposed without
WTO approval; since 1974, only Obama used it for beef into the EU (unresolved). Trump has a huge investigation on China’s abuse of IP, requiring foreigners to turn over trade secrets to China partners – 25% duty on $60 billion in China electronic exports in place.
• National Security, Sec. 232, applies to items that adversely affect security following DOC and DOD investigations; wide discretion to restrict, used on oil during 1970s embargoes. Trump used this investigation to impose global duties on steel and aluminum imports and now is looking to do the same on autos!.
• Safeguards, sec. 201, following ITC finding of ‘serious injury’ to a US industry, president has wide authority to impose duties, quotas, etc. without WTO approval; typically used on an industry level, not across the board; used against steel imports from all countries in 2003; many other cases.; now: solar panels, washing machines on which Trump slammed steep duties.
• Rescind FTAs, sec 125, covers withdrawal from NAFTA , allows withdrawal within six months of notice to leave; all on president’s own discretion, but Congress would need to change all the implementing laws it enacted to implement NAFTA. Also, trade negotiating authority (TPA) or ‘fast track’ that allows FTAs to clear Congress in an orderly fashion needs to be extended by Congress soon; barely made it through initially.
• WTO cases; US can bring claims of violations of the agreement to Geneva, and has many pending cases both seeking relief and many against US trade practices. Takes years and enforcement is voluntary
• Discrimination, sec. 338, up to 50% additional duties on imports from country that discriminates against US commerce without duration limit; never used since 1930 enactment.
• National Emergency, IEEPA, must declare ‘national emergency’; authority to impose duties on a single country or more broadly, to deal with an ‘unusual and extraordinary threat to national security, foreign policy, economy, etc.’ Obama used it to control certain exports when export control law was not renewed.
• Retaliation against unilateral US trade restrictions is all but guaranteed under normal WTO rules.
• It appears that Trump will press this counter productive agenda -- once retaliation starts, he may have second thoughts about a mutually destructive ‘trade war.’
7

Trump’s Trade Deals – ‘bluster and compromise’• EU ‘tariff truce’: hit by ‘national security’ 25% duty on metals and facing 25% on
autos EU made White House deal: end EU retaliation duties and buy more soy beans while pursuing a broad free trade deal. The broad deal is fizzling in Brussels over agriculture and Trump may unleash 25% duties on cars but not likely at this time due to next election
• NAFTA deal done but not ratified. Mexico agrees to new restrictions on duty free autos, while Trump ‘blinks’ on tough ‘sunset’ and arbitration rules; Canada comes on board agreeing to modest dairy fix; Trump threatens to end NAFTA to force Congress to ratify the new USMCA or face a North America without a trade deal! But House majority Dems have huge leverage and may insist on renegotiation or special US laws especially on labor rights enforcement in Mexico
• China fight. Trump’s modus operandi is to take extreme position but compromise in the end to a get a deal: he may still hit China with the full range of extra duties (if the current talks fail) to maximize leverage before he makes concessions and ends the ‘blood letting’; shoes/garments only possible in last round

Trump’s China War – US Extra Import Duties• Solar Panels (4 years at 50-20%)
• Washing machines (3 years at 50-16%)
• Metals: Steel 25% and Aluminum 10% (Sec. 232 ‘national security’ case, applies to all suppliers with no time limit; Retaliation: China 25% on US pork, poultry, fruits, etc.; EU hits motor cycles, whisky, etc.; Canada and Mexico (could be free with NAFTA deal), Japan also hit US exports; Trump/Juncker deal would free EU, but negotiation of details just beginning; duties doubled on Turkeydue to crash devaluation of the lira.
• Autos: Sec. 232 case being investigated; Trump threatens extra 25% duty on all motor vehicles
• Intellectual Property Theft: Sec. 301: 25% on $60.0 billion of China exports of industrial, chemicals, aero space, etc. (China push back: 25% on planes, soy beans, autos, etc. about 40% of US exports to China) all duties effective August 23; US limits Chinainvestment in US
• $200.0 billion more at 10% effective September 24 with threatened at 25% on March 1, 2019, but now on hold as Trump negotiates with China with possible summit with Xi at end of April: all bags (HTS 4202), leather (41), textiles (50-60), plastic and rubber apparel (3926.20, 4015); China adds 10% extra duties on the remaining $60 billion in US imports to China and action against US investors
• $257.0 billion more (presumably at 10 to 25%) if first round of $200 billion does not produce results; probable items to be included: $70 billion cellphones, $45 computers, $36 garments, $27 toys/sports gear, $20 furniture and $15 shoes; SHOES COULDFACE EXTRA DUTIES AS EARLY AS July 2019, but this is a remote possibility only, given the likelihood of an overall deal between the countries
• If no deal is made, likely that all imports from China to the US will be subject to extra duties of 10-25% – indefinitely

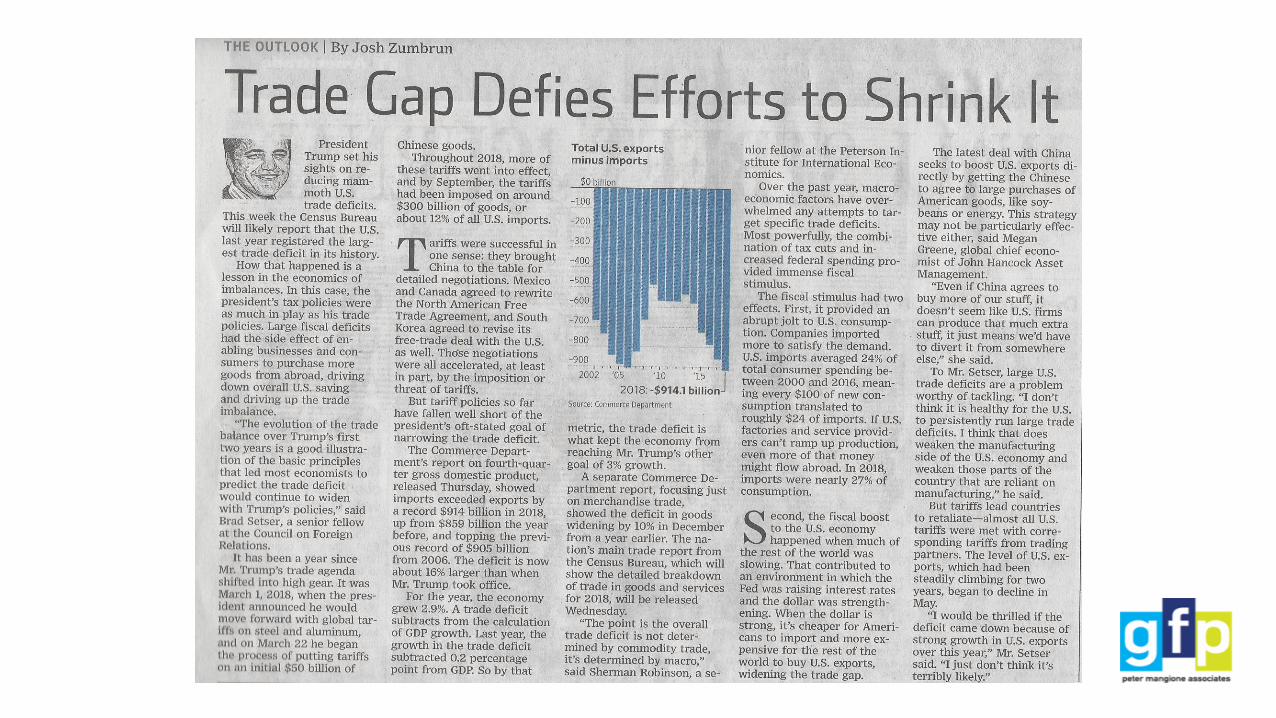
Trump’s Trade War – No Help So Far!

US/China Trade: Vital to Both!

China’s GDP Growth Slowing

China’s Policy Challenges
• Slowing growth – sustained by credit binge
• Aging and declining population – few young workers
• Soaring debt – national, local, corporate, etc.
• Old investment/export model – thriving; sustainable?
• Runaway capital outflows – heavy handed controls
• Stable currency management – will it hurt growth?
• Squeezed corporate profits – few SOEs are viable
• How many zombies? SOEs, real estate
• Xi’s strategy: more state control of economy, squeeze foreigners out, expand military, fix environment
• Trump’s trade war seeks to stimulate economic reforms that may be good for China, introducing more market discipline and less government dependence
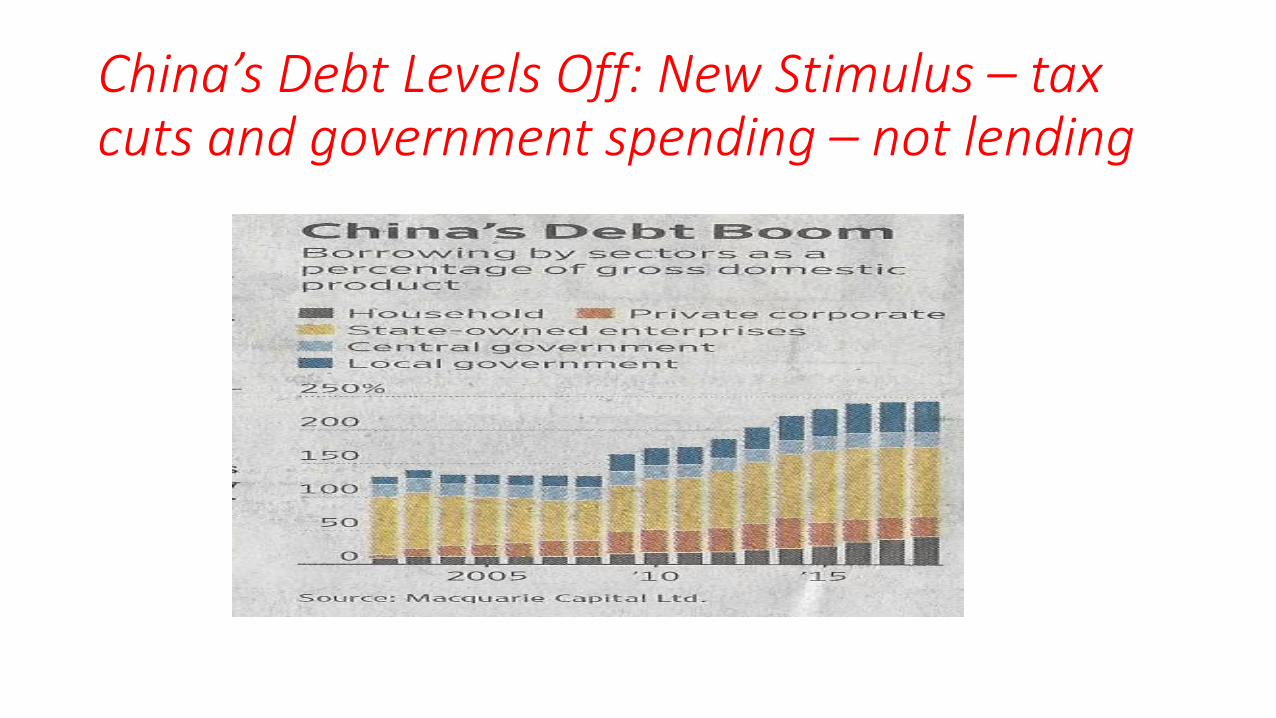
China’s Debt Levels Off: New Stimulus – tax cuts and government spending – not lending

Face to face at last! But More Talks Needed!

Trump vs. Xi Jinping: Dangerously Alike! • Impetuous, authoritarian, over confident nationalists • Each underestimates the other’s capacity to inflict pain• Each miscalculates seeing the other side likely to give in• Beijing fails to realize that Trump’s challenge to China reflects a broad disillusionment with
China in the US: both political parties, even business• Washington sees China as vulnerable to a trade war but fails to realize that China has many
weapons – beyond duties – to punish US business in China• Sure China has played unfairly (much worse under Xi) but is not likely to admit it or change
much and seems determined to slug it out with Trump • Xi says US protectionist, unilateralist; US says China aggressor, empire builder, predatory
lender, secrets thief, operating state sponsored industrial policy that discriminates against foreign investors
• Misjudgments: leave them hurtling toward breakdown• Why the ceasefire? Both sides are hurting from the trade war fallout; Trump, stung by sinking
stock market, Russia investigation scandals and farm export woes was ready to deal as he has used most of his trade leverage on Xi, who is smarting from many domestic challenges
• As usual all trade is political: G-20 timing was propitious for a mutual climb down, but now?• Outcome: uncertain and no new summit is planned before end of April• Many believe that little basic change is likely from a face saving Xi and an increasingly rigid
state dominated system

US and China Far Apart

What does Trump want from China? ‘Unconditional Surrender’Stop unfair practices (like IP theft), restructure economy to be more market driven (end subsidies) and reduce bilateral trade deficit by $200 billion!
In effect, Trump is asking China to ‘boil the ocean’!
The G-20 standstill agreement is a welcomed opportunity to get the standoff resolved – but is no guarantee of success!
• The experts on both sides have until end of April or somewhat later to negotiate a lasting settlement: in the meantime the extra duties remain for the $250 billion at 10/25% but the 10% will not be increased to 25% (includes all bags from China but not shoes, garments, phones, etc.)
• If there is no deal, implementation of new extra duties would resume!
• His insistence that China abandon its heavy government involvement with business and economic decisions may be unrealistic given China’s internal politics and growth imperatives. He can expect very little in this area except more minor changes and revised rhetoric – ‘Made in China 2025’ will move forward.
• Therefore, Trump is moving unilaterally to impede China’s state sponsored industrial unfairness: hits ZTE, Huawei and Jinhua, China’s flagship tech company designed to make China self sufficient – Trump has cut off all exports/imports from them and filed criminal charges against a dozen executives for trade secrets fraud
• In the end, Trump will have to
• settle for some concessions and declare victory or
• hammer China with extra duties and face the consequences of retaliation on his important supporters in the farm and high-tech sectors.
• He has left himself with no other alternative.
• Despite the ongoing talks, the outlook is worrisome – even with a deal in the current round, we may be in for a prolonged ‘trade war’ with more extra duties.

Xi’s Headaches Prompt Trump Trade Deal • Reforms Trump is pushing may actually help keep China growing as other China
options are not likely to make a big impact.
• Its 2019, 6%+ GDP predicted increase is ‘dicey’ at best.
• Beijing’s stimulus package is modest – tax cuts and new govt construction -- to spur • slowing exports, • domestic investment especially in urbanization, • lagging consumer confidence and consumption,• debt control, etc.
• Xi’s hostility to the private economy and his favoritism for SOEs is holding back reforms and growth
• Trump’s far reaching demands for structural reforms require huge changes in China’s government run economy but may be a healthy way forward for China

Trump’s China Trade War: Is it over?• Some constructive talks, deadline extended, deal coming end of April or a little
later with high level talks in DC and Beijing, followed by president’s summit?
• China stung by Trump’s walk out on North Korean Kim at their Hanoi summit –would he do the same to Xi?
• US wants enforcement regime (to ensure fair treatment of US firms in China), resisted by Beijing, and US may keep the first tranche of extra duties (25% on $60 billion of industrial items) as leverage for compliance
• China’s offer: • Open auto investment, lower car import duties• Increase purchased of US goods: soybeans, LNG, ethanol, etc.• Protect foreign intellectual property: complaint mechanism• Not to retaliate if US imposes sanctions for violations?• State subsidies to key China champions: no agreement on industrial policy reforms? • End duties on most US agriculture?
• Extra duties on hold: shoes?
• Is this enough for Trump? Probably is.

Consumer Demand
US Consumer Life Style Trends: Traditional Products and Channels Challenged
23

Growth Accelerates – For How Long? Nine Year Expansion!US Shoe and retail sales – exceptionally strong 2018

Leading US Department Stores – Same Store Sales
25
4/3/2/1 Q2018
% of Change
4/3/2/1 Q2017
% of Change
Average Square Footage
Shoes % of Total Sales
StoreCount
Sales 2018 (%)
Nordstrom's 0.1/2.3/4.0/0.62.6/-0.9/1.7/0.8
130,000 21% 379$15.9 (2.6)
Macy's 0.7/3.3/0.5/4.2
1.4/-3.6/-2.5/4.6182,000 36%* 870 $25.0 (0.1)
Dillard's 2.0/3.0/1.0/2.0
3.0/-1.0/-1.0/4.0
171,000 14% 291 $6.36 (2.0)
Wal-Mart US 4.2/3.4/4.5/2.12.6/2.7/1.8/1.5
180,000 1-2% 4,756 $332 (4.1)
TJ Maxx 6.0/7.0/6.0/3.04.0/0.0/3.0/1.0
24,000 5% 4,306 $39 (8.7)
Target 5.3/5.1/4.9/3.0 3.6/0.9/1.1/-1.3 160,000 2-4% 1,844 $74.4(3.7)
Kohl's 1.0/3.6/3.1/3.6 6.3/0.1/-0.4/-2.7 100,000 4-5% 1,159 $20.2(0.7) 25

Company4th/ 3rd/2nd/1st Q
20182017 4th Q/3nd Q
2017 2nd Q/1st Total Stores Sales 2018
DSW* 5.4/7.3/9.7/2.2 1.3/-0.4 0.6/-3.0 516 $3,200 (6.3%)
Famous* 1.5/2.8/2.6/-0.8 2.8/0.9 2.8/-0.6 1,055 $1,606(-1.9%)Genesco* 6.0/9.0/9.0/5.0 9.0/3.0 1.0/-4.0 1,512 $2.2 (2.9%)Shoe Carnival 4.7/4.5/6.7/1.3 4.4/-0.5 0.4/-3.9 397 $1,030.0(1.1%)Footlocker* 9.7/2.9/0.5/-2.8 -3.7/-3.7 -6.0/0.5 3,221 $7.9 (2.0%)
BrandsNike+ 7.0/10/10/13 7.0/5.0 0.0/5.0 384 $37.0^(9.0%)Under Armour+ 2.0/2.0/8.0/6.0 5.0/-4.5 9.0/6.6 241 $5.2 (3.0%)adidas+ 3.0/3.0/4.0/2.0 12.4/9.0 20/19 2,395 $24.1 (3.0%)Caleres (|) 14.8/8.5/1.9/1.4 13.8/14 16.8/1.1 234 $1,228 (7.1%)Steve Madden+ 12.6/3.9/5.8/6.2 8.3/8.0 15/11.2 229 $1.7 (7.0%)Skechers+ 11.5/7.5/10.6/16 27/16.2 16.9/9.6 204 $4.6 (11.5%)WWW+ 3.8/-3.9/-5.3/-9.7 -5.8/-3.7 -3.3/-4.6 444 $2.2 (2.5%)
U.S. Footwear Retail/BrandsPercent of Change 2018 - 2017
26

Why do stores still exist?

Boomers Decline

US Consumption Trends
• ‘Leisure’/comfort/athleisure is king
• A fundamental shift in US lifestyle and dress, redefining the apparel and shoe sectors
• US workplace moving from ‘dress casual’ to ‘casual’ even to ‘leisure’
• Is there any end to the ‘sneaker’ surge? Recent weakness?
• Women’s fashion shoes main victim: signs of renewed life
29


‘Athleisure’ Drives Women’s Sales
32

Social Exercise Drives FashionSlacks and Blue Jeans are Gone
33

Even Bankers Abandon Formal
34

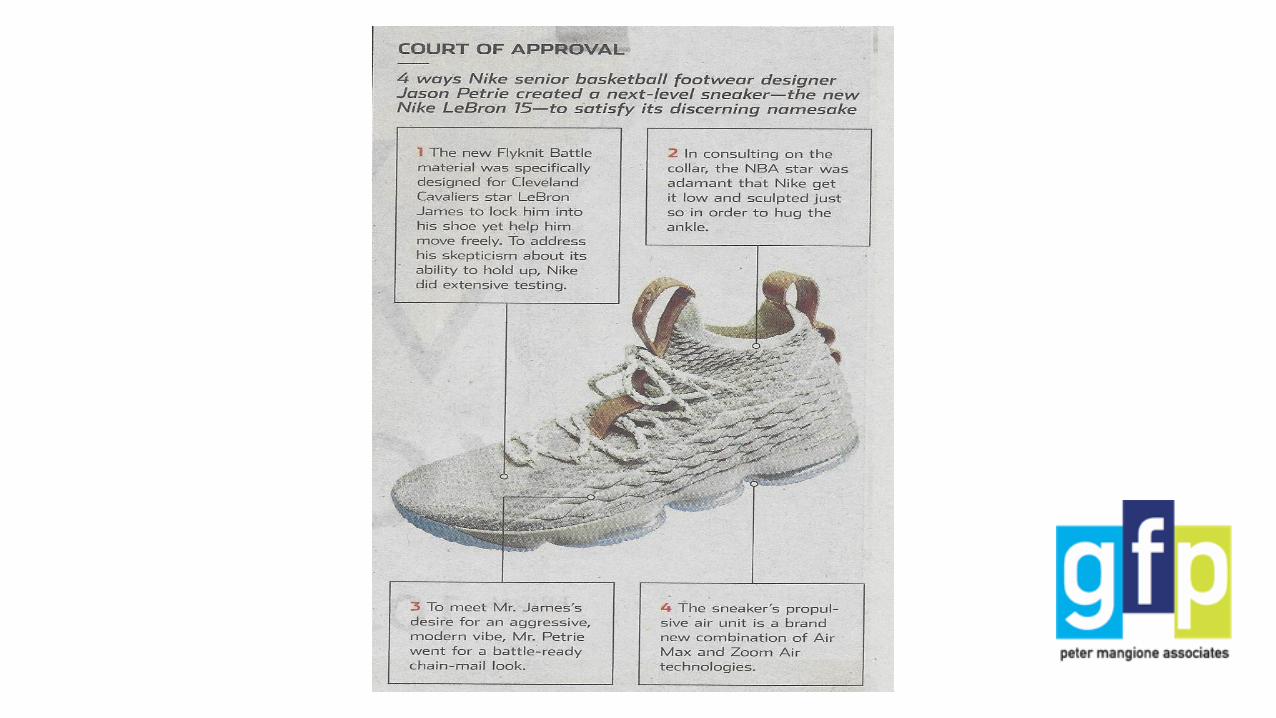
Nike Fly Knit

Fly-knit: Nike’s Latest Running Shoe


Commoditization

Athleisure Jeans – Comfort is still King!

New jeans craze: Boon for women’s non-sports shoes?

US Footwear Categories Stars = market share; plus/minus = current status
• Leather• Women’s fashion (*****) + ?
• Outdoor (**) -
• Work boots (*)
• Men’s dress (*) –
• Men’s casual (*) +
• Non-leather• Sports (******) +
• Athleisure (****) +
• Low priced plastic (******) +
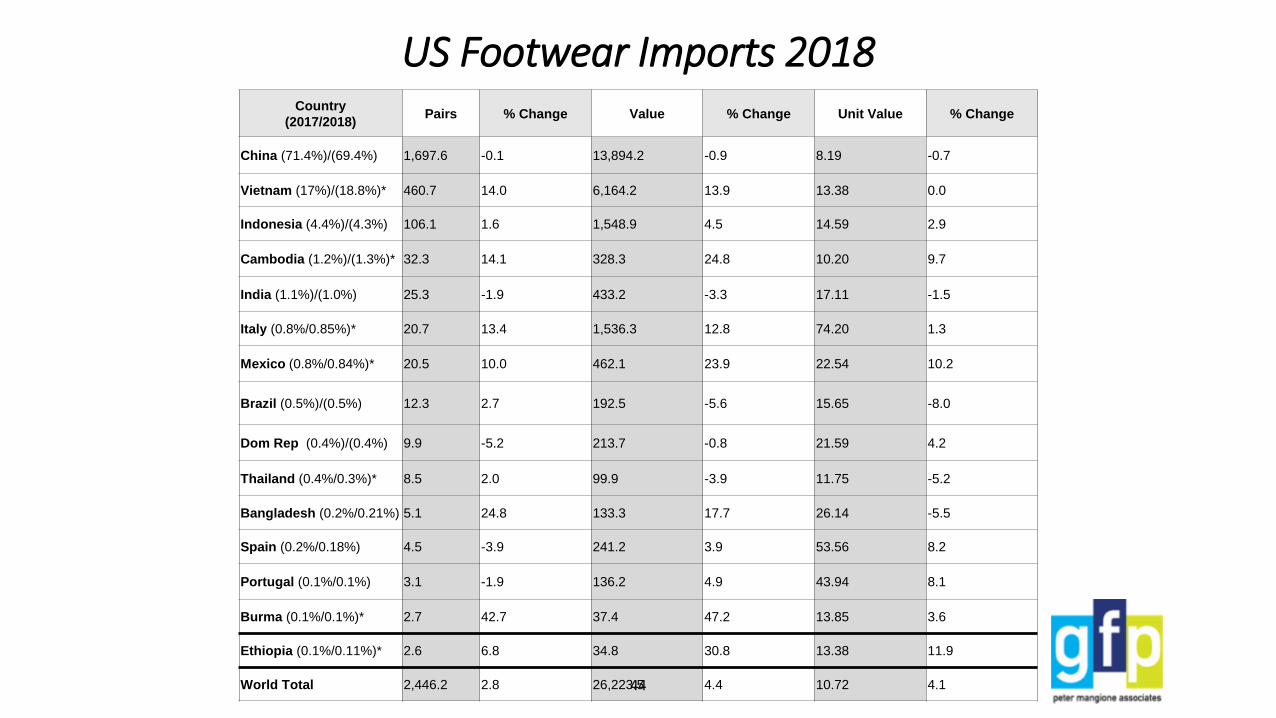
US Footwear Imports 2018Country
(2017/2018)Pairs % Change Value % Change Unit Value % Change
China (71.4%)/(69.4%) 1,697.6 -0.1 13,894.2 -0.9 8.19 -0.7
Vietnam (17%)/(18.8%)* 460.7 14.0 6,164.2 13.9 13.38 0.0
Indonesia (4.4%)/(4.3%) 106.1 1.6 1,548.9 4.5 14.59 2.9
Cambodia (1.2%)/(1.3%)* 32.3 14.1 328.3 24.8 10.20 9.7
India (1.1%)/(1.0%) 25.3 -1.9 433.2 -3.3 17.11 -1.5
Italy (0.8%/0.85%)* 20.7 13.4 1,536.3 12.8 74.20 1.3
Mexico (0.8%/0.84%)* 20.5 10.0 462.1 23.9 22.54 10.2
Brazil (0.5%)/(0.5%) 12.3 2.7 192.5 -5.6 15.65 -8.0
Dom Rep (0.4%)/(0.4%) 9.9 -5.2 213.7 -0.8 21.59 4.2
Thailand (0.4%/0.3%)* 8.5 2.0 99.9 -3.9 11.75 -5.2
Bangladesh (0.2%/0.21%) 5.1 24.8 133.3 17.7 26.14 -5.5
Spain (0.2%/0.18%) 4.5 -3.9 241.2 3.9 53.56 8.2
Portugal (0.1%/0.1%) 3.1 -1.9 136.2 4.9 43.94 8.1
Burma (0.1%/0.1%)* 2.7 42.7 37.4 47.2 13.85 3.6
Ethiopia (0.1%/0.11%)* 2.6 6.8 34.8 30.8 13.38 11.9
World Total 2,446.2 2.8 26,223.5 4.4 10.72 4.144


US Consumption by Upper Material 2011/2017 (Market Share in Pairs)
Leather
Plastic/rubber
Textile
Waterproof
Other 0
32/20
32/43
1
35/36
46

Year Total China % of change
2018
2017
2016
2015
2014
2013
2012
2011
2010
480.4
472.1
515.5
575.8
588.0
598.3
581.5
607.4
663.2
251.4
260.7
291.1
350.0
382.0
408.2
411.8
452.0
514.0
1.8/-3.6
-8.4/-10.7
-10.5/-16.7
-2.0/-8.4
-1.7/-6.4
2.9/-0.9
-4.3/-9.1
-8.4/-12.1
6.8/8.4
2009 620.8 474.0 -16.1/-16.8
2008 740.0 571.0 -12.1/-12.4
2007 842.6 652.0
US Imports of Leather Footwear 2018-2007 in Millions of Pairs.

US Leather Footwear Imports 2018Country
(2017/2018)Pairs % Change Value % Change Unit Value % Change
China (55.6%)/(52.3%) 251.4 -3.6 4,777.0 -4.3 19.00 -0.7
Vietnam (20.2%)/(22.8%)* 109.4 14.2 2,077.0 14.3 18.98 -0.4
Indonesia (7.7%)/(7.2%) 34.6 -5.5 569.7 1.2 16.47 7.1
India (3.8%)/(3.7%) 17.8 -0.5 362.7 -0.7 20.38 -0.2
Italy (2.2%)/(2.4%)* 11.3 7.8 1,140.2 9.1 100.88 1.3
Cambodia (1.4/1.8%)* 8.8 37.1 155.0 42.5 17.61 3.6
Mexico (1.5%/1.7%)* 8.3 17.5 337.3 21.9 40.64 2.8
Dom Rep (1.3%)/(1.2%) 5.6 -6.7 173.3 -1.7 30.95 5.4
Brazil (1.3%)/(1.0%) 5.1 -10.9 142.6 -10.1 27.84 -3.0
Bangladesh(.6%)/(0.9%)* 4.3 21.3 126.2 16.3 29.35 -5.3
Thailand (.7%/0.8%)* 3.8 5.8 72.4 6.5 19.05 -2.0
Spain (.7%)/(.7%) 3.5 0.0 201.2 4.6 57.49 4.5
Portugal (0.5%)/(0.5%) 2.6 -1.3 121.3 7.1 46.65 7.0
Ethiopia (0.4%)/(0.4%) 2.1 13.2 30.0 27.1 14.29 15.5
Burma (0.2%)/(0.2%) 0.9 13.6 19.0 25.0 21.11 35.9
World Total 480.4 1.8 10,699.0 3.0 22.27 1.348

Total US
ImportsUS Imports from
China
Category 2018 2017 % Change 2018 2017 % Change
Footwear 10,699.0 10,404.9 3.0 4,777.0 (44.6%) 4,996.2 (48.0%) -4.3%
Apparel 376.7 385.3 -2.2 118.9 (31.6%) 136.1 (35.3%) -12.6
Gloves 409.8 354.3 15.7 264.0 (64.5%) 228.1 (64.4%) 15.8%
Other 740.0 692.2 6.9% 436.9 (59.1%) 398.4 (57.6%) 9.7%
Finished 1,703.9 1,845.8 -7.7% 45.8 (2.7%) 44.2 (2.4%) 3.6%
Total 13,929.4 13,683.2 1.8% 5,642.6 (40.5%) 5,803.2 (42.4%) -2.8%
49
US Imports of Leather Goods 2018
All amounts are in millions of US dollars

Export Opportunities/Challenges
Shoe Sourcing Scramble

Footwear Supply
’Supply follows demand!’ – Women’s fashion shoes rebound?
Global Footwear Supply – Big Picture
China’s Dramatic Decline -- But who gains?
Lead time and local supply chain
How will Trump’s extra duties on shoes affect China?
51

Global Footwear Production
Asia
Sounth America
Europe
Africa
North AmericaAsia 88%
South America 5%
Europe 3%Africa 3%
North America 2%
Total 24.3 billion pairs52

Footwear Production in Asia
Total 21.4 billion pairs = 100%
China
India
Vietnam
Remain of Asia
VIETNAM 4.25%
CHINA = 73.36%
INDIA = 9.65%
53

Country Production Exports Imports
China
India
Vietnam
Indonesia
Brazil
13,500 (3.8)
2,257 (NA)
1,242 (5.0)
1,012 (1.0)
909 (-0.9)
9,624.8 (3.6)
150 (NA)
1,104 (5.0)
250 (-3.0)
127.1 (3.9)
115 (3.6)
162 (NA)
50 (10)
20 (15.0)
23.7 (-21.0)
EU
Bangladesh
Turkey
Thailand
Mexico
Russia
Korea
Japan
Taiwan
US
540 (1.0)
399 (NA)
390 (6.6)
260 (0)
259 (4.0)
114
43 (NA)
57 (-5.0)
40 (0)
40(0)
229.1 (6.0)
48.0 (NA)
212.3 (6.0)
100 (-7.0)
26.4 (4.0)
4.8
4 (NA)
1.2 (0)
17.2 (1.5)
43.0 (-3.0)
2,533.5 (1.8)
24.0 (NA)
33.3 (-8.0)
60 (17.0)
88.1 (7.2)
354.4
121 (NA)
639 (-1.0)
95 (20.0)
2,379.4 (1.8)
August 30, 2018
World Footwear Supply, Selected Countries (millions of pairs), 2017Source: Industry estimates. ( ) % of change
54

Country Consumption Pairs Per Person Import Penetration
China 3,807 (-2.9) 2.8 (-6.0) 2.9 (12)
EU 2,803 (-1.4) 5.6 (0) 88 (0)
US 2,335 (-5.3) 7.1 (-5.0) 99 (0)
India 2,078 (0) 1.7 (0) 7.8 (0)
Brazil
Japan
Russia
Indonesia
Mexico
Korea
Turkey
Thailand
Canada
Vietnam
Australia
Taiwan
825 (6.5)
695 (-1.2)
463.6
782 (0)
306 (2.7)
200 (0)
202 (5.8)
195 (0)
164 (0)
188 (9.0)
100 (0)
98 (3.2)
3.9 (2.6)
5.4 (-3.0)
3.25
2.9 (0)
2.5 (0)
3.9 (0)
2.7 (6.3)
3.0(0)
5.2 (0)
2.2 (15)
4.6 (0)
4.3 (4.9)
3.5 (-16.0)
97 (5.4)
76
6 (-10)
26.3 (-2.5)
75 (0)
27 (-10.2)
24 (0)
99 (0)
26 (0)
95 (0)
77 (0)
Sept 2017
World Footwear Consumption, Selected Countries (millions of pairs), 2016Source: Industry estimates, ( ) % of change
55

56
Country Cost per Hour
2018/2017 (all costs
included)
Cost % of Change
2018/2017
Exchange Rate USD
2018/2017 (% of
change)
Ethiopia
Bangladesh
Myanmar
Pakistan
India
Nicaragua
Cambodia
Vietnam
0.38/0.43
0.66/0.61
0.75/NA
0.89/NA
0.95/0.91
1.33/1.30
1.66/1.50
1.66/1.65
-11.6%
8.2%
NA
NA
4.4%
2.3%
10.6%
0.1%
27.7/23.35 (18.6%)
84.36/80.41 (4.3%)
1,468/1,360 (7.9%)
122.6/105.5 (16.2%)
68.5/63.7 (7.5%)
31.88/30.13 (5.8%)
4,069/4,066 (0.0%)
23,271/22,730 (2.4%)
Thailand
Dominican Republic
Indonesia
China
1.72/1.64
2.20/2.27
2.28/2.16
2.58/2.46
4.9%
-3.0%
5.6%
4.9%
33.33/33.24 (0.3%)
47.24/46.16 (2.3%)
14,431/13,340 (8.2%)
6.7/6.7 (0.0%)
Mexico
Turkey
Brazil
Portugal
Italy
Japan
2.96/2.65
3.17/3.52
4.05/3.96
5.74/5.78
15.70/15.54
21.71/21.70
11.8%
-10.0%
2.3%
0.62%
1.0%
0.0%
18.5/17.8 (3.9%)
5.23/3.54 (47.7%)
3.7/3.20 (16.0%)
1.16/1.18 (-1.7%)
1.16/1.18 (-1.7%)
111.0/110.0(0.0%)
July data, costs in USD August 22, 2018
Shoe Worker Cost Comparison 2018

Footwear Export Opportunities/Challenges
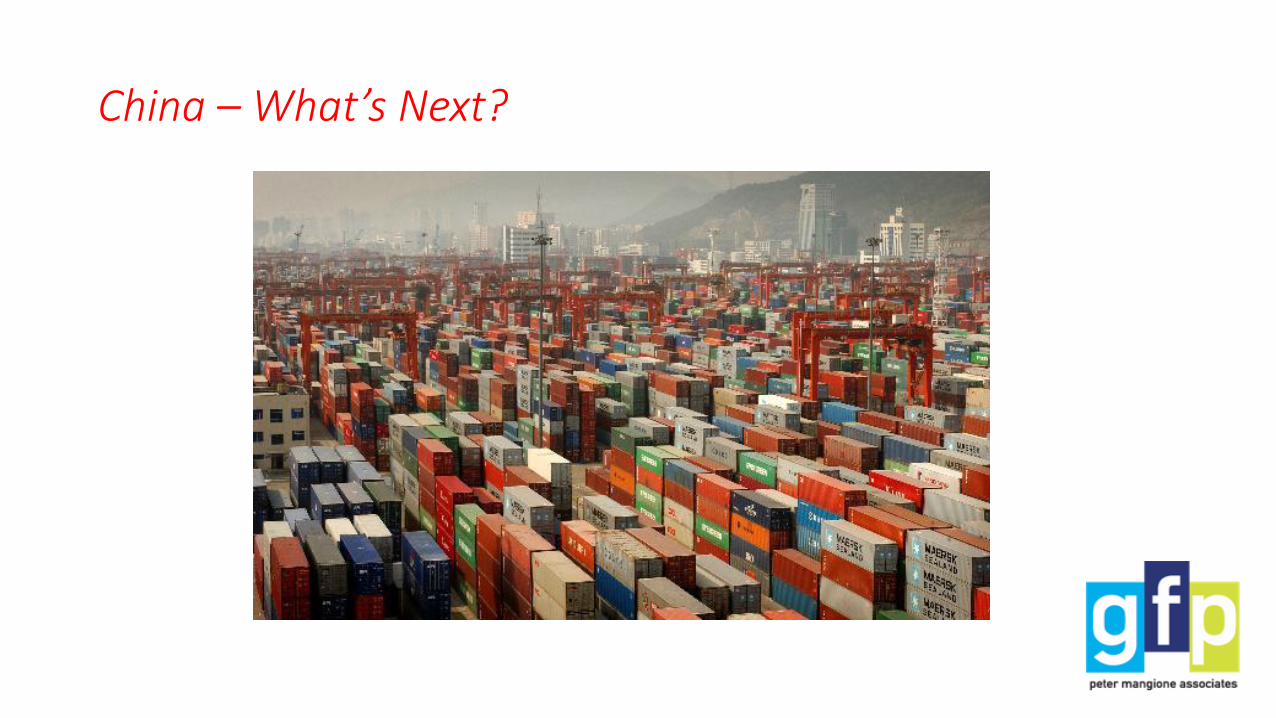
China – What’s Next?

59
China
• Major challenges for shoe sector today:
• Chronic, systemic labor shortages• Wage and social insurance cost increases• Environmental regulations, energy and water conservation• Appreciation/depreciation of the RMB/$• Power of domestic consumption• Worker unrest• Taiwan investors looking for new opportunities outside China

Footwear Supply
Role of Lead Time and Local Supply Chain
• Time between purchase order and shipment – lead time
• Short: women’s fashion shoes and low price – 45-90 days
• Long: athletic brands, outdoor items – 120-180- days
• China supply chain: world’s most extensive – huge advantage for short lead time items
• How does lead time affect India, Vietnam, Bangladesh, etc. US export potential?
60

Global Footwear Supply
Outlook for China Shoes – Even with extra Trump duties: 10% vs 25%
• Incomparable footwear supply chain
• Long lead time items – athletic (move to Vietnam, Indo) and outdoor (shift to Bangladesh) for career labor – can still rely on China supply chain
• Short lead time products -- women’s fashion and low price – mostly remain in China – both need the speed of supply chain proximity and fashion needs many medium size entrepreneur factories (Little chance for either of these items in Vietnam, Indo, Bangladesh, etc.)
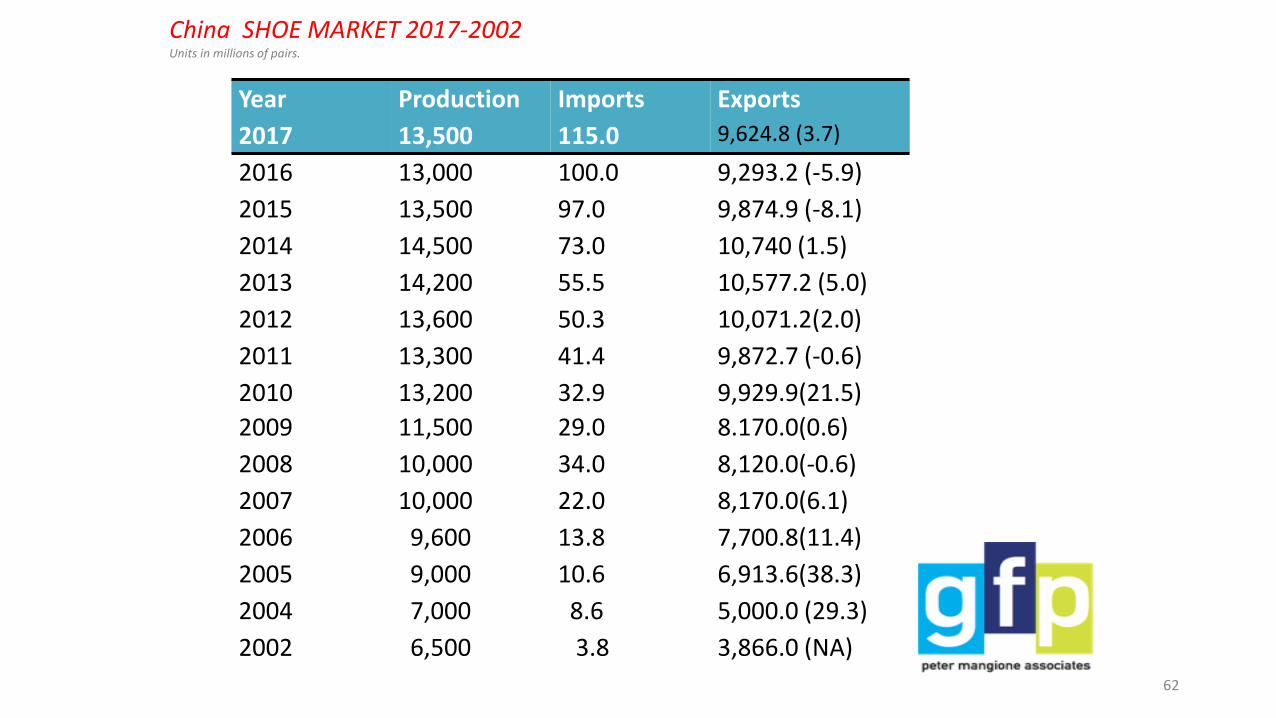
• Major comeback in progress following huge export decline
• World’s leader in leather shoes
61
Year
2017
Production
13,500
Imports
115.0
Exports
9,624.8 (3.7)
2016
2015
2014
2013
2012
2011
2010
13,000
13,500
14,500
14,200
13,600
13,300
13,200
100.0
97.0
73.0
55.5
50.3
41.4
32.9
9,293.2 (-5.9)
9,874.9 (-8.1)
10,740 (1.5)
10,577.2 (5.0)
10,071.2(2.0)
9,872.7 (-0.6)
9,929.9(21.5)
2009 11,500 29.0 8.170.0(0.6)
2008 10,000 34.0 8,120.0(-0.6)
2007 10,000 22.0 8,170.0(6.1)
2006
2005
2004
2002
9,600
9,000
7,000
6,500
13.8
10.6
8.6
3.8
7,700.8(11.4)
6,913.6(38.3)
5,000.0 (29.3)
3,866.0 (NA)
China SHOE MARKET 2017-2002Units in millions of pairs.
62

China Shoe Exports Increase -- 2017
Items
Volume Dec.2017 Jan.-Dec.2017 Jan.-Dec.2016 Change(%)
Unit Volume Value Volume Value Volume Value Volume Value
Leather shoes 10 thousand pairs 6,702.9 899,125.4 68,232.2 9,301,149.0 69,042.2 9,624,203.8 -1.2 -3.4
Rubber&Plastic shoes 10 thousand pairs 47,101.8 1,998,184.7 565,228.3 22,031,350.4 555,133.8 22,033,781.4 1.8 0
Textile shoes&boots 10 thousand pairs 27,171.9 1,404,069.8 287,561.0 13,400,330.6 266,946.7 12,412,184.7 7.7 8
Other shoes 10 thousand pairs 3,156.2 65,045.5 41,457.9 858,622.5 37,160.4 778,784.2 11.6 10.3
Total 10 thousand pairs 84,132.8 4,366,425.4 962,479.4 45,591,452.5 928,283.1 44,848,954.1 3.7 1.7

Exodus from China: Who, Where, When• Surging change in China is driving brands to seek stable, low cost
production – the ‘scramble’
• Trump’s extra duties on China shoes will accelerate moving out, but will be tempered by capacity realities and the fact that a 10% duty can largely be absorbed by the supply chain without too much disruption
• Biggest movers are in athletic and outdoor – brands that have longer led times than fashion and low price, which allows continued access to China’s supply chain
• Vietnam is the principal destination; Cambodia is too small, Indonesia too far away, Burma may be too scary, and India too much trouble; Ethiopia and Latin America too far away for China investors, etc.; Bangladesh for outdoor product (long lead time, access to leathers, etc.)
64

Moving Out – the ‘scramble’
Remaining
Vietnam Bangladesh China Brazil Mexico India
Nike Timberland Steve Madden Camuto Caleres Nike
adidas WWW Wal-mart Steve Madden adidas
Under Armour Camuto Caleres
WWW Tata
Timberland
New Balance
Skechers
Caleres
Columbia
65

Why are brands moving orders to Vietnam?
• Fundamentals Drive Foreign Investment by OEM Producers • Ample/steady low cost workforce – more career workers than China’s mostly
temporary ones – labor shortage in Vietnam?
• CSR better than China – no dormitories, so less overtime/pay issues; wages getting too costly?
• Stable environment – no recurrence of anti-China violence of 2014
• Use of China supply chain: feasible for long lead time items – sports, outdoor, but less so for short lead time items like women’s fashion, low price, etc.
• Major sector/government effort to improve local supply chain
• TPP? Now dead; was never the main driving force; future maybe?
66

Vietnam• Pro
1. Large, low cost career work force
2. World class, foreign invested shoe making infrastructure; dozens of industrial factories, mostly branded sport shoes, leather casuals
3. Increasing local input capacity – still only about 40%
4. Hospitable to China entrepreneurs
• Con
1. Severe labor and land limitations especially in HCHC area; new investment only in rural areas; minimum wage escalation – govt too aggressive?
2. Competition for workers from high value added sectors
3. Congested infrastructure, uncertain political climate, etc.
67

Cambodia• Pro1. Ample, but limited, low cost labor.
2. Good start up tax incentives.
3. Hospitable to China/Taiwan entrepreneurs.
4. Zero duties to Canada, GSP for EU.
• Con1. All inputs must be imported, lead times several weeks longer than
China.
2. Active labor unions press for higher wages, new dormitories, and shorter hours.
3. Small country (about 15.0 million people) – limited potential for factory expansion, and much competition from higher value added industries.

Myanmar (Burma)
• Pro
1. Abundant and low cost labor
2. Proximity to China and Vietnam
3. Other Southeast Asia sources are largely tapped out
• Con
1. Lacking in foreign investment in production and sector infrastructure – only a few programs to date.
2. Weak overall infrastructure – adds buyer costs/challenges.
3. Political uncertainties: ethnic cleansing, weak democaracy

Indonesia • Pro
1. Abundant and low cost labor.
2. Large foreign investment in industrial factories, branded athletics, etc., benefits from China exodus.
• Con
1. Minimum wage up 40% in recent years.
2. Labor laws are not flexible enough on hiring/firing; costly layoff rules and union strikes mar productivity.
3. Some 65% of materials and components must be imported.
4. Political situation somewhat uncertain.

India• Pro
1. Abundant and low cost labor.
2. Good supplies of local leather.
3. Steady growth of leather shoe sales to US
• Con
1. Lacking in foreign investment in production and sector infrastructure –only a few pilot programs to date, but sports sector expansion coming
2. Labor laws are not flexible enough on hiring/firing.
3. Shoe clusters are not located near one another – adding buyer costs/challenges.
4. Local production is heavily in men’s leather and women’s is mostly sandals – more experience in tailored women’s, athletic or synthetic items would help.
5. Decline in EU market, somewhat offset by better US; not hurt much by decline in leather shoes especially in EU
71

Bangladesh• Pro1. Ample and low cost career labor, and attractive tax advantages
2. Good for long lead time items: men’s and outdoor like Timberland, WWW, etc.
3. Foreign investment in dedicated export factories leverage local labor
• Con1. Infrastructure: traffic, port, electricity, etc. – China investing $20 billion in new port, roads, etc.
2. Concentration on men’s leather shoes – a declining specialty
2. Lead times: at least 30 days more than China: nearly all inputs must be imported –disadvantage for short lead time items like women’s fashion, most important leather upper category for the US market
3. Leading US brands ban Bangladesh leather: ETP (Greenpeace, LWG) and Halal slaughter (PETA); Alliance for Bangladesh Worker Safety (garments) – corporate reputation risks (CSR)
4. Security/political issues – strikes, demonstrations: some corporate travel bans
5. Limited land availability – but still good opportunities
72

Ethiopia• Pro1. Ample, low cost labor, favorable currency, US zero duties.
2. Good tanneries and supplies of some leather types especially sheep, some bovine
3. Supportive government – new industrial parks, pro-investment regulations, new rail link to port; etc.
• Con
1. Expensive and long time/distance logistics, but improving with new rail link to only ocean port
2. Language and culture require workforce training.
3. Inputs other than leather must be imported.
4. Foreign investment is essential to competitive production.
5. Recent political unrest worrying

Mexico• Pro
1. Large shoe making infrastructure with many capable factories making leather shoes and boots – Western and women’s items.
2. Good supplies of locally tanned leathers.
3. Zero duties and proximity to US -- fast delivery/reorders.
• Con
1. High labor costs and footwear inputs could be improved.
2. Financial issues for some factories and not all have competitive management – lack of investment in export essentials: samples, design support, sales agent, show attendance, etc.
3. Currency fluctuations create uncertainties for buyers
4. Despite recent success with key US brands, past failures still weigh on some buyers, and large segments of the sector are factories that are too small for the capacity needs of US buyers.

Brazil • Pro
1. Large local investment in shoe making infrastructure mostly for vibrant domestic shoe sales.
2. First class leather and tanning sectors.
3. Weak currency helps pricing for leather items, but recent strength weighs on competitiveness.
• Con
1. Labor costs, taxes, inflation all up in recent years.
2. Labor laws are not flexible enough on hiring/firing and can mar productivity.
3. Large export devoted factories closed, own brand based, etc.
4. Political and currency situation uncertain.

Takeaways • Athleisure is a new/permeant category – the ‘Flyknit’ revolution is here to stay
• Women’s less casual fashion, typically of leather, is having a modest comeback, but outlook for leather shoes is still dismal due to the continuing athleisure craze -- but leather shoes have held up better in Europe than US where leisure life style predominates
• China keeps top spot --for women’s fashion and low price (supply chain proximity, need many entrepreneurs) -- but loses athletic and outdoor (long lead time items) to Vietnam (and other products if it can develop a competitive local supply chain), Indo, Cambodia, Bangladesh (outdoor); India leader in men’s leather dress and casual (needs more women’s and foreign investment); Burma and Ethiopia expanding but small gauge
• Trump’s protectionist regime is now hold with China and odds favor an agreement this Spring, but a resumption of the war later this year or next year is possible, especially if Trump does not like China’s follow through after the deal is announced
• Even if Trump does not hit China shoes with extra duties (such duties are no more than a remote possibility), shifting to other Asian shoe making countries is apt to be substantial anyway due to the uncertainty created by the duty threats.
• Shifting out of China will be tempered by limited capacity and imperatives of the supply chain –short lead time items will be least likely to move out at least in the short run – shifting will happen anyway just not as fast as it would have if Trump imposed extra duties on China shoes.

Thank you.
77