trust and social capital in immigrant networks - trust...trust and social capital in immigrant...
TRANSCRIPT
Trust and Social Capital in Immigrant Networks
James C. CoxNoah Langdale Jr. Chair in EconomicsAndrew Young School of Policy Studies
Georgia State University14 Marietta Street NW, Atlanta, GA 30303
Email:[email protected]
Wafa Hakim Orman∗
Assistant ProfessorDepartment of Economics and Information Systems
University of Alabama in Huntsville301 Sparkman Drive, Huntsville AL 35899
Email: [email protected]
March 16, 2009
Abstract
We examine the relative levels of bridging and bonding capital be-tween first-generation immigrants and native-born Americans at anindividual level, and compare immigrant communities by region. Weuse an experimental moonlighting game to study trust, positive, andnegative reciprocity. The survey enables us to more precisely learnwhat develops the two forms of social capital. We relate it to demo-graphic characteristics, income, education, and life experiences, whichmay be shaped by exclusionary attitudes of the native population.
Introduction
The problem of un-assimilated immigrants is broadly acknowledged as a rootcause of terrorism and a serious national security concern. Unemployment,discontent, and alienation from broader society in immigrant ghettos across
∗Contact Author. This research was supported by the NSF-supported Time-SharingExperiments in the Social Sciences (TESS).
1

Western Europe and the UK turn them into potential breeding grounds forfundamentalism and extremism. (Roy, 2004).
The American experience, on the other hand, has been much more pos-itive. A recent report (Pew Research Center, 2007) found that AmericanMuslim immigrants in particular are, overall, much happier and better as-similated than in Europe and the UK. Hypotheses as to why this is so rangefrom the United States’ historical experience with immigration, to the factthat Arab and Muslim immigrants in the US tend to be better educated andhave more human capital than those in Europe (Fukuyama, 2006). Identi-fying what fosters successful assimilation is vital for the design of effectiveimmigration policy.
Beyond speaking the language and adopting the traditions of one’s adoptedcountry, social capital can be a vital measure of the assimilation process.Putnam (2000) describes two kinds of social capital – bonding capital, whichrefers to the closeness of links within a community, and bridging capital,which refers to the links between communities. Immigrant communitieshave some amount of both, but the amount of bridging capital betweenimmigrants and native communities can be an indicator of how well as-similated the immigrant community is. Trust and trustworthiness are keycomponents of social capital (Knack and Keefer, 1997; Glaeser et al., 2000),and therefore the levels of trust and trustworthiness within a community,and between people of different communities, can serve as useful indicatorsof the social capital accumulated. At the same time, lack of trust and thepresence of actively negative feelings can serve as useful measures of thelevels of discontent and alienation that communities may or may not feel.
The purpose of this study is to examine the relative levels of bridgingand bonding capital between first-generation immigrants and native-bornAmericans at an individual level, and compare this with among immigrantcommunities. We use experimental methods to study trust, positive, andnegative reciprocity. We combine the experiment with a survey to moreprecisely learn what develops the two forms of social capital. We can relateit to demographic characteristics, income, education, and life experiences,which may be shaped by exclusionary attitudes of the native population,as studied in Australia by Louis et al. (2007), or by competitive versuscooperative experiences (Johnson et al., 1984).
The moonlighting game, developed by Abbink et al. (2000), is an effectiveway to measure trust, reciprocity, and trustworthiness. For our purposes,it is superior to an ordinary trust or investment game (Berg et al., 1995;Glaeser et al., 2000; Carter and Castillo, 2002). It constrains the action setless, since subjects can send both positive and negative amounts, potentially
2

taking money from the person they are paired with or punishing. This allowsfor the testing of trust and positive reciprocity as well as negative feelingsand the fear of negative reciprocity.
The setup of the game is as follows: Each individual is randomly assignedto being either a first mover or a second mover. Both first and secondmovers are credited with a money endowment of 10 dollars. Each firstmover is given the task of deciding whether she wants to give to a randomlypaired second mover none, some, or all of her endowment or take up to $5from the paired person. Any amounts given by the first mover are tripledby the experimenter, while any amounts taken by the first mover are nottransformed. The second mover then decides how much to return to thefirst mover, and can also punish the first mover. Each dollar that the secondmover gives to the paired first mover costs the second mover 1 dollar . Eachthree dollars that the second mover takes from the paired first mover coststhe second mover one dollar, so that punishment is costly. The secondmover’s choices are constrained so as not to give either a negative payoff.All choices are required to be in integer amounts.
Respondents completed their questionnaires online at their convenience,and were randomly matched ex-post. Due to the nature of the survey,the strategy method (Falk et al., 2000) is the only feasible way to elicitresponses from the second mover. This has the added advantage of providinga full range of information on the second mover’s responses to each possibledecision by the first mover. Each second mover decides, for each possibleaction of the first mover, whether she wants to give money to the pairedfirst mover or take money from her.
The amount sent by the first mover is tripled so that joint profits, andwelfare, are clearly maximized when there is a great degree of trust, leadingto the entire amount being sent in anticipation of a “fair split” by the secondmover. Following Dufwenberg and Gneezy (2000), beliefs about the behaviorof the average person were elicited from both the first and the second mover,with a monetary reward for guessing correctly. Gaechter and Renner (2006)show that incentivized beliefs are more accurate than beliefs that are elicitedwithout a monetary incentive. First movers were asked to guess the behaviorof the average second mover, and second movers were asked to guess thebehavior of the average first mover. This enables us to understand theirmotivations, and to distinguish between trust in anticipation of reciprocity(or reciprocity in response to trust) versus altruism – do people only sendhigh amounts if they expect to have a significant portion of it returned (orif a large amount was sent to them)?
There are four types of pairings. Using I to represent an immigrant of
3

one’s own community, N to represent a US native, FM to represent the firstmover and SM to represent the second mover, the pairings are: I (FM) -I (SM), I (FM) - N (SM), N (FM) - I (SM), and N (FM) - N (SM). Thepairings were arranged using the respondents’ place of birth, which hadbeen collected by Knowledge Networks previously. Subjects were randomlyassigned to first mover or second mover status and treatments.
Subjects were informed of the region of origin of the person they weregoing to be matched with. The actual matching of responses was accord-ingly conducted ex-post, once all the surveys were completed. For example,a respondent listing their (or their parents) place of birth as Jordan was pre-assigned to the I (FM) - I (SM) treatment and informed that they will bematched with another randomly selected individual from the Middle East,living in the US. If they were assigned to the I (FM) - N (SM) or the N(FM) - I (SM) treatment, they were informed that they would be matchedwith a randomly selected American. A respondent listing their and theirparents’ place of birth as the US was informed that they will be matchedwith a randomly selected immigrant to the US if they were assigned to theI (FM) - N (SM) or N (FM) - I (SM) treatment, or with a randomly se-lected American if they were assigned to the N (FM) - N (SM) treatment.Immigrants from any particular region will be matched only with othersfrom their own region in the I (FM) - I (SM) treatment. While interactionsbetween different immigrant groups are an important topic of study, theyare beyond the scope of this paper. Information about respondents’ religionwas not used to match subjects.
The survey included questions on whether the subject or anyone theyknow has ever been a victim of a hate crime or prejudice, to see whetherthese experiences made a person more or less likely to trust, take moneyor punish. It therefore provided a chance to see not just whether or notpeople punish or take money, but who did so, with respect to income, back-ground, and life experiences. Data on income and educational backgroundare collected in the standard set of demographic questions that precededthe survey. We also included selected core questions from the World Bank’squestionnaire on social capital (Grootaert et al., 2004) to test if these mea-sures of social capital serve as predictors of trusting and reciprocal behaviorversus punishment or taking money. The experiment was conducted onlineby Knowledge Networks. The subjects were a random sample of the UnitedStates population, and immigrants were oversampled.
4

Hypotheses
We separately identify the differences in trusting behavior within immigrantand native communities, as measured by the I (FM) - I (SM) and N (FM)- N (SM) treatments, and between immigrant and native communities, asmeasured by the I (FM) - N (SM) and N (FM) - I (SM) treatments.
We identify the demographic and other characteristics that make immi-grants more or less likely to trust, take money, or punish. We expect thatpeople with more bridging social capital will be more trusting of an individ-ual from the “other” group, whether native or immigrant, than people withless bridging social capital. We test the following hypotheses:
H1: People will have more bonding social capital within their “own”community, whether immigrant or native-born American, than bridging so-cial capital with those in the “other” community. Meaning, they will bemore likely to trust someone in their “own” community by giving themmoney rather than taking money from them. They will be relatively lesslikely to give money to someone from the “other” community, and morelikely to take money from them.
H2: People with more social capital as indicated by the survey will havehigher incomes and human capital and will also show more trusting andless negative behavior. They will be more likely to give money than take,regardless of whom they are paired with.
In sum, we wish to identify the relative importance of individual humancapital vis-a-vis positive (or negative) experiences in the adopted countryon the development of bridging and bonding capital and the assimilationprocess. We aim to further the understanding of immigrant assimilationand behavior, potentially aiding the design of immigration policy. Thisissue is crucial to the study of migration and immigrant communities, andfor the long-term success of the American “melting pot.”
Results
Subjects were randomly assigned to treatment – see Table 1 and Table 2.Tables 4 and 5, along with figures 1 and 2 show the the amounts sent by firstand second movers in the various treatments. Figure 5 shows the averageamount sent by second movers in each treatment in response to the amountsent by the first mover. Interestingly, while there are some outliers, theaverages show that the typical person merely attempts to reduce the firstmover’s payoff by approximately the amount that was taken away from
5

them, not more. Figures 6 and 7 show us how much first movers send relativeto expected responses by the second mover, as measured by the elicitedbeliefs. We see that people send in an expectation of positive reciprocity,but also out of a fear of negative reciprocity. The people who take moneytend to not trust the second mover to return a positive amount.
A Mann-Whitney test shows that the amount sent by the first moverin the Immigrant-Immigrant treatment is significantly different from all theothers at the 5% level (p-value = 0.0468, and different from the Immigrant-Native treatment at the 10% level (p-value = 0.0771). When paired witha native-born American as a second mover, the amounts that immigrantfirst-movers send are not significantly different from native-born Americans.
For the second movers, the Mann-Whitney test shows that immigrantssend less than native-born Americans regardless of treatment (p-value =0.0035). So we can reject hypothesis H1. In fact immigrants appear, at firstglance, to have more bridging social capital than bonding social capital.
The survey measures belonging to various types of groups, includingreligious, ethnic, professional, neighborhood etc. We are therefore able toobserve those who do not belong to any groups at all, and find that they aresignificantly more likely to take money as first movers – the p-value is 0.02.
We test the effects of education on trusting behavior and find that immi-grants who take money as first movers rather than send have, on average, 1.5fewer years of schooling. The p-value from a Mann-Whitney test is 0.024.For native-born Americans, the effect is even stronger – those who takemoney have 1.7 fewer years of schooling and the p-value from the Mann-Whitney test is 0.008. So we have some support for hypothesis H3.
We then look at behavior by region, religion, and immigrant status. Asindicated by figure 16, a Mann-Whitney test also shows that the amountssent by first movers who attend religious services regularly and are immi-grants is significantly different (p-value = 0.016) from those who are notimmigrants. For second movers this difference is not significant.
From responses to the question: “On a scale of 1 to 5, do you believe thatmost people can be trusted (1), or that you can’t be too careful in dealingwith people (5),” we normalize the responses and construct a Z-score tomeasure trust. We also create a “trusting” indicator which equals one if theindividual responds with either 1 or 2.
We find that unlike Glaeser et al. (2000), in our study, trust measuredby the survey question is in fact a weak predictor of trusting behavior –first movers who respond with a 1 or 2 send more. A Mann-Whitney testis significant at the 10% level, with a p-value of 0.078. On the other hand,it does not predict trustworthy behavior at all, as measured by the second
6

mover returning a positive sum. However, the normalized trust score ishigher for second movers who return at least as much as the first mover sentthem, with a p-value of 0.04 in a Mann-Whitney test. Mann-Whitney testsand Table 7 show that the trust levels are not significantly different betweenfirst and second movers.
Tables 8 and 9 show the factors influencing trust and trustworthiness.We see that women and older people are less likely to trust. We find someweak support for hypothesis H2 – education does make people more trusting,though it does not affect trustworthiness. Interestingly, the amount that thefirst mover believes is less important than the belief that the second moverwill send some positive amount. Religious attendance makes people lesslikely to trust, and interestingly also reduces trustworthiness by makingpeople less likely to send at least as much as they received. Figure 18 showsan interesting dichotomy between immigrants who attend more than once aweek versus immigrants who attend weekly.
References
Abbink, Klaus, Bernd Irlenbusch, and Elke Renner, “The moonlight-ing game: An experimental study on reciprocity and retribution,” Journalof Economic Behavior & Organization, June 2000, 42 (2), 265–277.
Berg, Joyce, John Dickhaut, and Kevin McCabe, “Trust, Reci-procity, and Social History,” Games and Economic Behavior, July 1995,10 (1), 122–142.
Carter, Michael R. and Marco Castillo, “The Economic Impacts ofAltruism, Trust, and Reciprocity: An Experimental Approach to SocialCapital,” Wisconsin-Madison Agricultural and Applied Economics StaffPapers 448, Wisconsin-Madison Agricultural and Applied Economics De-partment Apr 2002.
Dufwenberg, Martin and Uri Gneezy, “Measuring Beliefs in an Exper-imental Lost Wallet Game,” Games and Economic Behavior, February2000, 30 (2), 163–182.
Falk, Armin, Ernst Fehr, and Urs Fischbacher, “Testing Theories ofFairness - Intentions Matter,” IEW - Working Papers iewwp063, Institutefor Empirical Research in Economics - IEW 2000. forthcoming in: Gamesand Economic Behavior.
7

Fukuyama, Francis, “Identity, Immigration, and Liberal Democracy,”Journal of Democracy, April 2006, 17 (2).
Gaechter, Simon and Elke Renner, “The Effects of (Incentivized) BeliefElicitation in Public Goods Experiments,” Discussion Papers 2006-16,The Centre for Decision Research and Experimental Economics, Schoolof Economics, University of Nottingham Sep 2006.
Glaeser, Edward L., David I. Laibson, Jose A. Scheinkman, andChristine L. Soutter, “Measuring Trust,” The Quarterly Journal ofEconomics, Aug 2000, 115 (3), 811–846.
Grootaert, Christiaan, Deepa Narayan, Veronica Nyhan Jones,and Michael Woolcock, “Measuring social capital: An integrated ques-tionnaire,” World Bank Working Paper 18, World Bank, Washington, DC2004.
Johnson, David W., Roger T. Johnson, Margaret Tiffany, andBrian Zaidman, “Cross-Ethnic Relationships: The Impact of IntergroupCooperation and Intergroup Competition.,” Journal of Educational Re-search, 1984, 78 (2), 75 – 79.
Knack, Stephen and Philip Keefer, “Does Social Capital Have an Eco-nomic Payoff? A Cross-Country Investigation,” The Quarterly Journal ofEconomics, Nov 1997, 112 (4), 1251–1288.
Louis, Winnifred R., Julie M. Duck, Deborah J. Terry, Regina A.Schuller, and Richard N. Lalonde, “Why do citizens want to keeprefugees out? Threats, fairness and hostile norms in the treatment ofasylum seekers,” European Journal of Social Psychology, 2007, 37 (1),53–73.
Pew Research Center, “Muslim Americans: Middle Class and MostlyMainstream,” May 22 2007. http://pewresearch.org/pubs/483/muslim-americans.
Putnam, Robert D., Bowling Alone: The Collapse and Revival of Amer-ican Community, Simon & Schuster New York, 2000.
Roy, Olivier, Globalized Islam: The Search for a New Ummah, ColumbiaUniversity Press New York, 2004. The CERI series in comparative politicsand international studies.
8

Appendix A: Figures and Tables
Table 1: Subjects per treatment
Item Number PercentN-N 110 24I-N 122 27N-I 134 30I-I 84 19Total 450 100
Table 2: Immigrants by region
Item Number Percentnorthern/western europe 57 27eastern europe 10 5south asia 12 6east asia 28 13south-east asia 20 9latin america 35 17the caribbean 9 4north america 34 16middle east/central asia 7 3Total 212 100
9

Table 3: Group membership
immigrantno yes total
trade or business association 10 7 17professional association (doctors, teachers, veterans) 41 31 72trade union or labor union 36 18 54neighborhood committee 19 17 36religious or spiritual group (e.g. church, mosque, temple, etc) 89 69 158political group or movement 12 9 21cultural group or association (e.g. arts, music, theater, film) 17 16 33education group (e.g. parent-teacher association, school committee) 29 19 48sports group 25 17 42youth or student group 15 8 23ngo or civic group (e.g. rotary club, red cross) 8 4 12ethnic-based community group 1 10 11other groups 8 6 14none 91 94 185Total 235 210 445
10

Table 4: Amounts sent by first mover, by treatment
TreatmentN-N I-N N-I I-I Total
-5 4 4 7 5 20-4 0 1 0 0 1-3 1 2 2 0 5-2 2 3 3 8 16-1 3 1 2 1 70 8 10 14 6 381 8 8 4 7 272 6 5 9 4 243 5 7 5 1 184 1 1 0 0 25 4 8 7 5 246 1 0 0 0 18 1 0 0 1 29 1 0 3 1 510 10 11 11 3 35Total 55 61 67 42 225
11

Table 5: Amounts sent by second mover, by treatment
TreatmentN-N I-N N-I I-I Total
-15 0 0 3 1 4-12 0 1 0 3 4-9 3 3 5 2 13-6 4 4 7 3 18-3 3 7 5 3 180 9 7 12 2 301 3 2 8 6 192 4 3 5 1 133 5 10 7 5 274 1 3 0 6 105 5 0 5 2 126 4 3 2 1 107 0 0 1 1 28 0 0 0 2 29 2 1 0 0 310 1 5 2 2 1012 2 1 0 0 314 0 2 0 1 315 0 3 1 0 419 1 0 0 0 120 5 3 1 0 925 2 3 0 0 527 1 0 0 0 130 0 0 1 0 140 0 0 1 0 1Total 55 61 66 41 223
12

Figure 1: Average amount sent by first mover, by treatment
Figure 2: Average amount sent by second mover, by treatment
13

Figure 3: Proportion of first movers who take money from the second mover,by treatment
Figure 4: Proportion of second movers who take money from the first mover,by treatment
14

Figure 5: Second mover responses, by amount received from first mover andtreatment
Figure 6: Amounts sent by first movers, by belief about second mover’saction
15

Figure 7: First mover’s belief about second mover’s action, by amount sent
Figure 8: Proportion of first movers who take money from the second mover,by region
16

Figure 9: Average amount sent by first mover, by region
Figure 10: Average amount sent by immigrant first mover, by region andtreatment
17

Figure 11: Proportion of second movers who take money from the secondmover, by region
Figure 12: Average amount sent by second mover, by region
18

Figure 13: Average amount sent by second mover, by region and treatment
Figure 14: Average amount sent by first mover, by religion and immigrantstatus
19
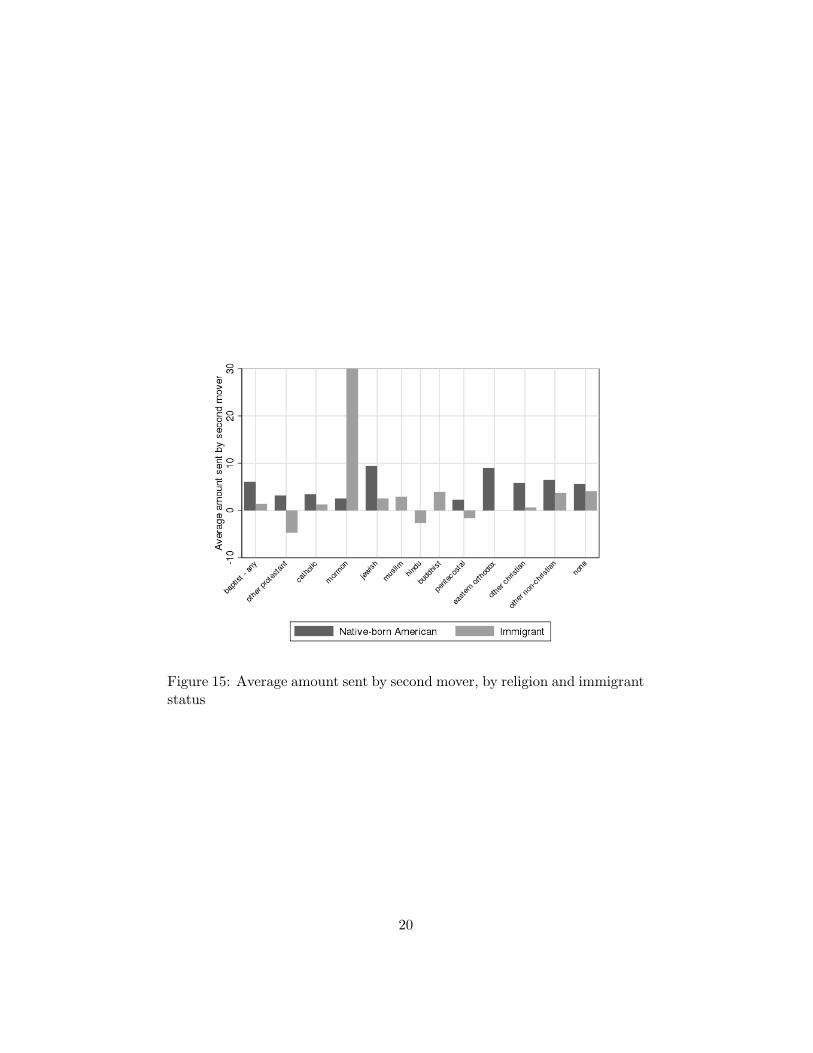
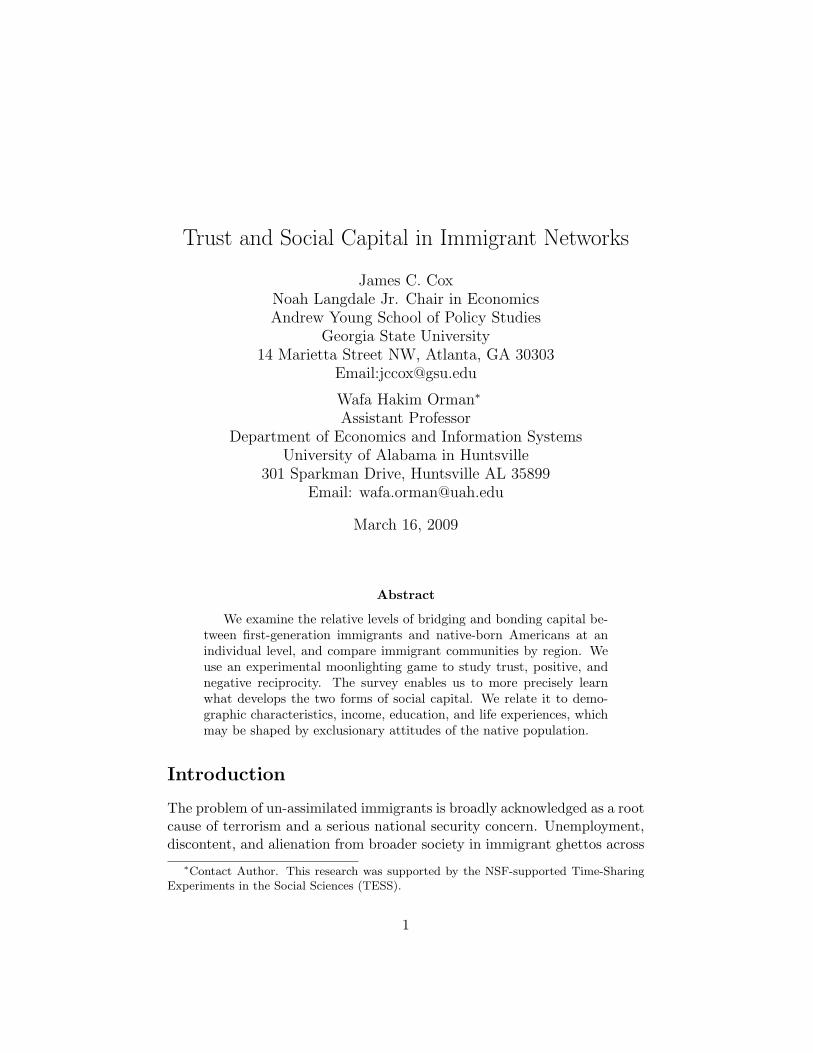
Figure 15: Average amount sent by second mover, by religion and immigrantstatus
20

Figure 16: Average amount sent by first mover, by religious attendance andimmigrant status
Figure 17: Average amount sent by second mover, by religious attendanceand immigrant status
21
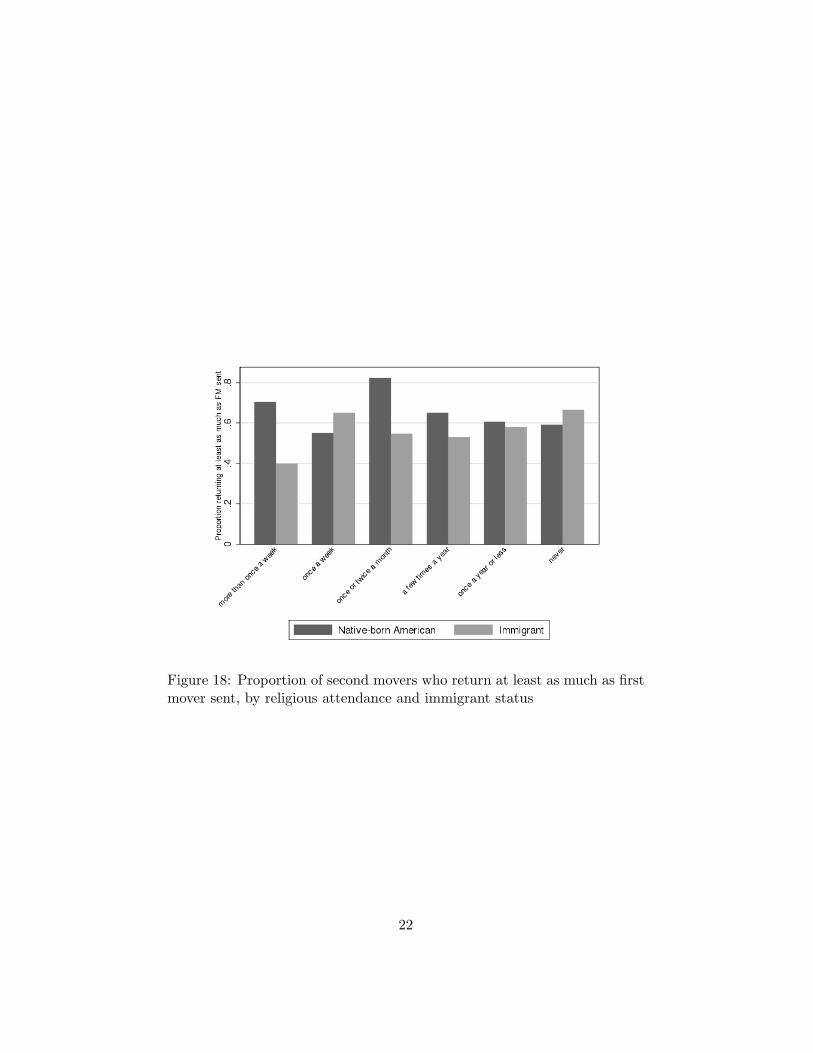
Figure 18: Proportion of second movers who return at least as much as firstmover sent, by religious attendance and immigrant status
22

Table 6: Responses to: Generally speaking, on a scale of 1 to 5, would yousay that:
Item Number Percentpeople can be trusted 18 42 127 283 191 434 87 19you can’t be too careful in dealing with people 24 5Total 447 100
Table 7: Trust by mover group
Mover groupFirst movers Second movers Total
people can be trusted 7 11 182 72 55 1273 89 102 1914 46 41 87you can’t be too careful in dealing with people 9 15 24Total 223 224 447
Table 8: First mover regression
(1) (2)Ordered Logit OLS
treatmentII -0.910** -1.458*(0.425) (0.792)
treatmentNI -0.138 0.122(0.529) (1.051)
treatmentNN -0.314 -0.338(0.520) (1.049)
female -0.633** -1.382**(0.284) (0.611)
age -0.0279*** -0.0622***(0.009) (0.020)
belief about amount SM will return -0.0239 -0.0775(0.031) (0.060)
23
believe SM will return positive amount 1.550*** 3.686***(0.399) (0.848)
income in 1000s -0.0039 -0.0082(0.004) (0.008)
years of schooling 0.0466 0.0592(0.047) (0.103)
trusting 0.298 0.756(0.319) (0.687)
religious attendance percentile -1.080** -2.321**(0.532) (1.156)
belong to no social groups -1.211*** -2.524***(0.368) (0.758)
western europe -0.161 -0.0955(0.598) (1.181)
eastern europe 0.209 0.438(0.834) (1.567)
south asia -0.119 -0.131(0.852) (1.662)
east asia 1.742** 4.068**(0.773) (1.662)
south east asia 0.671 1.121(0.949) (1.703)
latin america -0.241 -0.573(0.562) (1.165)
caribbean 2.186 5.052(1.837) (3.530)
middle east/central asia -1.002 -3.231(1.708) (3.214)
Constant 5.419**(2.412)
Observations 186 186R-squared . 0.285*** p<0.01, ** p<0.05, * p<0.1Robust standard errors in parentheses
Table 9: Second mover regression
(1) (2) (3)OLS Ordered Logit Logit
(SM return ≥ FM sent)
treatmentII 1.638 0.703 0.762
24

(1.467) (0.459) (0.477)treatmentIN 4.391*** 1.181*** 1.435***
(1.490) (0.333) (0.454)treatmentNN 3.973*** 1.068*** 1.203***
(1.518) (0.359) (0.451)female 0.157 0.0346 0.0571
(1.064) (0.266) (0.341)age -0.0646 -0.0213** -0.0193*
(0.040) (0.010) (0.012)amount sent by FM 1.039*** 0.272*** -0.0054
(0.145) (0.043) (0.038)SM’s belief about what FM will send 0.209 0.0162 0.0678
(0.227) (0.056) (0.057)SM believes FM will send positive amount 0.0229 0.291 0.103
(2.055) (0.513) (0.580)income in 1000s 0.00358 -0.0015 0.00203
(0.014) (0.003) (0.004)years of schooling 0.284 0.0695 0.0833
(0.209) (0.054) (0.065)trusting 1.592 0.468 0.704*
(1.118) (0.292) (0.418)religious attendance percentile -1.506 -0.522 -1.266**
(1.839) (0.523) (0.628)belong to no social groups -0.249 -0.19 -0.690*
(1.116) (0.291) (0.369)Constant -3.7 -0.328
(3.782) (1.215)Observations 191 191 191R-squared 0.37 . .*** p<0.01, ** p<0.05, * p<0.1Robust standard errors in parentheses
25

Appendix B: Survey Questions
The following questions were asked, in addition to demographic, religiousand political responses already obtained by TESS:
1. Where were you born?
[select from standard list of countries using drop-down menu – stan-dard list in HTML format is in Appendix C]
2. Where was your mother born?
[select from standard list of countries using drop-down menu]
3. Where was your father born?
[select from standard list of countries using drop-down menu]
[If respondent or either parent was not born in the USA, mark asImmigrant. Assign region as described in Appendix C. If respondentAND/OR both parents were born in the USA, mark as Native.]
4. Do you or any member of your household belong to any of the followinggroups (please check all that you belong to):
1 Trade or Business Association
2 Professional Association (doctors, teachers, veterans)
3 Trade Union or Labor Union
4 Neighborhood committee
5 Religious or spiritual group (e.g. church, mosque, temple, infor-mal religious group, religious study group)
6 Political group or movement
7 Cultural group or association (e.g. arts, music, theater, film)
8 Education group (e.g. parent-teacher association, school commit-tee)
9 Sports group
10 Youth or student group
11 NGO or civic group (e.g. Rotary Club, Red Cross)
12 Ethnic-based community group
13 Other groups
26

14 None
[If respondent checks “None,” skip the next three questions and godirectly to question 10.]
5. Considering the group in which you participate most actively, howactively do you participate in this group? (select only one)
1 Leader
2 Very Active
3 Somewhat Active
4 Do not participate in decision-making
6. Thinking about the members of this group, are most of them of thesame. . . (please select all that apply)
A. Neighborhood (yes/no)
B. Religion (yes/no)
C. Gender (yes/no)
D. Age (yes/no)
E. Ethnic or linguistic background, race, caste, or tribe (yes/no)
F. Income level (yes/no)
7. Does this group work or interact with other groups outside the neigh-borhood?
1 No
2 Yes, occasionally
3 Yes, frequently
8. About how many close friends do you have these days? These arepeople you feel at ease with, can talk to about private matters, or callon for help.
(enter a number)
9. There are often differences in characteristics between people living inthe same neighborhood. For example, differences in wealth, income,social status, ethnic or linguistic background, race, caste, tribe, re-ligion, or political beliefs. To what extent do any such differencescharacterize your neighborhood?
27
1 To a very great extent
2 To a great extent
3 Neither great nor small extent
4 To a small extent
5 To a very small extent
10. In general, how safe from crime and violence do you feel when you arealone at home?
1 Very safe
2 Moderately safe
3 Neither safe nor unsafe
4 Moderately unsafe
5 Very unsafe
11. Have you or anyone you know personally ever been the victim of ac-tual or threatened physical violence or harm as a result of your race,ethnicity, gender, religious or political beliefs etc (i.e. a hate crime) inthe United States? (select all that apply)
1 Yes, I have
2 Yes, someone I know personally has
3 No, never
12. How often have you personally felt discriminated against in the UnitedStates because of your race, ethnicity, gender, religious, or politicalbeliefs etc? (select only one)
1 Very often
2 Fairly often
3 Rarely
4 Never
13. Generally speaking, on a scale of 1 to 5, would you say that mostpeople can be trusted (1) or that you can’t be too careful in dealingwith people (5)? (select only one)
• People can be trusted
• You can’t be too careful in dealing with people
28

14. In general, on a scale of 1 to 5, would you say that: (select only one)
• Most people in my neighborhood are willing to help if you needit
• One has to be alert in my neighborhood, or someone is likely totake advantage of you
Appendix C: Experiment Consent, Instructions, andQuestions
Instructions and consent for First Mover
[If respondent is in I(FM) - I(SM) or N(FM) - N(SM) treatment:] You andanother randomly selected participant from [respondent’s own region] haveboth been given $10 by our research organization, which have been placedin your accounts.
[If respondent is in I(FM) - N(SM) treatment:] You and another ran-domly selected participant from the United States have both been given $10by our research organization, which have been placed in your accounts.
[If respondent is in N(FM) - I(SM) treatment:] You and another ran-domly selected participant, a first or second-generation immigrant to theUnited States, have both been given $10 by our research organization, whichhave been placed in your accounts.
[Following is the same for all four treatments:] You are player 1, and theperson you have been paired with is player 2. The game proceeds in twostages.
Stage 1: Your decision
In the first stage, you can decrease your account by any amount from $0 to$10, which will increase player 2’s account by three times that amount. Forexample, if you decrease your account by $2, player 2’s account increases bythree times $2, or by $6. You will have $8 in your account, and player 2 willhave $16 in their account.
Or, you can choose to increase your account by any amount from $0 to$5, which will decrease player 2’s account by the same amount. For example,if you increase your account by $2, player 2’s account will decrease by $2.You will have $12 in your account, and player 2 will have $8 in their account.
29

Stage 2: Player 2’s decision
In the second stage, after receiving the money, player 2 has two choices.He or she can decrease their account by any amount between $0 and theamount present in their account after your decision, which will increase youraccount by that amount. For example, if player 2 decreases their accountby $2 and chooses to increase your account, your account will increase by$2. You can keep whatever amount you receive from player 2 in addition toany money you chose not to send. Player 2 will keep whatever remains intheir account.
Or, player 2 can decrease their account by any amount between $0 andthe amount present in their account after your decision, and decrease youraccount by three times that amount. For example, if player 2 decreasestheir account by $2 and chooses to decrease your account, your account willdecrease by $6. You and player 2 will both keep whatever remains in youraccounts.
What do you choose? (select only one option)My account Player 2’s account
Current: 10 101 +5 -52 +4 -43 +3 -34 +2 -25 +1 -16 +0 -07 -1 +38 -2 +69 -3 +910 -4 +1211 -5 +1512 -6 +1813 -7 +2114 -8 +2415 -9 +2716 -10 +30
[If respondent is in I(FM) - I(SM) or N(FM) - N(SM) treatment:] Nowwe would like you to guess what the average participant from [respondent’sown region] would do as player 2, in response to your decision as player 1.
[If respondent is in I(FM) - N(SM) treatment:] Now we would like youto guess what the average participant from the United States would do as
30

player 2, in response to your decision as player 1.[If respondent is in N(FM) - I(SM) treatment:] Now we would like you to
guess what the average first or second-generation immigrant to the UnitedStates would do as player 2, in response to your decision as player 1.
[Following is the same for all four treatments:]If you guess correctly, or within $1 of the correct answer, you will get a
bonus of $5. If the difference between your guess and the correct answer ismore than $1, you will get a bonus of 5 ÷ the absolute difference betweenyour guess and the correct answer.
Select only one option:
1. Player 2 will decrease their own account by and decrease player 1’saccount by three times that amount.
2. Player 2 will decrease their own account by and increase player 1’saccount by the same amount.
Instructions and consent for Second Mover
[If respondent is in I(FM) - I(SM) or N(FM) - N(SM) treatment:] You andanother randomly selected participant from [respondent’s own region] haveboth been given $10 by our research organization, which have been placedin your accounts.
[If respondent is in I(FM) - N(SM) treatment:] You and another ran-domly selected participant from the United States have both been given $10by our research organization, which have been placed in your accounts.
[If respondent is in N(FM) - I(SM) treatment:] You and another ran-domly selected participant, a first or second-generation immigrant to theUnited States, have both been given $10 by our research organization, whichhave been placed in your accounts.
[Following is the same for all four treatments:] You are player 2, and theperson you have been paired with is player 1. The game proceeds in twostages.
Stage 1: Player 1’s decision
In the first stage, Player 1 can decrease their account by any amount from$0 to $10, which will increase your account by three times that amount. Forexample, if Player 1 decreases their account by $2, your account increasesby three times $2, or by $6. Player 1 will have $8 in their account, and youwill have $16 in your account.
31

Or, Player 1 can choose to increase their account by any amount from $0to $5, which will decrease your account by the same amount. For example,if Player 1 increases their account by $2, your account will decrease by $2.Player 1 will have $12 in their account, and you will have $8 in your account.
Stage 2: Your decision
In the second stage, after receiving the money, you have two choices. You candecrease your account by any amount between $0 and the amount present inyour account after Player 1’s decision, which will increase Player 1’s accountby that amount. For example, if you decrease your account by $2 and chooseto increase Player 1’s account, Player 1’s account will increase by $2. Player1 can keep whatever amount you receive from you in addition to any moneyyou chose not to send. You will keep whatever remains in your account.
Or, you can decrease your account by any amount between $0 and theamount present in your account after Player 1’s decision, and decrease Player1’s account by three times that amount. For example, if you decrease youraccount by $2 and choose to decrease Player 1’s account, Player 1’s accountwill decrease by $6. You and player 1 will both keep whatever remains inyour accounts.
Since all the individuals in this study are being surveyed at differenttimes, we will ask you what you would do after each possible decision byplayer 1. You will be paid according to the actual decision made by theindividual you have been randomly matched with. You cannot make a choicethat gives either you or Player 1 a negative payoff, and you cannot enterany decimal numbers or fractions.
1. If Player 1 increases their account by $5, and reduces your account by$5, what do you choose? (select only one option)
1 Decrease my account by (enter a number between 0 and 5)and decrease player 1’s account by three times that amount.
2 Decrease my account by (enter a number between 0 and 5)and increase player 1’s account by the same amount.
2. If Player 1 increases their account by $4, and reduces your account by$4, what do you choose? (select only one option)
1 Decrease my account by (enter a number between 0 and 4)and decrease player 1’s account by three times that amount.
32

2 Decrease my account by (enter a number between 0 and 6)and increase player 1’s account by the same amount.
3. If Player 1 increases their account by $3, and reduces your account by$3, what do you choose? (select only one option)
1 Decrease my account by (enter a number between 0 and 4)and decrease player 1’s account by three times that amount.
2 Decrease my account by (enter a number between 0 and 7)and increase player 1’s account by the same amount.
4. If Player 1 increases their account by $2, and reduces your account by$2, what do you choose? (select only one option)
1 Decrease my account by (enter a number between 0 and 4)and decrease player 1’s account by three times that amount.
2 Decrease my account by (enter a number between 0 and 8)and increase player 1’s account by the same amount.
5. If Player 1 increases their account by $1, and reduces your account by$1, what do you choose? (select only one option)
1 Decrease my account by (enter a number between 0 and 3)and decrease player 1’s account by three times that amount.
2 Decrease my account by (enter a number between 0 and 9)and increase player 1’s account by the same amount.
6. If Player 1 increases their account by $0, and reduces your account by$0, what do you choose? (select only one option)
1 Decrease my account by (enter a number between 0 and 3)and decrease player 1’s account by three times that amount.
2 Decrease my account by (enter a number between 0 and 10)and increase player 1’s account by the same amount.
7. If Player 1 decreases their account by $1, and increases your accountby $3, what do you choose? (select only one option)
1 Decrease my account by (enter a number between 0 and 3)and decrease player 1’s account by three times that amount.
33
2 Decrease my account by (enter a number between 0 and 13)and increase player 1’s account by the same amount.
8. If Player 1 decreases their account by $2, and increases your accountby $6, what do you choose? (select only one option)
1 Decrease my account by (enter a number between 0 and 2)and decrease player 1’s account by three times that amount.
2 Decrease my account by (enter a number between 0 and 16)and increase player 1’s account by the same amount.
9. If Player 1 decreases their account by $3, and increases your accountby $9, what do you choose? (select only one option)
1 Decrease my account by (enter a number between 0 and 2)and decrease player 1’s account by three times that amount.
2 Decrease my account by (enter a number between 0 and 19)and increase player 1’s account by the same amount.
10. If Player 1 decreases their account by $4, and increases your accountby $12, what do you choose? (select only one option)
1 Decrease my account by (enter a number between 0 and 2)and decrease player 1’s account by three times that amount.
2 Decrease my account by (enter a number between 0 and 22)and increase player 1’s account by the same amount.
11. If Player 1 decreases their account by $5, and increases your accountby $15, what do you choose? (select only one option)
1 Decrease my account by (enter either 0 or 1) and decreaseplayer 1’s account by three times that amount.
2 Decrease my account by (enter a number between 0 and 25)and increase player 1’s account by the same amount.
12. If Player 1 decreases their account by $6, and increases your accountby $18, what do you choose? (select only one option)
1 Decrease my account by (enter either 0 or 1) and decreaseplayer 1’s account by three times that amount.
34

2 Decrease my account by (enter a number between 0 and 28)and increase player 1’s account by the same amount.
13. If Player 1 decreases their account by $7, and increases your accountby $21, what do you choose? (select only one option)
1 Decrease my account by (enter either 0 or 1) and decreaseplayer 1’s account by three times that amount.
2 Decrease my account by (enter a number between 0 and 31)and increase player 1’s account by the same amount.
14. If Player 1 decreases their account by $8, and increases your accountby $24, what do you choose? (select only one option)
1 Do nothing, leave the accounts as they are now.
2 Decrease my account by (enter a number between 0 and 34)and increase player 1’s account by the same amount.
15. If Player 1 decreases their account by $9, and increases your accountby $27, what do you choose? (select only one option)
1 Do nothing, leave the accounts as they are now.
2 Decrease my account by (enter a number between 0 and 37)and increase player 1’s account by the same amount.
16. If Player 1 decreases their account by $10, and increases your accountby $30, what do you choose? (select only one option)
1 Do nothing, leave the accounts as they are now.
2 Decrease my account by (enter a number between 0 and 40)and increase player 1’s account by the same amount.
[If respondent is in I(FM) - I(SM) or N(FM) - N(SM) treatment:] Nowwe would like you to guess what the average participant from [respondent’sown region] would do as player 1.
[If respondent is in I(FM) - N(SM) treatment:] Now we would like you toguess what the average first or second-generation immigrant to the UnitedStates would do as player 2, in response to your decision as player 1.
[If respondent is in N(FM) - I(SM) treatment:] Now we would like youto guess what the average participant from the United States would do asplayer 1.
35

[Following is the same for all four treatments:]If you guess correctly, or within $1 of the correct answer, you will get a
bonus of $5. If the difference between your guess and the correct answer ismore than $1, you will get a bonus of 5 ÷ the absolute difference betweenyour guess and the correct answer.
Select only one option:Player 1’s account Player 2’s account
At the start: 10 101 +5 -52 +4 -43 +3 -34 +2 -25 +1 -16 +0 -07 -1 +38 -2 +69 -3 +910 -4 +1211 -5 +1512 -6 +1813 -7 +2114 -8 +2415 -9 +2716 -10 +30
36