trust board1 - amazon s3s3-eu-west-1.amazonaws.com/files.royalfree.nhs.uk/... · from trust board...
TRANSCRIPT
TRUST BOARD1 Wednesday, 30 July 2014 1500 – 1630
Boardroom, Palm Ward, Level 3, Barnet Hospital Dominic Dodd, Chairman
ITEM LEAD PAPER
1. ADMINISTRATIVE ITEMS
1.1 Apologies for absence – J Owen, S Powis, D Finch D Dodd
1.2 Minutes of meeting held 26 June 2014 D Dodd 1.1
1.3 Matters arising report D Dodd 1.2
1.4 Record of items discussed at the Part II board meeting on 26 June 2014 D Dodd 1.3
1.5 Declaration of interests D Dodd v
1.6 Patient voices D Sanders v
2. ORGANISATIONAL AGENDA
2.1 Presentation
iQUASER: board‐level intervention in quality improvement
N Fulop A Fresko
2.1
2.2 Complaints report D Sanders 2.2
2.3 Director of Infection, Prevention and Control:
Annual report 2013/14 Quarterly report 2014/15
D Sanders 2.3a 2.3b
2.4 RTT programme governance K Fleming 2.4
3. OPERATIONAL AGENDA
3.1 Chairman’s report D Dodd 3.1
3.2 Chief executive’s report D Sloman 3.2
3.3 Trust performance report D Sloman 3.3
3.4 Financial performance report C Clarke 3.4
Governance and Regulation: reports from board committees
3.5 Integration committee D Dodd 3.5
3.6 Finance and performance committee D Finch 3.6
3.7 Patient safety committee S Ainger v
3.8 Clinical performance committee A Schapira 3.7
3.9 Strategy and investment committee D Dodd 3.8
3.10 Patient and staff experience committee D Sanders 3.9
3.11 Quarter 3 Monitor quarterly self‐certifications D Dodd v
4. ANY OTHER BUSINESS
4.1 Questions from the floor D Dodd v
End of public meeting
1 In accordance with the Health & Social Care Act 2012, all Trust Board meetings must be held in public. All decisions which require the board’s collective approval can only be made at a Trust Board (or a Part II meeting held in closed session to discuss confidential matters).
List of members and attendees
Members
Dominic Dodd Non‐executive director and Chairman
Stephen Ainger Non‐executive director
Deborah Oakley Non‐executive director
Jenny Owen Non‐executive director
Prof Anthony Schapira Non‐executive Director
Dean Finch Non‐executive Director
David Sloman Chief executive
Caroline Clarke Chief finance officer and Deputy chief executive
Prof. Stephen Powis Medical director
Deborah Sanders Director of nursing
Kate Slemeck Chief operating officer
In attendance
David Grantham Director of workforce and organisational development
Katie Donlevy Director of service transformation
Dr Steve Shaw Divisional director of urgent care
Dr Robin Woolfson Divisional director of transplant and specialist services
Prof George Hamilton Divisional director of surgery and associated services
Dr Mike Greenberg Divisional director of women’s and children’s services
Kim Fleming Director of Planning
William Smart Director of information management and technology
Andrew Panniker Director of capital and estates
Emma Kearney Interim director of corporate affairs and communications
Jan Aps Trust secretary

Paper 1.1
Report of the trust board
held on 26 June 2014 Present Mr D Dodd Mr D Bernstein Mr D Sloman Ms C Clarke
chairman vice chairman chief executive director of finance
Ms D Sanders Ms K Slemeck
director of nursing executive director of operations
Professor S Powis medical director Mr S Ainger non-executive director Ms J Owen non-executive director Ms D Oakley
non-executive director
Invited to attend Mr A Panniker director of estates Mr K Fleming director of planning Mrs K Donlevy director of integrated care Mr D Grantham director of workforce and organisational development Ms S Payne Mr M Dinan
workforce integration director of financial operations
Ms E Kearney Mrs J Aps
interim director, corporate affairs and communication board secretary (minutes)
P39/14-15 APOLOGIES FOR ABSENCE AND WELCOME Action
Apologies were received from D Finch, A Schapira, G Hamilton, S Shaw, R Woolfson and W Smart.
P40/14-15 MINUTES OF MEETING HELD ON 24 MAY 2014
The minutes were accepted as an accurate record of the meeting.
P41/14-15 MATTERS ARISING REPORT
The action report was noted.
P42/14-15 RECORD OF ITEMS DISCUSSED AT PART II BOARD MEETINGS ON 29 MAY AND 3 JUNE 2014
The report was noted.
P43/14-15 DECLARATION OF INTERESTS
There were no changes to note.
P44/14-15 PATIENT VOICES
Mr Grantham read a letter from the family of an elderly patient. Whilst the standards of medical care had been exemplary, the supporting administration and process arrangements had been chaotic with appointments changing, conflicting information in letters, confusing arrangements relating to MRSA status, and extended delays. The family were given a clear apology and detailed explanation which had been much appreciated and seen as a model in transparency and recovery.
He then read a compliment about the pathway and treatment in PITU; it had

Paper 1.1
been so much quicker for the patient, with no cancellations, the staff appeared well-trained and there was a cheerful environment.
Ms Sanders would present patients voices in July.
P45/14-15 ANNUAL MEDICAL REVALIDATION REPORT
Prof Powis presented the first annual report, noting that 131 recommendations had been submitted (all on time) to the GMC between April 2013 and March 2014 (this included a request for deferral in 11 cases).
Ms Oakley commented that there did not appear to be a requirement to include the patient’s view, but Prof Powis noted that not all doctors had direct patient contact. Ms Owen welcomed the report which clearly demonstrated progress. Prof Powis had sought to align this with job planning and complete reports in January to March but this had not been possible due to the scale of the task.
The trust board approved the statement of compliance, and extended thanks to Prof Powis and his team for their work in this area.
P46/14-15 PATIENT SURVEY RESULTS
Ms Sanders introduced the survey results which had been completed by in-patients in July 2013. The trust board noted that overall there had been a slight improvement.
Ms Owen noted that it was good to see the alignment between the areas where the patient improvement plan had been focused, but disappointed not to see a greater level of improvement in the scores which would reflect world class behaviours. Whilst noting the slightly depressed London scores, she noted the good scores being achieved at Guy’s & St Thomas’ (GSTT) and asked the trust to examine what could be learned; Ms Sanders reported that the trust had linked with a team at GSTT to see what they had done in this area.
The board noted that the scoring methodology had been changed in a number of areas, which limited the ability to make direct comparisons, but they were keen to understand what other information could be obtained to see if the impact of world class care values was gathering momentum. Ms Sanders explained that the introduction of the friends and family test (FFT), and the potential of patient surveys on bedside TVs, was providing the possibility for more timely information.
Mr Sloman noted that the trust would need to agree on the metric that it would use as the improving patient experience metric, and that it may be appropriate to use the FFT.
P47/14-15 CHAIRMAN’S REPORT
The chairman’s report was noted. Mr Dodd highlighted in his report that the council of governors had strongly supported the board’s decision in relation to the acquisition of Barnet and Chase Farm, and that the final parliamentary process was drawing to a close, and the extended trust would be formed from 1 July 2014. He extended the board’s thanks to all involved in the successful acquisition.
Mr Dodd also extended the board’s thanks to Mr Bernstein, whose term of office as vice-chairman finished on 30 June 2014. He noted that Mr Bernstein had attended in excess of 500 board and committee meetings, and had been a key part of the improvement in governance of the trust. A

Paper 1.1
celebration would be arranged in September.
P48/14-15 CHIEF EXECUTIVE’S REPORT
Mr Sloman particularly noted that: The board and TEC members would be touring all three sites of the
extended trust on 1 July 2014 – details would be made available shortly. The roll-out of EDRM has been delayed until September. The trust had successfully exited BT Cerner with no safety issues, and
were in a strong position to progress. Dr Tim Peachey would be acting as chief clinical information officer.
P49/14-15 TRUST PERFORMANCE REPORT
Mr Sloman introduced the report, noting the ongoing refinement to the nursing establishment indicators. Mr Smart would check the in-month reduction in first to follow-up appointments, and post-natal information.
The trust was struggling with finding an appropriate metric to track improvement in bullying and harassment; Mr Grantham continued to investigate this.
There would be an update on the reduction in theatre utilisation in the performance report next month.
Data on short notice outpatient cancellations would be included in the July report.
KS
WS
P50/14-15 FINANCIAL PERFORMANCE REPORT
Ms Clarke reported that the continuity of services rating had reduced to a 3, but that it had been very close to this in the plan. She reported that the trust continued to have a strong cash position, but that elective income was behind plan, with significant action in place to try and close this gap, and thus reserves had not been used to balance this.
P51/14-15 INTEGRATION COMMITTEE REPORT
The board noted the report.
P52/14-15 FINANCE AND PERFORMANCE COMMITTEE REPORT
The board noted the report. Mr Dodd commented on the continuing reduction in the reference cost index, now at 97 (a reduction of 17 points in three years), which was supporting increased investment in services and facilities.
P53/14-15 PATIENT SAFETY COMMITTEE REPORT
Mr Ainger gave a verbal update, noting that the trust was not performing as it would wish to in relation to closing serious incidents investigations, and that Datix was needed to become more embedded in its use. He also noted that the committee was getting a good grip on its revised portfolio.
P54/14-15 AUDIT COMMITTEE REPORT
The board noted the report, particularly that the most recent meeting had focused on the 2013/14 accounts, and what assurance would be sought by the trust in signing of the legacy accounts (Q1) of Barnet and Chase farm Hospitals NHS Trust.
P55/14-15 STRATEGY AND INVESTMENT COMMITTEE REPORT
The board noted the report.

Paper 1.1
P56/14-15 ANY OTHER BUSINESS
There was no other business.
P57/14-15 QUESTIONS FROM THE PUBLIC / ATTENDEES
There were no questions from the floor.
DATE OF NEXT MEETING
The next trust board meeting would be on 30 July 2014 at 1500, in the Palm Room at Barnet Hospital.
Agreed as a correct record Signature ………………………………………………..date ……………………………… Dominic Dodd, chairman

Paper 1.2
Matters arising – July board
Trust Board
Matters Arising report as at 30 July 2014
Actions completed since last meeting of the Trust Board
Minute No
Action Lead Complete Board date/ agenda item
Outstanding
FROM TRUST BOARD HELD ON 26 JUNE 2014 P49/14-15 Trust performance report To include an update on the reduction in theatre
utilisation in the performance report in July. K Slemeck Complete. This will be included in
the report.
P49/14-15(a) Trust performance report To include data on short notice outpatient
cancellations in the July report. W Smart This will be included once data issues at
Chase Farm have been resolved. FROM TRUST BOARD HELD ON 29 MAY 2014 P26/14-15 Quarterly medical revalidation report To present the annual medical revalidation report to
the trust board in June. S Powis Complete. Was presented to the
trust board on 26 June 2014.
P29/14-15 Chief executive’s report To present a full report on the EDRM arrangements
at the confidential trust board meeting in June. K Donlevy Complete. The planned
implementation date had moved to mid- September; final roll-out would presented to the trust executive committee for agreement.
P30/14-15 Trust performance report The chairman asked that chairs of board
committees ensure review of their respective metrics and recommend which of those it would be appropriate to review at each board meeting.
D Dodd Complete. The analytics team is addressing this issue.

Paper 1.2
Matters arising – July board

Paper 1.3
Confidential trust board meeting update – Trust board July 2014
CONFIDENTIAL BOARD MEETING HELD ON 26 JUNE 2014
Executive summary Decisions taken at a confidential trust board are reported (where appropriate) at the next trust board held in public. Those issues of note and decisions taken at the trust board’s confidential meeting held on 26 June 2014 are outlined below. Barnet and Chase Farm (BCF)
The board received a progress update on the acquisition, noting that all required approvals had been received.
Other items of business A copy of the final version of the trust’s five year plan 2014-19 was presented. The board
signed off the submission of the plan to Monitor, delegating responsibility for any final amendments to the chief executive. It was agreed that the review and development of the strategic plan would be programmed into the work of the strategy and investment committee.
The board received the cancer cardiac business case which provided a status update on NHS England’s cancer cardiac reconfiguration programme. Following detailed discussion, the board confirmed its support for the proposals outlined in the business case given it was demonstrably the right approach for patient outcomes, but asked that a number of areas were followed up.
In reviewing the combined organisation view of the trust performance report, it was noted that the issue of 18 weeks referral to treatment (RTT) backlog at Barnet and Chase Farm Hospitals was being addressed.
The Royal Free board would be required to sign off the Q1 (2014-15) accounts for Barnet and Chase Farm Hospitals.
Action required For the board to note. Report From
D Dodd, chairman
Author(s) J Aps, trust secretary Date 23 July 2014
Report to Date of meeting Attachment number
Trust Board
30 July 2014 Paper 1.3

Paper 2.1
Page 1 of 5 QUASER project – trust board (public) July 2014
iQUASER: BOARD LEVEL INTERVENTION TO DEVELOP ORGANISATION-WIDE QUALITY IMPROVEMENT STRATEGIES
Executive summary
The attached paper provides a brief on the Quality and Safety in European Hospitals (QUASER) project focusing on board level intervention to develop organisation-wide quality improvement strategies.
The board shall also receive a presentation from Naomi Fulop (Professor of Health Care Organisation Management at UCL’s department of Applied Health Research) and Adrienne Fresko (Foresight Partnership) who will outline how this will be implemented at the Royal Free.
Action required/recommendation
For the board’s information.
Trust strategic priorities and business planning objectives supported by this paper
Board assurance risk number(s)
1. Excellent outcomes – to be in the top 10% of our peers on outcomes
x
2. Excellent user experience – to be in the top 10% of relevant peers on patient, GP and staff experience
x
3. Excellent financial performance – to be in the top 10% of relevant peers on financial performance
x
4. Excellent compliance with our external duties – to meet our external obligations effectively and efficiently
x
5. A strong organisation for the future – to strengthen the organisation for the future
x
CQC outcomes supported by this paper
1 Respecting and involving people who use services 2 Consent to care and treatment 4 Care and welfare of people who use services 5 Meeting nutritional needs 6 Cooperating with other providers 7 Safeguarding people who use services from abuse 8 Cleanliness and infection control 9 Management of medicines
Report to
Date of meeting Attachment number
Trust Board
30 July 2014 Paper 2.1
Paper 2.1
Page 2 of 5 QUASER project – trust board (public) July 2014
10 Safety and suitability of premises 11 Safety, availability and suitability of equipment 13 Staffing 14 Supporting staff 16 Assessing and monitoring the quality of service provision 17 Complaints 21 Records
Risks attached to this project/initiative and how these will be managed (assurance)
None
Equality analysis
No identified negative impact on equality and diversity
Report from Steve Powis, medical director Author(s) Linda Pomeroy, UCL
Naomi Fulop, UCL
Date 24 July 2014

Paper 2.1
Page 3 of 5 QUASER project – trust board (public) July 2014
The QUASER Guide has been developed from a three year EU FP7 funded project in 5 countries studying organisational and cultural factors influencing quality improvement (QI). It is a research-based tool that senior leadership teams can use to identify the strengths and possible weaknesses in their organisation’s quality and safety improvement efforts, and what they may need to do to improve. The Guide provides some suggested strategies for how the trust could be organised better in order to deliver quality improvement. It then provides examples from hospitals that have already implemented these strategies elsewhere in Europe.
For more information about the QUASER project and the Guide see: www.ucl.ac.uk/dahr/quaser. Through a process of facilitated use of the Guide, the Trust will be able to develop an organisation-wide quality improvement strategy. We will be testing the implementation of the Guide with six trust boards through the NIHR CLAHRC North Thames carried out by a team from University College London, Kings College London and Imperial College London.
Summary of iQUASER intervention and evaluation
1. THE INTERVENTION: FACILITATION AND SUPPORT
The facilitation and support component will be undertaken by Foresight Partnership – our organisational development partners.
The intervention will consist of four phases over a 12 month period (July 2014 – July 2015):
Introducing the programme
Individual organisational self-assessment using the QUASER Guide
QUASER Workshop and action learning
2 follow-up action learning sets
Phase One: Introducing the Programme: 30th July 2014
As part of this stage of the programme, the iQUASER team will make an introductory presentation on both the QUASER Guide and the overall programme.
Phase Two: Individual organisational self-assessment using the QUASER Guide: Timing: 12th August – 3rd Nov 2014
We have created an on-line self-assessment tool based on the eight ‘challenges’ diagnostic in the guide. We propose that the following complete the self-assessment as individuals in the first instance. This should take no more than 30 minutes per person.
All Executive Directors, including the Chief Executive

Paper 2.1
Page 4 of 5 QUASER project – trust board (public) July 2014
Chair of Trust
Non-Executive Directors (NEDs) with lead for quality
We encourage all other NEDs who want to (with a minimum of one further NED)
In discussion with the board to include divisional directors (clinical leaders) and/or those with a senior QI lead role not on the board.
The tool will generate a report bringing together the individually completed self-assessment tool which we ask that the trust’s team discuss in order to build a shared view of where the key quality improvement challenges are for the organisation. Please note the individual self-assessment tool will remain anonymous at all times.
On the basis of this we will ask the board to take three actions:
Identify the areas of quality improvement that it feels need particular attention in the organisation
Select one whole organisation quality improvement intervention to pursue over the year of this programme
Nominate the three organisational leaders who will participate in the workshop and the Action Learning Set workshops at the start, 4 months and 8 months into the project. We recommend that this includes one executive director and one clinical leader. The trust may also wish to include the non-executive director who chairs its quality-focused board committee
Phase Three: QUASER Workshop and Action Learning: 4th November 2014
This one-day workshop brings together all the participating organisations. The focus for the morning session will be on developing the trust’s collective understanding of the QUASER Guide, learning about the research which underpins it and a framework for developing elements of its quality improvement strategy.
The afternoon will be given over to the first of three ‘action learning sets’ (ALS) aimed at creating a supportive environment for participating organisations to draw on the collective experience and wisdom of all the participants:
To develop further an understanding of what approaches will be most effective to build an organisation-wide quality improvement strategy which will build from the trust’s current stage of development and which will address the areas of quality improvement that may need most attention from theself-assessment.
To explore and develop approaches to put in place the selected organisation-wide quality improvement intervention.
We anticipate that by the end of the action learning session, all participants would have arrived at specific goals or commitments to take their quality improvement strategies and interventions forward.
Phase Four: Follow Up Action Learning Sets: end of Jan 2015 and end of April 2015
The programme includes two further facilitated action learning sets. These will explore implementation challenges, and ways to overcome them, as well as following up on progress. The final learning set will, in addition, ask participants to reflect on the value of the guide in facilitating QI, as well as the value of facilitated support for implementation.

Paper 2.1
Page 5 of 5 QUASER project – trust board (public) July 2014
2. EVALUATION OF THE INTERVENTION
We have designed a study that evaluates the implementation of the QUASER Guide by comparing where organisations are in terms of quality improvement (QI) before, during and after the intervention. This will also be compared with a group of ‘comparator’ Trusts. Please note this is not an evaluation of an organisation's performance, procedures or approaches, it is purely an evaluation of the impact of the intervention i.e. the use of the Guide and its facilitation.
The evaluation comprises a mixed method, controlled before and after study, including process measures to assess changes in knowledge and behaviour; an in-depth qualitative process evaluation of seven participating Trusts; and a cost consequence analysis. We will provide feedback on the evaluation to the participating trusts as well as wider dissemination.
Evaluation process for Participating Trusts:
Interviews of up to 5 board members
• Observation of a board meeting• Review of participating trusts QI documents
During
• Observation of group discussion pre-Oct workshop• Interviews with senior leaders participating in the intervention• Observation of QUASER workshop and Action learning• Observation of Follow up Action Learning Sets• Data collection for cost-consequence analysis
After
• Interviews of up to 5 board members• Observation of a board meeting• Follow selection of actions set out in strategies to observe implementation• Review of QI documents

Paper 2.2
Page 1 of 2
Annual complaints report – trust board (public) July 2014
ROYAL FREE HOSPITAL ANNUAL COMPLAINTS REPORT
Executive summary
This report provides information on formal complaints received by the patient affairs department between April 2013 and March 2014. It seeks to provide a summary of the complaints received, the areas concerned, the main issues raised and trends identified, and the actions taken in response or those planned for future services. The Trust received 653 complaints in 2013/14, a reduction from 710 the previous year. The primary subjects as to why patients complain remain largely the same (clinical treatment, attitude, delay and communication) but the actions contained in this report demonstrate that trends are acted upon and the complaints received in the trust are used to inform improvement work aimed at improving the patient experience. The number of complaints being re-opened by complainants and escalated to the Parliamentary Health Service Ombudsman is reducing year on year, which would seem to indicate that the trust’s investigations are more robust and the resultant responses more satisfactory. The response rate has averaged out at 71% for the last 12 months. This is an improvement on last year but, as a result of a poor performance in October to December 2013, not as much of an improvement as expected.
Action required
The Board is asked to consider the issues outlined in the report and the associated actions.
Trust strategic priorities and business planning objectives supported by this paper
Board assurance risk number(s)
2. Excellent user experience – to be in the top 10% of relevant peers on patient, GP and staff experience
4. Excellent compliance with our external duties – to meet our external obligations effectively and efficiently
CQC outcomes supported by this paper
1 Respecting and involving people who use services 4 Care and welfare of people who use services 7 Safeguarding people who use services from abuse 16 Assessing and monitoring the quality of service provision 17 Complaints
Report to
Date of meeting Attachment number
Trust Board
30 July 2014 Paper 2.2
Paper 2.2
Page 2 of 2
Annual complaints report – trust board (public) July 2014
Equality analysis
No identified negative impact on equality and diversity
Report from Deborah Sanders, director of nursing Author Stephen Evans, head of complaints and PALs Date 24 July 2014

Paper 2.2
1 Annual complaints report – trust board (public) July 2014
Annual Complaints Report – 2013/14 Introduction Feedback received from patients, relatives and carers provides the Trust with a vital source of insight about people’s experiences of healthcare at the Royal Free, and how our services can be improved. Complaints received from patients provide us with critically important feedback. The ultimate aim of the trust and the key objective for the patient affairs team and the trust’s complaints process is to listen and respond to the issues being raised and use the information received to improve our services and, in turn, the experience that patients have. This report provides information on formal complaints received by the patient affairs department between April 2013 and March 2014. It seeks to provide a summary of the complaints received, the areas concerned, the main issues raised and trends identified, and the actions taken in response or those planned for future services. Background The statutory instrument for complaints in the NHS is contained in the Local Authority Social Services and National Health Service Complaints (England) Regulations 2009. The legislation expects that each responsible body has arrangements for dealing with complaints to ensure that:
1. complaints are dealt with efficiently; 2. complaints are properly investigated; 3. complainants are treated with respect and courtesy; 4. complainants receive, so far as is reasonably practical -
I. assistance to enable them to understand the procedure in relation to complaints; or
II. advice on where they may obtain such assistance; 5. complainants receive a timely and appropriate response; 6. complainants are told the outcome of the investigation of their complaint; and 7. action is taken if necessary in light of the outcome of a complaint.
The Department of Health issued Listening, Responding, Improving: A guide to better customer care in February 2009 to support organisations in responding to and learning from complainants. The Parliamentary Health Service Ombudsman (PHSO) Principles of Good Complaint Handling has six principles:
1. getting it right 2. being customer focused 3. being open and accountable 4. acting fairly and proportionately 5. putting things right 6. seeking continuous improvement.

Paper 2.2
2 Annual complaints report – trust board (public) July 2014
The Royal Free London NHS Foundation Trust Complaints Policy and Procedure takes into account the regulations and the PHSO principles. Care Quality Commission The Care Quality Commission regulates complaints under Outcome 17 of the Essential Standards of Quality and Safety. The most recent unannounced inspection carried out in February 2014 found the trust to be compliant with this outcome. The inspection found that the complaints and PALS processes were well advertised within the hospital and well known by staff. They were satisfied with the systems in place to manage complaints to ensure that action was taken in response and that trends were reported and triangulated within effective governance processes. They found the sample responses to be of a good standard and noted the reduced re-opened rate. However, reference was made to the poor response rate in October – December 2013 and the lack of systematic contact with those complainants’ whose deadlines had been missed. Analysis of recent reviews of the NHS complaints process
There have been three major reviews undertaken or published in the last 12 months about complaints in the NHS. As well as the recommendations set out in the Francis Report there has also been a recent report from the Parliamentary & Health Service Ombudsman (Designing good together: transforming hospital complaint handling – August 2013) and the review by Ann Clwyd & Professor Tricia Hart (Complaints system review: putting patients back in the picture – October 2013).
A number of the recommendations are repeated in these reports and a gap analysis undertaken by the head of complaints and PALS shows the trust is compliant with the vast majority. The following table is a summary of the key recommendations from all the reports, where there is potential for more to be done or changes to be made to our processes.
The table shows a brief synopsis of the recommendation and suggested action or change.
RECOMMENDATION SUGGESTED ACTION / CHANGE
1 Methods to register a complaint must be accessible and easy to understand. Multiple gateways should be available during and after treatment but all should trigger the same process.
Design complaints & PALS posters for dissemination amongst wards and clinic areas.
More work is required on trust website to increase access for deaf and visually impaired patients.
2 Organisations must constantly promote to the public their desire to receive and learn from comments and complaints.
To work with internal comms team to develop this

Paper 2.2
3 Annual complaints report – trust board (public) July 2014
3 Ward supervisors should be visible and carry out rounds specifically to identify and hear about complaints. They should have protected time to do this.
To be taken forward with matrons
4 The nature of the complaint and desired outcome is established at the outset. There is a legislative duty to have a conversation at the outset and agree method, timescales.
The precise questions to be answered should be discussed to take time to understand the questions being asked and avoid misunderstanding. There should be a single point of contact to help achieve this.
Initial point of contact is the patient affairs team. Later in the process it becomes the complaints manager.
More phone calls to take place at the outset, possibly for complaints that meet a particular threshold or are very long in order to establish key outcomes?
Resource issue for complaints managers. Clarification/agreement of points is not always needed/warranted.
5 The complainant and those complained about are responded to adequately and in a timely manner.
The overall response rate is improving but still lower than we want. Revised holding letters are now being sent straight from the patient affairs team prior to a deadline being missed to ensure complainants are updated. Thereafter, any extensions should be made by complaints managers by telephone.
6 More independence needs to be offered during local resolution, particularly for complaints about SI’s, complaints needing an expert clinical opinion, professional misconduct or the nature and extent of commissioned services.
We still need to own the complaint and be given a chance to investigate it. Director of nursing consults Medical Director when concerned. Relevant cases are already escalated into the SI and safeguarding processes.
7 Where applicable, complainants should be involved in the changes that are taking place.
They already are to an extent because they are made aware of them in our responses and have the opportunity to comment back to us. However, we could do more e.g. showing them a new draft leaflet for comment.

Paper 2.2
4 Annual complaints report – trust board (public) July 2014
8 Learning lessons from complaints occurs throughout the organisation and should be disseminated from the top down.
Quarterly action monitoring report to be disseminated by patient affairs team and completed by complaints managers for promised actions.
9 Board-led scrutiny of complaints on a monthly basis. This should regularly involve lay representatives.
Changes to be made to the quarterly report to aid this process..
10 Staff should receive training on the complaints system and statement writing
Link in with induction (leaflet, stall).
Do more presentations to teams.
11 Patients, communities and local HealthWatch organisations should be involved in the development and monitoring of complaints systems.
Develop in partnership with patient experience team
Complaints Data There were 653 complaints received between 1 April 2013 and 31 March 2014. This is less than the number received in 2012/13, when there were 710. The patient affairs team continue to process contacts in a flexible, negotiated way and this has resulted in an increase in the number of contacts that have been recorded as informal complaints in the last two financial years i.e. there were 92 informal complaints in 2012/13 and 90 in 2013/14. The 653 complaints received is from 80,528 finished consultant episodes (FCE = the cumulative total of elective, non-elective and day-case attendances for this same time period), which equates to complaint ratio of 0.8%. To date, 652 of the complaints have been responded to (the one case that remains open requires a statement from an additional member of staff who has been on long-term leave). Of the 652 complaints responded to, 103 have been upheld, 357 have been partially upheld and 192 have not been upheld. There have been 713 response target dates in this time period, and we have met 508 of them, which equates to an overall response rate of 71%. A breakdown of the complaints by primary subject follows below, along with a comparison table showing the primary subjects for 2012/13. The top 10 subjects are largely the same as 2012/13 but have changed order slightly. Car park issues (the new parking arrangements introduced in October 2013) and concerns about procedures not being followed (e.g. cancellation procedures, appointment booking procedures) are new and complaints about administration and discharge arrangements have dropped out of the top 10.

Paper 2.2
5 Annual complaints report – trust board (public) July 2014
Clinical treatment complaints have decreased significantly but is again the top subject. Other changes of note are the decrease in transport and attitude complaints and the increase in nursing and midwifery complaints. Top 10 Subjects (primary)
2012/13 2013/14
Clinical treatment 159 Clinical treatment 117
Attitude of staff 95 Delay 104
Delay 93 Attitude of staff 81
Communication 74 Communication 66
Administrative 45 Nursing and midwifery 53
Cancellation 35 Clinical diagnosis 39
Clinical diagnosis 33 Car park 34
Transport 32 Cancellation 26
Nursing and midwifery 30 Procedure 20
Discharge 21 Transport 18 Further analysis of the top 3 subjects A more detailed analysis of the top three subjects received i.e. complaints regarding clinical treatment, delays and attitude of staff will follow below, along with examples of actions taken/changes implemented in response to these complaints. In addition, the same analysis will be undertaken for the nursing and midwifery care complaints received. Clinical treatment The table below breaks the clinical treatment complaints down by specialty and the sub-subject of the complaint for the 10 most complained about specialties.
Poor Communication
over Treatment
Delay in Treatment
Incorrect Treatment
No Treatment
Clin
ical Treatment
Unsuccessful
Treatment
Total N
umber
Emergency Department 1 1 5 5 1 2 15
Gynaecology ‐ ‐ 4 1 2 2 9
Ophthalmology 2 2 ‐ ‐ 2 1 7
Trauma & Orthopaedics ‐ 1 2 1 ‐ 3 7
Obstetrics 1 3 ‐ 1 ‐ ‐ 5
Health Services for Elderly ‐ 1 2 1 1 ‐ 5
General Surgery 1 1 1 ‐ ‐ 3 5
Emergency Department ‐ paeds 1 1 1 ‐ ‐ 1 4
Plastic Surgery 1 ‐ 1 ‐ 1 ‐ 3
Vascular ‐ 1 1 ‐ ‐ 1 3
Total 7 11 17 9 7 13 63

Paper 2.2
6 Annual complaints report – trust board (public) July 2014
The trust had 80,528 finished consultant episodes (FCE) in this time period. The 63 complaints about clinical treatment equate to 0.07% of FCEs. There is no identifiable theme in terms of staff member(s) involved. Of these 63 complaints, three of them were fully upheld. They related to the Emergency department (x2) and gynaecology. The gynaecology complaint was escalated to a serious incident and actions are yet to be agreed. Actions taken in response to the two Emergency department complaints are listed below. Doctor cleaned the wound and, in line with recommended best practice, lay the patient
on his back (with his eyes closed) flat on the trolley to avoid the glue dripping into his eye. Unfortunately, despite this, a small amount trickled onto his top eyelash resulting in it sticking to the bottom one. We plan to make every effort to prevent this from happening in future through staff education and training. This training will include, as an additional preventative measure, suggesting occluding the eye with damp gauze so that any glue that then trickles from the wound would come in contact with the gauze (and be absorbed) rather than the eye.
Consultant has confirmed that x-rays must always be carried out for injuries involving glass in order to avoid glass being left behind following suturing. Unfortunately, the junior doctor mistakenly thought that she had some discretion regarding this and, following her assessment, decided not to arrange an x-ray. This decision was incorrect and led to the patient's injury not healing correctly and requiring further surgery. Her consultant has discussed this incident in detail with her and she fully understands the mistake she made and the consequences it had. She has learnt from this and will not make the same error again.
Nursing and midwifery care There were 54 complaints where nursing/midwifery care was recorded as a subject of the complaint (in 53 of those complaints it was the primary subject). The director of nursing reviews all complaints and signs off complaint responses, ensuring that appropriate explanations and apologies have been provided in each case and action taken in response to the points raised. The director of nursing also has escalated to her any issues that are raised regarding unsafe/uncaring practice or potential serious incidents. The table below breaks the nursing complaints down by location and sub-subject. Inappropriate
conduct Delayed care Substandard
care Nutrition
and hydration
Total
A&E Majors 0 0 1 0 1
A&E Minors 0 0 1 0 1
ICU 4 ‐ West 0 0 1 0 1
ITU 1 0 0 0 1
Labour ward triage 0 0 2 0 2
George Quist 0 0 1 0 1
5 South 0 0 1 0 1

Paper 2.2
7 Annual complaints report – trust board (public) July 2014
6 East 0 1 3 0 4
6 North 0 0 1 0 1
6 South 0 0 4 0 4
6 West B 0 0 1 0 1
7 East A 0 0 4 0 4
7 East B 0 0 1 0 1
7 West 0 0 3 0 3
7 North 0 0 1 0 1
8 East 0 1 3 1 5
8 North 0 2 3 0 5
8 West 0 0 2 0 2
9 North 0 0 4 1 5
9 West 0 0 1 0 1
10 North 0 0 2 0 2
10 South 0 0 1 0 1
10 South A 0 0 1 0 1
10 West 0 0 2 0 2
11 East 0 0 1 0 1
11 South 0 0 1 0 1
12 South 0 0 1 0 1
Totals: 1 4 47 2 54 Of these 54 complaints, 10 were fully upheld and related to care received on 6 South (x2), 6 North, 7 East A, 8 East (x2), 9 West, 10 West, 11 East, A&E Majors, and ITU. The data above highlights that the concerns raised about nursing care are spread across a number of wards. However, 8 East, 8 North and 9 North feature more times than other wards. 8 East and 9 north both have improvement plans in place which have been informed by the complaints received. Example actions taken in response to the complaints are listed below: The Divisional Nurse Director is leading an improvement plan for 8 East ward nursing
staff. The ITU matron reviewed the patient's records and, regrettably, advised that the
instructions not to shave the patient were not documented by the nursing staff. Matron finds the agency nurse concerned to be a reliable and well-regarded member of agency staff, and believes that part of the responsibility for this error lies with other ward staff for not documenting in the record's the request not to shave the patient. Matron raised this matter at nursing team meetings to make sure all staff members were aware of the need to be sure about patients' preferences before undertaking personal care of this nature. He also fed the incident back to the agency, with a request that they ask the nurse identified to take more care in future.
Regrettably, the staff on 6 South failed to follow the pain management policy. The
clinical practice educator has discussed what happened with the nursing staff in detail to ensure learning takes place and avoid a similar situation occurring in the future. As a

Paper 2.2
8 Annual complaints report – trust board (public) July 2014
result of the complaint, all the nurses on 6 South ward are going to be retrained in relation to care of the dying patient.
Regrettably, it would appear that due to the poor standard of initial assessment on admission to 8 East ward, it was not noted that the patient required extra assistance, such as the use of the 'red tray' system. Sister has discussed this with the nurse concerned and she has been made aware of her mistakes. Sister is starting a champion theme on the ward in the near future and the nurse concerned will be one of our documentation champions, which means she will ensure admissions are completed correctly and in a timely manner and will become involved with auditing the assessments.
The patient should not have had such difficulty in calling for help on 8 West ward and, as
a minimum, she should have received more frequent nurse rounding visits so that she was not left so frustrated and distressed. This complaint has highlighted the need to address this issue (patients who are unable to use a call bell to attract attention) so that future patients do not experience similar problems. The divisional nurse director is exploring, with our estates manager, whether there are different handsets that may be used in situations such as this, as they would also be useful on the stroke and neurology wards.
The agency staff member working on 9 West was excluded by the trust and the agency conducted their own internal investigation.
Poor practice on the part of the healthcare assistant working on 7 East A was identified
during the course of the investigation. The healthcare assistant is now undergoing further training and a period of supervised practice.
Paper 2.2
9 Annual complaints report – trust board (public) July 2014
Delay
Delay in Admission
Delay/length of wait in A&E
Length of wait in clin
ic
Delay in discharge
Delay in Providing EN
T
Equipment to Patient
Delay in receiving inpatient
treatment
Delay in receiving outpatient
appointm
ent
Delay in Pharmacy Departm
ent
Delay in receiving test results
Delay in diagn
osis
Delay in arran
ging diagn
ostic
tests
Delay in provision of diagn
ostic
test results
Total
Breast Clinic 0 0 0 0 0 0 0 0 0 0 0 2 2
Orthopaedic/Fracture Clinic 0 0 4 0 0 0 0 0 0 0 0 0 4
Clinic 2 0 0 2 0 0 0 0 0 0 0 0 0 2
Clinic 3 0 0 6 0 0 0 0 0 0 0 0 0 6
Clinic 5 0 0 1 0 1 0 0 0 0 0 0 0 2
Clinic 6 0 0 4 0 0 0 0 0 0 0 0 0 4
Outpatients Dept/Clinic 0 0 10 0 0 3 2 0 4 1 2 0 22
A&E ‐ Minors 1 1 0 0 0 0 0 0 0 0 0 0 2
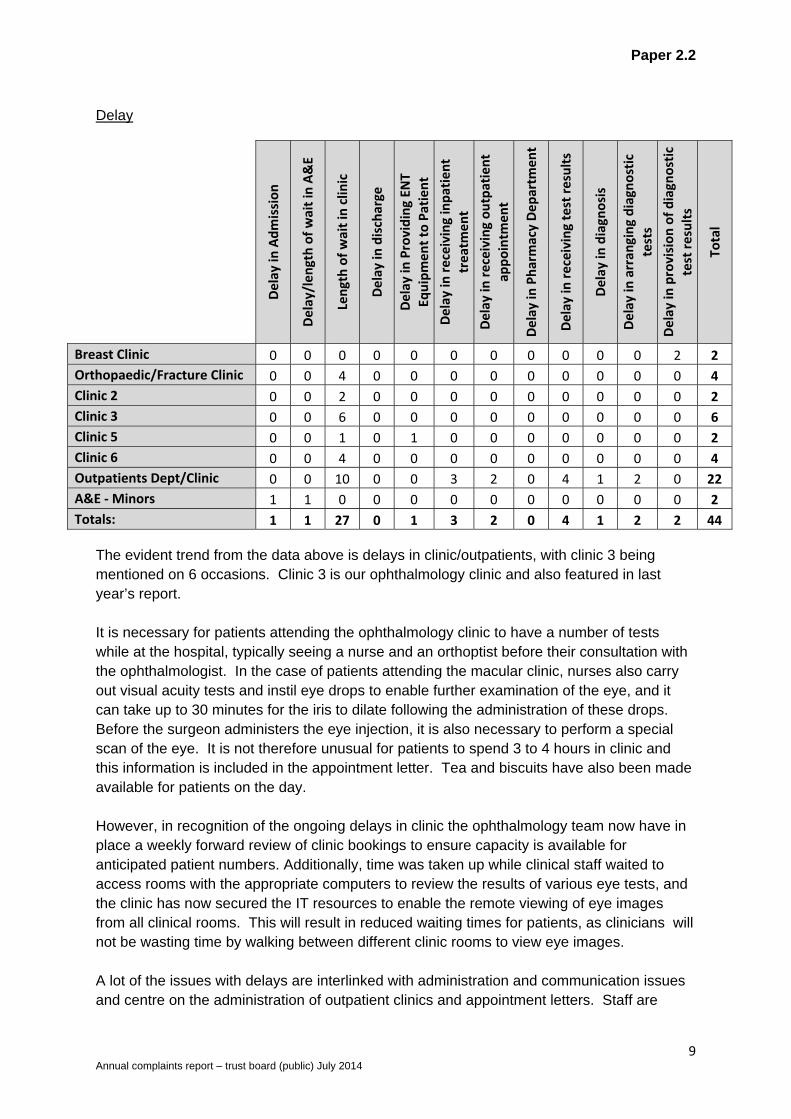
Totals: 1 1 27 0 1 3 2 0 4 1 2 2 44 The evident trend from the data above is delays in clinic/outpatients, with clinic 3 being mentioned on 6 occasions. Clinic 3 is our ophthalmology clinic and also featured in last year’s report. It is necessary for patients attending the ophthalmology clinic to have a number of tests while at the hospital, typically seeing a nurse and an orthoptist before their consultation with the ophthalmologist. In the case of patients attending the macular clinic, nurses also carry out visual acuity tests and instil eye drops to enable further examination of the eye, and it can take up to 30 minutes for the iris to dilate following the administration of these drops. Before the surgeon administers the eye injection, it is also necessary to perform a special scan of the eye. It is not therefore unusual for patients to spend 3 to 4 hours in clinic and this information is included in the appointment letter. Tea and biscuits have also been made available for patients on the day. However, in recognition of the ongoing delays in clinic the ophthalmology team now have in place a weekly forward review of clinic bookings to ensure capacity is available for anticipated patient numbers. Additionally, time was taken up while clinical staff waited to access rooms with the appropriate computers to review the results of various eye tests, and the clinic has now secured the IT resources to enable the remote viewing of eye images from all clinical rooms. This will result in reduced waiting times for patients, as clinicians will not be wasting time by walking between different clinic rooms to view eye images. A lot of the issues with delays are interlinked with administration and communication issues and centre on the administration of outpatient clinics and appointment letters. Staff are

Paper 2.2
10 Annual complaints report – trust board (public) July 2014
constantly being reminded of the need to be proactive and keep patients updated about any delays in clinic. The kiosks can also be used for self-check in, which should help to reduce waiting times in the outpatient environment, congestion at the reception desk and enable staff to focus more on communicating with patients, making accurate follow up appointments, as well as increased customer care. Staff attitude The table below breaks the primary attitude complaints down by staff group and whether the complaint was fully upheld or not.
Number received Number fully upheld
Administrative 18 2 Medical 31 1
Nursing 21 3
Other 10 2 The medical staff complaints related to doctors appearing to be rude, not taking concerns seriously, a lack of introduction to other staff present in the consultation room, or being brisk and dismissive. The nursing staff complaints relate to nursing staff appearing to be rude, lacking understanding/sympathy, or being unresponsive and unhelpful. The administrative staff complaints relate to staff appearing to be rude and unhelpful (predominantly over the phone) when dealing with enquiries. Unfortunately, it is not always possible to identify the staff member(s) involved in an allegation of poor attitude, due to complainants not being aware of their name or the exact date, time and location of the interaction(s) concerned. Wherever possible, staff are identified during the investigation process by using descriptions and referring to rotas etc, and action is taken to follow the matter up. 51 members of staff were identified during the course of these investigations and two clinical staff accounted for two complaints each, but other than this there were no clearly identifiable trends. However, the issues associated with these clinical staff have featured in previous complaints and the matter had already been escalated to their senior managers, who met with them to discuss the complaints and the issues raised regarding their attitude. The fact that they had been referred to again in recent complaints was once again escalated.
Examples of other action taken in response to attitude complaints received are: The sonographer concerned was asked to attend a workshop in order to develop her
communication skills and refresh herself with the trust’s world class care values. The staff nurse’s behaviour (10 North) was not found to meet the required trust
standards and, consequently, her behaviour was dealt with internally by her senior team.

Paper 2.2
11 Annual complaints report – trust board (public) July 2014
As a result of a complaint raised about experiences on 10 north, the trust commissioned a bespoke piece of work led by a National Patient Champion to raise awareness and understanding of the importance of the way in which care is delivered to patients.
The receptionist accepts that their behaviour was inappropriate and is aware that should
there be any further concerns raised about their attitude, the matter will be taken forward via our HR procedures.
The radiologist was asked to reflect on her attitude and the department as a whole
undertook to liaise with the dementia care team in order to receive training on dealing with patients suffering from dementia.
Whilst there is evidence of action being taken to address staff attitude and communication of particular individuals identified in complaints, the difficulty with staff attitude and poor communication was identified as an issue of importance and informed the trust’s World Class Care initiative. Complaints received about attitude have subsequently dropped every year since 2010/11. Examples of actions taken in response to other complaints In addition to apologies and explanations, the majority of our complaint responses will include details of specific action(s) taken as a result of the complaint that has been received. Some general examples of actions taken/changes implemented are listed below:
A patient’s HIV status was mistakenly disclosed to his GP against his wishes. Since this
incident, the ICDC team has revised its processes to ensure that GPs are only contacted when the following procedures have been met:
A consent form is completed stipulating whether the GP or other organisations may
be contacted about the patient. The consent status is checked by the clinician at each clinic review. The consent form is attached inside the front cover of the patient's medical notes and must be checked by the reviewing doctor or nurse before writing to the GP.
Consent status is entered onto the ICDC electronic database. The secretarial staff check consent status before sending out any written
correspondence to the GPs. The paediatric allergy team will ensure that communication about tests is clearer; this will
be done using a new information leaflet which will be given out to parents at the time the decision for testing is made. The team will also consider having play therapists present during the allergy clinic to help children who may be anxious. Additionally, staff will ask at the initial consultation if there are any issues that may affect the child's ability to tolerate the test, such as a needle phobia, so that the referral can be clear and the allergy nurses have awareness that they need to allow more time for that child's consultation.
The stock of the two products involved in a potential prescribing error are now stored in different areas of the dispensary to prevent the potential of a further error occurring.

Paper 2.2
12 Annual complaints report – trust board (public) July 2014
The consultant will shortly be meeting with the matron to look at improvements to our inpatient angiography policy with the aim of introducing a limit of one day's wait when patients are kept nil by mouth.
The emergency department matron has reiterated to the nurses in the department,
during their recent daily safety briefings, that they must not use tubigrip for this type of wrist injury and a note has also been put on the plaster trolley to this effect.
The nursing team in ITU recognise that they were not as familiar as they could have
been in using a syringe driver to administer painkillers and have since sought further training and guidance on the use of this equipment.
The MSL driver did not follow correct procedure and is being followed up by MSL internal
disciplinary procedures.
Under the existing lease arrangements we do not have a direct contractual route to
influence the displays and offers within the WH Smith retail unit. However, the issues regarding the number of healthy foods on offer falls directly into our public health agenda. We have spoken to WH Smith about this and they have agreed to develop a pilot, in collaboration with the trust, whereby they will change the offerings in the retail unit and on the patient trolley to more healthy options for a period of 3 months. We will review with WH Smith staff the impact on their business, quantify the health benefits, gain feedback from trust patients, visitors and staff, and subsequently make a decision on future offerings.
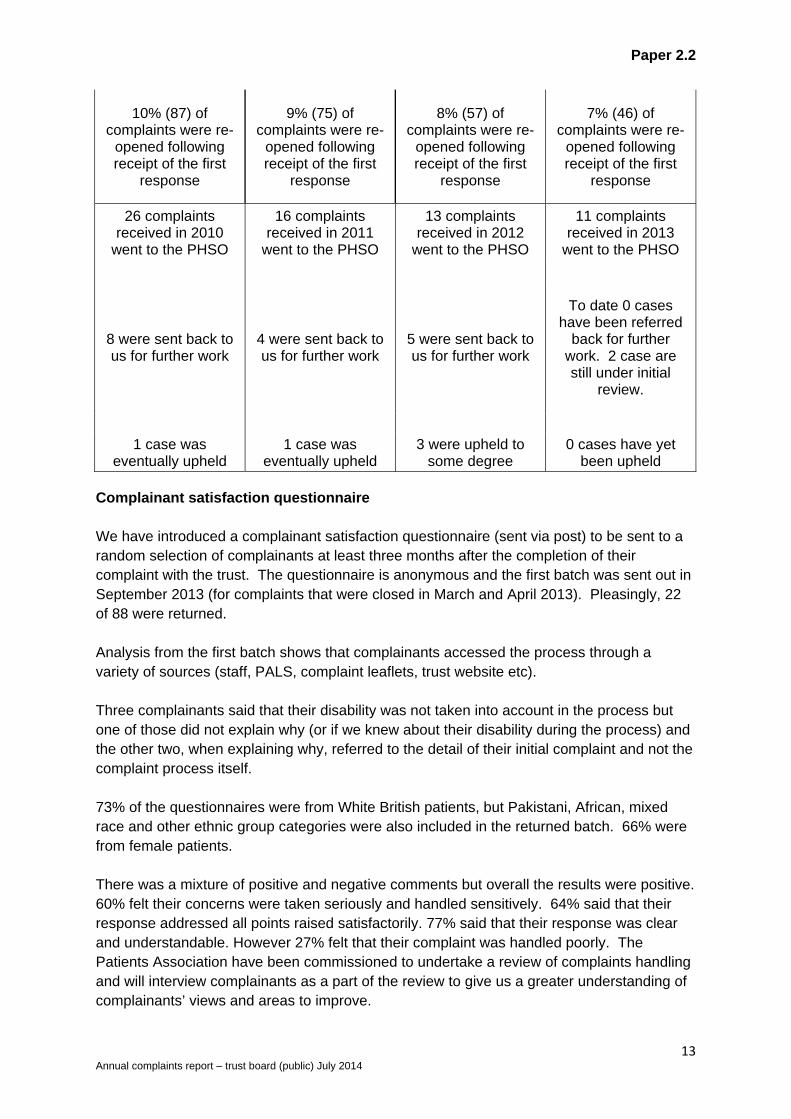
Complaints re-opened and referred to the PHSO As demonstrated by the table below, the number of complainants that re-open their complaint following receipt of the first response is falling, as is the number of complaints being taken to the PHSO. There has been a recent increase in the number being referred back to the trust for further work and the number upheld by the by the PHSO. However, this coincided with the PHSO indicating that there would be a change in the way that they record their case work i.e. any preliminary reviews of complaint files would be recorded as investigations in their annual figures, as opposed to only those cases that went on to be formally investigated. Since April 2013, there has been an increase in the number of cases formally investigated by the PHSO. In addition, the draft reports produced by the PHSO are increasingly making recommendations for financial payment in recognition of distress caused. This is something that we plan to monitor.
2010/11 2011/12 2012/13 2013/14
Paper 2.2
13 Annual complaints report – trust board (public) July 2014
10% (87) of complaints were re-
opened following receipt of the first
response
9% (75) of complaints were re-
opened following receipt of the first
response
8% (57) of complaints were re-
opened following receipt of the first
response
7% (46) of complaints were re-
opened following receipt of the first
response
26 complaints received in 2010
went to the PHSO
16 complaints received in 2011
went to the PHSO
13 complaints received in 2012
went to the PHSO
11 complaints received in 2013
went to the PHSO
8 were sent back to us for further work
4 were sent back to us for further work
5 were sent back to us for further work
To date 0 cases have been referred
back for further work. 2 case are still under initial
review.
1 case was eventually upheld
1 case was eventually upheld
3 were upheld to some degree
0 cases have yet been upheld
Complainant satisfaction questionnaire We have introduced a complainant satisfaction questionnaire (sent via post) to be sent to a random selection of complainants at least three months after the completion of their complaint with the trust. The questionnaire is anonymous and the first batch was sent out in September 2013 (for complaints that were closed in March and April 2013). Pleasingly, 22 of 88 were returned. Analysis from the first batch shows that complainants accessed the process through a variety of sources (staff, PALS, complaint leaflets, trust website etc). Three complainants said that their disability was not taken into account in the process but one of those did not explain why (or if we knew about their disability during the process) and the other two, when explaining why, referred to the detail of their initial complaint and not the complaint process itself. 73% of the questionnaires were from White British patients, but Pakistani, African, mixed race and other ethnic group categories were also included in the returned batch. 66% were from female patients. There was a mixture of positive and negative comments but overall the results were positive. 60% felt their concerns were taken seriously and handled sensitively. 64% said that their response addressed all points raised satisfactorily. 77% said that their response was clear and understandable. However 27% felt that their complaint was handled poorly. The Patients Association have been commissioned to undertake a review of complaints handling and will interview complainants as a part of the review to give us a greater understanding of complainants’ views and areas to improve.
Paper 2.2
14 Annual complaints report – trust board (public) July 2014
The next batch of surveys has been sent out. 94 were sent and to date 19 have been returned. Analysis of this batch will be undertaken shortly. The questionnaires will be analysed on an ongoing basis and the results used to inform future practice. Conclusions The number of formal complaints received has reduced from 2012/13. The patients who are the subjects of our complaints are largely representative of the patient demographic for this time period. The majority of the complainants reported themselves as White British (55%); 12% reported themselves as other White; 4% reported themselves as other Asian and 13% did not state their ethnicity. The primary subjects remain largely the same (clinical treatment, attitude, delay and communication) but the actions contained in this report demonstrate that trends are acted upon and the complaints received in the trust are used to inform pieces of work aimed at improving the patient experience. The number of complaints being re-opened by complainants and escalated to the PHSO is reducing year on year, which would seem to indicate that the trust’s investigations are more robust and the resultant responses more satisfactory. The response rate has averaged out at 71% for the last 12 months. This is an improvement on last year but, as a result of a poor performance in October to December 2013, not as much of an improvement as expected. Analysis by the head of complaints & PALS following the CQC inspection in February 2014, revealed that the practice of negotiating deadlines with complainants and agreeing realistic deadlines/extensions beyond the agreed deadlines if it was felt necessary, or if delays were experienced during the course of the investigation, was not being undertaken as much as thought. Therefore, a new system has been implemented, whereby the patient affairs team automatically send a letter to the complainant if and when the initial response deadline is going to be missed. Any further updates and/or extensions that may be required should then come from the complaints manager, preferably by telephone, leading on the investigation. This has so far resulted in a performance of 78% for January to March 2014 and 87% for April to June 2014. In summary, the trust values the feedback obtained from the complaints received and responds to all concerns openly, thoroughly and efficiently. The ultimate aim of the trust and the key objective for the patient affairs team, as well as the trust’s wider governance structures, is to listen and respond to the issues being raised and use the information received to improve trust services and, in turn, the patient experience. There are systems in place to systematically review the complaints received and ensure that investigations are undertaken appropriately, in line with legislation, and escalated within the trust as necessary. The responses provided invariably outline action(s) that have been taken in response to the concerns raised or explain what is planned as a result of issues identified during the investigation. The data collected is used to inform reports, is disseminated amongst divisional teams and taken to various committees to inform ongoing work within the trust.
Paper 2.2
15 Annual complaints report – trust board (public) July 2014
The CQC deemed that the trust was meeting the complaint standards. The inspection found that the complaints and PALS processes were well advertised within the hospital and well known by staff. They were satisfied with the systems in place to manage complaints to ensure that action was taken in response and that trends were reported and triangulated within effective governance processes. They found the sample responses to be of a good standard and noted the reduced re-opened rate. However, reference was made to the poor response rate in October – December 2013 and the lack of systematic contact with those complainants’ whose deadlines had been missed.

Paper 2.3a
1
Report to Date Attachment number
Trust Board
30 July 2014 Paper 2.3a
DIRECTOR OF INFECTION PREVENTION AND CONTROL - ANNUAL REPORT 2013/14
Executive summary In line with the revised Health and Social Care Act (2008) trusts are required to have appropriate management and clinical governance systems in place to deliver effective infection prevention and control. This document reports on the activity for the year 2012/13 to provide assurance that the IPC programme has been taken forward, that IPC activity has striven to assure compliance with the Health and Social Care Act detailed below. This document also includes reports from associated services including Pathology and Facilities who are key to delivering a clean and safe environment for patient care. Action required The Board is asked to confirm that the report provides sufficient information to provide assurance of sustained compliance with the Hygiene Code. Trust strategic aims and business planning objectives supported by this paper
Improving clinical effectiveness Enhancing the patient experience To be in the top 10% of hospitals in England for quality including reductions in HCAIs
CQC outcomes supported by this paper Outcome 8 Cleanliness and infection control
Risks attached to this project / initiative and how these will be managed (assurance) The revised Hygiene Code Risk matrix will be monitored at the Infection Control Committee. The risks associated with the Hygiene Code have been included in the Board Assurance Framework and will be scrutinised by the Healthcare Governance Committee
Equality impact assessment
no adverse equality impact
Public, patient and carer involvement All IPC reports available to public scrutiny and discussed at open Board meetings.
Report from Deborah Sanders Authors Y Carter, R Smith, D Mack, D Irish Date 24 July 2014
Paper 2.3a
2
Infection Prevention and Control Annual report 2012/13 Contents Page 1.0 Introduction 3 2.0 Description of infection prevention and control arrangements 3 3.0 Infection prevention and control team structure 3 4.0 Healthcare associated infections 4
4.1 MRSA acquisition 4 4.2 MRSA and MSSA bacteraemia 5 4.3 C. difficile 6 4.4 Carbapenemase producing enterobacteriaceae 7
5.0 Virology 8 6.0 Surgical site Infection surveillance 10 7.0 Outbreaks and incidents 11 8.0 Education 12 9.0 Audit and surveillance 12 10.0 Infection prevention and control policies 12 11.0 Health and Work 12 12.0 Cleaning services 17 13.0 Antibiotic stewardship 19 15.0 Service validation 21 Appendix 1 IPC surveillance programme 22

Paper 2.3a
3
1.0 Introduction and Summary This report outlines activity and events related to infection control for 2013/4. As before, healthcare associated infection (HCAI) continues to be an important issue for the Trust. The trust target remains ‘zero avoidable infections’. For reportable organisms, there were two more attributable C.difficile cases than the threshold for the year, but improved from 50 cases to 35 cases from last year. Monitor and trust commissioners are aware of breach, but also aware that next year threshold is 38 cases. The trust remains a top performing trust with no MRSA bacteraemias for 19 months. 2.0 Description of infection control arrangements Deborah Sanders, Director of Nursing is Director of Infection Prevention and Control (DIPC) and chair of the infection prevention and control committee (IPCC). The IPCT is headed by the DIPC, who is a board member and activity is directed by the lead infection control doctor and service lead infection control nurse. The IPCC meets quarterly and has representation from across the Trust. The consultant microbiologist with special interest in antimicrobial prescribing is a member of the IPCC and the Drugs and Therapeutics Committee and acts as a link between the two. Within the trust committee structure the IPCC reports to the clinical risk committee, which also has the divisional clinical leads and lead infection control doctor as members. The IPCC is reported to by the Decontamination Committee and the fortnightly divisional leads IPC group and Clostridium difficile action group. The fortnightly meeting chaired by Dr Steve Shaw, Divisional Director of Urgent Care is held to review ongoing infection control data, infection control activity, activity to keep C.diff cases below threshold and other IPC issues. This is attended by the IPCT, divisional infection control clinical leads, divisional nurse directors and operational managers as well as allied healthcare professionals (AHPs). Monthly reports of infection control activity within each clinical division are recorded as part of the divisional clinical governance grid. 3.0 Infection Control Team Staffing Director of infection, prevention and control D Sanders – Director of Nursing. Medical Staff Consultant microbiology 5 PA (infection control lead) Consultant microbiology 3 PA Consultant microbiology 1 PA Consultant microbiology 2.5 PA Virologist 1.5 PA Nursing Staff Service lead nurse 1 wte Clinical lead nurse 1 wte Clinical Nurse Specialist 2.6 wte - I wte funded by renal services Audit and Surveillance Nurse 1 wte Patient Liaison – IPC 1 wte IPC Practice Educator 3 wte Data administrator 1 wte funded by Microbiology Healthcare scientist 0.5 wte funded by Microbiology
Paper 2.3a
4
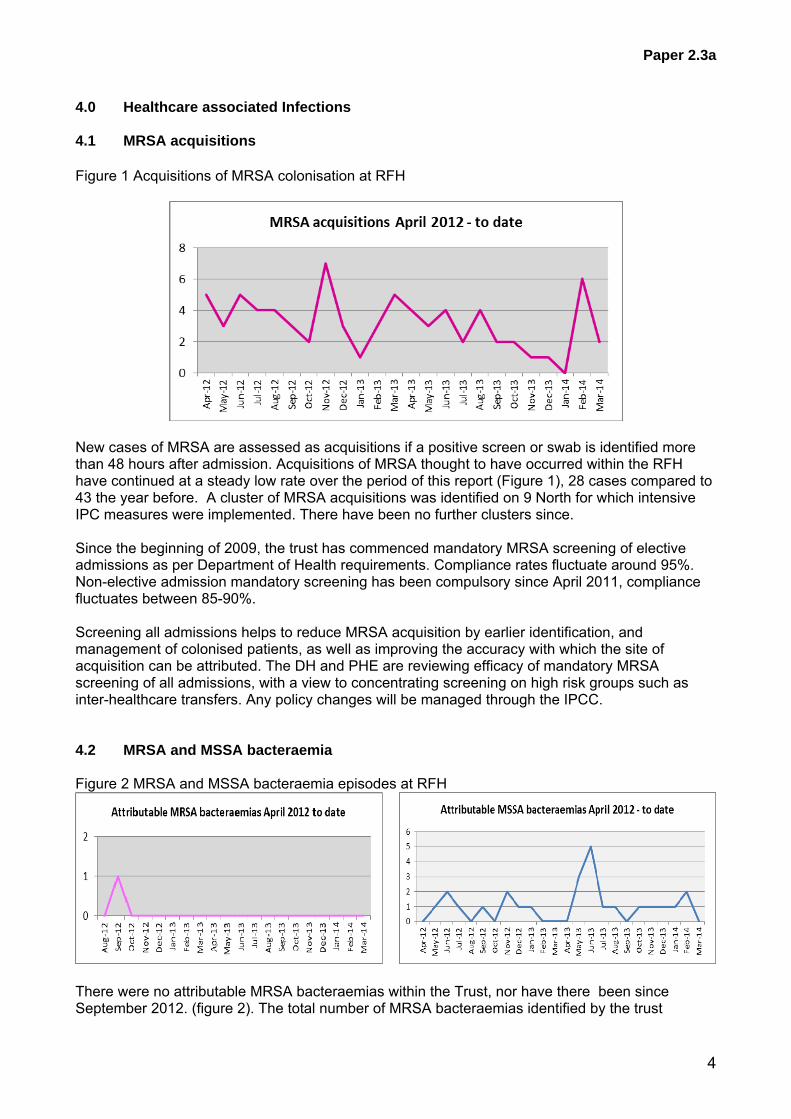
4.0 Healthcare associated Infections 4.1 MRSA acquisitions Figure 1 Acquisitions of MRSA colonisation at RFH
New cases of MRSA are assessed as acquisitions if a positive screen or swab is identified more than 48 hours after admission. Acquisitions of MRSA thought to have occurred within the RFH have continued at a steady low rate over the period of this report (Figure 1), 28 cases compared to 43 the year before. A cluster of MRSA acquisitions was identified on 9 North for which intensive IPC measures were implemented. There have been no further clusters since. Since the beginning of 2009, the trust has commenced mandatory MRSA screening of elective admissions as per Department of Health requirements. Compliance rates fluctuate around 95%. Non-elective admission mandatory screening has been compulsory since April 2011, compliance fluctuates between 85-90%. Screening all admissions helps to reduce MRSA acquisition by earlier identification, and management of colonised patients, as well as improving the accuracy with which the site of acquisition can be attributed. The DH and PHE are reviewing efficacy of mandatory MRSA screening of all admissions, with a view to concentrating screening on high risk groups such as inter-healthcare transfers. Any policy changes will be managed through the IPCC. 4.2 MRSA and MSSA bacteraemia Figure 2 MRSA and MSSA bacteraemia episodes at RFH
There were no attributable MRSA bacteraemias within the Trust, nor have there been since September 2012. (figure 2). The total number of MRSA bacteraemias identified by the trust
Paper 2.3a
5
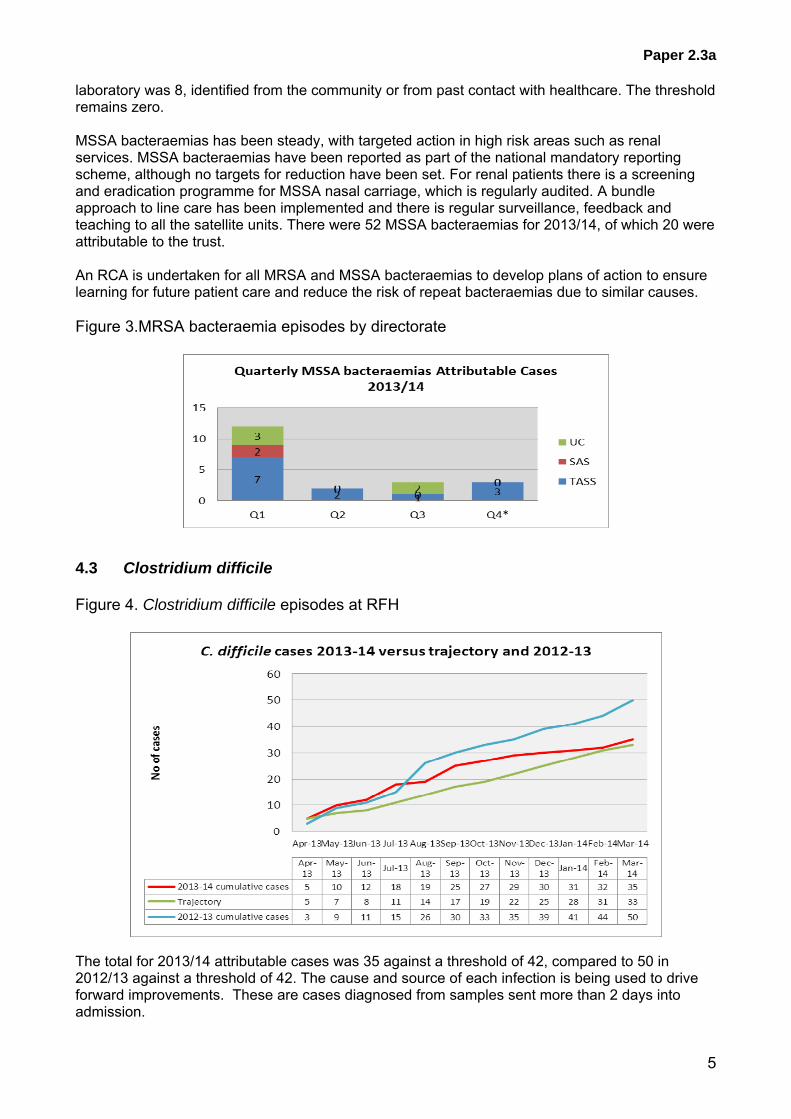
laboratory was 8, identified from the community or from past contact with healthcare. The threshold remains zero. MSSA bacteraemias has been steady, with targeted action in high risk areas such as renal services. MSSA bacteraemias have been reported as part of the national mandatory reporting scheme, although no targets for reduction have been set. For renal patients there is a screening and eradication programme for MSSA nasal carriage, which is regularly audited. A bundle approach to line care has been implemented and there is regular surveillance, feedback and teaching to all the satellite units. There were 52 MSSA bacteraemias for 2013/14, of which 20 were attributable to the trust. An RCA is undertaken for all MRSA and MSSA bacteraemias to develop plans of action to ensure learning for future patient care and reduce the risk of repeat bacteraemias due to similar causes. Figure 3.MRSA bacteraemia episodes by directorate
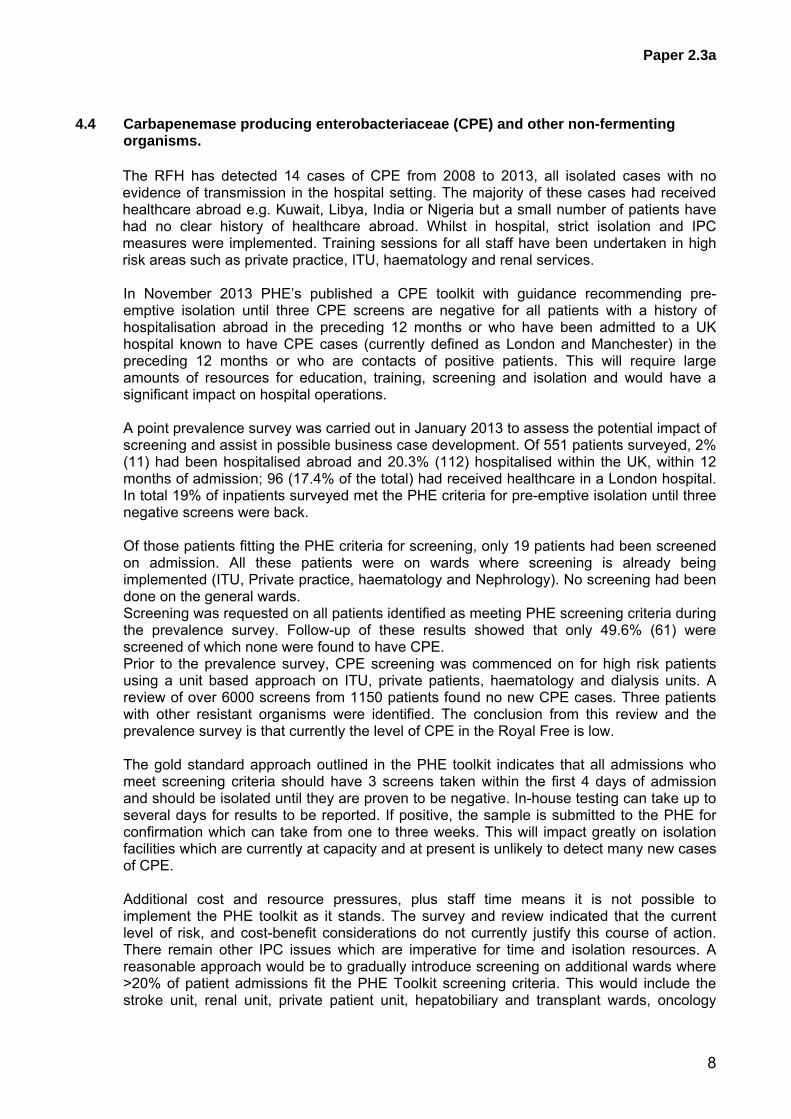
4.3 Clostridium difficile Figure 4. Clostridium difficile episodes at RFH
The total for 2013/14 attributable cases was 35 against a threshold of 42, compared to 50 in 2012/13 against a threshold of 42. The cause and source of each infection is being used to drive forward improvements. These are cases diagnosed from samples sent more than 2 days into admission.

Paper 2.3a
6
Fig 5. C.diff cases by class
Fig 6. Yearly totals C.diff.
Total attributable C.diff per year.
2010/11 56 2011/12 42 2012/13 50 2013/14 35

Paper 2.3a
7
Learning and Attributable’ cases include attributable cases according to NHS London definition and those other cases where the patient has received healthcare at the RFH within the previous three months. It is thought that this wider group is more appropriate for examining possible contributory factors. Community cases are those cases where no link with recent healthcare at RFH can be found. There were two periods of increased incidence (PII) on 9 North and 8 North. Full IPC measures were established and there was no evidence of transmission and no subsequent cases A report is provided to the Clinical Performance Committee (now Patient Safety Committee) and to Monitor to monitor C.diff cases against trajectory. Next year’s threshold is 38
Q1 Q2 Q3 Q4 YTD
Total TASS CDT attributable 8 4 3 1 16BLOOD AND MARROW TRANSPLANTATION 0 0 0 0 0ENDOCRINE 0 0 0 0 0HEPATOLOGY 1 0 1 0 2
GASTROENTEROLOGY 1 0 0 1HBP SURGERY 0 1 1 0 2
LIVER TRANSPLANTATION 0 0 0 1 1NEPHROLOGY 4 0 0 0 4UROLOGY 0 0 0 0 0
RENAL TRANSPLANT 0 0 0 0 0INFECTION AND IMMUNITY 0 0 0 0 0
RHEUMATOLOGY 0 0 0 0 0
INFECTIOUS DISEASE 0 0 0 0 0
HAEMATOLOGY 2 2 1 0 5ONCOLOGY 0 1 0 0 1
1 2 2 0 5GENERAL SURGERY 0 0 1 0 1GI & COLORECTAL SURGERY 0 0 0 0 0
VASCULAR SURGERY 0 1 0 0 1ORTHOPAEDIC SURGERY 1
00 0 1
PLASTICS 0 0 0 0 0
BREAST SURGERY 0 0 0 0 0
DERMATOLOGY 0 0 0 0 0NEUROLOGY 0 0 1 0 1
NEUROSURGERY 0 0 0 0 0STROKE 0 1 0 0 1OPHTHALMOLOGY 0 0 0 0 0
Total UC CDT attributable 3 7 0 4 14A&E A&E 0 0 0 0 0
HSEP 2 4 0 3 9MEDICAL 1 1 0 1 3RESPIRATORY 0 0 0 0 0CARDIOLOGY 0 2 0 0 2
GYNAECOLOGY 0 0 0 0 0OBSTETRICS 0 0 0 0 0
Children's services PAEDIATRICS 0 0 0 0 0Total ITU CDT attributable 3 1 1 0 5
12 13 5 5 35PCR Positive Attributable 19 27 15 15 76Learning 11 6 9 6 32PCR Positive Learning 13 15 12 16 56Community 4 3 3 9 19PCR Community 8 2 6 5 21Grand Total 67 66 50 56 239
CDT Attributable cases
Total RFH CDT Attributable
Total SAS attributable
DIVISIONS REFLECT ONLY ATTRIBUTABLE CASES
Acute medicine, HSEP and respiratory
Maternity, obstetrics and gynaecology
Hepatology, gastroenterology, HBP
surgery and liver transplantation
Plastics & reconstructive surgery & dermatology
directorate
Haematology & oncology
Inflammation & infection services
Nephrology, urology and renal transplantation
Endocrinology and immunology
General surgery and orthopaedics directorate
Neurosciences, pain & ophthalmology
directorate
Figure 7. CDI by division
Paper 2.3a
8
4.4 Carbapenemase producing enterobacteriaceae (CPE) and other non-fermenting organisms.
The RFH has detected 14 cases of CPE from 2008 to 2013, all isolated cases with no evidence of transmission in the hospital setting. The majority of these cases had received healthcare abroad e.g. Kuwait, Libya, India or Nigeria but a small number of patients have had no clear history of healthcare abroad. Whilst in hospital, strict isolation and IPC measures were implemented. Training sessions for all staff have been undertaken in high risk areas such as private practice, ITU, haematology and renal services. In November 2013 PHE’s published a CPE toolkit with guidance recommending pre-emptive isolation until three CPE screens are negative for all patients with a history of hospitalisation abroad in the preceding 12 months or who have been admitted to a UK hospital known to have CPE cases (currently defined as London and Manchester) in the preceding 12 months or who are contacts of positive patients. This will require large amounts of resources for education, training, screening and isolation and would have a significant impact on hospital operations. A point prevalence survey was carried out in January 2013 to assess the potential impact of screening and assist in possible business case development. Of 551 patients surveyed, 2% (11) had been hospitalised abroad and 20.3% (112) hospitalised within the UK, within 12 months of admission; 96 (17.4% of the total) had received healthcare in a London hospital. In total 19% of inpatients surveyed met the PHE criteria for pre-emptive isolation until three negative screens were back. Of those patients fitting the PHE criteria for screening, only 19 patients had been screened on admission. All these patients were on wards where screening is already being implemented (ITU, Private practice, haematology and Nephrology). No screening had been done on the general wards. Screening was requested on all patients identified as meeting PHE screening criteria during the prevalence survey. Follow-up of these results showed that only 49.6% (61) were screened of which none were found to have CPE. Prior to the prevalence survey, CPE screening was commenced on for high risk patients using a unit based approach on ITU, private patients, haematology and dialysis units. A review of over 6000 screens from 1150 patients found no new CPE cases. Three patients with other resistant organisms were identified. The conclusion from this review and the prevalence survey is that currently the level of CPE in the Royal Free is low. The gold standard approach outlined in the PHE toolkit indicates that all admissions who meet screening criteria should have 3 screens taken within the first 4 days of admission and should be isolated until they are proven to be negative. In-house testing can take up to several days for results to be reported. If positive, the sample is submitted to the PHE for confirmation which can take from one to three weeks. This will impact greatly on isolation facilities which are currently at capacity and at present is unlikely to detect many new cases of CPE. Additional cost and resource pressures, plus staff time means it is not possible to implement the PHE toolkit as it stands. The survey and review indicated that the current level of risk, and cost-benefit considerations do not currently justify this course of action. There remain other IPC issues which are imperative for time and isolation resources. A reasonable approach would be to gradually introduce screening on additional wards where >20% of patient admissions fit the PHE Toolkit screening criteria. This would include the stroke unit, renal unit, private patient unit, hepatobiliary and transplant wards, oncology
Paper 2.3a
9
ward and infectious diseases ward. Further discussion with other IPC teams and PHE staff will inform a risk assessment and strategy for future CPE screening and management. An action plan has presented to address the risks posed by CPE and provide assurance to the Trust of that there are systems in place for surveillance and a plan to escalate infection control measures as an when required following the guidance in the PHE Toolkit.
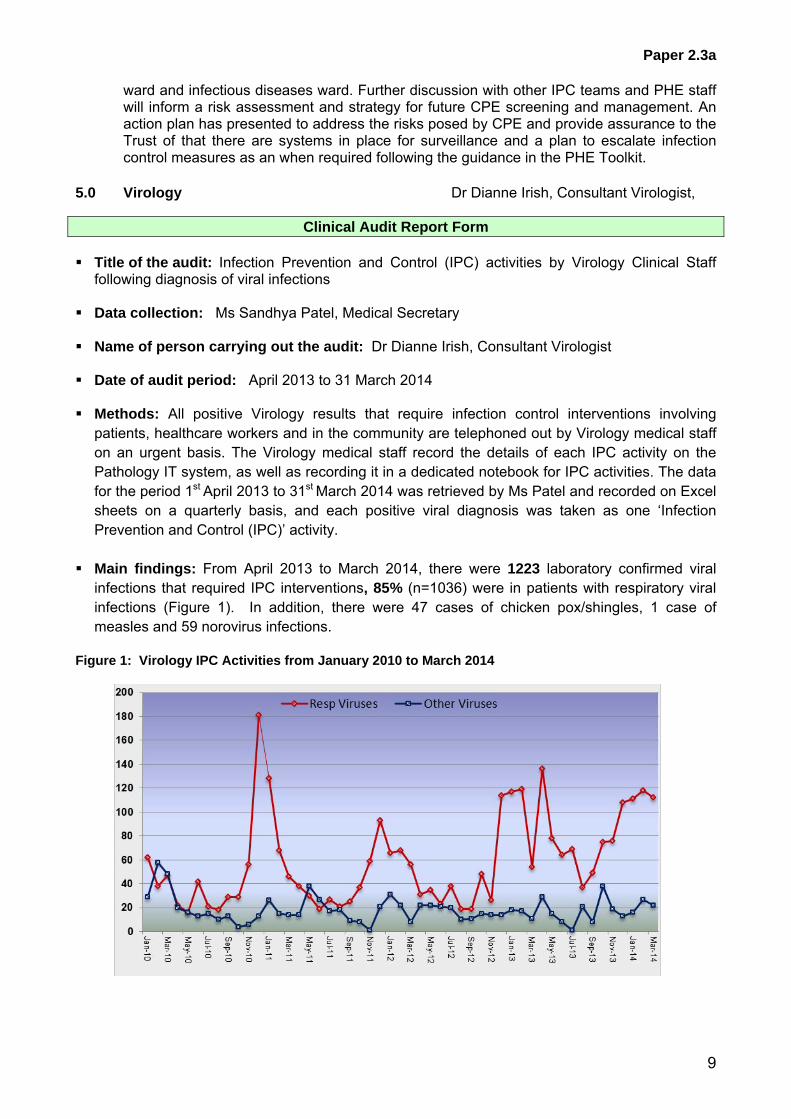
5.0 Virology Dr Dianne Irish, Consultant Virologist,
Clinical Audit Report Form
Title of the audit: Infection Prevention and Control (IPC) activities by Virology Clinical Staff following diagnosis of viral infections
Data collection: Ms Sandhya Patel, Medical Secretary Name of person carrying out the audit: Dr Dianne Irish, Consultant Virologist Date of audit period: April 2013 to 31 March 2014 Methods: All positive Virology results that require infection control interventions involving
patients, healthcare workers and in the community are telephoned out by Virology medical staff on an urgent basis. The Virology medical staff record the details of each IPC activity on the Pathology IT system, as well as recording it in a dedicated notebook for IPC activities. The data for the period 1st April 2013 to 31st March 2014 was retrieved by Ms Patel and recorded on Excel sheets on a quarterly basis, and each positive viral diagnosis was taken as one ‘Infection Prevention and Control (IPC)’ activity.
Main findings: From April 2013 to March 2014, there were 1223 laboratory confirmed viral
infections that required IPC interventions, 85% (n=1036) were in patients with respiratory viral infections (Figure 1). In addition, there were 47 cases of chicken pox/shingles, 1 case of measles and 59 norovirus infections.
Figure 1: Virology IPC Activities from January 2010 to March 2014

Paper 2.3a
10
Common respiratory viruses (Figures 2 & 3): From April 2013 to March 2014, there were 154 influenza infections - with 120 cases of influenza A and 34 cases of influenza B, compared with the previous year (2012/13) when there were 173 influenza cases. Between April and December 2013, there were 28 cases of influenza A and 28 cases of influenza B, with the majority of the cases (mainly influenza A ) between January and March of this year. A similar trend was observed last year as well - the majority of influenza A cases were in the last quarter (January to March). Rhinovirus infections predominated over the year 2013/14 with 356 infections recorded. There were 89 RSV, 45 metapneumovirus, 83 adenovirus, 95 parainfluenza, 114 coronavirus and 100 enterovirus infections detected. Figure 2: Common Respiratory Viruses from April 2009 to March 2014
Norovirus activity There were 59 cases of norovirus over the 12 month period. The majority of patients were already isolated by the time the laboratory had the positive results and phoned the relevant clinical teams. There were 2 small outbreaks involving staff as well as patients in the last quarter (January to March) of this year, and both outbreaks resolved within a week of onset. Figure 3: Number of Norovirus PCR Positive Stool Samples from April 2010 to March 2014

Paper 2.3a
11
Measles and Varicella zoster virus infections
There was 1 confirmed case of measles recorded this year and 47 chickenpox or shingles cases. Significant input from the Infection Control and Prevention team was required. The Rash Algorithm devised by IPCT and adopted by A&E staff, combined with the dedication and tremendous effort of the A&E staff in managing rash illness in a busy London A&E department, resulted in significantly fewer infection control incidents due to early identification and prompt isolation compared with the previous year.
Action Points:
To continue with the current protocol of active and timely participation and intervention by the Virology medical staff in Infection Control and Prevention activities.
Date of repeat audit: April 2015 Signature: 6.0 Surgical site infection surveillance One three-month module of orthopaedic surgical site infection surveillance per year is required under the mandatory surveillance scheme. The RFH has continued to perform continuous surveillance of hip and knee replacements and hip hemi-arthroplasty. Regular meetings have been incorporated within the orthopaedic specialty group audit programme to feedback and discuss results of surveillance. The most recently compiled results from the HPA are presented in table 1.
RFH (% infected). Last 4 quarters published data.
All hospitals (% infected) Avg for last 5 years
Total hip replacement 0.6 1.2 Knee Replacement 0.8 1.7 Hip hemiarthroplasty 0.0 3.8
In addition, over the period of the report, the IPCT have performed surveillance of hepatectomy, pancreatectomy and cholecystectomy infections and liver transplants, with results fed back to directorates. Cholecystectomies

Paper 2.3a
12
The service has high rates of surgical site infection against national average since submission to HPA surveillance system began in Jan 2011. This has been raised with team previously, where complex case-mix was felt to be major explanation. This was raised with Directorate June 2012, with an investigation commenced Aug 2012, followed by an audit of cases Sept 2012. Main findings of the look-back: Nearly all cases were tertiary referrals and the majority had cancer. In addition, most had a cholecystectomy as part of a much bigger operation (e.g. Whipples procedure) The infections were associated with organisms resistant to current prophylaxis (co-amoxiclav). Discussion with HPA surveillance team identified that most hospitals submitting data were DGHs. None of the other five specialist HPB centres submit data. Conclusions: The national surveillance system is not comparing like with like: RFH cases are at much higher risk of infection on the basis of the procedure performed, background morbidity and prior exposure to hospitals and antibiotic resistant organisms. Routine cholecystectomy prophylaxis is not suitable in these patients as prior antibiotic use and multiple hospital stays put them at risk of resistant organisms. As a result, antibiotic prophylaxis was changed to Teic/Gent/metronidazole in January 2013. Impact on infection rates:
The table shows the break down of infections to Dec 2012. In Jan-Mar 2013 2/24 (8.3%)patients had infections. The drop from 20%-13% after June 2012 could be the Hawthorne effect. The further decrease to 8.3% in the first quarter of this year is likely to be the impact antibiotic prophylaxis switch although hasn’t been audited to prove. 7.0 Outbreaks and incidents
Paper 2.3a
13
7.1 Outbreaks January: 10 East ward closed for six days with Norovirus confirmed in four patients and affecting six staff. February:11 West closed for six days with Norovirus confirmed in three patients and affecting ten staff. Six cases of post-procedure endophthalmitis were identified in patients who had had day case surgery or clinic procedures at Barnet, Edgware and RFH between 6th February to 11th March 2014. No clear source has been found but Ophthalmology surgery has been stopped at the Barnet site. A full investigation and root cause analysis is under way, including visual observation of theatre practice and a full decontamination of equipment review. No new cases since 11th March. There has also been an outbreak of MDR Acinetobacter on 7 West and 7 North, involving 13 patients. The Health Protection Unit and Public Health England were informed and collaborated in the measures to eradicate it. 7 West was closed in August/September. Full IPC measures were put in place for improvement. The last case was 11th September. Learning from this outbreak identified a speedy response with high level cleaning from the start and the deployment of staff to ‘police’ compliance with IPC measures contributed to a quick resolution with fewer cases than in previous outbreaks.
SUI: No SUIs for this report period.
7.2 Follow-up of deaths related to MRSA and CDI. A formal process for the review of cases where MRSA or CDI has been included as a cause of death has been established. This process involves the trust’s risk management system and links to the root cause analysis process. There were no deaths with primary cause of MRSA or CDI on part 1a or part 1b of the death certificate in 2013/14. 8.0 Education Members of the IPCT continue to provide mandatory infection prevention and control training for induction and annual updates for all staff. In addition ad hoc training is performed in clinical areas depending on local needs. A bespoke professional IPC portfolio is now in place for clinical and non-clinical staff 8.1 Practice educators The IPC practice educator continuing ward based teaching and skill competence assessments as part of their daily role. 8.2 Foundation Year (FY) doctors An infection control audit, related to the ‘Saving Lives’ high impact interventions is included again in the FY audit programme. Selected audits were presented to the infection prevention and control committee. This appears to be a popular and useful method of engaging trainee doctors in infection control as it was last year. 9.0 Audit and Surveillance The list of surveillance and clinical audit topics is included as appendix 2. This formed the basis of the surveillance and audit programme for 2013/14. All new versions of infection prevention and control policies include a monitoring tool.

Paper 2.3a
14
10.0 Infection prevention and control policies The following policies were updated, reviewed and ratified by the Infection Prevention and Control Committee.
- Blood and body fluid exposure incidents - Acinetobacter - MRSA - Clostridium difficile management policy - Linen and laundry policy - Notification of infectious diseases - Severe Acute Respiratory Infection (SARI) Plan
11.0 Health and Work NW Blood and Body Fluid Exposure Incidents Reported to the Health and Work Centre 1st April 2013- 31st March 2014 Over the period April 2013 – March 2014 there have been 207 blood and body fluid exposures reported to the HaWC compared to 210 exposures reported in 2012/13. Percutaneous injuries account for 76.4% of the total number of incidents within the 37 locations listed. No unusual trends have been identified through this period with respect to location. The sum total of all wards, which are grouped together for reporting purposes, accounted for the highest proportion of incidents: 62; with the second location of all theatres accounting for 48 of the 207 incidents. The third highest total of 14 incidents occurred in A&E. Doctors remain the highest proportion of staff sustaining 84 blood and body fluid exposures; however nurses were involved in 81 of the incidents. Of all cases reported, 21 cases which required Post Exposure Prophylaxis over that period. 9 commenced in ICDC 9 commenced in Accident and Emergency out of hours 3 commenced in the Health and Work Centre There have been changes to the service providing blood and body fluid exposure management within the HaWC. An interim arrangement has been in place from January 2012 until December 2013 whereby the HIV Services team supported access to HIV PEP in the absence of medical staffing within the Health and Work Centre. From December 2013 the Occupational Health Advisors have commenced the dispensing of HIV PEP following an amended BBFE policy – and training delivered by HIV Consultant Sanjay Bhagani. Further revision of the BBFE policy is currently in progress and will be subject to ratification at Clinical Audit and Effectiveness Committee and Operational Safety Committee. Data Reporting/Classification Upon review of the annual data, those incidents classified as ‘accidental’ are perhaps more easily attributed to a clearly defined cause; for example, in the following case that was classified as accidental, this may have been due to not disposing of the instrument at the point of use – “The razor used on the patient was left in his washing bowl. As I tried to take the towel out of the bowel, the blade cut my left ring finger”. The Health and Work Centre will review the classification of ‘accidental incidents’ within the OH reporting system and ensure a clear history is recorded to ensure more meaningful reporting and specific follow up actions. EU Directive Update Following the enforcement of the EU Sharps Directive in 11th May 2013 the HaWC have made a series of changes to ensure that the provisions of the Directive have been implemented into practice.
Paper 2.3a
15
The Directive legislates a framework agreement on the prevention of sharps injuries in hospitals and the healthcare sector by the Social Partners – the European Hospital and Healthcare Employers’ Association and the European Federation of Public Service Unions. Where the results of the risk assessment reveal a risk of exposure, this must be controlled by: - Preventing the exposure where possible - The design and use of appropriate work processes, systems and engineering controls and the
provision and use of suitable work equipment and materials, e.g. providing safer sharps devices and the wearing of PPE
- Elimination - eliminating the unnecessary use of sharps by implementing changes in practice and on the basis of the results of the risk assessment, safe Procedures - specifying and implementing safe procedures for using and disposing of sharp medical instruments and contaminated waste, a combination of training, safer working practices and the use of safer sharp products can prevent the majority of sharps injuries.
The HaWC is working in partnership with SharpSmart – for safer sharps disposal and plan to carry out joint training/education sessions following ratification of the BBFE policy. Control of Risk and Exposure The largest proportion of equipment involved was stated as ‘unknown’; 43. (‘Other’ also accounted for 38 of the incidents). There is the potential that this is as a result of the distress experienced at the time of injury/exposure and the inability to recall this detail when questioned under pressure. This lacking information results in difficulty in comprehensively risk assessing the incident however should not limit the action taken following an exposure. The second largest proportion of equipment involved was the injection needles used; 42. 4 incidents were considered to be of ergonomic origin thus unlikely to be the nature of the device and difficulty in manipulating. The Health and Work Centre will ensure a clear history is recorded to ensure more meaningful reporting in line with the control of risk and exposure. An inventory of equipment used in the process of blood and body fluid handling including sharp collection devices has taken place across the Trusts and to safety engineered devices have been introduced where possible. This is not a finite list and is subject to change at any time. Training and Education Upon review of the information provided to the OH practitioners during risk assessment, it is clear that there are a series of human factors that demonstrate cause for concern in presenting readily preventable issues: - Not taking the sharps bin to the point of use accounts for 24 of the incidents - Re-sheathing accounts for 10 of the incidents - Not wearing available PPE accounts for 11 of the incidents - 26 incidents were described as accidental “During a procedure a surgeon accidentally stabbed
my left index finger”. Health and Work Centre are reviewing the visual reminders currently provided to clinical areas and ensure the key messages of safe working practices are contained and delivered. Recent contact received from a series of medics from FY1 – CT1 requesting to assist in the writing of a BFE policy due to limited knowledge on post exposure follow up and care, has highlighted further need for the revised policy once ratified, to have greater visibility amongst all of our colleagues with the addition of training to embed the required post BFE care. There will be a

Paper 2.3a
16
further focus on training, education / re-education and assessment requiring an element of competency training Information and advice about blood and body fluid exposure is provided to staff through induction and clinical / non clinical mandatory training but there are still episodes of self-assessment in relation to risk. Medical colleagues remain the highest proportion of staff sustaining blood and body fluid exposure. In the Annual report of 2012, it was reported that HaWC had been removed from the Mandatory Training programme and in doing so was not meeting the statutory requirements of providing information to staff about safe use of sharps and what to do in the event of an occupational blood and body fluid exposure. This was rectified and the HaWC returned to providing a presentation to the Mandatory Training programme with effect from 1st March 2012. Due to changes in the Induction programme and a move to online training, the HaWC element of the presentation is now delivered by HR colleagues. An occupational health presence is not maintained at the Doctors Induction and this is subject to further discussion. Proactive Recording and Action Planning In December 2012 the HAWC designed a visual BFE Dashboard to highlight those areas experiencing BFE’s and the follow up action required. The Health and Work Centre continue to implement the Dashboard and use as a framework for demonstrating the need for action to RFH healthcare employees. The Dashboard triggers targeted actions based on the number of incidents occurred: 4 incidents and above [in total] = A red flag. As green flag with the addition of - 4 hour compliance audit of sharps/BFE working practices by OH staff in the clinical area. Feedback to be provided to all staff/clinicians and Matrons on improvements. 2 - 3 incidents [in total] = A yellow flag. As green flag with the addition of - Visit from OH staff to the ward/department to meet with manager and discuss the specific issues highlighted at the time of exposure and if possible/appropriate create an action plan to work to, going forward. OH staff to attend ward meeting for 10 minutes to feedback and highlight concern and remind of improved sharps/body fluid practices. 1 incident = A green flag. Specific and focussed advice in relation to the exposure provided at the time of clinic visit to the recipient. Follow up email to be sent to manager to inform of this advice to ensure later ward follow up and reiteration. Increase in visual reminders in the ward staff area and clinical area to promote safe sharps handling technique. HAWC staff to ensure an incident form is received by the Risk and Safety team. MMR Update Following an NHS England alert in April 2013 to ensure staff were MMR immune, high risk areas (Obs and gynae, Paediatrics, A&E, Renal, 11 West, Oncology, ICDC and ITU) were targeted for an immunisation update from 15th May 2013 with a plan to roll out to the rest of the Trust from mid-July 2013. All staff records within those high risk areas were reviewed and 367 with no record of immunity were contacted on two separate occasions by email or post to attend for an appointment. Additional OH clinics were made available and extra OH staff member was employed for 6 months to cover this. ‐ The OH team visited the ward areas and offered the Ward Sister the option of an OH update on
the ward – serology and/or vaccination, similar to the flu campaign approach. ‐ Increased communications input on freenet and in ward areas and on infection control and
health and work centre home pages to promote the initiative. ‐ Announcement at the sisters and charge nurse conference 11.09.13 ‐ Divisional Nurse Directors Maura McElligott and Rebecca Longmate kindly fed-back to Matrons
in an attempt to increase attendance

Paper 2.3a
17
Daily clinics reduced to weekly from 02.10.13 due to dwindling numbers. Clinics ceased 27.11.13 with 66 members of staff attending. Some vulnerable patients, particularly immunosuppressed individuals and very young children, who are at highest risk of serious complications from measles, cannot receive the MMR vaccine. Therefore, their protection is dependent on avoiding exposure to the virus. Protection of healthcare workers, particularly those in contact with vulnerable patients, remains an essential part of infection control and such an initiative is dependent upon our staff active engagement. This was raised for discussion at the Operational Safety Committee on 25th April 2014 and consideration is being given to addition to the Trust Risk Register. Influenza The final ImmForm submission for 2013/14 was 50.2%, compared to 2012/13 of 51.2%. The proposed target was 65% INFLUENZA 2013 / 2014
CUMMULATIVE - Monday 7th October 2013 to Thursday 6th February 2014
Staff Group Number Given
Total in staff group % of staff group
Qualified nurses and midwives 592 1549 38%
Doctors 373 858 43%
AHP's 416 833 50%
Ancillary/Support 364 971 37%
A&C 367 1081 34%
TOTAL 2112 5292 40%
Divison Number Given
Number of staff in division
No vaccinated as % of total
Urgent Care 595 1552 38%
Transplant and Specialist Services (TASS)
649 1643 40%
Surgery and Associated Specialties (SAS)
417 1124 37%
Corporate 451 973 46%
TOTAL 2112 5292 40%
FOR IMM FORM - DoH REPORTING
Staff Group Number Given
Total in staff group % of staff group
Qualifed nurses and midwives 592 1549 38%
Doctors 373 858 43%
AHP's 416 833 50%
Ancillary/Support/A&C 731 971 75%
TOTAL 2112 4211 50%
Consultant Microbiologist Dr Susan Hopkins has proposed working with Public Health and OH for development of a signed mandatory section to be included on all influenza vaccination forms for all staff to consider when opting not to receive a vaccine. This is aimed at ensuring staff fully consider their reasons for opting out and will provide further opportunity for occupational health to capitalise on this education opportunity in challenging common vaccination myths.
Paper 2.3a
18
An audit proposal has been submitted by Dr Dianne Irish, Nicola Jane Whiteley and Anne Ormiston to determine influenza vaccination uptake rate in doctors and nurses in three high risk specialty areas (Intensive Care Unit. Maternity and A&E) of Royal Free London NHS Foundation Trust during influenza season 2013/14. A flu protocol was also devised for the management of flu like illness in Healthcare workers (HCWs) at RFH to streamline the response to a HCW developing flu like symptoms and importantly to ensure minimal impact/transmission risk to our provision of care to the public. 12.0 Cleaning services S Connolly, M Harris. Cleaning services are managed by the in-house facilities team. The patient environment managers jointly monitor performance alongside senior clinical ward staff using the Maximiser system, which is programmed to meet the NHS National Standard of Cleanliness audits. Records are published on the Trust Freenet and are updated monthly. The patient environment managers meet regularly with the domestic services manager, matrons and ward staff to discuss, resolve and when necessary formally escalate any area that didn’t meet the required NHS audit standard. These then are reported to the PLACE Partnership Group on a monthly basis. Annual audits for PLACE are completed by self-assessment in conjunction with teams comprising of predominately patient representatives, patient governors, (whom now make up more than 50% of the auditing teams) infection control and other staff members. The audits are carried out to NHS and the health and social care information centre (HSCIC) guidelines; The PLACE score achieved for 2013 is as follows Cleanliness 97.31% Food 87.34% Privacy, Dignity and Wellbeing 93.26% Condition, Appearance and Maintenance 89.33% The PLACE audit for 2014 was completed over three days this year which incorporated all of our meal services on site breakfast, lunch and supper. The scores were submitted by 10th June 2014 and will be released publicly by the end of August 2014. The domestic services were successful with a business case to invest in new and more time efficient hydrogen peroxide vapour (HPV) machines which came on site early 2014. The particular machines have proved to be much more effective in the turnaround of rooms due to the process time being reduced by 50% with the same strength as the original HPV machines used on site.
Paper 2.3a
19
13.0 Antibiotic stewardship I Balakrishnan/ M Lanzman Antibiotic Policy Antibiotic policies across the Trust were revised last year. In light of recent evidence that temocillin/amoxicillin combination therapy is associated with a lower risk of C. difficile infection than piperacillin/tazobactam (with no loss of clinical efficacy), the empiric treatment of healthcare associated pneumonia has been switched from the latter to the former. This should also relieve the selection pressure on piperacillin/tazobactam in both Enterobacteriaceae as well as Pseudomonas aeruginosa. The recommended duration of therapy was reduced last year from 7 days to 5-7 days in an effort to reduce the duration of antibiotic therapy, which has been shown to be associated with risk of C. difficile infection. Whereas the Trust used to operate separate antibiotic policies for HSEP and non-HSEP patients, one policy that covers all age groups was introduced last year. This change was made so that the HSEP Policy, which used antibiotics which carried a lower risk of C. difficile infection, could be applied more broadly across the Trust. It also reduced the risk of confusion between two policies. On 1st February 2013, the American Society for Health-System Pharmacists published Clinical Practice Guidelines for Antimicrobial Prophylaxis in Surgery. These Guidelines have been endorsed by our Drugs and Therapeutics Committee. The Trust’s surgical prophylaxis policy has been reviewed in light of these guidelines. Co-amoxiclav has largely been replaced by a combination of teicoplanin, gentamicin and metronidazole. This change was largely brought about by rising resistance rates to co-amoxiclav. Other advantages of the new regimen include the longer half-life of teicoplanin and gentamicin, eliminating the need for intra-operative (and usually post-operative) dosing. The importance of stopping antibiotic prophylaxis after surgery has been emphasised across the Surgical Specialties – this is very important if we are to reduce our C. difficile rates. However, we continue to face resistance from some surgical specialties, notably the Department of Plastic and Reconstructive Surgery, in moving away from traditional practice to routinely continue antibiotics for several days post-operatively. Support from relevant Divisional and Medical Directors may go some way towards amelioration in this area. Although the Surgical Prophylaxis Policy review is still ongoing some Units, notably HPB, Vascular Surgery and Colorectal Surgery, have already adopted the new Policy successfully. A significant barrier in implementing the revised Surgical Prophylaxis Policy is cost. It is estimated that the difference in costs between the two policies is an increase of around £25 000. These various interventions have seen a significant reduction in our C. difficile rates. In the first 2 months of this financial year we had 3 cases, against an annual target of 38. Prescription Chart The prescription chart is being reformatted to include a dedicated section for antibiotics, which will help encourage the Start Smart Then Focus principles and reduce inappropriate antibiotic use. A pilot of the antibiotic prescribing section will be conducted in a small part of the Trust initially before rolling it out Trust-wide. Antibiotic App The Microguide App replaced the Pocket Prescribing Aid on 1st Feb 2014 and feedback has been excellent. The App contains a section dedicated to RNOH.

Paper 2.3a
20
Additional Antimicrobial Pharmacist A full time post commenced on 6th January 2014 as part of a Band 7 rotational post. She has been an invaluable asset in leading antibiotic ward rounds, re-designing the prescription chart and antibiotic stickers and gathering audit data. Antibiotic Ward Rounds These ward rounds continue to be highly productive both as regards rationalising antibiotic use as well as educating medical, nursing and pharmacy staff. They have recently been extended to cover the HSEP and stroke units, although pharmacy support in the Stroke Unit is lacking. Ward rounds on MAU have been re-initiated - these now take place twice weekly and are making a positive impact on patient care. Education Education sessions on the rational use of antibiotics, emphasising the “Start Smart Then Focus” message, are ongoing in several specialties and Pharmacy. The SSEC also arrange teaching sessions for Junior Doctors. Antibiotic stewardship has recently been allocated a regular slot in FY1 training afternoons – feedback from trainees was very good. Antibiotic Audits Two independent reviews recommended that antibiotic audits should be performed by clinical teams, not Microbiology/Pharmacy. This self-audit system has been disseminated across many wards and the results are encouraging. Carbapenem resistance The chart below shows data from Public Health England illustrating the rising prevalence of carbapenem resistance:
It is therefore paramount that these antibiotics, which are often the last bastion in antimicrobial therapy, are only used when absolutely necessary. Rapid carbapenem resistance detection systems have been and are being refined so that the mechanism of resistance can be rapidly identified and appropriate infection control interventions instituted. ITU Microbiology conduct ward rounds on ITU daily. Meetings have been held with the ITU Consultants and pharmacists in order to improve compliance with the antimicrobial decisions reached at the ward round, with particular regard to reducing the duration of antimicrobial therapy. It has been emphasised that, in keeping with international, national and Trust guidance, surgical antibiotic
Paper 2.3a
21
prophylaxis should not be routinely continued post-operatively without an appropriate indication. In addition, all antibiotic use, especially carbapenem use, must be rationalised. The Start Smart Then Focus principles have been reinforced. Teicoplanin The SPC for teicoplanin changed in November 2013 such that the dose be weight adapted for patients with higher weights. This, together with the BNF recommended unit dose of 6 mg/kg for patients >70kg, was put to the Drugs and Therapeutics Committee earlier this year. On the basis that in vivo data were lacking, the Committee decision was not to change the dosage currently recommended by Trust Policy (unit dose 400 mg regardless of weight). 15.0 Service validation The trust has declared compliance to the Care Quality Commission in relation to IPC aspects of the Health and Social Care Act (2008) Hygiene Code. The CQC has agreed unconditional compliance. PWC undertook the internal audit of the trusts infection prevention and control service and the report and recommendations are awaited.
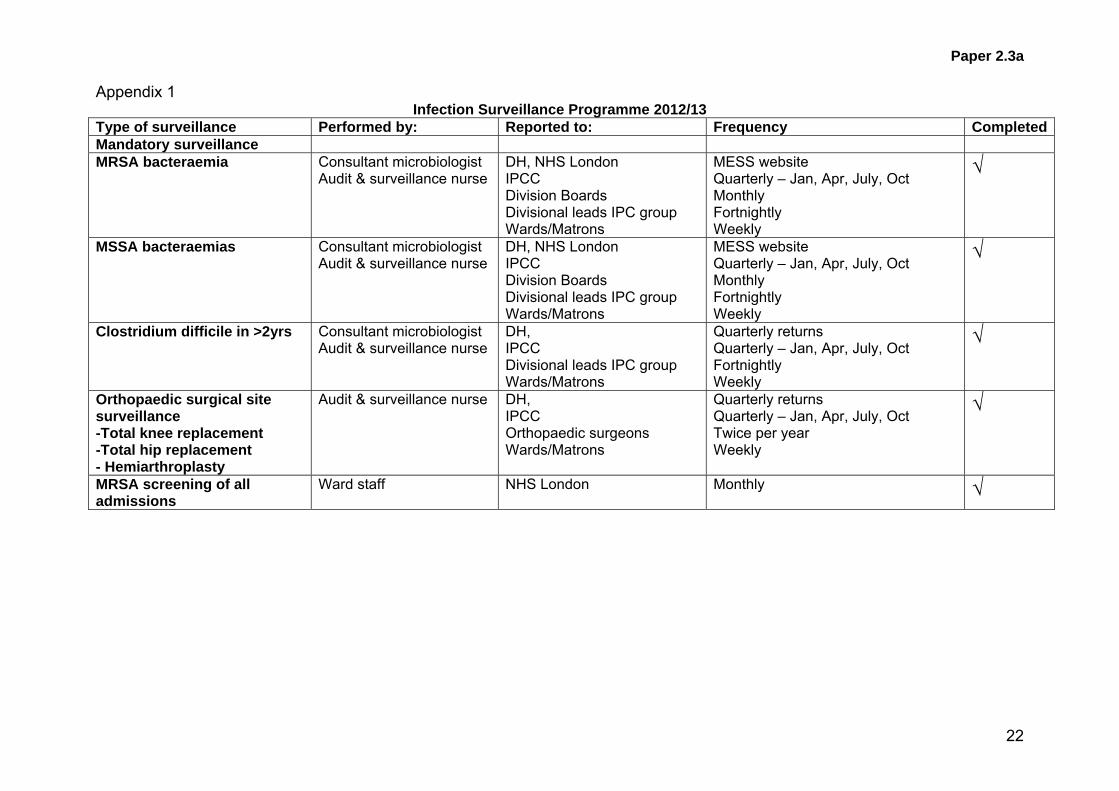
Paper 2.3a
22
Appendix 1 Infection Surveillance Programme 2012/13
Type of surveillance Performed by: Reported to: Frequency Completed Mandatory surveillance MRSA bacteraemia Consultant microbiologist
Audit & surveillance nurse DH, NHS London IPCC Division Boards Divisional leads IPC group Wards/Matrons
MESS website Quarterly – Jan, Apr, July, Oct Monthly Fortnightly Weekly
√
MSSA bacteraemias
Consultant microbiologist Audit & surveillance nurse
DH, NHS London IPCC Division Boards Divisional leads IPC group Wards/Matrons
MESS website Quarterly – Jan, Apr, July, Oct Monthly Fortnightly Weekly
√
Clostridium difficile in >2yrs
Consultant microbiologist Audit & surveillance nurse
DH, IPCC Divisional leads IPC group Wards/Matrons
Quarterly returns Quarterly – Jan, Apr, July, Oct Fortnightly Weekly
√
Orthopaedic surgical site surveillance -Total knee replacement -Total hip replacement - Hemiarthroplasty
Audit & surveillance nurse
DH, IPCC Orthopaedic surgeons Wards/Matrons
Quarterly returns Quarterly – Jan, Apr, July, Oct Twice per year Weekly
√
MRSA screening of all admissions
Ward staff NHS London Monthly √

Paper 2.3a
23
Alert organism surveillance Completed Alert organism surveillance IPCT
Audit & surveillance nurseIPCC Wards/Matrons
Quarterly – Jan, Apr, July, Oct Weekly
√
MRSA acquisitions – (colonisation MRSA acquisitions – (colonisation and infection)
IPCT Audit & surveillance nurse
Wards/Matrons IPCN’s for SPI Divisional leads IPC group
Weekly Monthly @12th Fortnightly
√
ESBL acquisitions Consultant microbiologist Audit & surveillance nurse
Divisional leads IPC group Wards/Matrons
Fortnightly Weekly
√
Surgical site surveillance Completed Orthopaedic surgical site surveillance -Total knee replacement -Total hip replacement - Hemiarthroplasty
Audit & surveillance nurse
Orthopaedic specialty group IPCC Orthopaedic surgeons Wards/Matrons
Quarterly – Jan, Apr, July, Oct Quarterly – Jan, Apr, July, Oct Twice per year Weekly
√
Hepatobiliary - Pancreatectomy - Hepatectomy - Cholecystectomy - Liver transplant
Audit & surveillance nurse
Hepatobiliary specialty group IPCC Wards/Matrons
Monthly Quarterly – Jan, Apr, July, Oct Weekly
√
SSI liver transplants
Audit & surveillance nurse
IPCC IPCN’s for SPI Hep, neph and trans group Wards/Matrons
Quarterly – Jan, Apr, July, Oct Monthly @12th Monthly Weekly
√
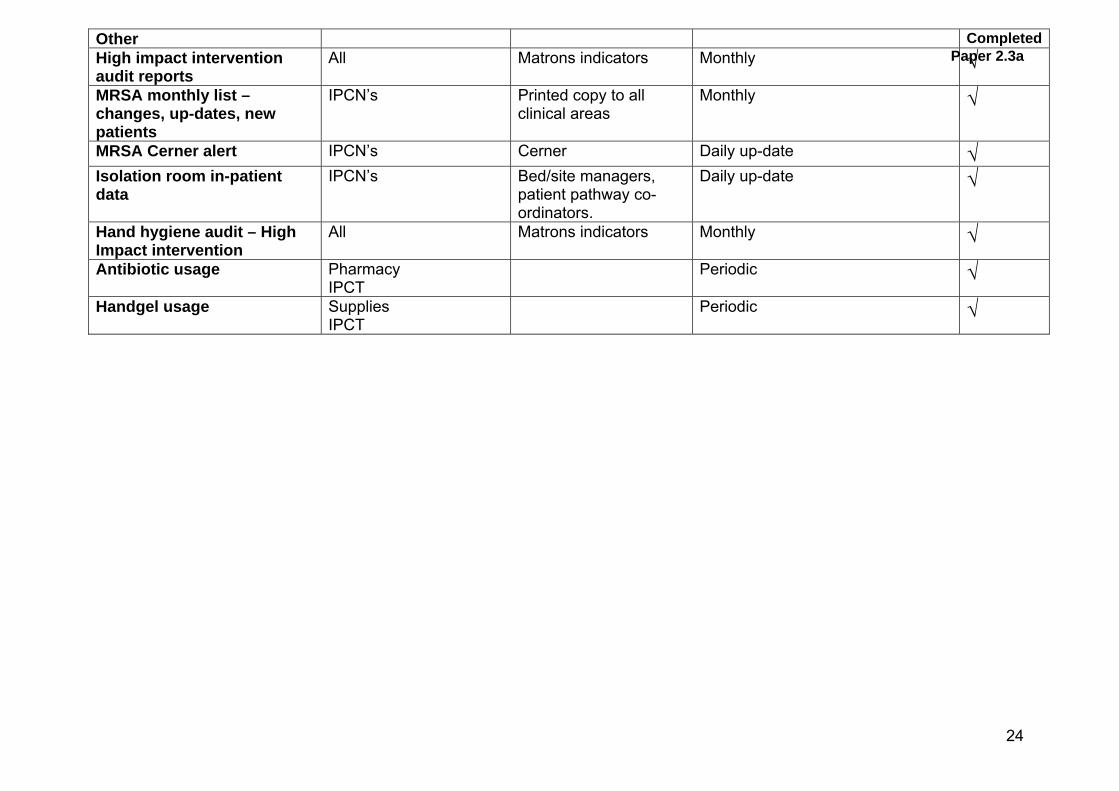
Paper 2.3a
24
Other Completed High impact intervention audit reports
All Matrons indicators
Monthly √
MRSA monthly list – changes, up-dates, new patients
IPCN’s Printed copy to all clinical areas
Monthly √
MRSA Cerner alert IPCN’s Cerner Daily up-date √ Isolation room in-patient data
IPCN’s Bed/site managers, patient pathway co-ordinators.
Daily up-date
√
Hand hygiene audit – High Impact intervention
All Matrons indicators
Monthly √
Antibiotic usage Pharmacy IPCT
Periodic √
Handgel usage Supplies IPCT
Periodic √

DIPC report – trust board July 2014 1
Equality impact assessment Positive impact which supports equity of service
Report to
Date of meeting Attachment number
Trust Board
30 July 2014 Paper 2.3b
DIRECTOR OF INFECTION PREVENTION AND CONTROL (DIPC) QUARTERLY REPORT
Executive summary This is the trust report from the DIPC. In line with the revised Health and Social Care Act (2008) trusts are required to have appropriate management and clinical governance systems in place to deliver effective infection control. Included at appendix A are the ten compliance criteria from the Health and Social Care Act to assist the board in assessing the information provided. One of the key actions is a requirement that matrons and clinical directors report directly to the trust board on pertinent issues relating to cleanliness and infection control. The trust has declared compliance with the Hygiene Code and is unconditionally registered with the CQC. Compliance is reviewed and discussed at the Risk, Governance and Regulation Committee. The report reviews IPC priorities to meet NHSLA requirements and meet the requirements of the Statement on Internal Control. A summary of the IPC integration plan with Barnet and Chase Farm is included, aligned to the Health and Social Care Act (2008) for assurance of continued compliance.
Action required / recommendation The Board is asked to confirm that the report provides sufficient information to provide assurance of sustained compliance with the Hygiene Code.
Trust strategic priorities and business planning objectives supported by this paper
Board assurance risk number(s)
1 Improving clinical effectiveness R1 2 Enhancing the patient experience
CQC outcomes supported by this paper Outcome 8 Cleanliness and infection control
Risks attached to this project / initiative and how these will be managed (assurance) The revised Hygiene Code Risk matrix will be monitored at the Infection Control Committee. The risks associated with the Hygiene Code have been included in the Board Assurance Framework
Paper 2.3b
DIPC report – trust board July 2014 2
Report From D Sanders, Director of Nursing and DIPC. Author(s) R Smith, D Mack, Microbiology Consultant, IPC Doctor
Y Carter, Service Lead IPC IPC team
Date July 2014
Paper 2.3b

DIPC report – trust board July 2014 3
Introduction The Health and Social Care Act (2008) Code of Practice on the prevention and control of infections and related guidance outlines the actions NHS Trusts in England must take to ensure a clean environment for the care of patients, in which the risk of infection is kept as low as possible. The 10 compliance criteria are attached at appendix A. Monitoring Progress against the Health and Social Care Act, including internal audit. Hygiene Code compliance will continue to be monitored through the Infection Prevention and Control Committee. The Trust’s internal auditors annually assess trust arrangements and ensure robust evidence of compliance in all criteria, lately undertaken April 2014. Meticillin-sensitive and Meticillin-resistant staphylococcus aureus bacteraemia (MRSA and MSSA) Reduction of hospital acquired Staphylococcus aureus bacteraemias including those due to MRSA continue to be an important infection control priority for the trust. The trust has reduced its MRSA bacteraemias from nearly 100 cases annually when DH targets were first set in 2004 to one for the year 2012/13 and zero for 2013/14. The reduction target for 2013/14 is zero for all organizations. Mandatory reporting of MSSA bacteraemias and E.coli bacteraemias is now in force, although there are currently no targets for reduction in place.
The graphs below show the maintenance of low rates of both MRSA and MSSA bacteraemias. Root cause analysis (RCA) is undertaken for all MRSA bacteraemias. A breakdown by Division and the apparent source of the infection is reported at the fortnightly Divisional Leads IPC meeting and will be presented in future DIPC reports for information and to guide future reduction activity.
There have been no attributable MRSA bacteraemias assigned to the RF trust since September 2012 up to June 2014. All measures remain in place to improve recording of line care and related procedures in theatres and training/re-training staff at ward level in skills around CVC care. These measures will be integral to the expanded trust IPC programme. Future reports will include breakdown of data from RFH, BH and CFH sites.
Paper 2.3b

DIPC report – trust board July 2014 4
Attibutable MRSA bacteraemias by division MSSA bacteraemias by division
Division Q1 Q2 Q3 Q4 YTD
TASS 0 0 0 0 0
SAS 0 0 0 0 0
UC 0 0 0 0 0
Total 0 0 0 0 0
MRSA trust acquisitions. The number of MRSA acquisitions remains low (an acquisition is defined as any patient not previously known to be MRSA positive but has been swabbed whilst in the RFH after the first 48 hours of admission and found to be positive). Screening rates are 98% for elective admissions and 89% for non-elective admissions.
Clostridium difficile The RFLNHSFT has robust infection control measures in place to minimise the risk of C. difficile; including comprehensive antibiotic policies, good bed management with early isolation of symptomatic patients and enhanced environmental cleaning. The microbiology, IPC and pharmacy teams continue to perform weekly Clostridium difficile ward rounds to ensure that all elements of the care and treatment of patients with C. difficile are being appropriately managed.
The trust quality aspiration target is zero avoidable C.difficile cases. The threshold objective for the Royal Free Hospital for 2014/15 is 38 cases attributable to the Trust. Negotiations are taking place with the North Middlesex Hospital to agree a threshold objective for the Trust following the acquisition of Barnet and Chase Farm Hospitals NHS Trust taking into account recent changes in activity across the hospitals.
Division Q1 Q2 Q3 Q4 YTD
TASS 1 0 0 0 1
SAS 2 0 0 0 2
UC 2 0 0 0 2
Total 5 0 0 0 5
Division Q1 Q2 Q3 Q4 YTD
TASS 1 0 0 0 1
SAS 0 0 0 0 0
UC 2 0 0 0 2
Total 3 0 0 0 3
Paper 2.3b
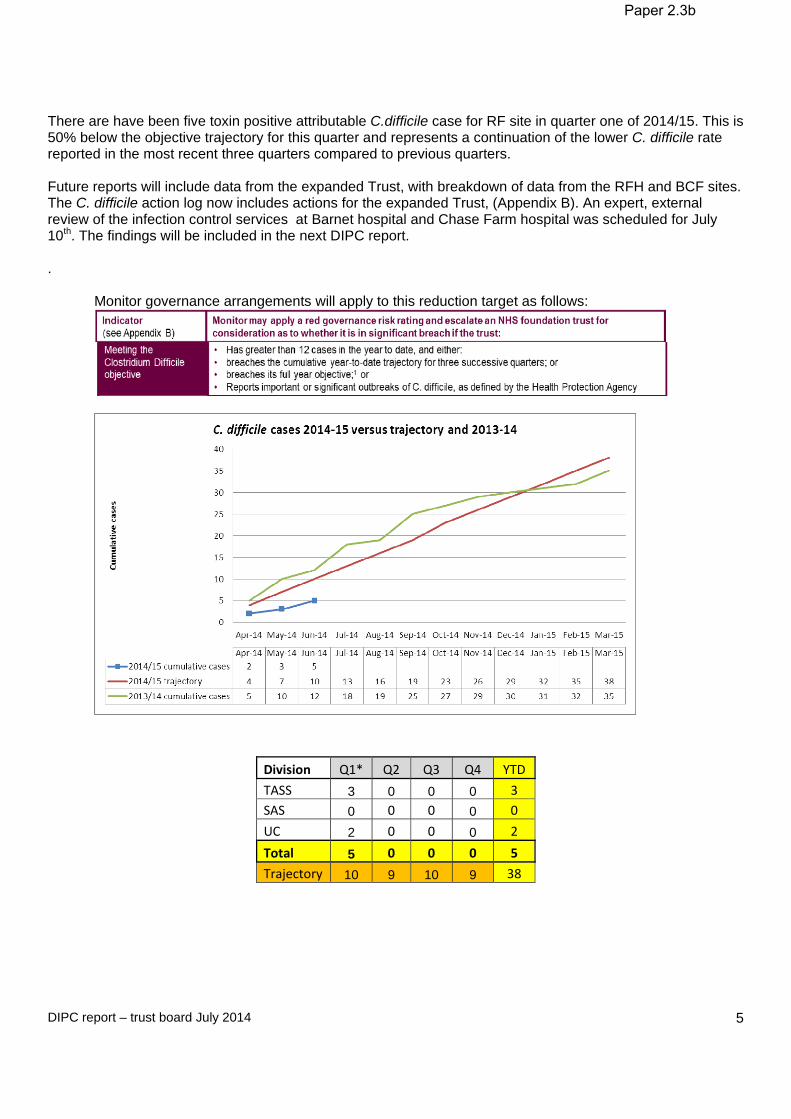
DIPC report – trust board July 2014 5
There are have been five toxin positive attributable C.difficile case for RF site in quarter one of 2014/15. This is 50% below the objective trajectory for this quarter and represents a continuation of the lower C. difficile rate reported in the most recent three quarters compared to previous quarters. Future reports will include data from the expanded Trust, with breakdown of data from the RFH and BCF sites. The C. difficile action log now includes actions for the expanded Trust, (Appendix B). An expert, external review of the infection control services at Barnet hospital and Chase Farm hospital was scheduled for July 10th. The findings will be included in the next DIPC report. .
Monitor governance arrangements will apply to this reduction target as follows:
Division Q1* Q2 Q3 Q4 YTD
TASS 3 0 0 0 3
SAS 0 0 0 0 0
UC 2 0 0 0 2
Total 5 0 0 0 5
Trajectory 10 9 10 9 38
Paper 2.3b

DIPC report – trust board July 2014 6
E.coli bacteraemias. All E.coli bacteraemias are part of the mandatory reporting of health care associated infections (HCAIs), there is currently no improvement objective associated with these infection. A breakdown by Division and the apparent source of the infection is reported at the fortnightly Divisional Leads IPC meeting to guide future reduction activity.
Division Q1 Q2 Q3 Q4 YTD
TASS 8 0 0 0 8
SAS 2 0 0 0 2
UC 2 0 0 0 2
Total 12 0 0 0 12
Carbapenemase producing enterobacteriaceae (CPE) and other non-fermenting (CP-NF) organisms. Cases The RFH has detected 28 cases of CPE and CP-NF from 2008 to date, including 3 CPE cases this last quarter, with one likely transmission event on ITU, and 2 CP-NF cases with one likely transmission event on
Threshold Actual number attributable to the trust 2007/08 Nil 179 2008/09 159 62 2009/10 131 60 2010/11 119 56 2011/12 42 42 2012/13 42 50 2013/14 33 35 2014/15 38 5 to-date.
Paper 2.3b
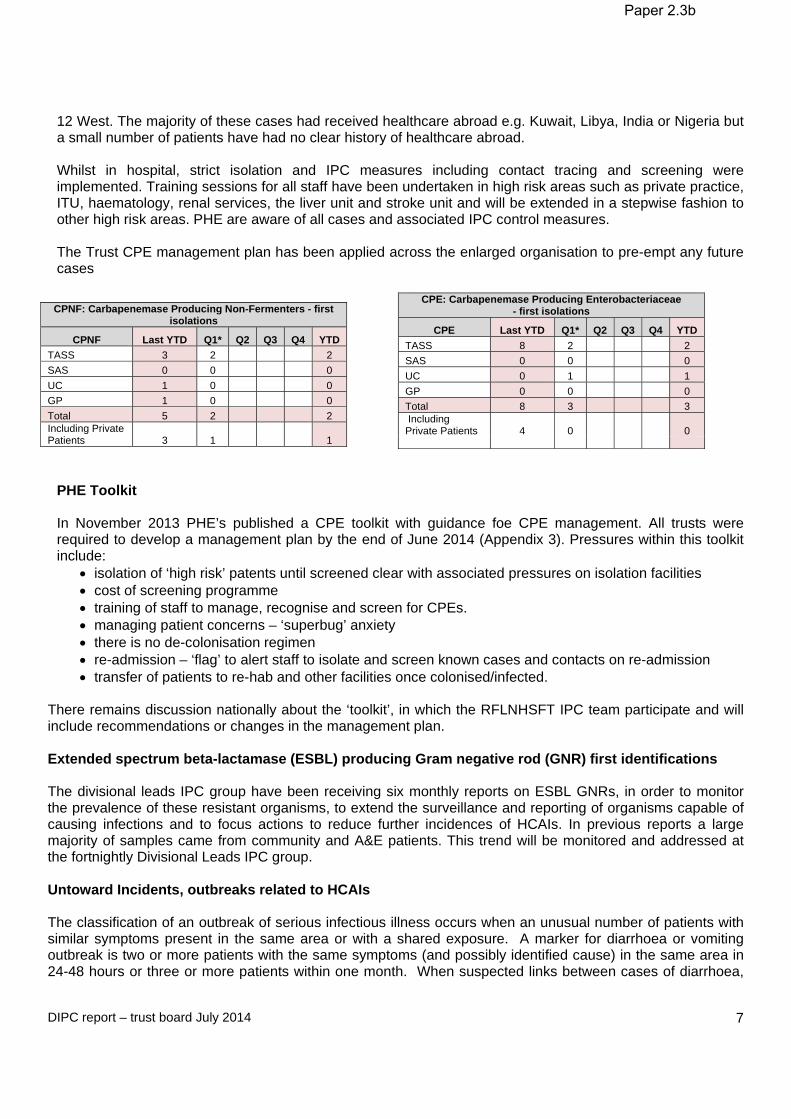
DIPC report – trust board July 2014 7
12 West. The majority of these cases had received healthcare abroad e.g. Kuwait, Libya, India or Nigeria but a small number of patients have had no clear history of healthcare abroad. Whilst in hospital, strict isolation and IPC measures including contact tracing and screening were implemented. Training sessions for all staff have been undertaken in high risk areas such as private practice, ITU, haematology, renal services, the liver unit and stroke unit and will be extended in a stepwise fashion to other high risk areas. PHE are aware of all cases and associated IPC control measures. The Trust CPE management plan has been applied across the enlarged organisation to pre-empt any future cases
CPE: Carbapenemase Producing Enterobacteriaceae - first isolations
CPE Last YTD Q1* Q2 Q3 Q4 YTD
TASS 8 2 2
SAS 0 0 0
UC 0 1 1
GP 0 0 0
Total 8 3 3 Including Private Patients 4 0 0
PHE Toolkit In November 2013 PHE’s published a CPE toolkit with guidance foe CPE management. All trusts were required to develop a management plan by the end of June 2014 (Appendix 3). Pressures within this toolkit include:
isolation of ‘high risk’ patents until screened clear with associated pressures on isolation facilities cost of screening programme training of staff to manage, recognise and screen for CPEs. managing patient concerns – ‘superbug’ anxiety there is no de-colonisation regimen re-admission – ‘flag’ to alert staff to isolate and screen known cases and contacts on re-admission transfer of patients to re-hab and other facilities once colonised/infected.
There remains discussion nationally about the ‘toolkit’, in which the RFLNHSFT IPC team participate and will include recommendations or changes in the management plan.
Extended spectrum beta-lactamase (ESBL) producing Gram negative rod (GNR) first identifications The divisional leads IPC group have been receiving six monthly reports on ESBL GNRs, in order to monitor the prevalence of these resistant organisms, to extend the surveillance and reporting of organisms capable of causing infections and to focus actions to reduce further incidences of HCAIs. In previous reports a large majority of samples came from community and A&E patients. This trend will be monitored and addressed at the fortnightly Divisional Leads IPC group. Untoward Incidents, outbreaks related to HCAIs The classification of an outbreak of serious infectious illness occurs when an unusual number of patients with similar symptoms present in the same area or with a shared exposure. A marker for diarrhoea or vomiting outbreak is two or more patients with the same symptoms (and possibly identified cause) in the same area in 24-48 hours or three or more patients within one month. When suspected links between cases of diarrhoea,
CPNF: Carbapenemase Producing Non-Fermenters - first isolations
CPNF Last YTD Q1* Q2 Q3 Q4 YTD
TASS 3 2 2
SAS 0 0 0
UC 1 0 0
GP 1 0 0
Total 5 2 2 Including Private Patients 3 1 1
Paper 2.3b

DIPC report – trust board July 2014 8
or other organism, are identified in the same area, but outside the strict definition of an outbreak, this is defined as a period of increased incidence (PII) and IPC measures are instituted to prevent an outbreak. During this quarter:
ITU has two cases of VRE identified, commenced weekly VRE screening on ITU.
10 East, in the last quarter, identified 20 cases VRE, 10 east commenced weekly VRE screening and is now changed to weekly admission screen.
10 south special measures for a total of four weeks, this was due to two confirmed cases of C.diff, they
were the same strain confirming cross transmission.
10 North was placed on special measure for a total of four weeks, this was due to four conformed cases of C.diff.
12 west carried out a CPO screen due to two confirmed cases of CPO on the same ward. This was
lasted a total of four weeks.
10 west was placed on special measures since 24/06/14 due to two cases of Cdiff identified within 28 days.
January: 10 East ward closed for six days with Norovirus confirmed in four patients and affecting
SUIs. There is a requirement to investigate all deaths via the serious untoward incident (SUI) process where an HCAI has been recorded as a primary or secondary cause of death on the death certificate. Cases are as follows:
Month & no. of deaths Associated HCAIApr 13 0 deaths May 13 0 deaths Jun 13 0 deaths July 13 0 deaths Aug 13 0 deaths Sept 13 0 deaths Oct 13 0 deaths Nov 13 0 deaths Dec 13 0 deaths Jan 14 0 deaths Feb 14 0 deaths Mar 14 0 deaths Apr 14 0 deaths May 14 0 deaths Jun 14 0 deaths
Surgical site surveillance. The trust undertakes all mandatory surgical site surveillance (SSI) as well as some in-house surveillance to monitor trends of infections of particular trust services. Mandatory surveillance categories are benchmarked nationally – where the trust is outside the threshold rate, the trust is requested to act and report improvements directly to PHE. Q1 2013/14 has identified a low rate of SSI. No exception reports have been received from PHE. All rates are reported to specialty groups and divisional boards by the IPC team to encourage good practice and plan any improvements.
Paper 2.3b

DIPC report – trust board July 2014 9
Total hip replacements 33 Operations 0 Infections Total Knee replacements 46 Operations 0 Infections Hip Hemiarthroplasties 14 Operations 1 infection Total orthopaedic surgery 96 Operations 1 infection Endovascular aneurysm repair 27 Operations 0 infections Hemicolectomies 19 Operations 2 infections Above and below knee amputations 8 Operations 1 infections Liver transplant surgery 29 Operations 1 Infection Isolation facilities Under criterion 7 of the Health and Social Care Act, the trust has an obligation to ensure adequate isolation facilities. The Board needs to be kept fully informed of any risks associated with this criterion. In order to accurately inform any capital development programmes or service reconfigurations and developments, data on deficits in facilities is reported in the fortnightly divisional meeting. Any future issues and recommendations arising will be included in the DIPC quarterly board report. It has been recognised that additional isolation for screening of patients who are at high risk of CPE is placing particular strain on services such as renal dialysis. Hand hygiene The DH Saving Lives programme High Impact intervention audit tool is used to audit, monitor and report hand hygiene compliance. The over-all trust compliance rate per quarter is detailed in the table below.
Apr – Jun 2013 (Q1) 97.8% Jul – Sep 2013 (Q2) 97.6% Oct - Dec 2014 (Q3) 96.4% Jan – Mar 2014 (Q4) 95.% Apr – June 2013 (Q1) 96.6%
Trust cleanliness
The trust undertakes at least monthly cleaning audits across all areas within the trust. These are undertaken jointly with the facilities staff and matrons and ward leaders. Any areas of concern are immediately identified and rectified. The trust’s target for cleaning compliance is 98% in very high risk areas (eg ITU), the trust achieved 99% for Q4, for high risk areas (eg wards) the target is 95%, the trust achieved 97.5% and in significant risk areas (eg outpatients) the target is 87% with the trust achieving 95%. English national point prevalence survey(PPS) on HCAIs and antimicrobial use. In 2011 a PPS for HCAIs and antimicrobials was conducted in England. The report has been presented to the Board. There are areas in which the trust has higher than expected infections reported and higher than national average antimicrobial use. The actions will form part of the IPC annual work-plan and C.difficile action log and will be monitored by the fortnightly Divisional Leads IPC group and the IPC Committee. The major points from this quarter include.
i. Monthly meeting of C. difficile action group to drive forward action log – Appendix B ii. Extending rapid antimicrobial audit tool to further clinical specialties. iii. Point prevalence audit (PPA) of urinary catheters – 2011 urinary tract infection (UTI) rate was 1.9%, in
2013 the UTI rate was 0.9%. The rate of actual urinary catheters remains the same as 2011. Catheters
Paper 2.3b
DIPC report – trust board July 2014 10
are the major risk factor for UTIs, so a program to reduce catheter insertions and duration of use is under-way. It was acknowledged that this improvement may be a fluctuation, so a repeat PPA will be undertaken in November 2014.
Paper 2.3b

DIPC report – trust board July 2014 11
Paper 2.3b

DIPC report – trust board July 2014 12
Appendix 2.
Infection prevention and control action log-. Month. July 2014. Ref
Objective
Action Required Lead
Completion Date
Current Status
Evidence RFRAG and priority
BCF RAG and priority
1.0 Requirement for responsible clinician and senior nurse representative from clinical area to share responsibility for the root cause analysis (RCA) process with support and advice from IPC team.
Adopt RCA tool aimed at identifying deviations from best practice and generating action plans and documenting their completion.
C diff Rapid RCA tool v4 template May 2014
HE, LH, JB
Aug 2014 BCF RCA tool in use – align tool cross-all sites.
High and immed-iate
1.1 IPCT inform responsible clinicians and nursing teams of toxin positive attributable C.difficile cases, provide RCA document and inform of need to commence RCA process within 72 hours of positive result.
HE Aug 2014 Align Processes
1.2 Findings, lessons learnt and actions taken are to be presented by responsible clinician and senior nurse representative to fortnightly Divisional leads IPC committee and Clinical Performance Committee.
SS, DS
Aug 2014 Partly achieved – align processes
High and immed-iate
High and immed-iate
1.3 Reports to Divisional Board meetings, IPCC and the Board to include a clear signposting of learning from RCAs, the key issues that need to be addressed or the associated action plans.
IPCT
IPCC and Board reports
Partly achieved - align processes
High and immed-iate
High and immed-iate
1.4 Medical Director and Director of Nursing – inform medical and nursing teams that RCA process is to be initiated by patients care teams.
DS, SS Aug 2014 BCF – inaugural meeting July 2014
High and immed-iate
1.5 Invitations to discuss RCA at Divisional Lead meeting from SS
SS Aug 2014 BCF – inaugural meeting July 2014
High and immed-iate
1.6 Invitation to present at Clinical Performance committee from AS
AS Aug 2014 Invite BCF representatives.
High and immed-iate
Paper 2.3b
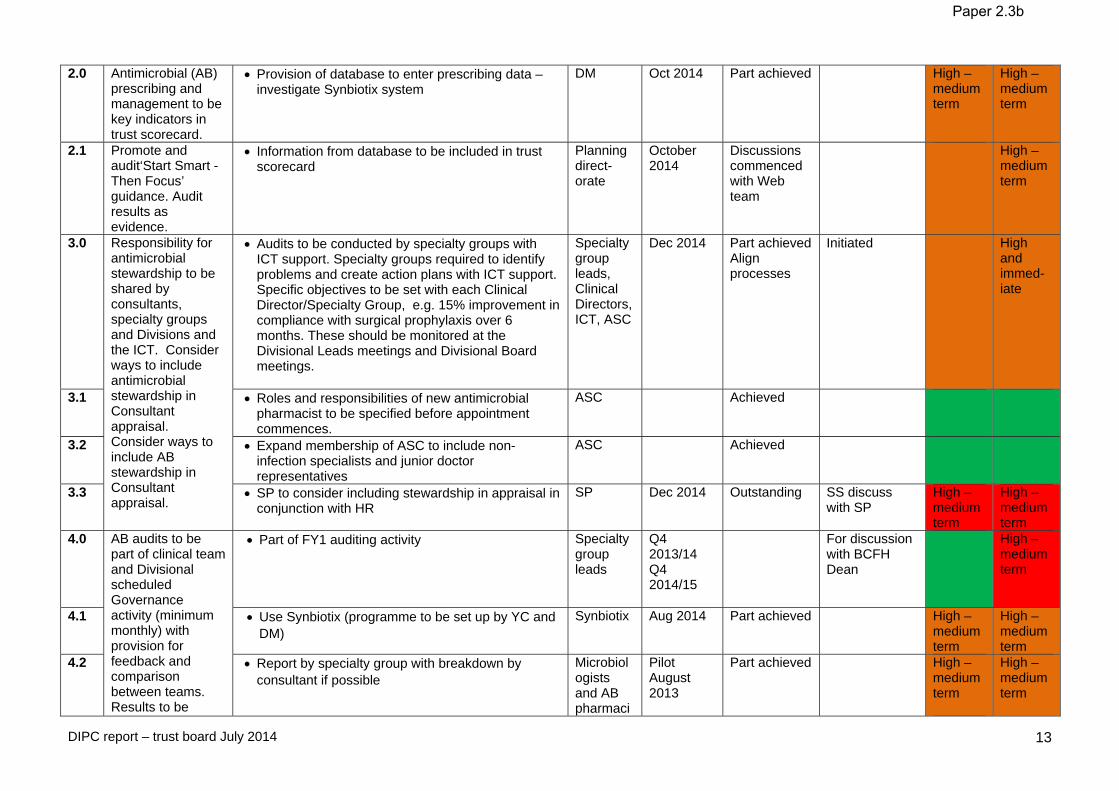
DIPC report – trust board July 2014 13
2.0 Antimicrobial (AB) prescribing and management to be key indicators in trust scorecard.
Provision of database to enter prescribing data – investigate Synbiotix system
DM
Oct 2014 Part achieved
High – medium term
High – medium term
2.1 Promote and audit‘Start Smart - Then Focus’ guidance. Audit results as evidence.
Information from database to be included in trust scorecard
Planning direct-orate
October 2014
Discussions commenced with Web team
High – medium term
3.0 Responsibility for antimicrobial stewardship to be shared by consultants, specialty groups and Divisions and the ICT. Consider ways to include antimicrobial stewardship in Consultant appraisal. Consider ways to include AB stewardship in Consultant appraisal.
Audits to be conducted by specialty groups with ICT support. Specialty groups required to identify problems and create action plans with ICT support. Specific objectives to be set with each Clinical Director/Specialty Group, e.g. 15% improvement in compliance with surgical prophylaxis over 6 months. These should be monitored at the Divisional Leads meetings and Divisional Board meetings.
Specialty group leads, Clinical Directors, ICT, ASC
Dec 2014 Part achieved Align processes
Initiated High and immed-iate
3.1 Roles and responsibilities of new antimicrobial pharmacist to be specified before appointment commences.
ASC
Achieved
3.2 Expand membership of ASC to include non-infection specialists and junior doctor representatives
ASC Achieved
3.3 SP to consider including stewardship in appraisal in conjunction with HR
SP
Dec 2014 Outstanding SS discuss with SP
High – medium term
High – medium term
4.0 AB audits to be part of clinical team and Divisional scheduled Governance activity (minimum monthly) with provision for feedback and comparison between teams. Results to be
Part of FY1 auditing activity Specialty group leads
Q4 2013/14 Q4 2014/15
For discussion with BCFH Dean
High – medium term
4.1 Use Synbiotix (programme to be set up by YC and DM)
Synbiotix
Aug 2014 Part achieved High – medium term
High – medium term
4.2 Report by specialty group with breakdown by consultant if possible
Microbiologists and AB pharmaci
Pilot August 2013
Part achieved
High – medium term
High – medium term
Paper 2.3b
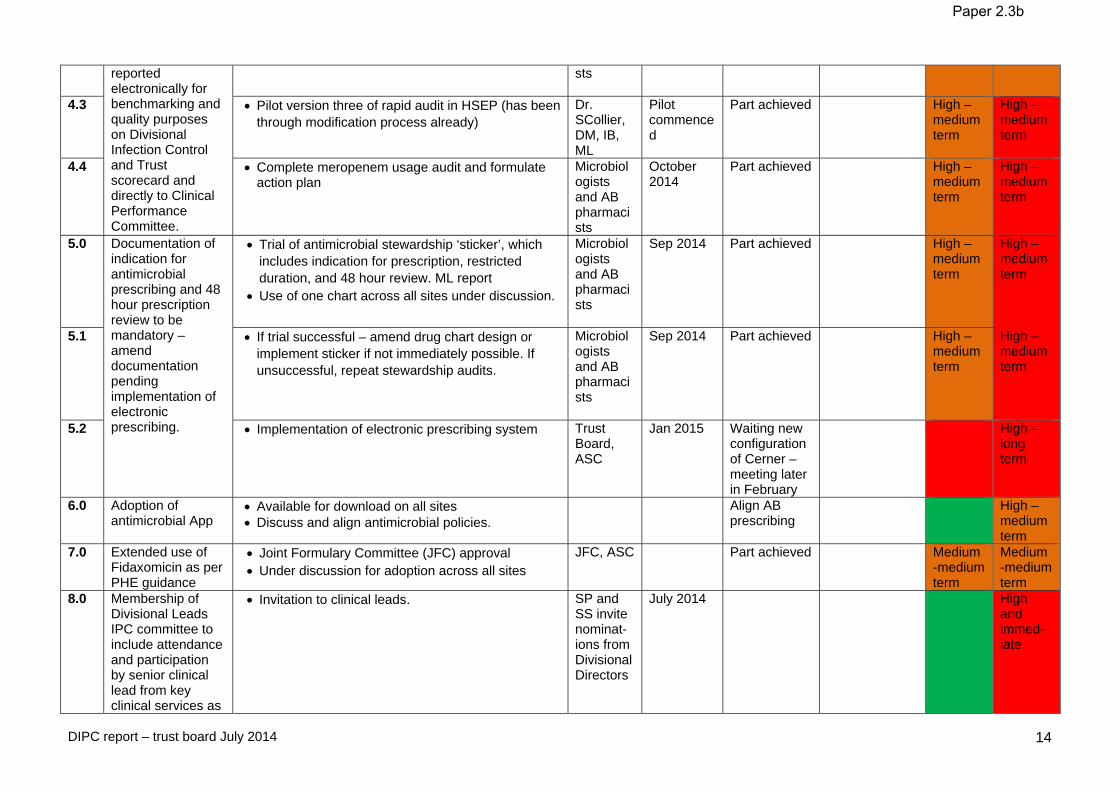
DIPC report – trust board July 2014 14
reported electronically for benchmarking and quality purposes on Divisional Infection Control and Trust scorecard and directly to Clinical Performance Committee.
sts
4.3 Pilot version three of rapid audit in HSEP (has been through modification process already)
Dr. SCollier, DM, IB, ML
Pilot commenced
Part achieved
High – medium term
High – medium term
4.4 Complete meropenem usage audit and formulate action plan
Microbiologists and AB pharmacists
October 2014
Part achieved
High – medium term
High – medium term
5.0 Documentation of indication for antimicrobial prescribing and 48 hour prescription review to be mandatory – amend documentation pending implementation of electronic prescribing.
Trial of antimicrobial stewardship ‘sticker’, which includes indication for prescription, restricted duration, and 48 hour review. ML report
Use of one chart across all sites under discussion.
Microbiologists and AB pharmacists
Sep 2014 Part achieved
High – medium term
High – medium term
5.1 If trial successful – amend drug chart design or implement sticker if not immediately possible. If unsuccessful, repeat stewardship audits.
Microbiologists and AB pharmacists
Sep 2014 Part achieved
High – medium term
High – medium term
5.2 Implementation of electronic prescribing system Trust Board, ASC
Jan 2015 Waiting new configuration of Cerner – meeting later in February
High – long term
6.0 Adoption of antimicrobial App
Available for download on all sites Discuss and align antimicrobial policies.
Align AB prescribing
High – medium term
7.0 Extended use of Fidaxomicin as per PHE guidance
Joint Formulary Committee (JFC) approval Under discussion for adoption across all sites
JFC, ASC Part achieved Medium -medium term
Medium -medium term
8.0 Membership of Divisional Leads IPC committee to include attendance and participation by senior clinical lead from key clinical services as
Invitation to clinical leads.
SP and SS invite nominat-ions from Divisional Directors
July 2014 High and immed-iate
Paper 2.3b
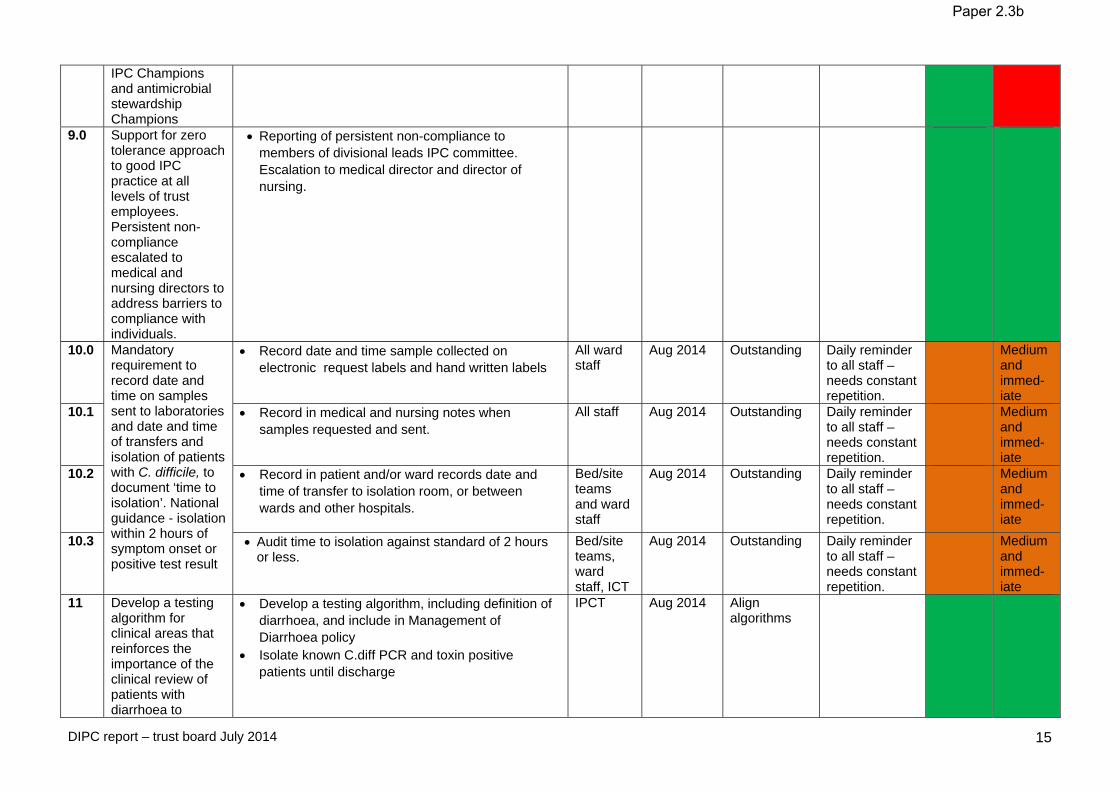
DIPC report – trust board July 2014 15
IPC Champions and antimicrobial stewardship Champions
9.0 Support for zero tolerance approach to good IPC practice at all levels of trust employees. Persistent non-compliance escalated to medical and nursing directors to address barriers to compliance with individuals.
Reporting of persistent non-compliance to members of divisional leads IPC committee. Escalation to medical director and director of nursing.
10.0 Mandatory requirement to record date and time on samples sent to laboratories and date and time of transfers and isolation of patients with C. difficile, to document ‘time to isolation’. National guidance - isolation within 2 hours of symptom onset or positive test result
Record date and time sample collected on electronic request labels and hand written labels
All ward staff
Aug 2014 Outstanding
Daily reminder to all staff – needs constant repetition.
Medium and immed-iate
10.1 Record in medical and nursing notes when samples requested and sent.
All staff
Aug 2014 Outstanding Daily reminder to all staff – needs constant repetition.
Medium and immed-iate
10.2 Record in patient and/or ward records date and time of transfer to isolation room, or between wards and other hospitals.
Bed/site teams and ward staff
Aug 2014 Outstanding Daily reminder to all staff – needs constant repetition.
Medium and immed-iate
10.3 Audit time to isolation against standard of 2 hours or less.
Bed/site teams, ward staff, ICT
Aug 2014 Outstanding Daily reminder to all staff – needs constant repetition.
Medium and immed-iate
11 Develop a testing algorithm for clinical areas that reinforces the importance of the clinical review of patients with diarrhoea to
Develop a testing algorithm, including definition of diarrhoea, and include in Management of Diarrhoea policy
Isolate known C.diff PCR and toxin positive patients until discharge
IPCT Aug 2014 Align algorithms
Paper 2.3b
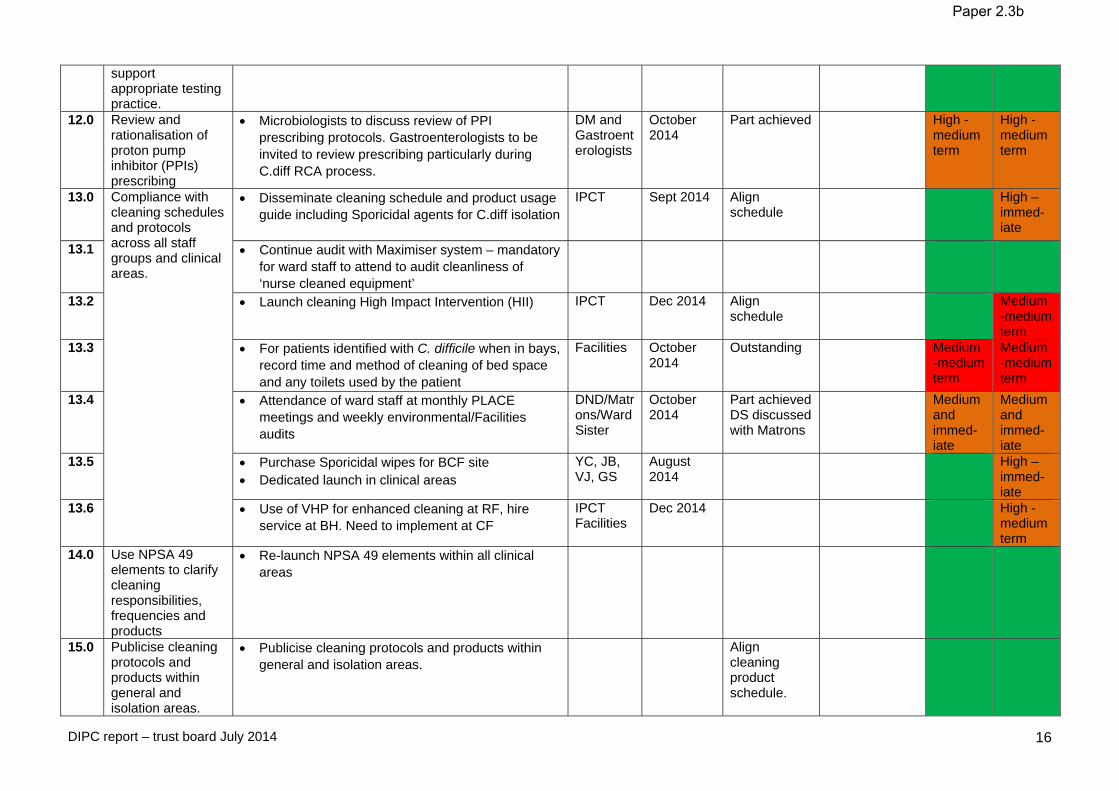
DIPC report – trust board July 2014 16
support appropriate testing practice.
12.0 Review and rationalisation of proton pump inhibitor (PPIs) prescribing
Microbiologists to discuss review of PPI prescribing protocols. Gastroenterologists to be invited to review prescribing particularly during C.diff RCA process.
DM and Gastroenterologists
October 2014
Part achieved High -medium term
High -medium term
13.0 Compliance with cleaning schedules and protocols across all staff groups and clinical areas.
Disseminate cleaning schedule and product usage guide including Sporicidal agents for C.diff isolation
IPCT Sept 2014 Align schedule
High – immed-iate
13.1 Continue audit with Maximiser system – mandatory for ward staff to attend to audit cleanliness of ‘nurse cleaned equipment’
13.2 Launch cleaning High Impact Intervention (HII)
IPCT Dec 2014 Align schedule
Medium -medium term
13.3 For patients identified with C. difficile when in bays, record time and method of cleaning of bed space and any toilets used by the patient
Facilities October 2014
Outstanding
Medium -medium term
Medium -medium term
13.4 Attendance of ward staff at monthly PLACE meetings and weekly environmental/Facilities audits
DND/Matrons/Ward Sister
October 2014
Part achieved DS discussed with Matrons
Medium and immed-iate
Medium and immed-iate
13.5 Purchase Sporicidal wipes for BCF site Dedicated launch in clinical areas
YC, JB, VJ, GS
August 2014
High – immed-iate
13.6 Use of VHP for enhanced cleaning at RF, hire service at BH. Need to implement at CF
IPCT Facilities
Dec 2014 High -medium term
14.0 Use NPSA 49 elements to clarify cleaning responsibilities, frequencies and products
Re-launch NPSA 49 elements within all clinical areas
15.0 Publicise cleaning protocols and products within general and isolation areas.
Publicise cleaning protocols and products within general and isolation areas.
Align cleaning product schedule.
Paper 2.3b

DIPC report – trust board July 2014 17
16.0 Clean commode and re-usable patient equipment
Commode audit, re-launch of daily strip down clean and daily ‘signed off’ checks already re-started.
Align check sheets
16.1 Matron/DND weekly check that commode audits actually carried out
Matrons, DNDs
Aug 2014 On-going High – immed-iate
High – immed-iate
17.0 Education in addition to e-learning, which does not include all staff groups with targeted training, ie specialist antimicrobial prescribing for junior doctors
Microbiologists and Virologists link in to Specialist Groups training programmes – provide multiple individual sessions in addition to dedicated induction session or e-learning.
Specialty group leads DM RS SCollier IB ML DI
Oct 2014.
Microbiologist and Virologists to invite themselves to specialty group training sessions
Microbiologist and Virologists to invite themselves to specialty group training sessions
Medium and immed-iate
Medium and immed-iate
17.1 Add detail on antimicrobial prescribing to e-learning packages.
17.2 Add information on “Start Smart – Then Focus” to junior doctors induction program
Microbiolgists
July 2014 High – immed-iate
18.0 In accordance with Trust Five Year Plan key service developments for year 1 - integrated care: begin collaborative work with GPs and CCGs to develop an integrated approach across the healthcare economy to the reduction of C. difficile
Participation in meetings with local PCTs medicines management committees regarding antimicrobial policies and stewardship
18.1 Begin further collaborative work with GPs and CCGs to develop an integrated approach across the healthcare economy to the reduction of C. difficile
IB working with medical managers group for the community
LH has had meetings with CCG – Herts, Enfield – re-visit meeting schedule and attend.
ICT Jan 2014 Part achieved DM to discuss with CCG representatives.
Medium -medium term
19.0 Re-invigorate Hand Hygiene programme
Re-convene hand hygiene programme group to focus actions for 2013/14
DS - chair Sep 2014 Align programmes
Medium -medium term
Paper 2.3b

DIPC report – trust board July 2014 18
Appendix 3. Carbapenemase Producing Enterobacteriaceae (CPE) Action and Management Plan April July 2014. Abbreviations: CPO = Carbapenemase producing organisms, which includes carbapenemase producing Enterobacteriaceae (CPE) and carbapenemase producing non-fermenters (CP-NF). Toolkit = Acute trust toolkit for the early detection, management and control of carbapenemase-producing Enterobacteriaceae, PHE, December 2013. Ref
Objective
Action Required
Lead Completion
Date Evidence
RF Site BCFH Site
1.0 Review of previous confirmed CPO cases including CPE and CP-NF
Review of confirmed CPE and CP-NF cases from 2008 RF 39 cases (14 CPE), most had a history of
hospitalization abroad of which the largest group were private haematology patients
There was no evidence of transmission of CPE between patients at the Royal Free requiring further action
ICT RS
June 2013 Review summary available
Achieved Achieved
2.0 Identification of high risk groups for CPE
Risk assessment based on Objective 1.0, the draft Toolkit, and review of literature.
High risk units at Royal Free London include ITU, haematology, private patients, dialysis, HPB and stroke.
ICT June 2013 Objective 1.0 Achieved Achieved
3.0 Introduction of a laboratory screening test for CPO
Broth enrichment test introduced in June 2013. In house validation of a chromogenic agar screening test and introduction in December 2013.
ICT, Micro- biology
Dec 2013 Objective 6.0 Achieved Achieved
4.0 Commence screening on high risk units
Education and training for all nursing staff in high risk units
Information leaflets for patients and carers Consideration given to minimising the risk of causing
patient anxiety about a new “super bug” for cases, contacts and those being screened
Resources for providing explanations to patients and carers and addressing fears and concerns
Screening consisting of a rectal swab (or stool sample) plus swabs from any wounds and device related sites
Screening commenced in June 2013 on the following units at RFH:
1. ITU - admission and weekly screening for all patients) 2. Haematology units – leukaemic stool screen modified to detect CPO 3. Dialysis units – CPO screening added to “return from
ICT, Trust Board
June 2014 Objective 6.0 High High
Paper 2.3b

DIPC report – trust board July 2014 19
dialysis abroad” screening 4. Private patients units – screening using the Toolkit questions: For BCFH training and screening will commence August 2014. 1. ITU - admission and weekly screening for all patients) 2. Haematology units – leukaemic stool screen modified to detect CPO 3. Stroke ward on admission IN THE LAST 12 MONTHS has the patient: 1. Been an inpatient in a hospital abroad? 2. Been an inpatient in a UK hospital known to have spread of CPE (if known)? 3. Been colonised or infected with CPE or been a contact of someone who has? If “yes” to any question patients must be pre-emptively isolated in a side room with en suite or a dedicated commode until 3 screens each taken two days apart come back negative Education and training and additional staff time is
required to introduce screening on all other in-patient areas
4.1 Commence pre-transfer
screening of transfers to high risk units
For direct transfers from other hospitals in the UK or abroad to high risk units the Toolkit screening questions should be asked pre-transfer plus the question:
4. Is the hospital unit or hospital ward of origin experiencing an outbreak or cluster of CPE? If the answer to this or any of the three screening
questions is “yes” then on transfer to the Royal Free the patient must be pre-emptively isolated and screened as above.
If the answer to all questions is “no” then transfers to high risk units do not require pre-emptive isolation or screening
ICT Trust Board
June 2014 High High
5.0 Point prevalence survey of all in patients to assess the proportions qualifying as “suspected cases”
Point prevalence survey of all inpatients on one day asking the screening questions from the Toolkit to identify “suspected cases”
Results: 19% of inpatients qualified as “suspected cases” however 16.5% of the total only had hospitalization in a London hospital within 12 months
ICT
Survey Jan 2014, analysis April 2014
Poster presented at HIS/IPS Spring Meeting in Birmingham on April 8 2014
Achieved NA
Paper 2.3b
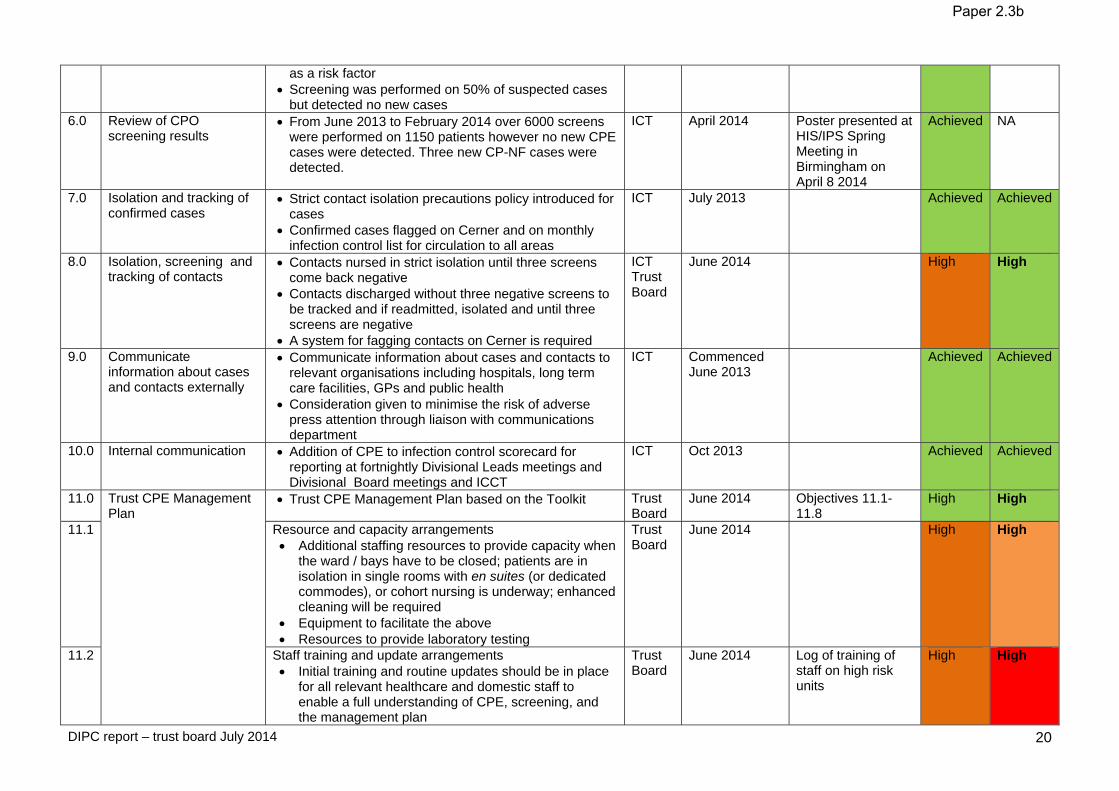
DIPC report – trust board July 2014 20
as a risk factor Screening was performed on 50% of suspected cases
but detected no new cases 6.0 Review of CPO
screening results From June 2013 to February 2014 over 6000 screens
were performed on 1150 patients however no new CPE cases were detected. Three new CP-NF cases were detected.
ICT
April 2014 Poster presented at HIS/IPS Spring Meeting in Birmingham on April 8 2014
Achieved NA
7.0 Isolation and tracking of confirmed cases
Strict contact isolation precautions policy introduced for cases
Confirmed cases flagged on Cerner and on monthly infection control list for circulation to all areas
ICT July 2013 Achieved Achieved
8.0 Isolation, screening and tracking of contacts
Contacts nursed in strict isolation until three screens come back negative
Contacts discharged without three negative screens to be tracked and if readmitted, isolated and until three screens are negative
A system for fagging contacts on Cerner is required
ICT Trust Board
June 2014 High High
9.0 Communicate information about cases and contacts externally
Communicate information about cases and contacts to relevant organisations including hospitals, long term care facilities, GPs and public health
Consideration given to minimise the risk of adverse press attention through liaison with communications department
ICT Commenced June 2013
Achieved Achieved
10.0 Internal communication Addition of CPE to infection control scorecard for reporting at fortnightly Divisional Leads meetings and Divisional Board meetings and ICCT
ICT Oct 2013 Achieved Achieved
11.0 Trust CPE Management Plan
Trust CPE Management Plan based on the Toolkit Trust Board
June 2014 Objectives 11.1-11.8
High High
11.1 Resource and capacity arrangements Additional staffing resources to provide capacity when
the ward / bays have to be closed; patients are in isolation in single rooms with en suites (or dedicated commodes), or cohort nursing is underway; enhanced cleaning will be required
Equipment to facilitate the above Resources to provide laboratory testing
Trust Board
June 2014 High High
11.2 Staff training and update arrangements Initial training and routine updates should be in place
for all relevant healthcare and domestic staff to enable a full understanding of CPE, screening, and the management plan
Trust Board
June 2014 Log of training of staff on high risk units
High High
Paper 2.3b
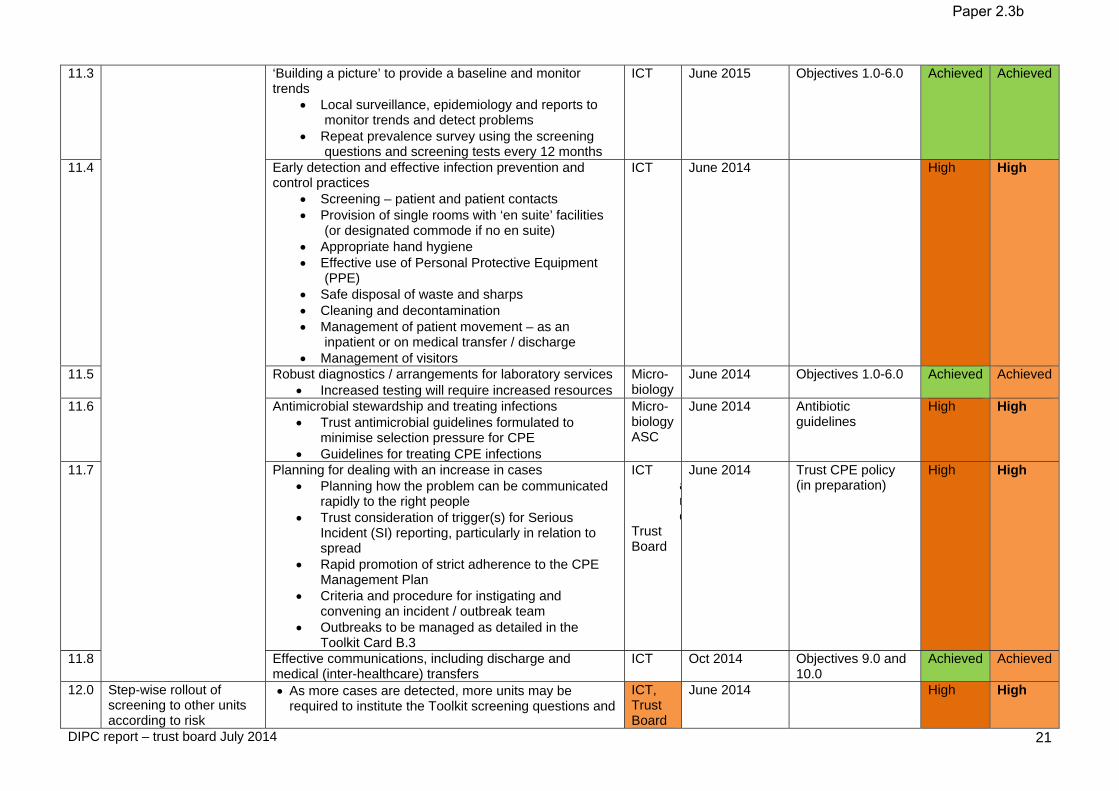
DIPC report – trust board July 2014 21
11.3 ‘Building a picture’ to provide a baseline and monitor trends
Local surveillance, epidemiology and reports to monitor trends and detect problems
Repeat prevalence survey using the screening questions and screening tests every 12 months
ICT June 2015 Objectives 1.0-6.0 Achieved Achieved
11.4 Early detection and effective infection prevention and control practices
Screening – patient and patient contacts Provision of single rooms with ‘en suite’ facilities
(or designated commode if no en suite) Appropriate hand hygiene Effective use of Personal Protective Equipment
(PPE) Safe disposal of waste and sharps Cleaning and decontamination Management of patient movement – as an
inpatient or on medical transfer / discharge Management of visitors
ICT June 2014 High High
11.5 Robust diagnostics / arrangements for laboratory services Increased testing will require increased resources
Micro- biology
June 2014 Objectives 1.0-6.0 Achieved Achieved
11.6 Antimicrobial stewardship and treating infections Trust antimicrobial guidelines formulated to
minimise selection pressure for CPE Guidelines for treating CPE infections
Micro- biology ASC
June 2014 Antibiotic guidelines
High High
11.7 Planning for dealing with an increase in cases Planning how the problem can be communicated
rapidly to the right people Trust consideration of trigger(s) for Serious
Incident (SI) reporting, particularly in relation to spread
Rapid promotion of strict adherence to the CPE Management Plan
Criteria and procedure for instigating and convening an incident / outbreak team
Outbreaks to be managed as detailed in the Toolkit Card B.3
ICT and
Trust Board
June 2014 Trust CPE policy (in preparation)
High High
11.8 Effective communications, including discharge and medical (inter-healthcare) transfers
ICT Oct 2014 Objectives 9.0 and 10.0
Achieved Achieved
12.0 Step-wise rollout of screening to other units according to risk
As more cases are detected, more units may be required to institute the Toolkit screening questions and
ICT, Trust Board
June 2014 High High
Paper 2.3b

DIPC report – trust board July 2014 22
assessments pre-emptive isolation and screening. This will have implications for resources, patient flow
and operational management, for example requiring widespread pre-emptive isolation and/or cohorting of “suspected cases”
13.1 Compliance with Patient Safety Alert Stage Two: Resources
Bring this alert to the notice of the Director for Infection Prevention and Control (DIPC) and infection control staff to instigate the development of the board level CPE management plan.
ICT Mar 2014 This Action Plan
13.2 In discussion with relevant clinical experts establish if there are / have been cases of CPE in the organisation and consider if immediate action is required locally to reduce the risk of such an incident / outbreak occurring.
ICT Mar 2014 All achieved Objectives above
13.3 In the light of the local situation the Infection Prevention and Control Committee to plan for local adoption and dissemination of the Acute Trust CPE toolkit to influence clinical practice. This will include advising front line staff of the issue and the Trust’s plans for addressing CPE.
ICT, Trust Board
June 2014 Objectives above High High
14.0 Compliance with letter to Acute Trust Chief Executives, 27 February 2014
Ensure, as a matter of highest priority and urgency, that the recently published Toolkit is embedded into clinical practice within your Trust.
Key information: The toolkit is intended to provide a framework to support local risk assessment, providing the minimum interventions required to safeguard patient safety and prevent an escalation of the problem.
ICT, Trust Board
June 2014 Objectives above High High
Paper 2.3b
Paper 2.4
1
REFERRAL TO TREATMENT WAITING TIMES
Executive summary This report informs the board about the governance of the referral to treatment waiting times project.
Action required / recommendation The board is asked to endorse the priority being accorded to this problem, and to confirm its own leadership role in the governance.
Governing objectives supported by this paper
Board assurance risk numbers
Excellent outcomes All R1 series Excellent experience All R2 series Excellent value for money Full compliance All R4 series A strong organisation All R5 series Risks attached to this project / initiative and how these will be managed (assurance) See the report. Equality impact assessment
Patient treatment priority is determined clinically and by waiting time.
Public Patient and Carer involvement Mainly via CCG involvement.
Report from Kim Fleming Date 18 July 2014
Report to
Date of meeting Attachment number
Trust board 30 July 2014 Paper 2.4

Paper 2.4
2
Referral to treatment waiting times 1 Introduction and purpose of this report This report is about how to manage remedying the waiting time problem that had accumulated, probably over a long period, at the former Barnet and Chase Farm Hospitals NHS Trust (BCF), and that emerged in mid 2013. The board has been aware of this problem due to the attention paid to it in the due diligence and Monitor risk assessment phases before the acquisition. The task is to return the combined trust to compliance with the national waiting list standards. The purpose of this report is to set out the proposed governance arrangements overseeing that return to trust level compliance, and to seek the board’s confirmation of its leadership role in that governance. 2 A reminder about the subject In recent years the NHS performance standards for waiting times have been couched in terms of the percentage of patients who have been treated within 18 weeks, namely 90% for admitted patients and 95% for out‐patients. This is expressed in The Handbook to the NHS Constitution as:
“The right to start your consultant led treatment within a maximum of 18 weeks from referral for non urgent conditions.”
As members know from the monthly performance reports, the Royal Free has consistently met these two targets in recent years, although has tended only just to achieve the third, which measures the percentage of patients still waiting for treatment who have to date waited less than 18 weeks (for which the target minimum is 92%). At Barnet and Chase Farm Hospitals those targets are not being met, although by what margin is yet to be established. Across the English NHS the achievement of these standards has been declining lately (see table below). These figures exclude a small number of trusts who were unable to report accurately, Barnet and Chase Farm having been in that group for the March 2014 figures. Table 1 – Changes in referral to treatment standard compliance and median waits, England 2012‐2014
admitted (90%) non admitted (95%) incomplete (92%)
March 2012 91.1 97.4 93.3
March 2013 92.1 97.6 94.2
March 2014 89.4 96.3 93.7
median wait (weeks) median wait (weeks) median wait (weeks)
March 2012 8.1 3.6 5.2
March 2013 8.2 3.9 5.5
March 2014 8.8 4.8 5.5 Source: NHS England
Additional funding is being made available this summer to CCGs and, through them, hospitals to enable more waiting patients to be treated, and thus to reduce waiting times. 3 The need for good governance At BCF it was from 2013 onwards not known how long how many patients had been waiting, and so from October 2013 that trust ceased reporting its data, intending to resume doing so only when the position was ascertained. External help was sought by the trust to achieve that clarity, but the picture turned out to be

Paper 2.4
3
complicated, hard to disentangle and evidently involving substantial numbers of patients waiting longer than the standard. As well as patients and the public, bodies with particular interests in understanding the problem include:
‐ four local CCGs in particular (and others to some extent); ‐ local GPs; ‐ NHS England (as both the overseer of CCGs and a commissioner itself); ‐ Monitor; and ‐ local authorities, including their scrutiny committees.
The Royal Free’s prime task is to identify the patients waiting too long and to treat them as promptly as is feasible. However another task very nearly as important as treating the patients is to communicate and engage with partner organisations. On the one hand we need to make available information on the numbers of patients as soon as we have ascertained them, and on progress with reducing the backlog of long waiters; and on the other we want as much help as we can get from commissioners and GP practices to ensure that all the patients affected are identified and treated. 4 Proposed governance structure In discussion with NHS England it has been agreed that there should from now on be one structure overseeing the recovery plan. That structure is summarised in the appended chart. In such an important and complex matter the benefits of one structure are that:
‐ there is one board that is taking responsibility for solving the problem; ‐ there is one co‐ordinated set of discussions involving the right people; ‐ there is one source of factual information; and ‐ progress reports are produced by one unit to keep a variety of partners informed.
The chief executive’s report to the board will summarise progress every month until compliance is reachieved. Reports will also go to the patient experience committee in respect of clinical harm, and to the finance and performance committee relating to plans to resume reporting and, subsequently, progress towards achieving the national targets. Summary reports will also go to Monitor monthly. External involvement is achieved in a range of ways within the governance structure, including:
‐ a senior director from our lead commissioner (Barnet CCG) is a member of the programme board; ‐ a national expert on how to resolve waiting time issues is a member of the programme board; ‐ the chair of the clinical harm group is a senior clinician from outside the trust; ‐ clinician representatives for all four principal CCGs whose patients attend Barnet and Chase Farm
Hospitals will be invited to serve on the clinical harm group; and ‐ a senior information analyst from NHS England is a member of the data validation group.
Additional engagement with partners includes:
‐ regular provision of information reports for commissioners; ‐ regular briefing of senior commissioners through the contracting process; ‐ regular briefing of other stakeholders through our communications department; and ‐ supporting public scrutiny committee discussions as required.
Recommendation The board is asked to endorse the priority being accorded to this problem, and to confirm its own leadership role in the governance.

Paper 3.1
Chairman’s report – Trust board July 2014
Report to
Date of meeting Attachment number
Trust Board
30 July 2014 Paper 3.1
CHAIRMAN’S REPORT Executive summary An update on recent stakeholder meetings, appointment of a new vice-chair of the trust, visit from Jeremy Hunt, update from the recent council of governor’s meetings, including the annual members meeting and governor elections 2014, and Professor Sir John Cunningham’s knighthood. Action required For the board to note the report. Report from Dominic Dodd, chairman Author Jan Aps, trust secretary Date 24 July 2014

Paper 3.1
Chairman’s report – Trust board July 2014
CHAIRMAN’S REPORT
RECENT STAKEHOLDER MEETINGS I have recently held meetings with the following:
Debbie Frost, Chair, Barnet Clinical Commissioning Group Caz Sayer, Chair, Camden Commissioning Group
APPOINTMENT OF A NEW VICE-CHAIR OF THE TRUST I am pleased to announce that the council of governors has appointed Jenny Owen, non-executive director, as the trust’s new vice-chair and senior independent director. JEREMY HUNT VISIT
Jeremy Hunt, the secretary of state for health, visited the Royal Free Hospital, taking a tour of the UCL Institute of Immunity and Transplantation (IIT) and seeing the Royal Free Charity. Mr Hunt, who was accompanied by Simon Marcus, the Conservative candidate for Hampstead and Kilburn, was taken round the labs in the IIT by Professor Hans Stauss, the director of the institute, and researcher Dr Siobhan Burns. He was also shown the clinic areas, on the second floor of the hospital, where he spoke to a patient receiving treatment at the IIT.
Mr Hunt was invited to the see the institute by Chris Burghes, the chief executive of the Royal Free Charity which was raising funds to pay for the new institute building.
A planning application for the new building was expected to be submitted to Camden Council in the autumn.
COUNCIL OF GOVERNORS The council of governors has met once since the last board meeting, on 9 July at which it:
Received the Royal Free London NHS Foundation Trust’s Annual Report and Accounts for 2013/14.
Appointed Jenny Owen, non-executive director as vice-chair of the trust. Received a presentation on the key milestones achieved by the patient experience council
sub-group in relation to patient transport. Received progress reports from the other council sub-groups, noting progress achieved. Received reports from board committees with governor representation, again noting the
progress achieved. Noted reports from the chairman and chief executive on board and trust activity.
Annual members’ meeting On 13 July, the trust held its second annual members’ meeting, which was attended by over 60 trust members. In addition to a presentation from Caroline Clarke on the annual report and accounts, members were able to hear more about the acquisition of Barnet and Chase Farm Hospitals NHS Trust (BCF), and they also received a personal view from two of the governors on what it was like to be a governor and updates on council priorities. There was an opportunity for members to put forward their views on the new A&E department and what patient information should be available on our website. Key themes members raised in questions were around the future of Chase Farm Hospital, investment in Barnet Hospital, why the trust had focused its kidney services at Tottenham Hale, and the financial support provided to the trust to undertake the acquisition of BCF.

Paper 3.1
Chairman’s report – Trust board July 2014
Governor elections 2014 On 16 July the trust published its notice that elections would be held for the council of governors for the Royal Free London NHS Foundation Trust. The elections are to be held for the following number of governors in the following constituencies and classes:
seven vacancies in the trust’s local public constituency, which includes the London Boroughs of Barnet, Camden and Enfield, and Hertfordshire County Council;
one vacancy in our Rest of England constituency; five vacancies (of a total of eight seats) on our patient constituency; and six vacancies in our staff constituency.
To stand for election, applicants must be a member of Royal Free London NHS Foundation Trust within the constituency and class for which they wish to stand as a candidate. The elections will be run independently by UK Engage on behalf of the trust. Further details, including nomination forms, are available on the Royal Free website at: www.royalfree.nhs.uk. The closing date for nominations papers will be 5pm on Friday 15 August 2014. ROYAL FREE PROFESSOR KNIGHTED I would like to offer my congratulations to Professor Sir John Cunningham who was recently knighted in a private audience with HM The Queen at Buckingham Palace. Professor Cunningham, a consultant nephrologist at the Royal Free, was head of the medical household and physician to the Queen for nine years. At the ceremony he was invested with the insignia of a Knight Commander of the Royal Victorian Order (KCVO), a dynastic order of knighthood which recognises distinguished personal service to the Queen.

Paper 3.2
CE’s report - Trust board July 2014
CHIEF EXECUTIVE’S REPORT
Executive summary The report this month includes an update on Day 1 of the new Royal Free London NHS Foundation Trust, the redevelopment of Chase Farm Hospital, Shelford Group and the the communications report.
Action required The board is asked to note the report.
Report From D Sloman, chief executive Author(s) J Aps, trust secretary Date 24 July 2014
Report to
Date of meeting Attachment number
Trust Board
30 July 2014 Paper 3.2

Paper 3.2
CE’s report - Trust board July 2014
CHIEF EXECUTIVE’S REPORT
DAY 1 OF THE NEW ROYAL FREE LONDON NHS FOUNDATION TRUST 1 July 2014 marked the first day of the enlarged Royal Free London FT, which now includes Barnet Hospital and Chase Farm Hospitals. The trust, which is now one of the biggest in the UK, will deliver care to more than 1.6 million people through the three hospitals, and more than 30 services in the community. The trust board were pleased to meet the many staff who attended the three welcome events held across the trust that day – over 1200 staff attended the sessions, which were very well received. With very minor exceptions, all day 1 deliverables were completed, and a safe and effective transfer of accountabilities achieved. The acquisition means that the trust now has nearly 10,000 staff representing more than 100 nationalities; this will provide an unprecedented opportunity for the trust to continue to deliver pioneering work in service, teaching and research. REDEVELOPMENT OF CHASE FARM HOSPITAL On 21 July, the trust held its first meeting of the stakeholder group set up as part of the Chase Farm Hospital redevelopment programme. Members of the stakeholder group include local MPs, councillors and representatives from local commissioning groups, Healthwatch and Enfield Over 50s Forum. They will be invited to regular updates, provide feedback as proposals develop and be able to share the developments with their local communities and provide a reliable source of informed, cohesive and balanced stakeholder advice. Stakeholders heard from various members of the executive team at the event, with focus on delivering services which were clinically led and recently managed; how the trust’s values and governing objectives would underpin the development programme; the shortcomings of the site, in particular the logistical difficulties for patients and the staff trying to care for them; and the plans to build new facilities in a smaller area of the site, using the proceeds from surplus land sales to help fund the development. SHELFORD GROUP The trust recently expressed an interest in becoming a member of the Shelford Group. The Group was formed in 2011 to benchmark and share best practice in key service areas across the membership through working groups, and constructively engage with Government, Parliament and industry to represent the interests of large tertiary centres and the wider National Health Service. It is led by its member chief executives and has active sub-groups for chief nurses, finance directors and medical directors. The chair, Sir Andrew Cash, has advised that membership of the Group is ultimately based on invitation and the Group is not looking to expand its membership at present. However, it will consider the trust when reviewing the Group in future. COMMUNICATIONS REPORT
To follow is the communications report for June 2014.
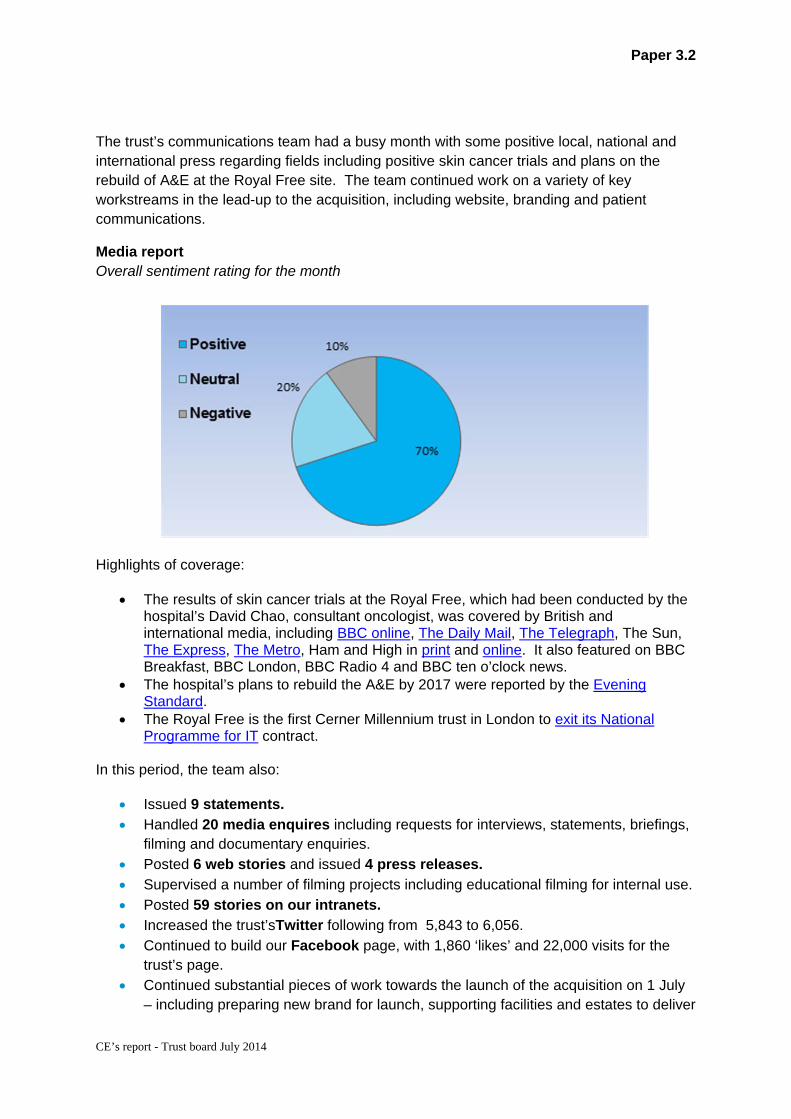
Paper 3.2
CE’s report - Trust board July 2014
The trust’s communications team had a busy month with some positive local, national and international press regarding fields including positive skin cancer trials and plans on the rebuild of A&E at the Royal Free site. The team continued work on a variety of key workstreams in the lead-up to the acquisition, including website, branding and patient communications.
Media report Overall sentiment rating for the month
Highlights of coverage:
The results of skin cancer trials at the Royal Free, which had been conducted by the hospital’s David Chao, consultant oncologist, was covered by British and international media, including BBC online, The Daily Mail, The Telegraph, The Sun, The Express, The Metro, Ham and High in print and online. It also featured on BBC Breakfast, BBC London, BBC Radio 4 and BBC ten o’clock news.
The hospital’s plans to rebuild the A&E by 2017 were reported by the Evening Standard.
The Royal Free is the first Cerner Millennium trust in London to exit its National Programme for IT contract.
In this period, the team also:
Issued 9 statements. Handled 20 media enquires including requests for interviews, statements, briefings,
filming and documentary enquiries. Posted 6 web stories and issued 4 press releases. Supervised a number of filming projects including educational filming for internal use. Posted 59 stories on our intranets. Increased the trust’sTwitter following from 5,843 to 6,056. Continued to build our Facebook page, with 1,860 ‘likes’ and 22,000 visits for the
trust’s page. Continued substantial pieces of work towards the launch of the acquisition on 1 July
– including preparing new brand for launch, supporting facilities and estates to deliver

Paper 3.2
CE’s report - Trust board July 2014
newly branded uniforms and signage, and preparation for the launch of a new website for the organisation.
Provided internal support and promotion of EDRM and RPASS projects for staff. Promoted Friends and Family test results both internally and externally. Continued communications planning for the new Institute of Immunity and
Transplantation. Undertook detailed launch work for the A&E rebuild project following the board’s sign
off. Continued to provide extensive communications support to the proposed pathology
joint venture.

Paper 3.3 (Updated 29 July 2014)
Trust performance report – trust board July 2014
TRUST PERFORMANCE REPORT
Executive summary Monitor Risk Assessment Framework Ratings for June 14 and Quarter 1: With cancer data not yet available for June 14 the trust is forecasting a Green rating for the month and the quarter. The trust failed the Cancer 62 Day Referral from a Screening Service indicator in April; however 100% compliance was achieved in May 14 with the same level of performance forecast for June 14. The trust is therefore forecasting compliance against all indicators for June 14 and quarter 1.
Action required The board is asked to note the report
Trust strategic priorities and business planning objectives supported by this paper
Board assurance risk number(s)
1 Excellent outcomes – to be in the top 10% of our peers on outcomes
R1.2, R1.3
2 Excellent user experience – to be in the top 10% of relevant peers on patient, GP and staff experience
R2.2, R2.3
3 Excellent financial performance – to be in the top 10% of relevant peers on financial performance
R3.2
5 A strong organisation for the future – to strengthen the organisation for the future
R5.1
CQC outcomes supported by this paper 8 Cleanliness and infection control 16 Assessing and monitoring the quality of service
provision 26 Financial position
Risks attached to this project / initiative and how these will be managed (assurance) N/A
Equality impact assessment No adverse impact
Report From
Will Smart
Director of IM&T
Author(s) Will Smart Tony Ewart Holly Chambers
Director of IM&T Head of Performance Head of Reporting and Analytics
Date 29 July 2014
Report to
Date of meeting Attachment number
Trust Board 30 July 2014 Paper 3.3

����������� ������ �������� ������ ������� �����
����������� �������
Paper 3.3 (Revised 29 July 2014)
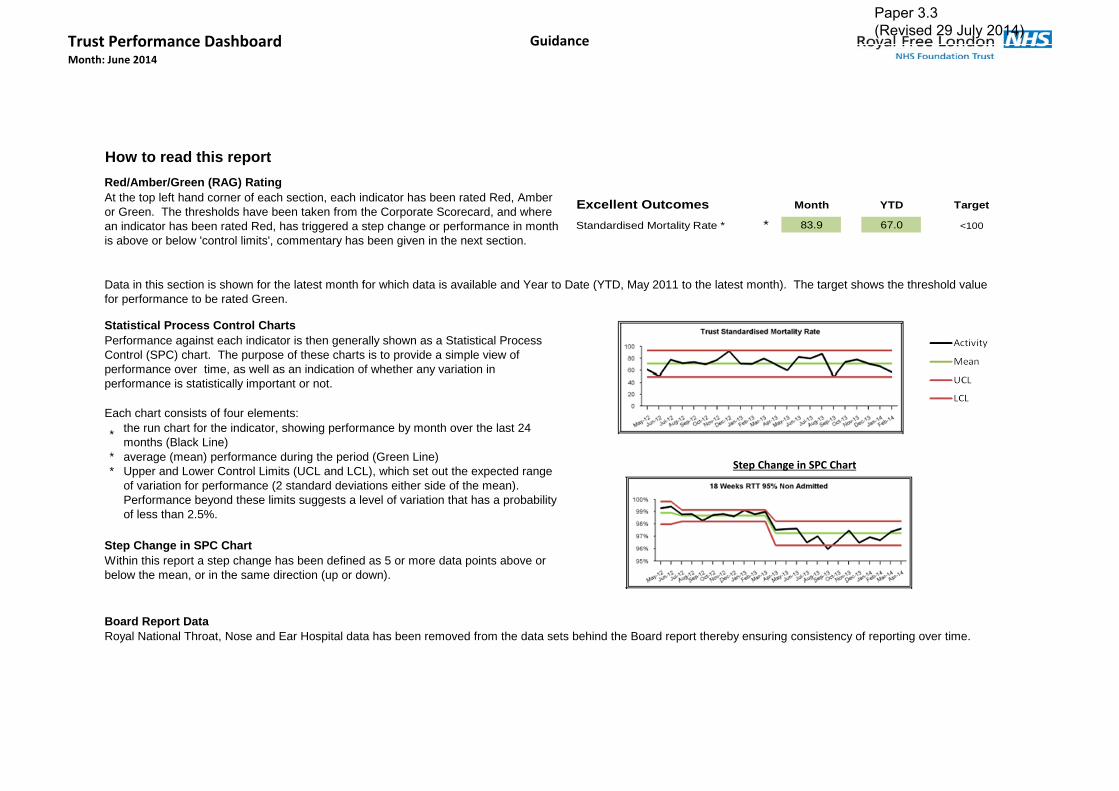
Trust Performance DashboardMonth: June 2014
Guidance
How to read this report
Red/Amber/Green (RAG) Rating
Statistical Process Control Charts
**
Step Change in SPC Chart
Board Report DataRoyal National Throat, Nose and Ear Hospital data has been removed from the data sets behind the Board report thereby ensuring consistency of reporting over time.
average (mean) performance during the period (Green Line)Upper and Lower Control Limits (UCL and LCL), which set out the expected range of variation for performance (2 standard deviations either side of the mean). Performance beyond these limits suggests a level of variation that has a probability of less than 2.5%.
Within this report a step change has been defined as 5 or more data points above or below the mean, or in the same direction (up or down).
At the top left hand corner of each section, each indicator has been rated Red, Amber or Green. The thresholds have been taken from the Corporate Scorecard, and where an indicator has been rated Red, has triggered a step change or performance in month is above or below 'control limits', commentary has been given in the next section.
Data in this section is shown for the latest month for which data is available and Year to Date (YTD, May 2011 to the latest month). The target shows the threshold value for performance to be rated Green.
Performance against each indicator is then generally shown as a Statistical Process Control (SPC) chart. The purpose of these charts is to provide a simple view of performance over time, as well as an indication of whether any variation in performance is statistically important or not.
Each chart consists of four elements:
* the run chart for the indicator, showing performance by month over the last 24 months (Black Line)
Excellent Outcomes Month YTD Target
Standardised Mortality Rate * * 83.9 67.0 <100
Step Change in SPC Chart
Paper 3.3 (Revised 29 July 2014)

Trust Performance Dashboard Month: June 2014
Commentary and Exception Report
Monitor Risk Assessment Framework Ratings for June 14 and Quarter 1: With cancer data not yet available for June 14 the trust is forecasting a Green rating for the month and the quarter. The trust failed the Cancer 62 Day Referral from a Screening Service indicator in April; however 100% compliance was achieved in May 14 with the same level of performance forecast for June 14. The trust is therefore forecasting compliance against all indicators for June 14 and quarter 1. Excellent outcomes: C. difficile infections: There has been a significant improvement in performance since the third quarter 2013/14. Between April 13 and September 13 the trust recorded twenty five C. difficile infections. For the period October 13 to March 14 ten infections were recorded, a 60% reduction between the first half of last year and the second. This improvement has continued into 2014/15 with the trust achieving compliance with its monthly trajectory in April, May and June 14 and therefore quarter one. This is the first time quarterly compliance has been achieved since quarter one 2012/13 and is therefore a significant achievement. In addition it should be noted that from quarter three 2013/14 the CQC no longer consider the rate of infections at the Royal Free to constitute either an Elevated Risk or Risk under the principles of the Intelligent Monitoring System. Patient experience: Never events: The trust is retrospectively reporting a never Event for February and May 14. February 14: The Never event relates to the omission of insulin for a patient returning from haemodialysis, subsequently a CT scan showed new extensive infarct suggestive of further embolic event, i.e. stroke. The trust may request de‐escalation as a Never Event as the investigation identified that the patient’s deterioration may not have been related to the maladministration of. Commissioners will need to approve de‐escalation. Because the criteria for declaring Never Events are based on harm caused and the trust is required to report suspected Never Events within 2 working days of detection, there will be occasions where an event is declared only to be de‐escalated subsequently when further investigation has been conducted, particularly where the patient has complex comorbidities. May 14: An ophthalmology patient attended Edgware Hospital as a day case and had a lens inserted into the left eye under local anaesthetic. At a subsequent outpatient appointment the consultant noted that the patient had a different lens implanted to the one recommended by biometry. The patient will require further surgery.
Paper 3.3 (Revised 29 July 2014)

Trust Performance Dashboard Month: June 2014
Commentary and Exception Report
Breaches of same sex standard: The trust recorded one breach during June. The breach occurred on ITU as a result of a specialty bed not being available. Market share: The market share report has not been updated since the last Board report as Dr Foster, data supplier, has not been able to refresh the national data. Activity: Non‐elective length of stay, occupied beds and spells Non elective spells reduced in June towards the lower confidence limit, however non elective length of stay and occupied bed days increased towards the upper confidence limit. At first glance this appears to be counter intuitive; however analysis reveals that the increase in length of stay and occupied bed days is almost exclusively caused by the discharge of exceptionally long length of stay patients from geriatric medicine. Two patients were discharged with length of stay of 185 and 309 days with several other patients staying longer than 70 days. This means that the impact on length of stay is in fact a lagged outcome of admissions which took place several months ago. One point which exacerbates this issue is the relatively low volume of non‐elective spells seen in June. Efficiency metrics: Theatre utilisation: The data records a significant reduction in the theatre efficiency rate in April and May with an improvement in June. Reduced working days, due to Bank Holidays, were a feature of both April and May; however performance is below that recorded for the same period last year. Reduced performance is mainly due to consultant sickness in Plastic and Orthopaedic Surgery as well as a shortage of Operating Department Practitioners during April and May which has now been rectified. The absence of Plastic Surgery consultants is compounded by a reduction of four registrar posts which the Deanery were unable to fill. The theatre utilisation rate, as currently constructed, does not capture current inpatients added to the lists at short notice. For example Renal Surgery now has a “mop‐ up” list to deal with fistulas. The trust is currently reviewing the way theatre utilisation is reported as currently only planned elective patients are included in the metric resulting in an incomplete picture of activity. RTT 18‐weeks 52 weeks breaches: The trust is reporting a 52 week breach in the June 14 data. The breach relates to a Plastic Surgery paediatric pathway. The pathway is notable for the number of patient DNA’s and cancellations which should arguably have resulted in discharge to the GP if the trusts Access Policy had been followed. However there are also features of this case which would have warranted special consideration such as the poor health and hospital treatment of a sibling. Despite these mitigating circumstances it appears clear from the data that the administrative management of the pathway was inadequate from both a
Paper 3.3 (Revised 29 July 2014)
Trust Performance Dashboard Month: June 2014
Commentary and Exception Report
patient and trust perspective. Consideration of this pathway and lessons to be learned will form a part of the system and process review described in last month’s report. Workforce: Sickness absence rate: The sickness absence rate has reduced across the Trust from 3.35% to 3.04%. The rate is reduced across all staff groups. Staff continue to be managed in line with the Trusts sickness/absence policy and procedure as appropriate. In total there are 559 formal cases being managed down from 632 last month. Trigger reports are sent through to management teams monthly to ensure absences for staff are picked up regularly and the workforce team continue to work closely with their managers to provide support and advice. Turnover rates: The turnover rate has increased from 13.42% to 13.65% for June. The rate of increase has declined. The increase has been in A&C, additional clinical services and scientific staff groups. Nursing & Midwifery turnover continues to reduce. Actions to continue supporting the reduction are being taken forward as part of the nursing recruitment strategy group. Vacancy rate: The vacancy rate is up from 12.15% in May to 12.41% for June. This is accounted for by establishment increases in the last month. Mandatory & Statutory training: For June14 MaST compliance has increased to 82%. All staff continue to be reminded of the requirement to complete their statutory & mandatory training and core subjects for the larger organisation have now been agreed and implemented. Appraisals: Appraisal compliance has fallen 4.5% to 70.46% in June. A total of 155 were completed out of 419 due. Actions to help increase compliance rates and to have “good quality appraisals” are being taken forward as part of the Staff Experience & Improvement Plan. Managers are being informed of areas to target, including new managers who have taken on new staff as part of the acquisition. Bullying and harassment cases: Since last month the number of cases being managed under the pathways has increased by two. Specific actions to support a reduction in Bullying & Harassment are being taken forward as part of the Staff Experience & Improvement Plan. Measures for bullying and harassment in the combined Trust are being developed.
Paper 3.3 (Revised 29 July 2014)

Trust Performance DashboardMonth: June 2014
Summary
Excellent Outcomes Excellent Financial Performance
Month Trend YTD Month Trend YTD
Standardised Mortality Rate G G Monitor CSRR G G
Health Care Acquired Infection G G Total Activity
% EBITDA A A
% QIPP Savings Achieved A A
Excellent Experience Excellent ComplianceMonth Trend YTD Q2 Q3 Q4 Q1
Friends & Family Test A&E 37 37 Monitor Governance Score A - g G G G
Friends & Family Test Inpatients 41 44
GP Market Share G G Q2 Q3 Q4 Q1
CQC Outcome Rating G
CQC Intelligent Monitoring Rating 2 4 4
2013/14 2014/15
Paper 3.3 (Revised 29 July 2014)
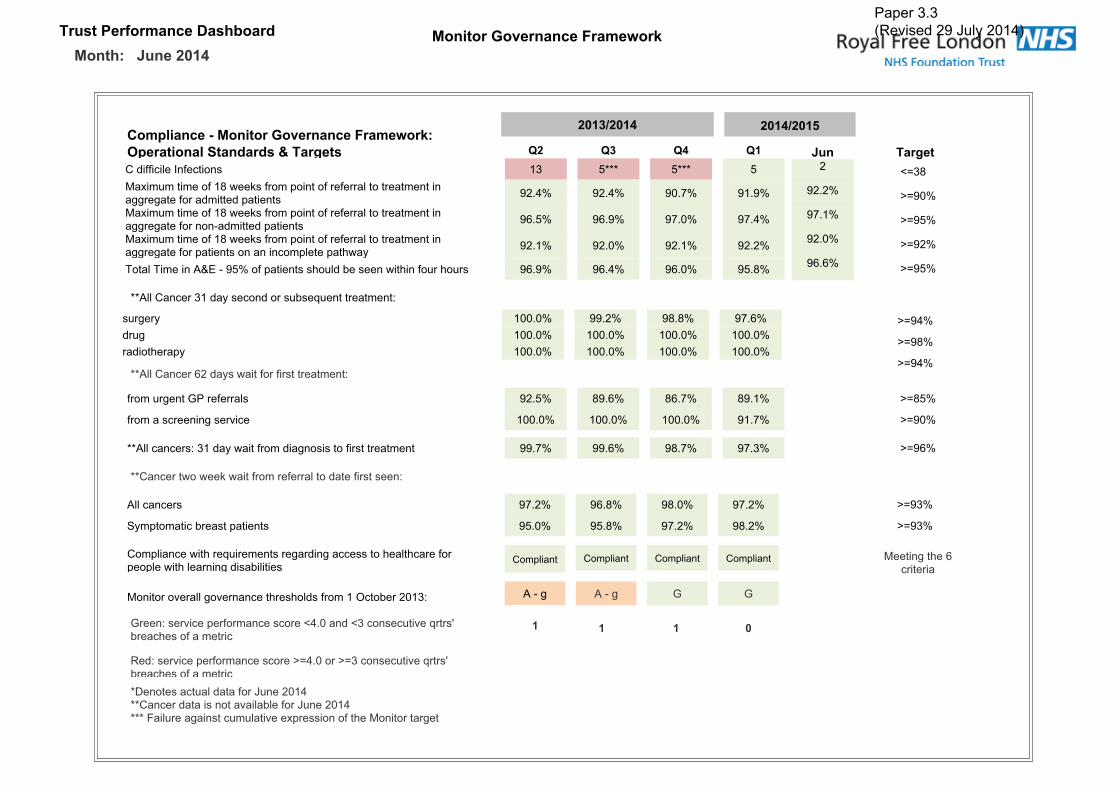
����������� ���� ���� �� ������������� ����� ���������������������
!��"#� ���$�������������� ����� ������%"� ���� #�&� �� ����'�� �(�� )� )* ) )����������������� �� �� ���� ���� ������������� ����������� ��� ���� ���������� �������������������� ����������������� �� !" �� !" �# $" �� �"
������������ ����������� ��� ���� ���������� �������������������� ��� �%��������������� �& �" �& �" �$ #" �$ !"
������������ ����������� ��� ���� ���������� �������������������� ���������� �������� ��������'��( �� �" �� #" �� �" �� �"
) ����)������*+,�%���"� �����������' ����-�������'���� ���' ��� �& �" �& !" �& #" �� �"
��� �� �(�� ./��
�� �" 0/�#"�$ �" 0/��"�� #" 0/��"�& &" 0/��"
0/�!"
0/��"
0/�!"
0/��"
0/�#"
0/�&"
0/��"
0/��"
��*��������������(��� ��� ����-�1�����������2
��*���������&����(�������� ���������������2
���������� ����������� ���������� �������������2
�������'�&�������
3��2���4������ �������� ��.! #�����.��� ������4�1����5-���'�� ���������
�����( �## #" �� �" �� �" �$ &"���� �## #" �## #" �## #" �## #"���� �'���( �## #" �## #" �## #" �## #"
�� ��������36�������� �� �" �� &" �& $" �� �"
�� ��������������4�� �## #" �## #" �## #" �� $"
��*���������2������(�������� ������� ����� �������������� �� $" �� &" �� $" �$ �"
*��������� �$ �" �& �" �� #" �$ �"
7(��� ������-������������ �� #" �� �" �$ �" �� �"
� �����������'��1������������������������ �'���'����� �� ������'�������������-������
� �������
� ��� �� 4������ 4�������'��' ������ ����8�� -���#��2� *�%��
9�2���4������ �������� ��0/! #� ��0/��� ������4�1����5-���'� � � ������:� ���������������� ��;����#�!����������������� ���4����-��� ��;����#�!����<����������������������4������� �� ���'�� ��� �������
� � � �
� ������� � ������� � �������
*�%�� 3 3
��� +���,���*+���
Paper 3.3 (Revised 29 July 2014)
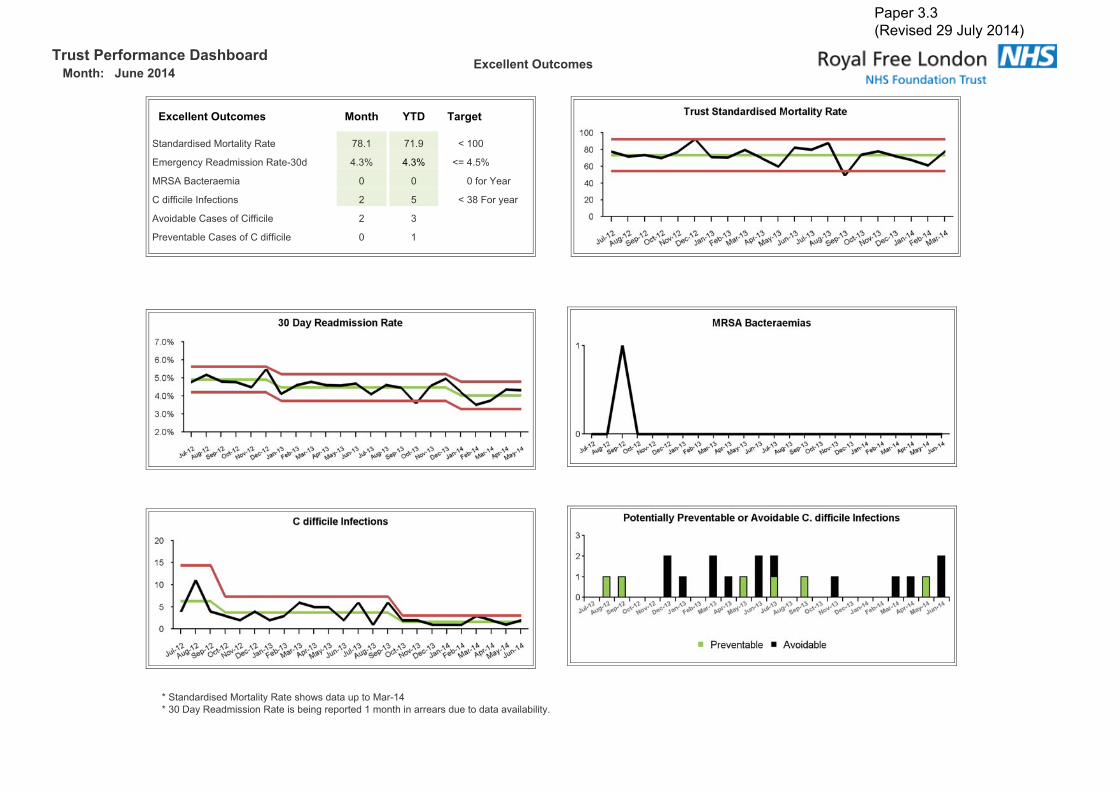
����������� ���� ���� ������������������
-.�##���%������
-.�##���%������ ����� /�� � �(�
7������������ ������(�9�� $� � $� � . �##
,�����(�9������� ��9��%�#� ! �" ! �" ./ ! �"
�97*�=�������� # # #�� ��>��
���������������� �� � � . ���< ��(��
*4 ���-������� ���������� � �
6�4���-������� ������������ # �
��7������������ ������(�9����' ������������ ����%�!���#�:�(�9������� ��9������-������ ������� ��'��������������� �������4����-����(
Paper 3.3 (Revised 29 July 2014)

����������� ���� ���� ������������������ -.�##���%������
-.�##���%������ ����� /�� � �(�
3����0/��6������?���� $ �� ./ ��!
6������<���������###�=��:�(��� � ! ! � ./ ! �
<�����9�����������@����� �� �� ./ �!�
A4��,4��� # � A �
������� ��@���'����9�����B), $ �� ./ &�
��6����������������###�-����(�C�������������������'��������� ������� ��'���������� ��B),����-������ ������� ��'��������������� �������4����-����( 6����� ���'����������� ��,�������8��� ��� ���'�������������� ��&�� ��'���� ���-�����������������������' ��
Paper 3.3 (Revised 29 July 2014)
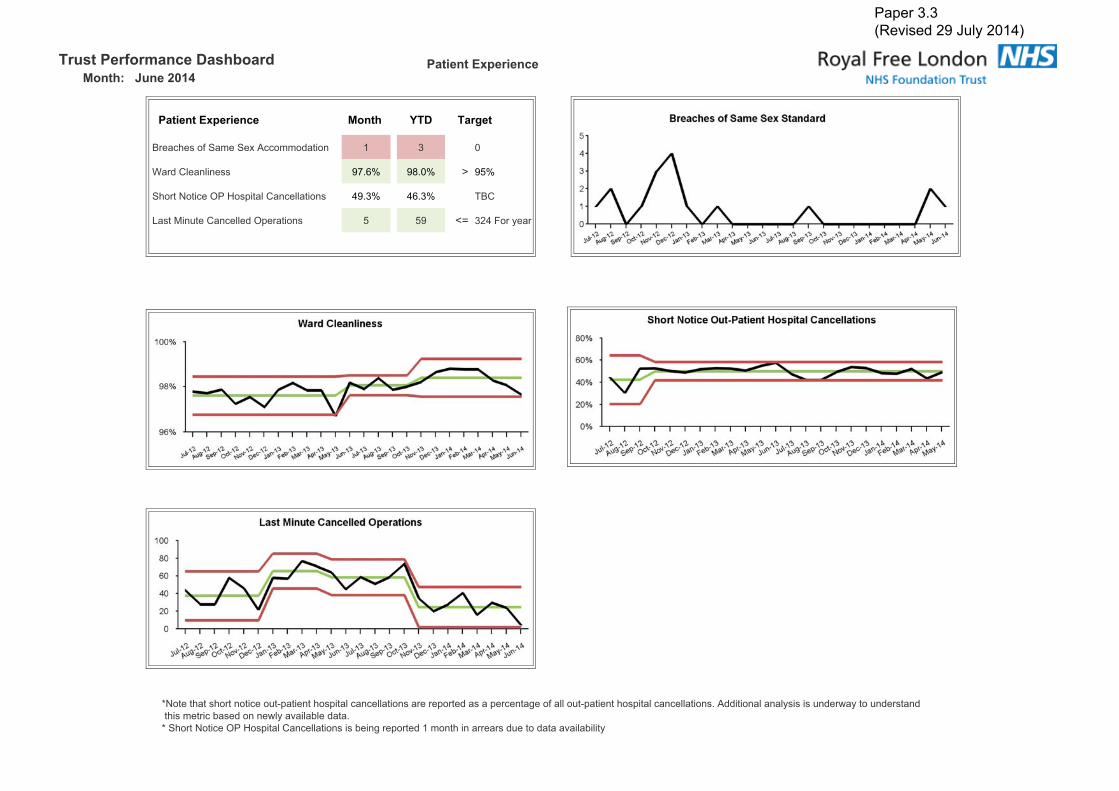
����������� ���� ���� ������������������
� �����-."����
� �����-."���� ����� /�� � �(�
=���'�� ��7���7��*�� �� ���� � � � #
D������������� �$ &" �� #" 0 ��"
7' ���A ����86�@ ���������������� �� !� �" !& �" )=�
E������������������8����� �� � �� ./ ��!�< ��(��
�A ���'����' ���� ���� ��%�������' ���������������� �������� ����������������� ������ ��%�������' ���������������� �� �*����� ��������(�������������(�� ������������'���������-���� �����(��4����-������ ��7' ���A ����86�@ ���������������� ������-������ ������� ��'��������������� �������4����-����(�
Paper 3.3 (Revised 29 July 2014)

0���-."��������������������
����������� ���� ���� ��
0���-."���� ����� /�� ���� �(�
<<)�) ����9�� ���9�� !� �" !� �" 0/ ��"
<<)�*+,�7� � �$ �$ 0/ ��
<<)��%6������7� � !� !! 0/ !�
�%6������:���'�����-(����� � �" & $" 0/ �� �"
D����:���'���� �$ �" �� �" 0/ �$ �"
< ������ ���������9��4� &� �$$ %
������� ��,�� ���� !� �#! ��� 4���
��������� ���� �������� ������� ��'���������� �
Paper 3.3 (Revised 29 July 2014)

Trust Performance Dashboard
Month: June 2014
(Data relates to Apr 12 to Mar 14)
Market Share
RFH Market Share Month YTD Last YTD
NCL & Brent New OP Share 21.6% 19.3% 14.8%
Barnet New OP Share 43.4% 36.6% 31.1%
Camden New OP Share 53.8% 46.7% 37.6%
(Share sourced from Dr Foster)
0%
10%
20%
30%
40%
50%
60%
Mar‐1
2
Apr‐1
2
May‐1
2
Jun‐12
Jul‐1
2
Aug‐1
2
Sep‐12
Oct‐1
2
Nov‐1
2
Dec‐1
2
Jan‐13
Feb‐13
Mar‐1
3
Apr‐1
3
May‐1
3
Jun‐13
Jul‐1
3
Aug‐1
3
Sep‐13
Oct‐1
3
Nov‐1
3
Dec‐1
3
Jan‐14
Feb‐14
Barnet CCG Share
RFH B&CF Others
10%
15%
20%
25%
30%
35%
40%
45%
50%
Mar‐1
2
Apr‐1
2
May‐1
2
Jun‐12
Jul‐1
2
Aug‐1
2
Sep‐12
Oct‐1
2
Nov‐1
2
Dec‐1
2
Jan‐13
Feb‐13
Mar‐1
3
Apr‐1
3
May‐1
3
Jun‐13
Jul‐1
3
Aug‐1
3
Sep‐13
Oct‐1
3
Nov‐1
3
Dec‐1
3
Jan‐14
Feb‐14
Camden CCG Share
RFH UCLH Others
Paper 3.3 (Revised 29 July 2014)
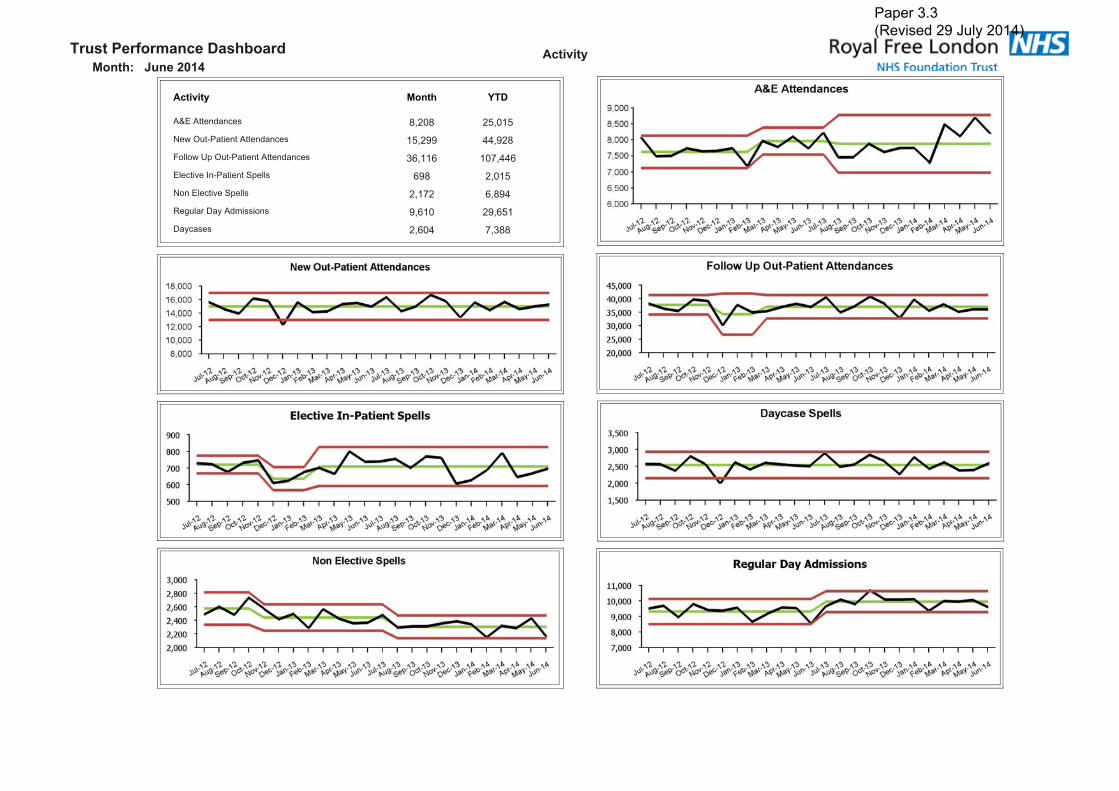
����������� ���� ���� �� �����������������������������
�������� ����� ���
������������� ��� ������������������������������ ������ ����� �������� ��������������������� !"���" ��#���"������$��%���������& ���� "� ���������������$��& ���� ���#� "� ��'�(��)�*+��,������� ��"�� ���"��*+���� ��"�� #�!
Paper 3.3 (Revised 29 July 2014)

� ������������������������������
����������� ���� ���� ��
������������� ����� ��� � �!�
*+����'�� #�- #�- ./ #�-
������$��0��(�1��2�&�+ �3� �3� 4/ �3!
���� ���5��*+����������$� ��� � ����# ����
����������$��0��(�1��2�&�+ "3� �3 4/ �3#
���� ���5��*+��������������$� ���#�" !"���� !#��#�
61��)������������ "�- "�- ./ #"-
5����,7�)� �#" � �
Paper 3.3 (Revised 29 July 2014)
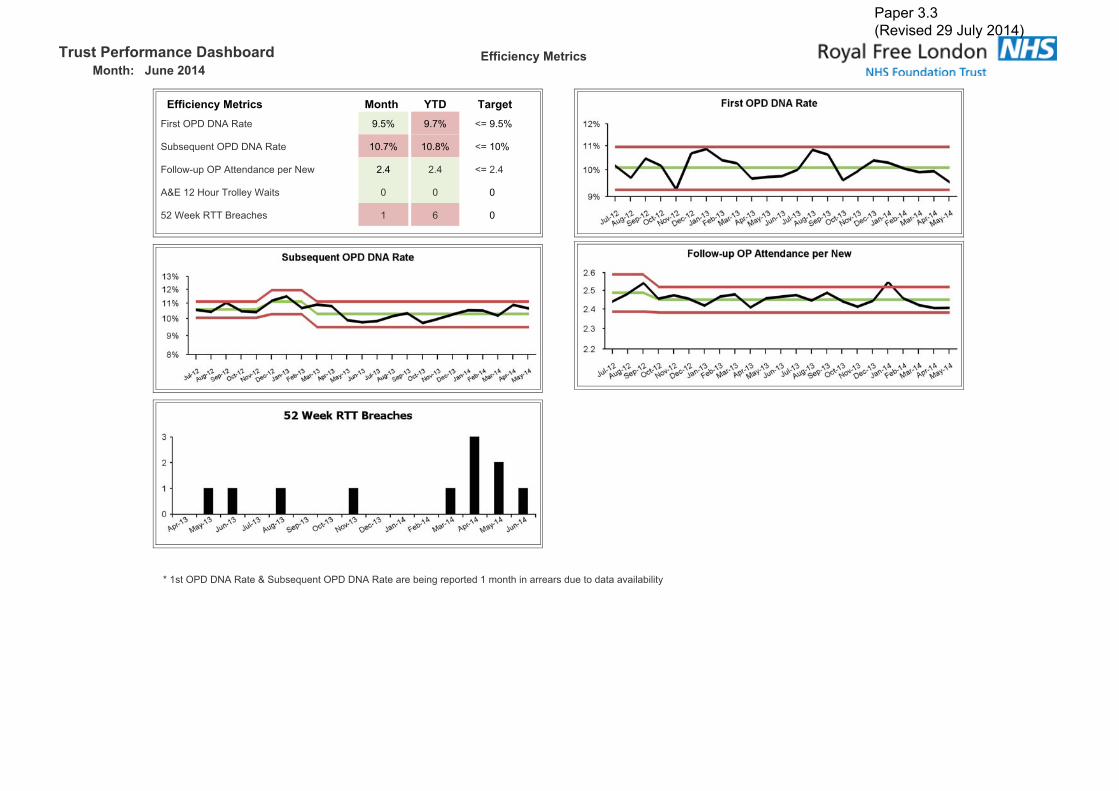
����������� ���� ���� �������������������
�������������
������������� ����� ��� ���� �!���)�����*�*���'�� �3�- �3#- 4/ �3�-
&�7��8�������*�*���'�� ��3#- ��3 - 4/ ��-
�������� ������������� �)���� �3� �3� 4/ �3�
�������9��)�6)����+�:��� � � �
���:��;�'66�5)��1�� � " �
<�������*�*���'�����&�7��8�������*�*���'���)��7���(�)� �)�����,���1����))�)����������$��7����+�
Paper 3.3 (Revised 29 July 2014)

����������� ���� ���� �������������������
"��#���
"��#��� ����� ��� � �!�
&��;�����=��7������'��< !3�- !3�- 4/ !3�-
&�22�6�)��$�) �!3#- � 4/ ��-
&�22�� )���� #�3�- � ./ �-
>���+�'�� ��3"- � 4/ ��-
?���)+���&�����)+�6)����( �3�- � ./ �-
5���+��(���1)��,�������� � ��
:�);2�)���������)��)�����+�)� �)������,���1����1��1���@�� ������2�6�)��$�)��1��1�����)�����(����������2�(�)�<�&��;����=�7������)� �)�����,���1����))�)�3
Paper 3.3 (Revised 29 July 2014)

����������� ���� ���� �������������������
������$��%&� ��
'�&&���(������ ����� ��� � �!�
6����6�,�������������-��2 ��������1����7����������1��
�"3"- ��3 - ./ ��-
� �:��;��'66���-��,���� ��3�- ��3�- ./ ��-
� �:��;��'66���-�����,����
�#3�- �#3�- ./ ��-
� �:��;��'66���-�%���, ���� ��3�- ��3�- ./ ��-
������1��A�?������)�,�$������ )������!������(�����1��)� ���������,����� �)2�),���
Paper 3.3 (Revised 29 July 2014)

����������� ���� ���� �� )� &����*���� ��������������������������
)� &����*���� ��������� ����� ��� � �!��)����)����2�0�,����B��������22����$������C��0B�<D �"� !�" 65B
>���,���2��������������(�������$���,������ ����� � &������
�$�)(��:���2�)���������������(�������$���,�������C:;�D �� � '�����(
������$���'�,��������,�)(���+����1�����+� �3�- �3#- 4/ �-
����������$���'�,��������,�)(���+����1�����*+� �3�- �3�- 4 �-
������$������1���)��� �)��$��0�&��2�4/��*+ ��3 - ��3 - 4 ���-
������$������1�������� �)��$��0�&��2�4/��*+ �#3�- �#3�- ./ #�-
<��)����)����2�0�,����B��������22����$������C��0B�D�)� �)�����,���1����))�)�3
Paper 3.3 (Revised 29 July 2014)

Trust Performance Dashboard Glossary
Category Indicator Definition
Total Time in A&E - 95% of patients seen within 4 hours Percentage of patients who spent 4 hours or less in A&E
MRSA number of cases against plan Number of attributable MRSA Bacteraemia cases, i.e. the number of bacteraemia acquired within the hospital
C Difficile number of cases against plan Number of attributable Clostridium Difficile cases reported, i.e. the number of infections acquired within the hospital
Maximum time of 18 weeks from point of referral to treatment in aggregate for
admitted patientsMaximum time of 18 weeks from point of referral to treatment in aggregate for admitted patients
Maximum time of 18 weeks from point of referral to treatment in aggregate for non‐
admitted patientsMaximum time of 18 weeks from point of referral to treatment in aggregate for non admitted patients
Maximum time of 18 weeks from point of referral to treatment in aggregate for
patients on an incomplete pathwayMaximum time of 18 weeks from point of referral to treatment in aggregate for patients on an incomplete pathway
All Cancer 31 day second or subsequent treatment ‐ surgery The proportion of cancer patients who have been waiting for a subsequent surgical treatment following the decision to undertake treatment.
All Cancer 31 day second or subsequent treatment ‐ drug The proportion of cancer patients who have been waiting for a subsequent drug treatment following the decision to undertake treatment.
All Cancer 31 day second or subsequent treatment ‐ radiotherapy The proportion of cancer patients who have been waiting for a subsequent radiotherapy treatment following the decision to undertake treatment.
All cancer 62 days wait for first treatment: from urgent GP referralsAll Cancers 2 Month Urgent GP Referral To Treatment; Percentage Of Patients Receiving Their First Definitive Treatment For Cancer Within 62 Days Of GP/Dentist Suspected
Cancer Referral; As Per National Cancer Waiting Times Definitions
All cancer 62 days wait for first treatment: from a screening service The number of patients receiving their first definitive treatment for cancer within two months (62 days) of urgent referral from the national screening service
All Cancers: 31 day wait from diagnosis to first treatment Percentage of patients receiving their First Definitive Treatment within 31 days of a decision to treat
Cancer two week wait from referral to date first seen ‐ All cancers Percentage of patients seen within 2 weeks following an urgent GP/Dentist cancer referral
Cancer two week wait from referral to date first seen ‐ Symptomatic breast patients Proportion of all patients referred with breast symptoms that were seen within 14‐days of referral
Monitor Framework
Paper 3.3 (Revised 29 July 2014)

Trust Performance Dashboard Glossary
Category Indicator Definition
Standardised Mortality RateThe number of spells resulting in death as a proportion of risk adjusted expected deaths (using Dr Foster casemix and risk adjustment). An
index < 100 represents fewer actual deaths than expected.
Potentially Avoidable C difficileCases of C difficile attributed to the Trust which may have been avoided by alternative testing approaches or actions OR preventable through
better antimicrobial stewardship or infection control measures to prevent transmission.
Emergency readmissions within 30 days Proportion of discharged spells that were readmitted as an emergency within 30 days, adjusted to take account of national Payment by Results
and local commissioner agreed Contract rules.
Grade >=2 Pressure UlcersThe number of hospital acquired pressure ulcers graded 2 and above. Pressure ulcers are classified 1 to 4 to reflect the depth of the tissue
injury from 1 (intact skin with non‐blanchable redness) to 4 (full thickness tissue damage).
Patient Falls per 1000 Bed Days Number of patient falls per 1000 occupied bed days
Falls Resulting in Harm
The number of falls‐related incidents that resulted in physical harm, irrespective of the type/severity of that harm.
Data excludes no harm incidents, prevented incidents (near misses) and incidents that resulted in psychological harm.
Never Events
A count of nationally defined serious and largely preventable patient safety incidents in the previous month that should not have occurred if
the available preventative measures have been implemented.
Incidence of Healthcare Related VTE Records the number of patients admitted with a primary or secondary diagnosis of venous thromboembolism.
Breaches of Same Sex ProvisionNumber of patients who have to share sleeping accommodation, toilets or bathrooms with a patient of the opposite sex or who have to pass
through opposite sex accommodation to reach their own toilets and bathrooms without clinical reason
Ward Cleanliness The Trust scores in the National Standards Of Cleanliness Audit
Short Notice Outpatient Hospital CancellationsNumber of outpatients who had their first or subsequent appointment cancelled by the trust within 6‐weeks of the appointment date as a
percentage of all first and subsequent appointments cancelled by the trust.
Last Minute Cancelled Operations Proportion of electively admitted patients whose operation was cancelled for Non Clinical Reasons on the day of or following admission.
Excellent Outcomes
Patient Experience
Paper 3.3 (Revised 29 July 2014)

Trust Performance Dashboard Glossary
Category Indicator Definition
Patient Experience In‐patient Friends and Family Score Average score for responses to the in‐patient friends and family test.
A&E Friends and Family Score Average score for responses to the A&E friends and family test.
Total Friends and Family Response Rate Average response rate to the friends and family test.
Formal Complaints Received Average Score for responses to questions relating to Dignity & Respect in an inpatient setting
Inpatient Discharges by 11am Average Total score for patient satisfaction survey questions
Weekend Discharges Proportion of all inpatient discharges that were discharged at the weekend .
Medication Errors Number of medication error related incidents reported via the trusts reporting system.
Paper 3.3 (Revised 29 July 2014)

Trust Performance Dashboard Glossary
Category Indicator Definition
Barnet New OP Share Royal Free market share (%) of all first outpatient attendances as a result of a GP referral from Barnet PCT
Barnet New OP GP Referrals Royal Free volume (n) of all first outpatient attendances as a result of a GP referral from Barnet PCT
Barnet New OP Non‐GP Referrals Royal Free volume (n) of all first outpatient attendances as a result of a Non‐GP referral from Barnet PCT
Camden New OP Share Royal Free market share (%) of all first outpatient attendances as a result of a GP referral from Camden PCT
Camden New OP GP Referrals Royal Free volume (n) of all first outpatient attendances as a result of a GP referral from Camden PCT
Camden New OP Non‐GP Referrals Royal Free volume (n) of all first outpatient attendances as a result of a Non‐GP referral from Camden PCT
NCL & Brent New OP Share Royal Free market share (%) of all first outpatient attendances as a result of a GP referral from NCL PCTs & Brent PCT
NCL & Brent New OP GP Referrals Royal Free volume (n) of all first outpatient attendances as a result of a GP referral from NCL & Brent PCT
NCL & Brent New OP Non‐GP Referrals Royal Free volume (n) of all first outpatient attendances as a result of a Non‐GP referral from NCL & Brent PCT
A&E Attendances Total Number of attendances at all A&E Departments
New OPD Attendances First Appointment Attendances to outpatient clinics; Private patients excluded
Follow Up OPD Attendances Subsequent Attendances to outpatient clinics; Private patients excluded
Follow Up OPD Attendances Subsequent Attendances to outpatient clinics; Private patients excluded
Elective Inpatient Spells Number of inpatients discharged from a spell with an elective admission method; Private patients excluded
Daycases Number of patients discharged from a daycase spell; Private patients excluded
Non‐elective Inpatients Number of patients discharged from a n emergency spell, includes Maternity, Transfer, Other; Private patients excluded
Regular Day Admissions Number of patients discharged from a regular day spell; Private patients excluded
Activity
Market Share
Paper 3.3 (Revised 29 July 2014)
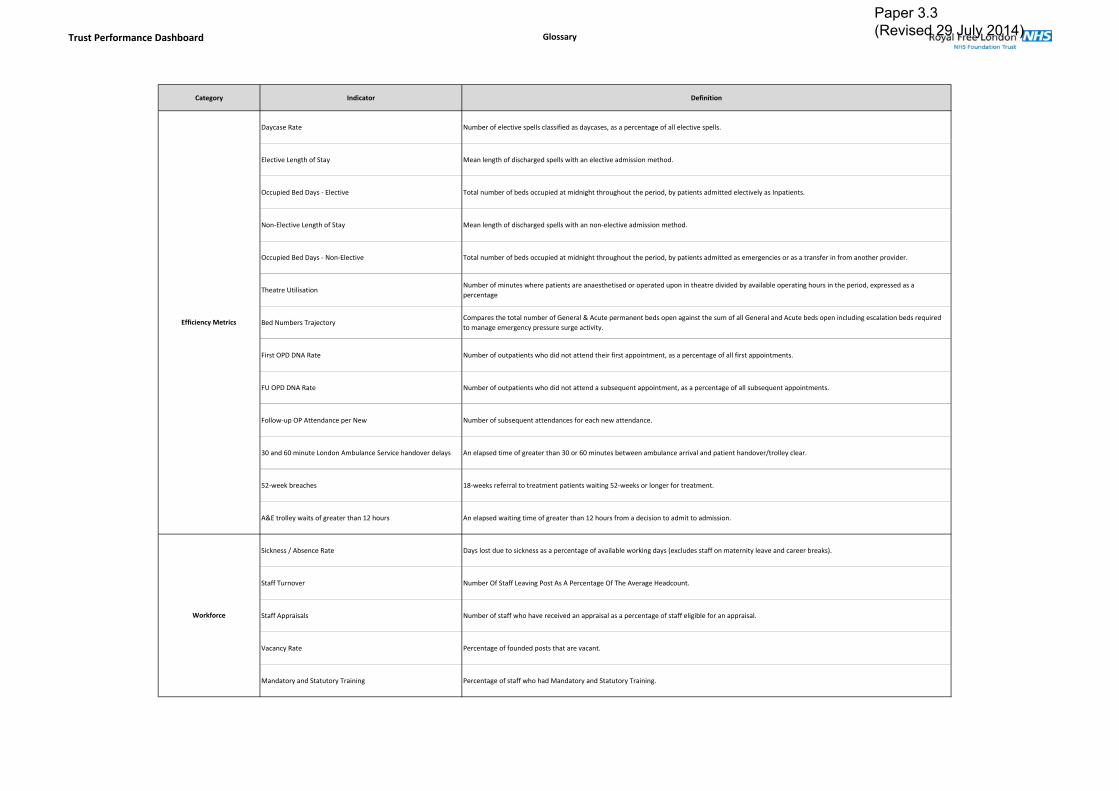
Trust Performance Dashboard Glossary
Category Indicator Definition
Daycase Rate Number of elective spells classified as daycases, as a percentage of all elective spells.
Elective Length of Stay Mean length of discharged spells with an elective admission method.
Occupied Bed Days ‐ Elective Total number of beds occupied at midnight throughout the period, by patients admitted electively as Inpatients.
Non‐Elective Length of Stay Mean length of discharged spells with an non‐elective admission method.
Occupied Bed Days ‐ Non‐Elective Total number of beds occupied at midnight throughout the period, by patients admitted as emergencies or as a transfer in from another provider.
Theatre UtilisationNumber of minutes where patients are anaesthetised or operated upon in theatre divided by available operating hours in the period, expressed as a
percentage
Bed Numbers TrajectoryCompares the total number of General & Acute permanent beds open against the sum of all General and Acute beds open including escalation beds required
to manage emergency pressure surge activity.
First OPD DNA Rate Number of outpatients who did not attend their first appointment, as a percentage of all first appointments.
FU OPD DNA Rate Number of outpatients who did not attend a subsequent appointment, as a percentage of all subsequent appointments.
Follow‐up OP Attendance per New Number of subsequent attendances for each new attendance.
30 and 60 minute London Ambulance Service handover delays An elapsed time of greater than 30 or 60 minutes between ambulance arrival and patient handover/trolley clear.
52‐week breaches 18‐weeks referral to treatment patients waiting 52‐weeks or longer for treatment.
A&E trolley waits of greater than 12 hours An elapsed waiting time of greater than 12 hours from a decision to admit to admission.
Sickness / Absence Rate Days lost due to sickness as a percentage of available working days (excludes staff on maternity leave and career breaks).
Staff Turnover Number Of Staff Leaving Post As A Percentage Of The Average Headcount.
Staff Appraisals Number of staff who have received an appraisal as a percentage of staff eligible for an appraisal.
Vacancy Rate Percentage of founded posts that are vacant.
Mandatory and Statutory Training Percentage of staff who had Mandatory and Statutory Training.
Workforce
Efficiency Metrics
Paper 3.3 (Revised 29 July 2014)

Trust Performance Dashboard Glossary
Category Indicator Definition
Procedures of Limited Clinical Effectiveness (PoLCE) Volume of procedures of limited clinical effectiveness carried out at the trust
Volume of Patients Awaiting Elective Admission Volume of patients that have been added to an elective waiting list awaiting admission
Average Wait for Patients Awaiting Elective Admission (Wks) Average waiting time for patients that have been added to an elective waiting list awaiting admission
Electives Readmitted as Emergency within 2 days
The volume and proportion of planned waiting‐list admissions that are readmitted as an emergency within 2 days of the previous discharge date.
Exclusions apply for patients with long term comorbidities (e.g.: patients with ongoing treatment for cancer).
An increasing rate may indicate that patients are being discharged too early and this is necessitating an emergency readmission
Electives with Pre‐Operative LoS of <=‐1 Day
The cohort of elective Inpatient admissions who are admitted on the day or day before their first procedure.
A high percentage of activity admitted less than 48 hours ahead of their procedure illustrates an efficient admission process where patients are not
admitted days ahead of their procedure date.
Electives with Post‐Operative LoS of <=2 DayThe proportion of elective Inpatient admissions who have a procedure and who are subsequently discharged from hospital less than 72 hours
later.
Volume of Outpatient Clinic Resources Used
Reports on the volume of chargeable clinic resources used throughout the period at the Royal Free Hospital. Clinic resources demonstrate the
individual clinical space / rooms and staff resources used to see Outpatients attendances.
In those specialties where a known recording change has meant meaningful comparisons between years is problematic they have been excluded.
Quality Governance Metrics
Paper 3.3 (Revised 29 July 2014)

Paper 3.4
Finance performance report – trust board July 2014 1
FINANCIAL PERFORMANCE REPORT JUNE 2014
Executive Summary
The June (month 3) year to date position is a deficit of £2.4m which is an adverse variance of £0.8m compared to plan.
The cash balance was £57.8m - this is £4.5m above plan. The Monitor Continuity of Service Risk Rating (CSRR) is 4 for the quarter against a
planned achievement of 4. The risk rating approved by the Board in the plan is 4.
Action required To note the financial position.
Equality impact assessment
No adverse impact
Report From Caroline Clarke, Director of Finance Author Mike Dinan, Interim Director of Financial Operations Date 23 July 2014
Report to
Date of meeting Attachment number
Trust Board
30 July 2014 Paper 3.4

Page 1
Paper 3.4
Paper 3.5
Integration Committee report – July board 2014
INTEGRATION COMMITTEE REPORT
Executive summary The integration committee met on 23 July 2014. The key issues discussed and decisions made) are outlined below.
The committee noted the progress report and budget update. The committee discussed the relationship between the initial focus on safety and
compliance, a later focus on integrating services and a longer-term focus on transformation.
It was agreed that the integration committee would have standing agenda items around key performance targets (A&E, Referral To Treatment (RTT), C difficile, performance, financial performance), senior leadership team bandwidth and communications.
The committee’s terms of reference would be reviewed at the September meeting.
Action required To note the report from the integration committee.
Trust governing objectives Board assurance risk number(s) 3 Excellent financial performance – to
be in the top 10% of relevant peers on financial performance
CQC outcomes supported by this paper 26 Financial position
Risks attached to this project / initiative and how these will be managed (assurance) Risks associated with the integration have been identified and are recoded in the integration risk register which also details mitigation actions.
Equality impact assessment No negative impact on equality and diversity.
Report From Dominic Dodd, chairman Author(s) John Ashcroft, service planning lead Date 22 July 2014
Report to
Date of meeting Attachment number
Trust Board
30 July 2014 Paper 3.5
Paper 3.6
Finance and performance committee report – July board 1
FINANCE AND PERFORMANCE COMMITTEE REPORT
Executive summary The finance and performance committee met on the 17th July 2014. The chair will provide a verbal report to the board at its meeting on 30th July 2014. The Committee reviewed performance against the annual plan for the year to date:
The month 3 year to date position is a deficit of £2.4m which is adverse to the financial plan by £0.8m
The current results have delivered Monitor ratings for Quarter 1 2014/15 of CSRR 4. Capital Expenditure was £0.8m (11%) behind plan year-to-date. The cash balance at the end of June is £57.8m which is £4.5m above plan.
The F&P Committee approved the month 3 financial performance report for submission to Monitor. The month 3 financial performance report will be reported to Monitor as part of the quarter 1 monitoring submission. The F&P Committee is approved the below statements for submission to Monitor: For Finance, that: The board anticipates that the trust will continue to maintain a financial risk rating of at least 3 over the next 12 months. For Governance that: The board is satisfied that plans in place are sufficient to ensure: on-going compliance with all existing targets (after the application of thresholds) as set out in Appendix A of the Risk Assessment Framework; and a commitment to comply with all known targets going forwards, other than those that are the subject of a governance adjustment per Monitor’s decision of 30 May 2014.
Action required The Board is asked note the statement approved for the Monitor submission for quarter 1 2014/15.
Equality impact assessment No adverse impact
Report From Dean Finch, Non-Executive Director and Chair of Finance and Performance Committee
Author(s) Mike Dinan, Director of Financial Operations Date 24 July 2014
Report to
Date of meeting Attachment number
Trust Board
30 July 2014 Paper 3.6

Paper 3.7
Clinical performance committee report – trust board July 2014
Report to
Date of meeting Attachment number
Trust board
30 July 2014 Paper 3.7
REPORT FROM THE CLINICAL PERFORMANCE COMMITTEE HELD ON 21 JULY 2014 Executive summary This paper summarises key issues discussed relating to clinical performance (below):
1. National Neonatal Audit Programme presentation. 2. Intensive Care National Audit and Research Centre presentation 3. CQC intelligence monitoring 4. The trust’s educational performance 5. Basildon and Thurrock University NHS Foundation Trust (BTUH) representatives 6. Identification of measures for the quality account priority 2
Action required For the board to note. Trust strategic priorities and business planning objectives supported by this paper
Board assurance risk number(s)
1 Improving clinical effectiveness and patient safety
CQC outcomes supported by this paper 8 Cleanliness and infection control 16 Assessing and monitoring the quality of service provision
Risks attached to this project / initiative and how these will be managed (assurance) n/a Equality impact assessment No adverse impact
Report From Anthony Schapira Date 24 July 2014
Paper 3.7
Clinical performance committee report – trust board July 2014
CLINICAL PERFORMANCE COMMITTEE: SUMMARY REPORT
1. Clinical Performance Committee Report
The committee agreed the following items for reporting at the board:
i) Neonatal audit presentation
Dr Vivienne van Someren, Consultant Paediatrician and Associate Medical Director for Revalidation and Professional Development, gave a presentation to the committee regarding the national neonatal audit programme (NNAP). In 2012 the NNAP highlighted that the Royal Free was an outlier in one of the indicators (ROP screening) and after further investigation this was found to be an issue with data entry. Data entry for the NNAP has been addressed by ensuring that the senior nursing staff has oversight of the data entry process. The trust had improved in all other NNAP indicators between 2011 and 2012. Dr van Someren noted that the acquisition of Barnet and Chase Farm would be an opportunity to drive up standards further as Barnet had previously had a better NNAP compliance rate and the bigger joint service now has a shared matron who will be able to oversee compliance on both sites.
ii) Intensive Care audit presentation Dr Banwari Agarwal, Consultant in Intensive Care Medicine and Service Lead for Intensive Care, gave a presentation to the committee regarding the trust’s data submissions to the Intensive Care National Audit and Research Centre (ICNARC). The trust had not been submitting data to ICNARC due to concerns around data accuracy. To focus on the issues preventing data submission Dr Agarwal and senior colleagues within the Intensive Care Unit formed the ICNARC Group and in June 2014 ICNARC invited the trust to rejoin the case-mix programme. Dr Agarwal highlighted several areas that had contributed to the halt in data submission, including resourcing shortages and a lack of an electronic system to aid data submission. To help address the staff resource for national audit submissions additional support for clinicians has been built into the proposed restructure of the clinical governance department. After a successful external bid for funding, the Intensive Care Unit will also have access to the electronic programme.
iii) CQC intelligence monitoring The committee received and reviewed the draft Care Quality intelligence monitoring report version 3 (July 2014) for both legacy trusts (Barnet and Chase Farm Hospital NHS Trust and Royal Free Hospital NHS Foundation Trust). The CQC has been issuing quarterly reports accumulated from metrics in the public domain and related to five key questions asked of all services, are they: safe, effective, caring, responsive and well-led. An overall summary banding is then created, by reviewing the proportion of indicators that have been identified as ‘risk’ or ‘elevated risk’ for each trust out of all the applicable indicators in the model. The CQC categorise trusts into one of six summary bands, with band 1 representing highest risk and band 6 the lowest. The Royal Free has been assigned Band 4 and Barnet and Chase Farm was assigned Band 2. In the July 2014 report there are two clinical performance areas where there is an elevated risk (table 1). On the previous April report the Royal Free had an elevated risk for both the Myocardial Ischaemia National Audit Project (MINAP) and patient-reported outcome measures (PROMS): EQ-5D Knee replacement (primary); the PROMS Knee replacement is no longer recorded as an elevated risk in the July report, but a clinician within the Orthopaedics team has been identified to do further work around why the trust was an outlier.

Paper 3.7
Clinical performance committee report – trust board July 2014
Table 1: Elevated clinical performance risks July 2014
Legacy trust Risk Comment Royal Free MINAP- 22 Proportion of
patients who received all the secondary prevention medications for which they were eligible
This has been reviewed and the issue was a data reporting, rather than clinical issue.
Barnet and Chase Farm
Patient-reported outcome measures (PROMS): Hip Replacement and Groin Hernia Surgery
NHS England is responsible from the PROMS outlier strategy, but the strategy itself is concerned principally with the identification of outliers rather than the causal factors which might result in a provider being identifies as such. However, the HES development team (HSCIC) have advised organisations to proceed with an analysis of patient level data and have provided trusts with PROMS provider reports. The Royal Free’s provider report requires further analysis to enable a metric to be developed to enable a better understanding of the causal factors of outliers.
iv) Education performance
GMC survey The committee reviewed the General Medical Council National Trainee Survey for 2013-14 for both Barnet Hospital and the Royal Free. The survey provides a view of the quality of education and training from a trainee perspective.
The trust has received fewer red outliers across both sites of the organisation, in particular at the Barnet site due in part to significant services changes over the past year. Clinical supervision outliers generate specific interest as these are linked to patient safety; however, Royal Free site only has 1 concern in plastic surgery. There are 3 clinical supervision outliers for Barnet; ACCS, Anaesthetics and O&G. ACCS and Anaesthetics training at Barnet also have red outliers in other domains (and have done for the past two years) and are likely to be the specialty focus of HENCEL’s Annual Quality Liaison visit to Barnet site on 2nd September. Access to educational resources’ continues to be a concern at the Barnet. Further work needs to take place to fully explore reasons for this and to breakdown the data. HENCEL have offered support (including financial support) to help with this and the Medical Education Department will be working with HENCEL on improving this domain. Dr Aine Burns, Dean of Post-graduate Medical Education and the medical education team will work with
This year there are more green outliers in various specialities across the Royal Free site; these will be shared with the specialities who should be congratulated in achieving these. Any good practice relating to achievement in these areas will be submitted to HENCEL and shared across the organisation.
Paper 3.7
Clinical performance committee report – trust board July 2014
Undergraduate medical education survey The committee received the feedback report for 2013/14 blocks 1 and 2, which covers the period September 2013 – April 2014. The feedback is collated from online student evaluation questionnaires, providing a mixture of numeric and written feedback. The system provides an indicator of the quality of teaching provided for the module. The trust has seen steady improvement since the introduction of a new curriculum in September 2012 and the committee noted the excellent work of Dr Paul Dilworth, sub-dean of the Medical School at UCL for the Royal Free Campus, working with services to improve student feedback.
v) Basildon and Thurrock University NHS Foundation Trust (BTUH) representatives
The committee welcomed Dr Celia Skinner (Medical Director, BTUH) and Chris James (Assistant Director for Performance, BTUH) as part of the buddying agreement set up to assist BTUH, which had been placed into special measures following The Sir Bruce Keogh Review. The buddying programme is being supported by Dr Charlotte Hopkins (UCLP), who was also in attendance.
vi) Identification of measures for the quality account priority 2
The committee will identify measures for the quality account priority 2, in-patient diabetes care, with the specific aims to:
Improve meals and mealtimes for our inpatients with diabetes Improve the management of insulin and other diabetic medications on our ward Improve compliance with best practice on routine foot assessments for patients with
diabetes.
Paper 3.8
Strategy and Investment Committee report – July board 2014
STRATEGY AND INVESTMENT COMMITTEE REPORT
Executive summary The strategy and investment committee met on 10 July 2014. The key issues discussed and decisions made are outlined below:
The committee discussed the draft strategic outline case for the redevelopment of Chase Farm Hospital and in particular the compromises to clinical performance, efficiency and patient/staff experience arising from the current estate configuration and quality. The committee requested that the board’s decision-making process for discussing the new development be further developed to incorporate the Royal Free’s standards for decision-making. It also asked that a forward plan be planned for how committee and trust board time would be used.
The committee received an update on the current performance and potential developments at the private patient’s unit. The committee considered that a fuller piece of work was needed to consider the longer-term strategy for the unit.
Action required To note the report from the strategy and investment committee.
Trust governing objectives Board assurance risk number(s) 3 Excellent financial performance – to
be in the top 10% of relevant peers on financial performance
CQC outcomes supported by this paper 26 Financial position
Risks attached to this project / initiative and how these will be managed (assurance) Strategic risks, including mitigation actions, are identified in the trust’s Board Assurance Framework.
Equality impact assessment No negative impact on equality and diversity.
Report From Dominic Dodd, chairman Author(s) Veronica Jackson, committee secretary Date 23 July 2014
Report to
Date of meeting Attachment number
Trust Board
30 July 2014 Paper 3.8

Paper 3.9
Patient & Staff Experience committee report – trust board July 2014 1
PATIENT & STAFF EXPERIENCE COMMITTEE REPORT
Executive summary This report is to inform the board of the matters discussed by the Patient & Staff Experience Committee at its meeting held on Friday 18th July 2014
Action required The board is asked to note the report
Trust strategic priorities and business planning objectives supported by this paper
Board assurance risk number(s)
2 Excellent user experience – to be in the top 10% of relevant peers on patient, GP and staff experience
R2.2
2 Excellent user experience – to be in the top 10% of relevant peers on patient, GP and staff experience
R2.4
CQC outcomes supported by this paper 1 Respecting and involving people
who use services 13 Staffing 14 Supporting staff 17 Complaints
Risks attached to this project / initiative and how these will be managed (assurance) N/A Equality impact assessment Positive impact which supports equity of service
Report From Deborah Sanders Director of Nursing Author(s) Diana Muggleston Patient experience manager Date 24 July 2014
Report to
Date of meeting Attachment number
Trust Board 30 July 2014 Paper 3.9

Paper 3.9
Patient & Staff Experience committee report – trust board July 2014 2
Patient & Staff Experience Committee Report 18 July
1. Mandatory and Statutory Training (MAST) report and Staff Experience Improvement Plan The 85% target for MaST compliance has now been achieved by RFL permanent staff (86% Q1), however, bank staff are still lower at 66%. This figure should continue to improve as bank staff are now paid during their MaST training time. The chair commended the success of the e-learning programme. 2. Patient Experience Improvement Plan The committee considered the revised patient experience improvement plan. The plan included actions in response to the poor score in relation to patients reporting having trust and confidence in nurses. 3. Cancelled Operations The trust is performing against both the recovery trajectory targets. There were 64 actual cancelled operations in the first quarter which is within the threshold of 80 cancellations for achievement of the 0.8% lower target. Further statistically significant reductions have occurred in the last 4 week period. If this improvement continues into a fifth week, a new step change down will be recorded. 4. Outpatients improvement plan The key areas for improvement are regarding reducing DNAs, reduction in first to follow-up ratio and improving the environment in the outpatients’ setting. The committee heard that proposals will be taken to the next Partnership Board to best utilise the Royal Free Charity donation to support improving the experience of patients in outpatients. 5. PALS & Complaints The committee considered the quarterly complaints and PALS reports (April to June) from the Royal Free hospital and the Barnet and Chase Farm Hospitals. The committee requested feedback from the director of nursing concerning issues related to nursing that were reported in the Barnet hospital report.