trusttalk - halliburton · trusttalk current news concerning your savings plan spring 2009 the...
TRANSCRIPT
TrustTalk Current news concerning your Savings Plan
Spring 2009
The Security of the Master Trust
Using Your Benefit Resources™
Your Opinion Matters
Three Different Ways to Save
Your Money
Choosing a Financial Advisor?
Ask These Five Questions First

Trust Talk is published quarterly by the Halliburton Trust Investments Department. It is designed to provide Halliburton Retirement and Savings Plan (Savings Plan) members with conventional wisdom on saving and investing. The information included in Trust Talk is not intended as investment advice. You may want to consult a financial advisor before making any investment decisions.
Suggestions or comments about Trust Talk can be sent to Sharon Parkes or Maria Bacaling, Trust Investments Department, 10200 Bellaire Blvd., Houston, Texas 77072.
Feature
The Security of the Master Trust 2
Using Your Benefit Resources™ 4
Your Opinion Matters 6
Lifestyles
Three Different Ways to Save Your Money 7
Investment Know-How
Choosing a Financial Advisor? Ask These Five Questions First 8
Focus on Funds
Conservative Premixed Portfolio 9
Newsstand
Market Update 10
Retiree Corner 11
Fund Performance Update 12
Inside This Issue
1
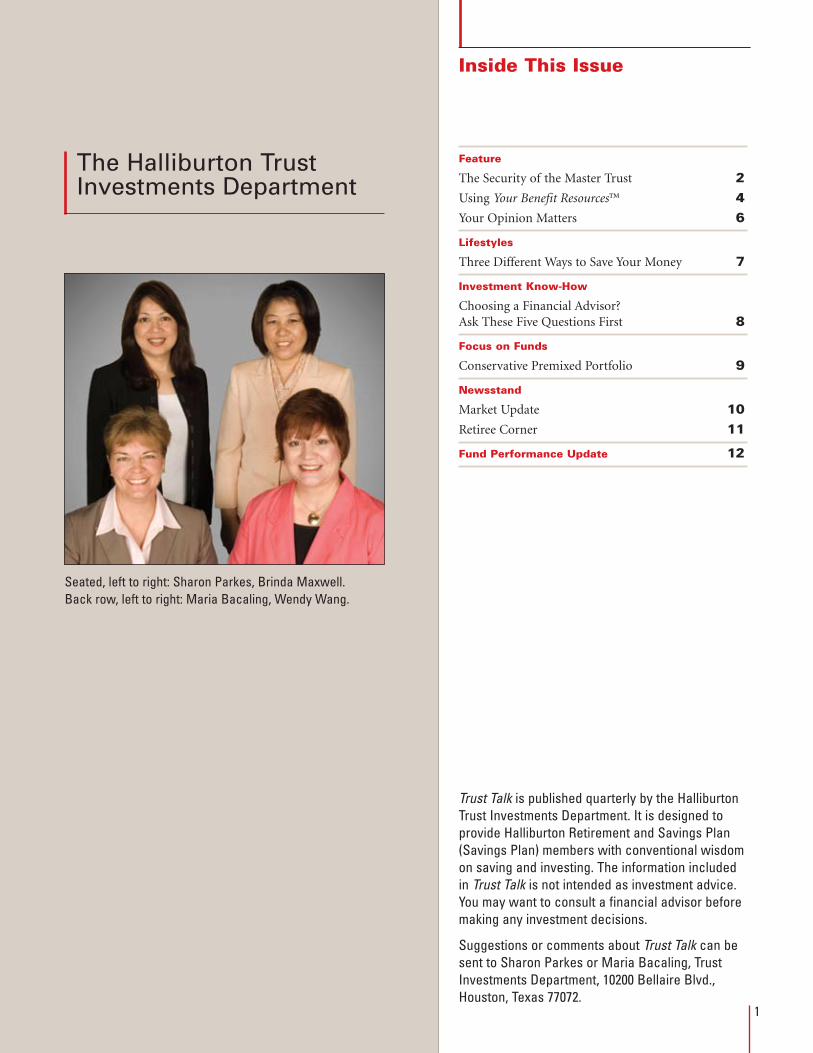
Seated, left to right: Sharon Parkes, Brinda Maxwell. Back row, left to right: Maria Bacaling, Wendy Wang.
The Halliburton Trust Investments Department

Lately employees have been asking, “how secure is
the money in my Savings Plan account?” Given the
recent events in the banking industry, this is a good
question. First of all, the Halliburton Retirement
and Savings Plan assets are held in a Master Trust.
The Master Trust is a legal entity that invests assets of all the
Company’s retirement plans. Managing the Savings Plan’s
assets on a consolidated basis provides greater investment
flexibility and lower operating cost.
According to the Employee Retirement Income Security
Act (ERISA), U.S. tax-qualified plan assets must be held
by a trustee. State Street Bank and Trust Company, based
in Boston, Massachusetts, serves as both the trustee and
custodian of all Trust assets. By law Trust assets must
be used only for the benefit of Plan participants and
beneficiaries, and are not subject to the claims of any
Halliburton creditors. These assets cannot be used by the
trustee or Halliburton.
State Street is one of the world’s largest custodians,
with approximately $12 trillion in assets under
custody and $1.4 trillion under management.
As custodian, in addition to providing
accounting and safekeeping, State Street
delivers cash management, compliance and
foreign exchange and performance
measurement services.
Oversight Provided by Halliburton’s Investment Committee
Halliburton’s President and Chief Executive Officer has
appointed an Investment Committee to oversee the
investment management of the Trust’s assets.
The Investment Committee acts on behalf of plan
participants to:
Establish the investment policy and objective for each
investment fund,
Select external professional investment managers, where
appropriate, and
Monitor the management of each fund.
The Investment Committee members have many years of
financial experience. The chairperson of the committee and
staff are devoted full-time to managing the Master Trust.
Most of the Master Trust’s investments are in separately
managed accounts which mean these accounts
are managed only for Halliburton plan
participants. Unlike the mutual fund
structure, the separately managed
Master Trust accounts provide the
Investment Committee with the
flexibility to furnish each manager
with broad guidelines, specific
•
•
•
The Security of the Master Trust
Feature
2
objectives and certain restrictions designed specifically for
the Master Trust.
State Street, the Investment Committee and all investment
managers act as fiduciaries to the Plan participants. This
means they must act with the care, skill and diligence that a
person acting in a similar capacity and who is familiar with
such matters would use under the current circumstances. It
is their job to protect your retirement funds, and it is a role
they take seriously and with a great deal of pride.
Can I Write Off My Losses?
DiD
Yo
u K
no
w?
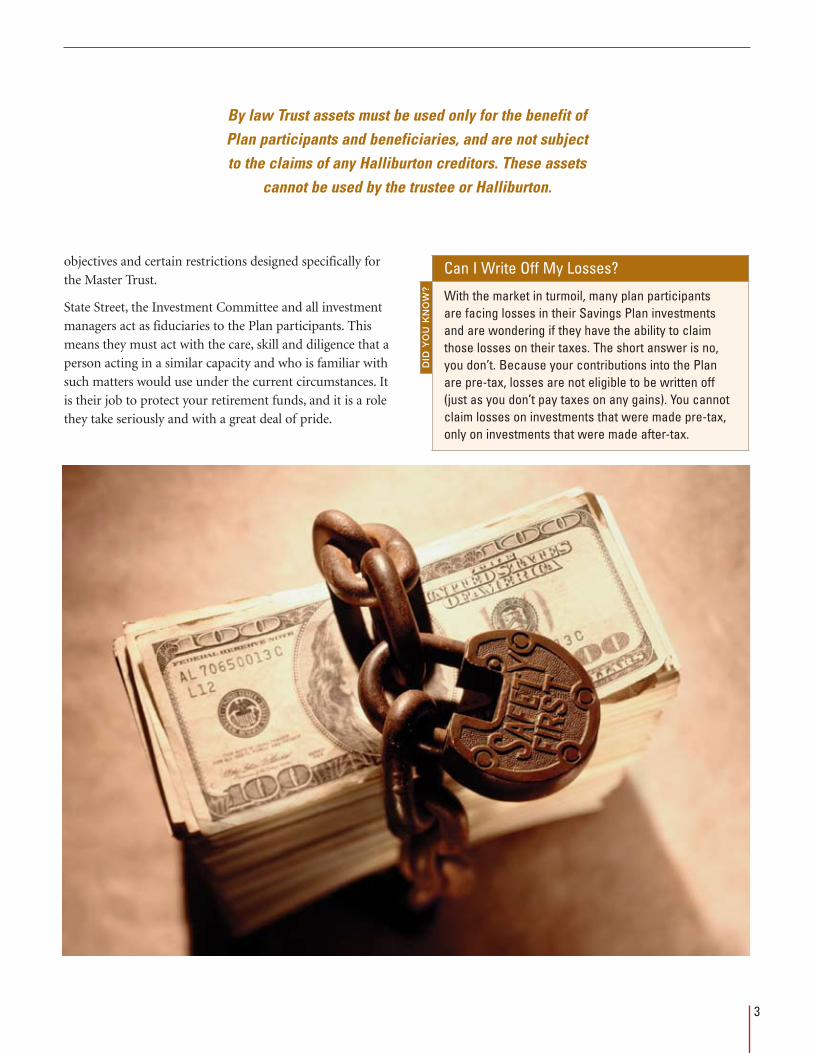
With the market in turmoil, many plan participants are facing losses in their Savings Plan investments and are wondering if they have the ability to claim those losses on their taxes. The short answer is no, you don’t. Because your contributions into the Plan are pre-tax, losses are not eligible to be written off (just as you don’t pay taxes on any gains). You cannot claim losses on investments that were made pre-tax, only on investments that were made after-tax.
By law Trust assets must be used only for the benefit of
Plan participants and beneficiaries, and are not subject
to the claims of any Halliburton creditors. These assets
cannot be used by the trustee or Halliburton.
�
Feature
To make the most out of the Savings Plan, you should use all of the tools available to you. One of the best tools you can use is the Your Benefits Resources™ (YBR) Web site. The site offers some exciting features, including:
Tools and calculators to help you manage your Savings Plan account,
An “Answer Center,” with answers to some of your most common questions, and
An easy to use and understand layout, which will be enhanced next fall to improve your online experience.
For help on how to save and invest for your future in the Savings Plan, the YBR Web site provides financial information to help you reach your retirement goals. You can:
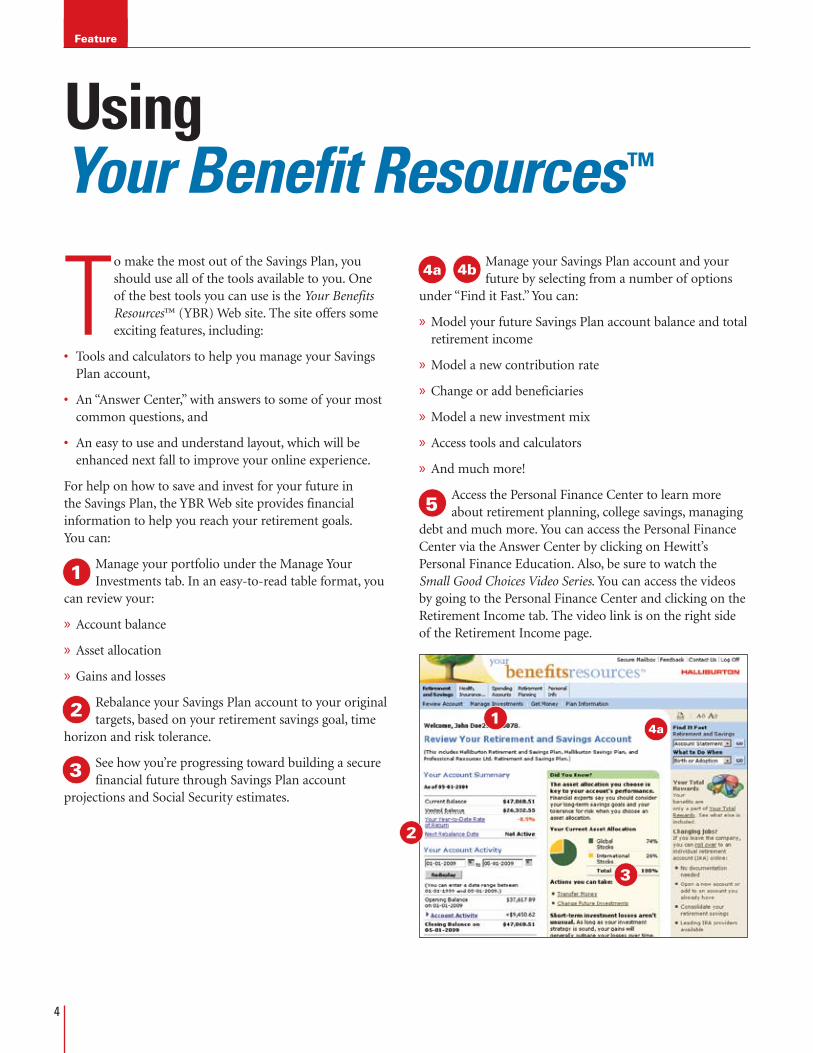
Manage your portfolio under the Manage Your Investments tab. In an easy-to-read table format, you
can review your:
Account balance
Asset allocation
Gains and losses
Rebalance your Savings Plan account to your original targets, based on your retirement savings goal, time
horizon and risk tolerance.
See how you’re progressing toward building a secure financial future through Savings Plan account
projections and Social Security estimates.
•
•
•
»
»
»
Manage your Savings Plan account and your future by selecting from a number of options
under “Find it Fast.” You can:
Model your future Savings Plan account balance and total retirement income
Model a new contribution rate
Change or add beneficiaries
Model a new investment mix
Access tools and calculators
And much more!
Access the Personal Finance Center to learn more about retirement planning, college savings, managing
debt and much more. You can access the Personal Finance Center via the Answer Center by clicking on Hewitt’s Personal Finance Education. Also, be sure to watch the Small Good Choices Video Series. You can access the videos by going to the Personal Finance Center and clicking on the Retirement Income tab. The video link is on the right side of the Retirement Income page.
»
»
»
»
»
»
Using Your Benefit Resources™
1
2
3
4a
4b
5
1
2
3
4a
4b
51
2
3
4a
4b
5
1
2
3
4a
4b
5
1
2
3
4a
4b
5
1
2
3
4a
4b
5
1
2
3
4a
4b
5
1
2
3
4a
4b
5
1
2
3
4a
4b
5
1
2
3
4a
4b
5
�

For More Information
If you have questions about your account or the Your Benefits Resources™ Web site, check out the Answer Center on the site or call the benefits center toll free at 1-800-535-8130. Benefits center representatives are available Monday through Friday from 8:30 a.m. to 5:00 p.m., Central Time (CT). The YBR Web site and automated telephone system are available Monday through Saturday, 24 hours a day, and Sunday after 12:00 p.m., CT.
Log on to the Your Benefits Resources™ (YBR) Web site at http://resources.hewitt.com/halliburtonbenefits to see how easy it can be to plan for a secure financial future and get the help you need to manage your Savings Plan account.
Your Password!
DiD
Yo
u K
no
w?
In order to access the Your Benefits Resources™ Web site, you’ll need your password. If you’ve forgotten or lost your password, you can check the Web site to check if you entered a “hint” that can help you remember. Or, you can use the site to request a new password be sent to you.
Log on to the Your Benefits Resources™ (YBR) Web site at
http://resources.hewitt.com/halliburtonbenefits to see how
easy it can be to plan for a secure financial future
1
2
3
4a
4b
5
1
2
3
4a
4b
5
What tools and calculators are available?
Impact to paycheck
Budget to save more
Power of compound interest
Impact of saving more
Taxable versus tax-deferred savings
Saving now versus later
Evaluate your savings strategy
•
•
•
•
•
•
•
�

Feature
Your Opinion Matters
Each quarter Trust Talk strives to provide you with valuable information on your Savings Plan investment options, along with basic information on saving and investing for your future. Halliburton feels that Trust Talk is an important
resource for our employees and we want the content to be meaningful to you and have impact.
Because Trust Talk is written to help you make the most of your retirement benefits and educate you on different investment strategies, issues and trends, you need to receive the information that will help you make your retirement and investment decisions. We need you to let us know if we’re making the grade.
To find out what you’d like to see in future issues of Trust Talk, we are asking you to complete a survey letting us know your thoughts, so we will know what you want and need. The survey asks a variety of questions, such as:
How much of Trust Talk you generally read
Would you like to receive Trust Talk in a different format, such as electronically
Which sections you find most — and least — useful
Where you go to find retirement planning information
What topics you’d like to see covered in upcoming issues of Trust Talk
We also want to know about your personal investment stories or strategies. Do you have a story about an investment decision you made that you’d like to share? Do you have tips on saving for retirement that would benefit your coworkers? If so, we’d love to hear about them. On the survey you’ll find an area where you can enter your e-mail address. You may be contacted and asked to share your story. You could be featured in an upcoming issue of Trust Talk.
We will take all of the feedback you provide on the survey and use it to determine the future direction of Trust Talk. This is your opportunity to weigh in and let us know what you think.
Get online and take the survey today! Go to http://www.halliburton.com/TrustTalkSurvey and complete the survey before June 30. Your opinion matters and we want to hear it.
•
•
•
•
•
�
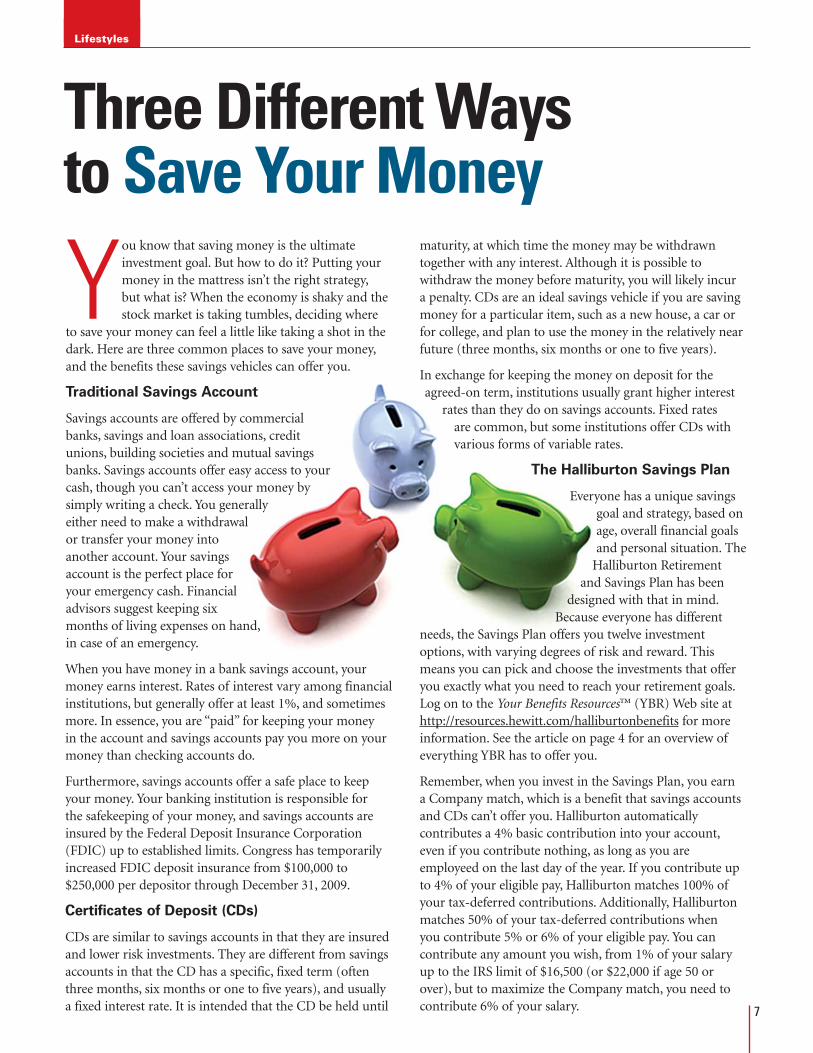
Lifestyles
You know that saving money is the ultimate investment goal. But how to do it? Putting your money in the mattress isn’t the right strategy, but what is? When the economy is shaky and the stock market is taking tumbles, deciding where
to save your money can feel a little like taking a shot in the dark. Here are three common places to save your money, and the benefits these savings vehicles can offer you.
Traditional Savings Account
Savings accounts are offered by commercial banks, savings and loan associations, credit unions, building societies and mutual savings banks. Savings accounts offer easy access to your cash, though you can’t access your money by simply writing a check. You generally either need to make a withdrawal or transfer your money into another account. Your savings account is the perfect place for your emergency cash. Financial advisors suggest keeping six months of living expenses on hand, in case of an emergency.
When you have money in a bank savings account, your money earns interest. Rates of interest vary among financial institutions, but generally offer at least 1%, and sometimes more. In essence, you are “paid” for keeping your money in the account and savings accounts pay you more on your money than checking accounts do.
Furthermore, savings accounts offer a safe place to keep your money. Your banking institution is responsible for the safekeeping of your money, and savings accounts are insured by the Federal Deposit Insurance Corporation (FDIC) up to established limits. Congress has temporarily increased FDIC deposit insurance from $100,000 to $250,000 per depositor through December 31, 2009.
Certificates of Deposit (CDs)
CDs are similar to savings accounts in that they are insured and lower risk investments. They are different from savings accounts in that the CD has a specific, fixed term (often three months, six months or one to five years), and usually a fixed interest rate. It is intended that the CD be held until
maturity, at which time the money may be withdrawn together with any interest. Although it is possible to withdraw the money before maturity, you will likely incur a penalty. CDs are an ideal savings vehicle if you are saving money for a particular item, such as a new house, a car or for college, and plan to use the money in the relatively near future (three months, six months or one to five years).
In exchange for keeping the money on deposit for the agreed-on term, institutions usually grant higher interest
rates than they do on savings accounts. Fixed rates are common, but some institutions offer CDs with various forms of variable rates.
The Halliburton Savings Plan
Everyone has a unique savings goal and strategy, based on age, overall financial goals and personal situation. The
Halliburton Retirement and Savings Plan has been
designed with that in mind. Because everyone has different
needs, the Savings Plan offers you twelve investment options, with varying degrees of risk and reward. This means you can pick and choose the investments that offer you exactly what you need to reach your retirement goals. Log on to the Your Benefits Resources™ (YBR) Web site at http://resources.hewitt.com/halliburtonbenefits for more information. See the article on page 4 for an overview of everything YBR has to offer you.
Remember, when you invest in the Savings Plan, you earn a Company match, which is a benefit that savings accounts and CDs can’t offer you. Halliburton automatically contributes a 4% basic contribution into your account, even if you contribute nothing, as long as you are employeed on the last day of the year. If you contribute up to 4% of your eligible pay, Halliburton matches 100% of your tax-deferred contributions. Additionally, Halliburton matches 50% of your tax-deferred contributions when you contribute 5% or 6% of your eligible pay. You can contribute any amount you wish, from 1% of your salary up to the IRS limit of $16,500 (or $22,000 if age 50 or over), but to maximize the Company match, you need to contribute 6% of your salary.
Three Different Ways to Save Your Money
7

Investment Know-How
When you’re considering help from a financial planner, you should interview and evaluate several financial planners to find the one that’s right for you. You will want to select a competent, qualified professional
with whom you feel comfortable and whose business style suits your financial planning needs. Aside from asking the most important question on your mind — how much do you charge and how will I be billed? — you should ask these five other questions too:
Question 1: What experience do you have?
It seems obvious, but make sure to ask how long the planner has been in practice. Also, find out if the planner sells products from only one company or a variety of companies — depending on what you need, this could make a difference. Don’t forget to ask for a brief history of his or her work experience and overall investment strategy.
Questions 2: What are your qualifications?
Ask the planner what licenses and certifications they have. Is the planner recognized as a CERTIFIED FINANCIAL PLANNER™ professional or CFP® practitioner, a Certified Public Accountant-Personal Financial Specialist (CPA-PFS), or a Chartered Financial Consultant (ChFC)? Look for a planner who has proven experience in financial planning topics such as insurance, tax planning, investments, estate planning or retirement planning. Ask how the planner stays up to date on changes and developments in the financial planning field.
Question 3: What services do you offer?
The services a financial planner offers depends on a number of factors including credentials, licenses and areas of
expertise. Generally, financial planners cannot sell insurance or securities products such as mutual funds or stocks without the proper licenses, nor give investment advice unless registered with state or Federal authorities. Some planners offer financial planning advice on a range of topics but do not sell financial products. Others may provide advice only in specific areas such as estate planning or on tax matters.
When financial planners earn money selling products, this can create a conflict between your financial goals and the
planner’s need to generate a commission. If you choose to work with an adviser who also sells products, determine if it will affect the planner’s recommendations. Look for a planner who is willing to fully disclose commissions up front.
Question 4: What is your approach to financial planning?
Ask the financial planner about his or her typical
client. Some planners prefer to develop one plan by bringing together all of your financial goals. Others provide advice on specific areas. Make sure the planner’s viewpoint on investing is not too cautious or overly aggressive for you. Find out if the planner will carry out the financial recommendations developed for you or refer you to others.
Question 5: Have you ever been publicly disciplined for any unlawful or unethical actions in your professional career?
Several government and professional regulatory organizations, such as FINRA and your state insurance and securities departments keep records on the disciplinary history of financial planners. Ask what organizations the planner is regulated by and contact these groups to conduct a background check.
Choosing a Financial Advisor? Ask These Five Questions First
�
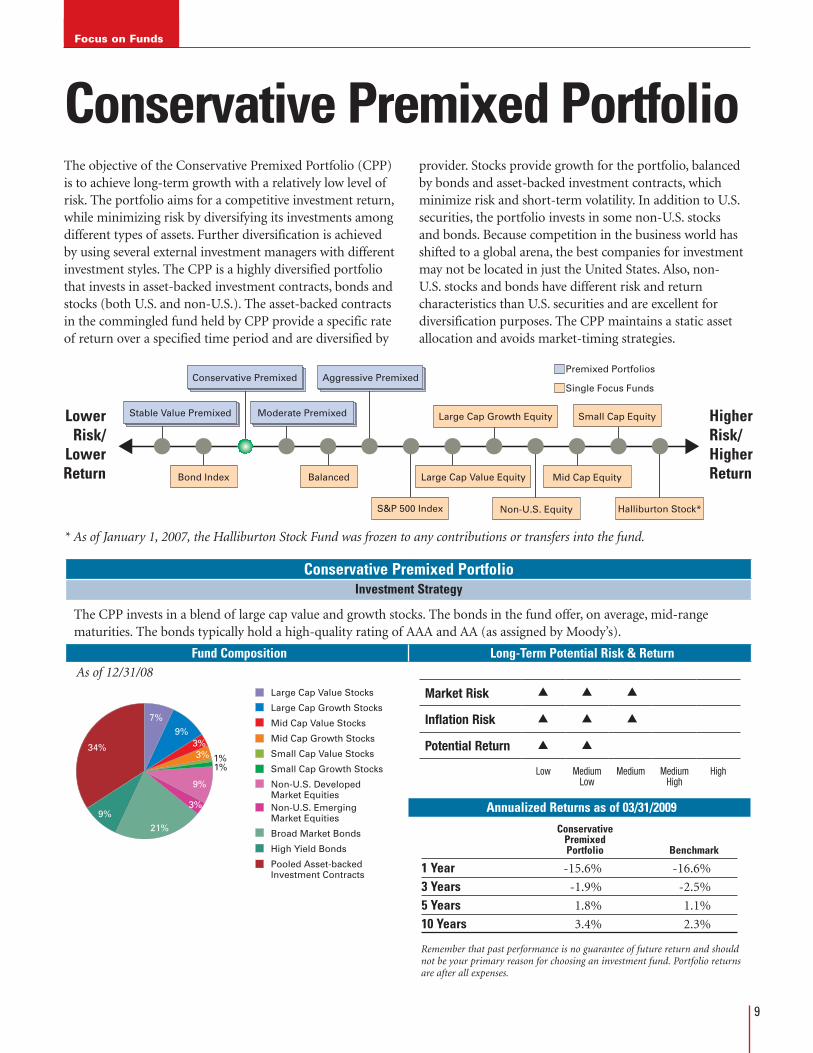
Conservative Premixed PortfolioInvestment Strategy
The CPP invests in a blend of large cap value and growth stocks. The bonds in the fund offer, on average, mid-range maturities. The bonds typically hold a high-quality rating of AAA and AA (as assigned by Moody’s).
Fund Composition Long-Term Potential Risk & Return
Focus on Funds
The objective of the Conservative Premixed Portfolio (CPP) is to achieve long-term growth with a relatively low level of risk. The portfolio aims for a competitive investment return, while minimizing risk by diversifying its investments among different types of assets. Further diversification is achieved by using several external investment managers with different investment styles. The CPP is a highly diversified portfolio that invests in asset-backed investment contracts, bonds and stocks (both U.S. and non-U.S.). The asset-backed contracts in the commingled fund held by CPP provide a specific rate of return over a specified time period and are diversified by
provider. Stocks provide growth for the portfolio, balanced by bonds and asset-backed investment contracts, which minimize risk and short-term volatility. In addition to U.S. securities, the portfolio invests in some non-U.S. stocks and bonds. Because competition in the business world has shifted to a global arena, the best companies for investment may not be located in just the United States. Also, non-U.S. stocks and bonds have different risk and return characteristics than U.S. securities and are excellent for diversification purposes. The CPP maintains a static asset allocation and avoids market-timing strategies.
Conservative Premixed Portfolio
Small Cap Equity
Mid Cap EquityLarge Cap Value Equity
Large Cap Growth Equity
Halliburton Stock*Non-U.S. EquityS&P 500 Index
Aggressive PremixedConservative Premixed
Balanced
Moderate Premixed
Bond Index
Stable Value Premixed HigherRisk/HigherReturn
LowerRisk/
LowerReturn
Premixed Portfolios
Single Focus Funds
Market Risk
Inflation Risk
Potential Return
Low MediumLow
Medium MediumHigh
High
▲ ▲ ▲
▲ ▲ ▲
▲ ▲
* As of January 1, 2007, the Halliburton Stock Fund was frozen to any contributions or transfers into the fund.
7%
9%
3%
1%1%
3%
3%
9%
21%
34%
9%
Large Cap Value Stocks
Large Cap Growth Stocks
Mid Cap Value Stocks
Mid Cap Growth Stocks
Small Cap Value Stocks
Small Cap Growth Stocks
Non-U.S. Developed Market EquitiesNon-U.S. Emerging Market Equities
Broad Market Bonds
High Yield Bonds
Pooled Asset-backedInvestment Contracts
As of 12/31/08
Conservative Premixed Portfolio Benchmark
1 Year -15.6% -16.6%
3 Years -1.9% -2.5%
5 Years 1.8% 1.1%
10 Years 3.4% 2.3%
Annualized Returns as of 03/31/2009
Remember that past performance is no guarantee of future return and should not be your primary reason for choosing an investment fund. Portfolio returns are after all expenses.
�
Markets Show Signs of Life Late in First QuarterInvestors started 2009 fearful due to rising unemployment (8.5%) and falling industrial production, uncertain as to what actions the government may take next to combat the global recession. Despite negative news, the market took a turn upward at the beginning of March and has continued to climb. Moves by both the U.S. and global governments seemed to calm investors’ fears. Investors began seeking out riskier investments, seeing value in dramatically oversold investments and becoming more comfortable with the programs outlined by the Treasury, Fed and Congress to increase cash flow in the economy and help stabilize the banking industry. In the U.S. the Financial Stability Plan was unveiled by the Treasury and the administration passed the American Recovery and Reinvestment Act. The Public-Private Investment Program (PPIP) and the Term Asset Loan Facility (TALF) provided further clarity to anxious investors. However, despite a strong rally in March, the returns from the equity market both domestically and internationally ended the quarter negative.
In January and February the U.S. equity market posted returns down in excess of 8% per month. The worst performing sectors for the first two months of the year were financials, industrials and consumer discretionary. However, the U.S. equity market posted a positive return in excess of 8% for the month of March with financials, consumer discretionary, materials and industrials as the strongest performing sectors. For the quarter overall, the S&P 500 returned -11.0%; growth stocks outperformed value stocks
and large cap outperformed small cap. Large cap growth showed the best market performance for the quarter, while small cap value showed the worst.
The international markets experienced performance similar to the U.S. markets, with the EAFE index down 13.9% for the quarter and 46.2% for the trailing year. A weak performance in January and February followed with an
upswing in March. International sectors such as financials and consumer discretionary — which had been the worst performing — were some of the top performing sectors in March. International governments have taken similar actions as the U.S. in combating the weak economies and lack of liquidity in the market. Several European nations cut rates during the first quarter and initiated stimulus packages. The emerging markets
mirrored the U.S. markets pattern of negative results for the first two months, followed by strong results for March (almost 15%). The emerging markets index return for the quarter was positive at 1%, due to the strong performance in March. Brazil was the best performing country for the quarter; Mexico had the lowest results.
In the bond markets, depressed prices and government action enticed investors back into areas that had been oversold and were frozen for much of 2008. For the first time since the second quarter of 2008, the Treasury sector not only underperformed all other sectors of the fixed income market, but also posted negative results for the quarter. The two best performing sectors were asset backed securities and high yield bonds, both returning over 6% for the quarter. New government-sponsored programs, such as TALF and the PPIP, eased investors’ fears and encouraged them to begin investing in these areas again.
Newsstand
Market Update
10

Newsstand
Your Recession Retirement StrategyYou can’t personally control a recession any more than you can control a storm. However, if you are prepared, you can weather a storm and come out with only a few scrapes and bumps. The same is true if the economy is in a recession and you are about to retire or are already retired. You can’t control the recession, but you can minimize the impact of a recession on your retirement by rethinking your strategy.
Allocate Those AssetsWhen you are retired, you get to set the rules for your day-to-day activities, but you still need to follow the basic rules of investing. A diversified portfolio is just as important after you retire as it was when you were saving for retirement. Asset allocation plays a key role in managing your retirement savings. Consider working with a financial planner to find the right investment mix based on your age, risk tolerance and personal circumstances. See page 8 for tips on choosing the right financial planner for you.
Adjust Your ExpectationsYou worked hard for your retirement savings and you want to enjoy the fruits of your labor. But during turbulent economic times, you may need to adjust your withdrawal rate and spend less. Financial experts generally suggest an annual savings withdrawal rate of 4-5% during retirement. However, during a recession, experts suggest that if you
reduce that rate to 3% or less it can help preserve more of your savings for the long term. This gives your assets more time to recover when the market rebounds.
Also, consider setting up regular transfers from your retirement savings to your bank account. You will feel as if you’re getting a “paycheck,” which can make it easier to plan and pay for your living expenses.
Minimize Your TaxesTaxes are still a part of life, even in retirement. However, you can take steps to minimize the amount of taxes you pay and keep as much of your retirement savings in your bank account as possible. Your personal financial needs and situation will help determine the best time to use certain types of income, but try to take withdrawals from tax-deferred accounts such as Traditional IRAs and the Savings Plan when your income tax rate is lower.
Review Your StrategyFinally, review your overall retirement strategy regularly so you know where you stand as the market changes. While reviewing your finances may not be the kind of retirement leisure activity you had in mind, it’s vital. Now more than ever you need to be on top of your savings and make adjustments as necessary. You can still enjoy your well-deserved retirement during a recession, with a few adjustments here and there. Remember that the best way to manage your investments is to have a plan that’s aligned with your situation and goals.
Retiree Corner
Diversif ieDPortfolio Asset
AllocAtion
ADjustWithDrAWAl
rAte
reDucesPenDing MiniMize
tAxes
rethinkstrAtegy
11
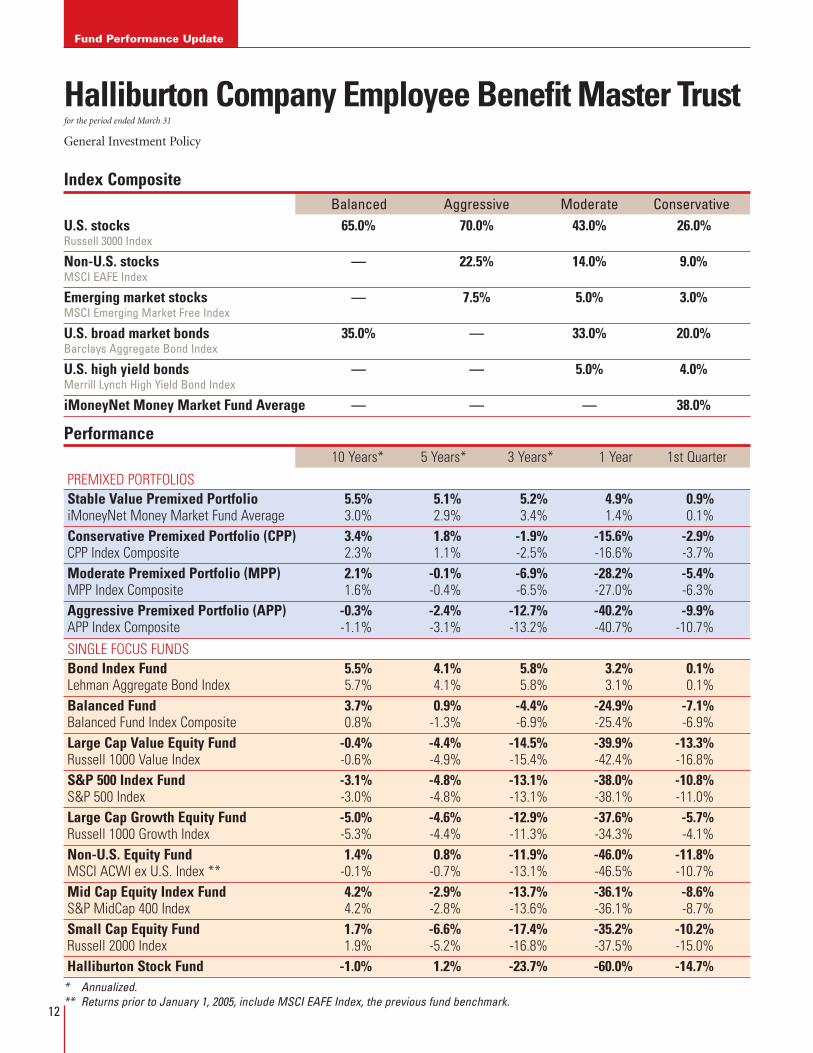
Halliburton Company Employee Benefit Master Trust for the period ended March 31
Index Composite Balanced Aggressive Moderate ConservativeU.S. stocks 65.0% 70.0% 43.0% 26.0%Russell �000 Index
Non-U.S. stocks — 22.5% 14.0% 9.0%MSCI EAFE Index
Emerging market stocks — 7.5% 5.0% 3.0%MSCI Emerging Market Free Index
U.S. broad market bonds 35.0% — 33.0% 20.0%Barclays Aggregate Bond Index
U.S. high yield bonds — — 5.0% 4.0%Merrill Lynch High Yield Bond Index
iMoneyNet Money Market Fund Average — — — 38.0%
Performance 10 Years* 5 Years* 3 Years* 1 Year 1st Quarter
PREMixEd PoRTfoLios Stable Value Premixed Portfolio 5.5% 5.1% 5.2% 4.9% 0.9% iMoneyNet Money Market fund Average 3.0% 2.9% 3.4% 1.4% 0.1% Conservative Premixed Portfolio (CPP) 3.4% 1.8% -1.9% -15.6% -2.9% CPP index Composite 2.3% 1.1% -2.5% -16.6% -3.7% Moderate Premixed Portfolio (MPP) 2.1% -0.1% -6.9% -28.2% -5.4% MPP index Composite 1.6% -0.4% -6.5% -27.0% -6.3% Aggressive Premixed Portfolio (APP) -0.3% -2.4% -12.7% -40.2% -9.9% APP index Composite -1.1% -3.1% -13.2% -40.7% -10.7%
siNgLE foCUs fUNds Bond Index Fund 5.5% 4.1% 5.8% 3.2% 0.1% Lehman Aggregate Bond index 5.7% 4.1% 5.8% 3.1% 0.1% Balanced Fund 3.7% 0.9% -4.4% -24.9% -7.1% Balanced fund index Composite 0.8% -1.3% -6.9% -25.4% -6.9% Large Cap Value Equity Fund -0.4% -4.4% -14.5% -39.9% -13.3% Russell 1000 Value index -0.6% -4.9% -15.4% -42.4% -16.8% S&P 500 Index Fund -3.1% -4.8% -13.1% -38.0% -10.8% s&P 500 index -3.0% -4.8% -13.1% -38.1% -11.0% Large Cap Growth Equity Fund -5.0% -4.6% -12.9% -37.6% -5.7% Russell 1000 growth index -5.3% -4.4% -11.3% -34.3% -4.1% Non-U.S. Equity Fund 1.4% 0.8% -11.9% -46.0% -11.8% MsCi ACWi ex U.s. index ** -0.1% -0.7% -13.1% -46.5% -10.7% Mid Cap Equity Index Fund 4.2% -2.9% -13.7% -36.1% -8.6% s&P MidCap 400 index 4.2% -2.8% -13.6% -36.1% -8.7% Small Cap Equity Fund 1.7% -6.6% -17.4% -35.2% -10.2% Russell 2000 index 1.9% -5.2% -16.8% -37.5% -15.0% Halliburton Stock Fund -1.0% 1.2% -23.7% -60.0% -14.7%* Annualized.** Returns prior to January 1, 2005, include MSCI EAFE Index, the previous fund benchmark.
General Investment Policy
Fund Performance Update
12

Performance NotesThe Bond Index, Balanced, Large Cap Value Equity, S&P 500 Index, Large Cap Growth Equity, Non-U.S. Equity and Small Cap Equity Funds were not in existence until April 1, 1999. The Mid Cap Equity Index Fund was not in existence until January 1, 2005. The Conservative Premixed Portfolio was introduced January 1, 2006.
In order to provide comparative historical returns, the managers’ return of their Halliburton Trust account is shown. If the Halliburton Trust had not employed a manager for the periods presented, the firm’s composite account return was added. All rates of return are net of expenses. Your rate of return may vary depending on your account activity (e.g., contributions, withdrawals, transfers, loans, etc.) and your plan’s administration expenses.
To help you better understand how your funds are performing, the funds are compared with composite returns or with appropriate indexes. The composites are created by blending together index returns in proportion to the investment policy of each fund (see chart). Because there are no indices comparable to the Stable Value Premixed Portfolio’s investments, we compare its return with money market funds tracked by iMoneyNet.
Performance data represents past performance; no assurance can be made regarding future results.
Index Definitions*
iMoneyNet Money Market Fund Average is an index of over 700 money market funds.
Barclays Aggregate Bond Index is an index of U.S. bonds, including government, corporate, mortgage-backed and asset-backed securities.
Merrill Lynch High Yield Bond Index is an index of U.S. corporate bonds that are rated less than investment grade but are not in default.
MSCI (Morgan Stanley Capital International) All Country World Index (ACWI) ex. U.S. is an index of non-U.S. stock securities listed on the stock exchanges of developed and emerging markets.
MSCI EAFE Index is an index of non-U.S. equity securities listed on the stock exchanges of Europe, Australasia and the Far East.
MSCI Emerging Market Free Index is an index of non-U.S. stocks traded in emerging markets.
Russell 1000 Growth Index focuses on the 1,000 largest companies in the Russell 3000 Index that have lower dividend yields and above-average growth rates.
Russell 1000 Value Index focuses on the 1,000 largest companies in the Russell 3000 Index that have higher dividend yields and below-average growth rates.
Russell 2000 Index measures the performance of the 2,000 smallest companies in the Russell 3000 Index.
Russell 3000 Index measures the performance of the 3,000 largest U.S. companies based on total market capitalization. It is used as a general measure of U.S. stock market performance.
Standard & Poor’s 500 Index is a popular standard for measuring large-cap U.S. stock market performance. The index includes a representative sample of 500 leading companies in prominent industries.
Standard & Poor’s MidCap 400 Index is a popular standard for measuring mid-cap U.S. stock market performance. The index includes a representative sample of 400 leading companies in prominent industries with a market capitalization of approximately $1 – $4 billion.
* You cannot invest in any of these indices. Fund holdings will differ from index holdings.
For account information, go to Your Benefits Resources™ at http://resources.hewitt.com/halliburtonbenefits or call the Benefits Center automated telephone system at 1-800-535-8130.

We encourage you to call the
Trust Investments Departm
ent at (2�1) �7�-��1� w
ith any suggestions or com
ments
regarding Trust Talk. You can expect the next issue in August 200�.
10200 Bellaire B
lvd.
Houston, TX 77072
PR
SR
T STD
US
PO
STA
GE
PAID
DA
LLAS
, TXP
ER
MIT 2650
FP
O