trying to quantify uncertainty - lse home · department of statistics public lecture trying to...
TRANSCRIPT

Department of Statistics public lecture
Trying to Quantify Uncertainty
Professor David SpiegelhalterWinton Professor of the Public Understanding of Risk, University of Cambridge and senior scientist, MRC Biostatistics Unit
Professor Anthony AtkinsonChair, LSE

Trying to quantifying uncertainty
David Spiegelhalter
winton professor of the public understanding of risk, university of cambridge
LSE, November 2010
With thanks to Mike Pearson, Ian Short, etc

www.understandinguncertainty.org
‘Professor Risk’ on Youtube


Why try to quantify uncertainty?
People should have an idea of the magnitudes of
• how likely something is
• how good or bad it might be

Risk communication using numbers?
A recent population survey asked
• Which of the following numbers represents the biggest risk of getting a disease:
1 in 100, 1 in 1000, 1 in 10 ?
% with incorrect answer:
Germany 28%
USA 25%


Going into hospital?
Deaths: 3735
Average number of beds occupied each day in English hospitals: 135,000
Average Micromorts per day: 75
Safety incidents in English hospitals reported to NHS National Patient Safety Agency July 2008 to June 2009

War or peace?
UK Deaths in Afghanistan:
12th July to 19th September 2010:
23 deaths
Average service-personnel per day:
10,000
Average micromorts per day:
33

Bird and Fareweather(2010)
icasualties.org


Expressing benefits and harms

Cochrane Collaboration “Summary of findings table”Uses GRADE scale for quality of evidence (in addition to confidence interval)


• Recently I went to see my GP …
• He told me I had a 12% chance of a heart attack or stroke over the next 10 years
• But I could take statins!


Using history
• History is not always a reliable guide


Current odds on Sarah Palin being the next President of the United States?
14:1 from William Hill, 17th Nov

Flipping coins

Two types of uncertainty
Aleatory
– chance, unpredictable
Epistemic
– lack of knowledge,
ignorance

Hepatitis C prevalence in UK

Quantifying your ignorance
• Think whether you prefer (A) or (B) for each question
• Then think of how confident you are with your answer
• Give your confidence a number 5 to 10
• Score yourself when you hear the correct answer

A short quiz
1. Which is higher, A) the Eiffel tower, B) Canary Wharf?
A (324m vs 235m)
2. Who is older, A) Prince William or B) Kate Middleton ?
B (Born 21/6/82 vs 9/1/82)
3. Which is older, A) LSE or B) Imperial College?
A (1895 vs 1907)
4. Which is larger, A) Belgium or B) Switzerland?
B (30 vs 41 000 sq km)5. Which is bigger, A) Venus B) Earth?
B (6051 vs 6371 km radius)6. Who died first, A) Beethoven or B) Napoleon?
B (1827 vs 1821)

• Seems harsh on errors
• 25 – (error)2
• A ‘proper’ scoring rule
• Encourages honesty

Bank of England Fan Charts
• If economic circumstances identical to today’s were to prevail on 100 occasions…
• Consequently, GDP growth is expected to lie somewhere within the entire fan on 90 out of 100 occasions

Can compare with what happened
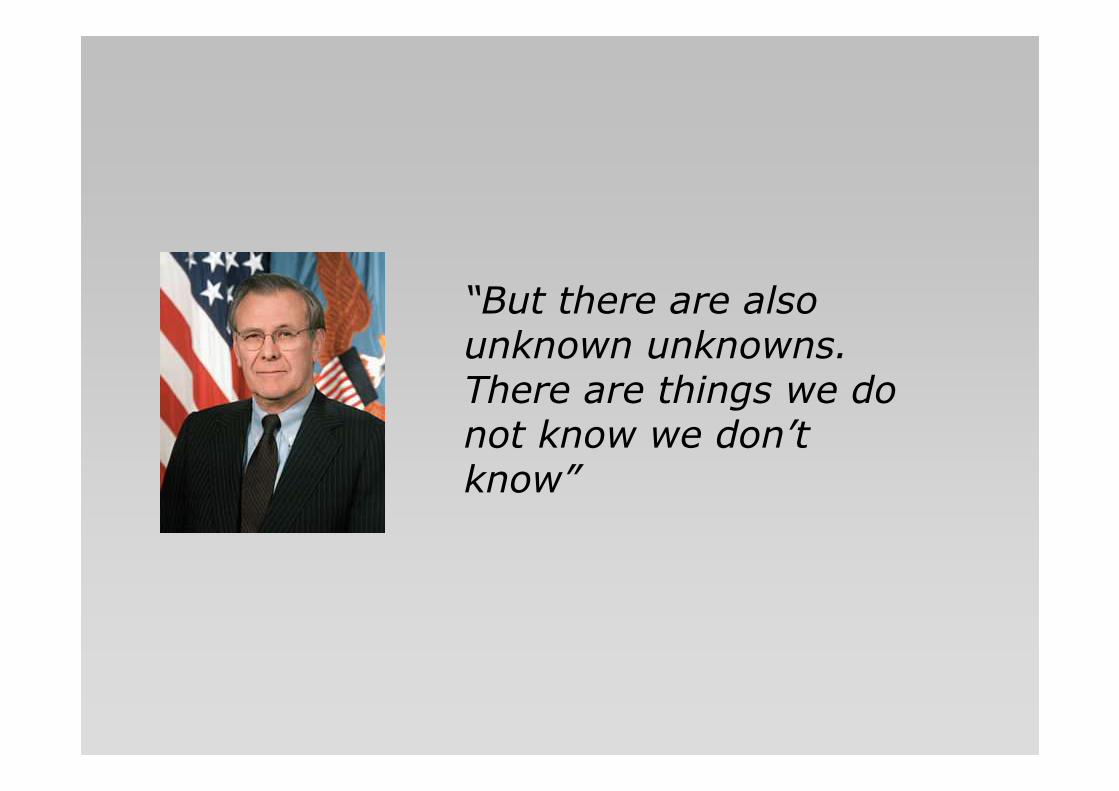
“But there are also unknown unknowns. There are things we do not know we don’t know”

Acknowledging deeper uncertainties
• Frank Knight 1921:
Risk: quantifiable
vs Uncertainty – not susceptible of
measurement
• Keynes 1937. “About these matters there
is no scientific basis on which to form any calculable probability whatsoever. We simply do not know.”

3. Model structure
1. Future events
2. Model parameters
5. Unknown inadequacies
4. Acknowledged inadequacies
Unavoidable unpredictability
‘Indeterminacy’
Limited information
Limited knowledge
‘Ignorance’

Expressing possible effects of factors left out of quantitative model

How can we communicate deeper uncertainties due to the quality of the evidence?
Part of GRADE scale used in Cochrane Collaboration and 25 other organisations to assess confidence in estimates of medicaltreatment effects

Guadalajara, May 2009


Government response to scientific uncertainty?
• ‘Worst case scenarios’ of 30% clinical cases, of which
– July 2009 : 1/300 die - 65,000 deaths
–Sept 2009: 1/1000 die - 19,000
• Ultra-precautionary planning – these were implausible combinations even given knowledge at the time
• In fact around 450 deaths
• Can we afford this level of caution?

How do people respond to risk?
Personal responses dominated by• Emotion and personality• Personal experiences • Feelings of control / imposition• Cultural beliefs about how society should be organised: individualist/communitarian, hierarchical/egalitarian• Trust (or lack of it) of authority• Familiarity / ‘dreadness’ of hazard• ‘Innocence’ of victims• Social norms
‘Probabilities’ are largely ignored

• Risk perception Slovic (1987) - ‘psycho-metric paradigm’

• Cultural theory (Douglas and Wildavsky, 1982


Synthesis: “Cultural cognition”

Egg Council said 1/1000 eggs double-yoked
So chance of 6 eggs = 1/1000 x 1/1000 …
= 1 in 1,000,000,000,000,000,000
What’s wrong with this?

Acknowledging uncertainty/error at different levels:
1. Event probability wrong: 2,000,000,000 half-dozen eggs in UK every year, and so would expect to wait 500,000,000 years for an event this rare to happen.
2. ‘Parameters’ are wrong: double-yokes more common in extra-large
3. ‘Model’ is wrong: eggs in a box are not independent, likely to come from similar batch

eggs
I had 6 double-yolks in the next box of eggs I bought!!

£2.49 from my local Waitrose

Models are like guide books
They can be
• Out-of-date
• Too simple
• Too complicated
• Wrong
But they can still be useful if used with caution!
And we have to acknowledge that disputes are not only because of ignorance but because of different cultural world-views


Clearly a long and arduous struggle for consistency

‘Likelihood’ used by WG1
“Most of the observed increase in global average temperatures since the mid-20th century is very likelydue to the observed increase in anthropogenic greenhouse gas concentrations”

‘Confidence’ used by WG2
“In some countries, yields from rain-fed agriculture could be reduced by up to 50% by 2020. (High confidence; IPCC, 2007b, p. 13)”

WG3 used a qualitative scale

August 2010
On uncertainty –
• Pointed out anomalies
• Guidance not followed
• Recommended using level-of-understanding scale
• Drop numerical confidence scale

Department of Statistics public lecture
Trying to Quantify Uncertainty
Professor David SpiegelhalterWinton Professor of the Public Understanding of Risk, University of Cambridge and senior scientist, MRC Biostatistics Unit
Professor Anthony AtkinsonChair, LSE