tsb ‘ design for future climate’ competition ma / jh ms signature draft 2 20 july 2012 filename...
TRANSCRIPT
TSB ‘Design for Future Climate’ competition 100 City Road Final report
TSB Project Reference 400192
Final Report
This report takes into account the particular instructions and requirements of our client.
It is not intended for and should not be relied upon by any third party and no responsibility is undertaken to any third party. Job number 214818-00
Ove Arup & Partners Ltd 13 Fitzroy Street London W1T 4BQ United Kingdom www.arup.com

Document Verification
Job title 100 City Road Job number
214818-00 Document title Final report File reference
Document ref TSB Project Reference 400192 Revision Date Filename TSB_100CityRd_final_report.docx Draft 1 18 May
2012 Description First draft
Prepared by Checked by Approved by
Name PT MA / JH MS
Signature Draft 2 20 July
2012 Filename TSB_100CityRd_final_report.docx Description
Prepared by Checked by Approved by
Name PT JH MS
Signature Final draft 28 Feb
2013 Filename TSB_100CityRd_final_report_28Feb2013_forsubmission.docx Description First Assessment
Prepared by Checked by Approved by
Name AC JH / MA MS
Signature Final Report
29 Apr 2013
Filename TSB_100CityRd_final_report_April2013_forsubmission.docx Description Second Assessment
Prepared by Checked by Approved by
Name AC PT JH
Signature Issue Document Verification with Document
TSB Project Reference 400192 | Final Report | \\GLOBAL.ARUP.COM\LONDON\ATG\JOBS\EP_GROUPDATA\CLIENTS+MARKETS\LEADS+POSSIBLES\176 TSB CLIMATE CHANGE - 100 CITY ROAD\TSB FINAL REPORT\ASSESSORS SECOND REPORT\TSB_100CITYRD_FINAL_REPORT_APRIL2013_FORSUBMISSION.DOCX

TSB ‘Design for Future Climate’ competition 100 City Road Final report
Contents Page
Executive summary 1
Introduction 11
1 Building profile 14
1.1 Description of 100 City Road development 14
2 Climate change risks and exposure of building 18
2.1 Identification of climate change risks 18 2.2 Weather and climate data used 19
3 Adaptation strategies 21
3.1 The ten adaptation strategies 21 3.2 Analysis and modelling tools 23 3.3 Planning stage design/ ‘base case’ building 24 3.4 Analysis of adaptation strategies 28 3.5 Summary of benefits of adaptations 57 3.6 Qualitative cost of adaptation strategies 60
4 Learning from work on this contract 65
4.1 The team 65 4.2 Lessons learned 67
5 Extending adaptation to other buildings 71
5.1 Applying the strategy to other Derwent London buildings 71 5.2 Applying the strategy to other office buildings in London 71 5.3 Applying the strategy to other buildings types and locations in
the UK 72 5.4 Discussion 72
Appendix list 74
A1 Building profile 74
Relevant drawings, images and plans 74
A2 Climate change risks and data 74
Climate change risks for London 74 London’s Urban Heat Island 74 Mayor’s Climate Change Adaptation Strategy 74 London Regional Flood Risk Appraisal 74 Weather files for current and future climate 74
TSB Project Reference 400192 | Final Report | \\GLOBAL.ARUP.COM\LONDON\ATG\JOBS\EP_GROUPDATA\CLIENTS+MARKETS\LEADS+POSSIBLES\176 TSB CLIMATE CHANGE - 100 CITY ROAD\TSB FINAL REPORT\ASSESSORS SECOND REPORT\TSB_100CITYRD_FINAL_REPORT_APRIL2013_FORSUBMISSION.DOCX
TSB ‘Design for Future Climate’ competition 100 City Road Final report
A3 Adaptation strategies 74
Graphic of 10 adaptation strategies 74 Lifetime of building elements 74
A4 Learning from work on this contract 74
Arup team CVs 74
A5 Extending adaptation to other buildings 74
London’s Commercial Stock and Climate Change 74 London Crane Survey 74 BREEAM Excellent Offices 74 CLG Commercial Building Data 74 Investment Property Databank Data 74
TSB Project Reference 400192 | Final Report | \\GLOBAL.ARUP.COM\LONDON\ATG\JOBS\EP_GROUPDATA\CLIENTS+MARKETS\LEADS+POSSIBLES\176 TSB CLIMATE CHANGE - 100 CITY ROAD\TSB FINAL REPORT\ASSESSORS SECOND REPORT\TSB_100CITYRD_FINAL_REPORT_APRIL2013_FORSUBMISSION.DOCX

TSB ‘Design for Future Climate’ competition 100 City Road Final report
Executive summary Building profile
This report details the outputs and outcomes of a climate change adaptation study undertaken for the proposed 100 City Road development in central London, an innovatively designed commercial office building which has achieved BREEAM Excellent criteria. The development consists of a new build 15 floor office block and a group of smaller commercial buildings of between 4 and 5 floors. A typical floor plate in the 15 floor block is approximately 1,000m2 therefore the total floor space in the block is approximately 15,000m2.
Although the study focused on the 15 floor office block (see Figure 1); the adaptation strategies identified and analysed could also be applied to the other smaller commercial buildings within the 100 City Road development as well as other commercial office buildings in London.
100 City Road is a unique building which aims to redefine commercial, speculative office building design through its ‘long life, loose fit, low energy’ features which include:
• Exposed thermal mass of the building’s concrete structure;
• Generous floor to ceiling heights with deep plan floor plates for maximum flexibility;
• A high temperature chilled water system feeding embedded pipes within the structural slabs to provide radiant cooling;
• Low pressure central air handling units with heat recovery at roof level to provide fresh air supply to the office space, distributed by high level exposed ductwork. The ductwork is zoned to allow mixed mode operation;
• Openable windows to enable the space to operate in mixed mode when external conditions allow. This is predicted to be 50% of the time, and;
• Perimeter trench heaters from a low temperature hot water circuit fed from gas fired boilers with future possibility to connect to district heating supply.
TSB Project Reference 400192 | Final Report | \\GLOBAL.ARUP.COM\LONDON\ATG\JOBS\EP_GROUPDATA\CLIENTS+MARKETS\LEADS+POSSIBLES\176 TSB CLIMATE CHANGE - 100 CITY ROAD\TSB FINAL REPORT\ASSESSORS SECOND REPORT\TSB_100CITYRD_FINAL_REPORT_APRIL2013_FORSUBMISSION.DOCX
Page 1
TSB ‘Design for Future Climate’ competition 100 City Road Final report
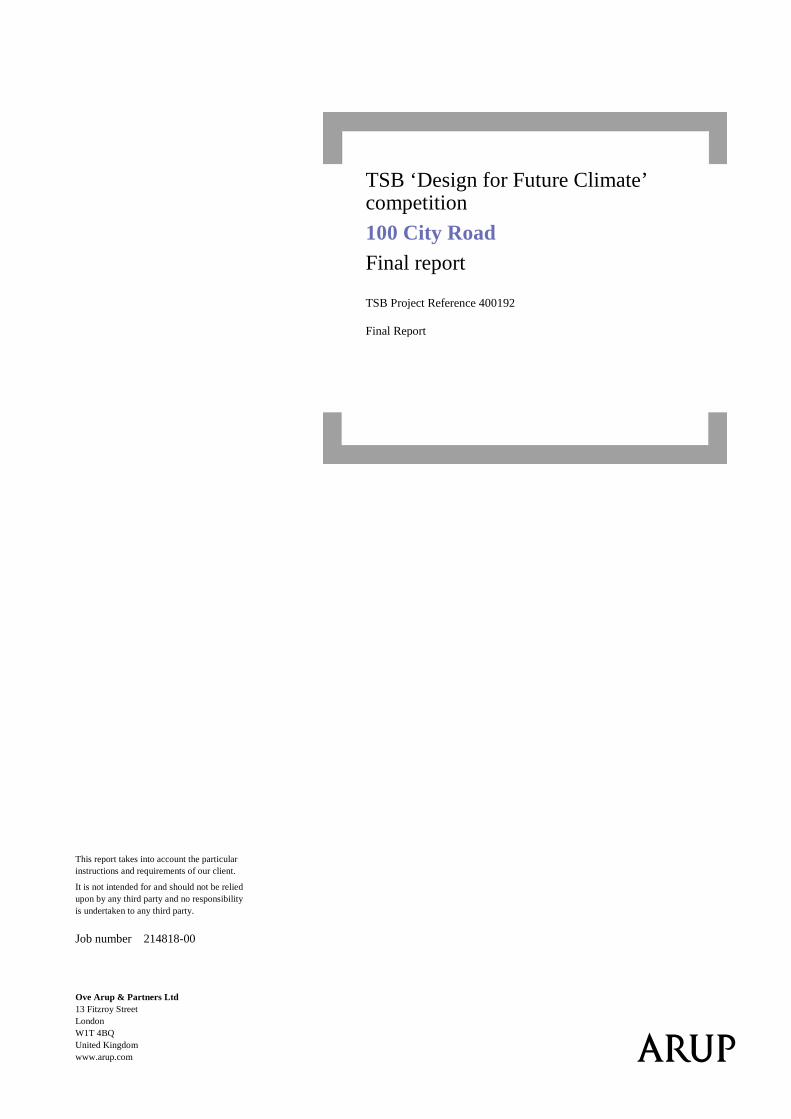
Figure 1: External and internal visualisations of 100 City Road
These features mean that the building is likely to be more able than most office buildings in London to deliver acceptable levels of comfort under current and future climate conditions in an energy efficient and resilient way. Energy compliance studies carried out during the planning phase of the project demonstrated that:
1. In its ‘base case’ operation mode, the building was 20% more efficient than a conventional approach to sealing and air conditioning office buildings;
2. When passive design elements are implemented by tenants there is the potential to further reduce energy consumption by 10% - 20%;
3. The passive design allows internal air temperature to rise up to 28°C from the base case of 24°C. Therefore delaying the need for retrofit cooling up to a peak outside temperature of 33°C.
What this study aimed to do was to highlight additional measures which could be employed to reduce the energy consumption of the building whilst maintaining the required and desirable comfort levels. In particular, it focuses on options for reducing cooling load under future climate scenarios.
Risk exposure
The climate change related risks to the development were identified based upon structured discussions at the design team workshop held at the beginning of the project. These discussions were informed by previous climate change risk work undertaken by the project team for the Greater London Authority (GLA), the London Climate Change Partnership (LCCP), and the Chartered Institution of Building Services Engineers (CIBSE).
Overheating and the increased energy consumption needed for cooling were identified as the key risks to the development. Due to its location in central London, the effect of increased temperatures will be exacerbated by the urban heat island effect. London’s microclimate acts to amplify summer night time
TSB Project Reference 400192 | Final Report | \\GLOBAL.ARUP.COM\LONDON\ATG\JOBS\EP_GROUPDATA\CLIENTS+MARKETS\LEADS+POSSIBLES\176 TSB CLIMATE CHANGE - 100 CITY ROAD\TSB FINAL REPORT\ASSESSORS SECOND REPORT\TSB_100CITYRD_FINAL_REPORT_APRIL2013_FORSUBMISSION.DOCX
Page 2

TSB ‘Design for Future Climate’ competition 100 City Road Final report
temperatures so that buildings are unable to cool down before they begin to absorb heat again the next day.
The London Regional Flood Risk Appraisal (2009) indicates that, Islington and 100 City Road lie outside of the London Flood Zone, which puts it at minimal risk of flooding from the River Thames and Thames tributaries. 100 City Road is also at limited risk from surface water flooding. Subterranean flood risk caused by, for example, a burst water pipe or rising groundwater levels, was not considered in this study. It is noted that all flood risks are likely to be exacerbated by climate change and so will change in the future. However, with appropriate city and neighbourhood scale adaptation it is expected that the 100 City Road site will remain at low risk of flooding.
Whilst flood risks and also water scarcity were acknowledged to be important climate change adaptation considerations for buildings in London, this study focuses on the impact of climate change on overheating and increased energy consumption within the 100 City Road building as the primary climate change risk to the building.
Adaptation strategies for the building
The objectives of this study were to test the viability of the building in both comfort and energy terms under current and future climate conditions. In order to do this ten individual adaptation strategies, both technical and non-technical, were identified to explore overheating risk and the associated issues for the planning stage building design. These issues included: ensuring acceptable levels of internal comfort for building occupants; meeting targets for energy efficiency; resilience of power sources, and keeping capital and operational costs as low as possible. The ten individual adaptation strategies are presented in Figure 2.
These ten adaptation strategies can be broadly interpreted as addressing the ‘adaptation design challenges and opportunities’ as selected from the long list provided in the TSB’s Design for Future Climate competition Checklist 3, and are shown in Table 1.
All of those challenges listed in Table 1 have been considered to some degree in this study; some are already included in the base case building; others have been explored in more detail as part of this study. The relevant adaptation strategy number related to this study is provided for ease of reference against the TSB checklist in Table 1.
TSB Project Reference 400192 | Final Report | \\GLOBAL.ARUP.COM\LONDON\ATG\JOBS\EP_GROUPDATA\CLIENTS+MARKETS\LEADS+POSSIBLES\176 TSB CLIMATE CHANGE - 100 CITY ROAD\TSB FINAL REPORT\ASSESSORS SECOND REPORT\TSB_100CITYRD_FINAL_REPORT_APRIL2013_FORSUBMISSION.DOCX
Page 3

TSB ‘Design for Future Climate’ competition 100 City Road Final report
1) Relax / redefine thermal comfort design criteria
2) Limit solar gains
3) Limit internal lighting gains
4) Limit internal equipment gains
5) Modify building envelope
6) Adjust room height and air distribution systems
7) Night time cooling
8) Adjust thermal mass
9) Mixed mode ventilation
10) Increase cross ventilation potential
Figure 2: The ten adaptation strategies explored during this study
Adaptation design challenge
Adaptation design opportunity
Already included in the ‘base case’ design
Relevant adaptation strategy
Keeping cool - internal
Shading - manufactured No 2
Shading - building form Percentage glazing responses to building orientation
2
Glass technologies Glazing selection to further minimise gains
2
Conflict between maximising daylight and overheating (mitigation versus adaptation)
30% to 60% vision glazing for daylight
2
TSB Project Reference 400192 | Final Report | \\GLOBAL.ARUP.COM\LONDON\ATG\JOBS\EP_GROUPDATA\CLIENTS+MARKETS\LEADS+POSSIBLES\176 TSB CLIMATE CHANGE - 100 CITY ROAD\TSB FINAL REPORT\ASSESSORS SECOND REPORT\TSB_100CITYRD_FINAL_REPORT_APRIL2013_FORSUBMISSION.DOCX
Page 4

TSB ‘Design for Future Climate’ competition 100 City Road Final report
Secure and bug free night ventilation
Mechanical night cooling possible if required
7 & 10
Interrelationship with noise & air pollution
Mixed mode ventilation to allow occupant choice
9 & 10
Interrelationship with ceiling height
3.5m ceiling height to extend natural ventilation at perimeter
6
Role of thermal mass in significantly warmer climate
Thermal mass exposed for active and passive cooling
7 & 8
Energy efficient / renewable powered cooling systems
Embedded pipe system runs on free cooling for greater proportion of the year
9
Enhanced control systems - peak lopping
No n/a
Maximum temperature legislation
No 1
Keeping cool - spaces around buildings
Built form - building to building shading
No n/a
Keeping warm at less cost
Building fabric insulation standards
Insulation standard to Part L 2010 standards
5
Fixings and weatherproofing
Materials behaviour in high temperatures
No 5 & 8
Operation Review handover, early occupation and educational policies in relation to the Soft Landings process and future legacy.
For discussions with tenants
n/a
Internal gains Review IT requirements and management systems in design and in use.
For discussions with tenants
3 & 4
Consumption Ensure log book is in place, monitoring equipment commissioned and used.
Implementation of seasonal commissioning
3 & 4
Activity Engage with users through design activities.
For discussions with tenants
n/a
Maintenance Whole of Life (WOL) building assessments as part of a usable Operations and Maintenance (O+M) manual.
For future consideration with client
n/a
Table 1: Summary how the ten adaptation strategies address relevant ‘adaptation design challenges and opportunities’ selected from TSB’s Design for Future Climate competition Checklist 3.
TSB Project Reference 400192 | Final Report | \\GLOBAL.ARUP.COM\LONDON\ATG\JOBS\EP_GROUPDATA\CLIENTS+MARKETS\LEADS+POSSIBLES\176 TSB CLIMATE CHANGE - 100 CITY ROAD\TSB FINAL REPORT\ASSESSORS SECOND REPORT\TSB_100CITYRD_FINAL_REPORT_APRIL2013_FORSUBMISSION.DOCX
Page 5

TSB ‘Design for Future Climate’ competition 100 City Road Final report
The impacts of the ten adaptation strategies in Figure 2 were analysed quantitatively and qualitatively. For the quantitative analysis the current Test Reference Year for London (TRY2005) and a ‘morphed’ TRY based on the UKCP09 90% high emissions weather files for the 2020s, 2050s and 2080s were used. IES Virtual Environment and the Oasys BEANS suite were used for the dynamic thermal modelling and Ansys CFX for the computational fluid dynamics (CFD) analysis.
It should be stressed that the building design already includes many passive and active environmental systems (e.g. natural ventilation, exposed mass) to allow adaptation strategies to be implemented in the future without fundamental redesign of the building. This would not be the case in a conventional office building, which are typically lightweight, sealed and fully air conditioned buildings.
A summary of the results of each of the 10 adaptation strategies is presented in Table 2.
Adaptation strategy Results of analysis
1. Relax / redefine thermal comfort design criteria
Significant operational savings (both energy and cost) can be achieved with no real additional capital cost or unacceptable change in comfort levels. Over 20% of building energy saving can be realised under the UKCP09 2080 High Emissions 90th percentile climate scenario.
2. Limit solar gains
Shading devices are effective at reducing the peak cooling load of the building by 10-14% during hot, sunny weather The reduction in energy usage of the building is minimal when compared to the additional heating and especially lighting energy which is required when blinds are deployed indiscriminately. Retractable shading devices with good automatic controls would provide some energy saving by the 2050s, but further analysis is required to ascertain the impact of reduced natural daylighting on occupants.
3. Limit internal lighting gains
By providing general office background lighting at 200lux supplemented with task lighting. The energy saving achieved is approximately 15%.
4. Limit internal equipment gains
Reducing equipment load by ‘thin client’ technology or similar reduces electrical consumption. Cooling energy is reduced by 8.2% in the present day climate and by 10.8% by the 2080s. Recovering heat from the equipment gains in the server room should be considered as up to 30% of the office heating energy can be recovered.
5. Modify building envelope
Improving the insulation of the building fabric reduces the heating load to the office between 48% in the current climate and 58% in the 2080s. However, in all the cases simulated, additional cooling energy was required due to more heat being trapped in the building by the improved thermal envelope. In the 2080s simulation, there was actually an increase in energy use due to warmer winters resulting in less heat loss, and warmer summers resulting in increased cooling energy demand.
TSB Project Reference 400192 | Final Report | \\GLOBAL.ARUP.COM\LONDON\ATG\JOBS\EP_GROUPDATA\CLIENTS+MARKETS\LEADS+POSSIBLES\176 TSB CLIMATE CHANGE - 100 CITY ROAD\TSB FINAL REPORT\ASSESSORS SECOND REPORT\TSB_100CITYRD_FINAL_REPORT_APRIL2013_FORSUBMISSION.DOCX
Page 6

TSB ‘Design for Future Climate’ competition 100 City Road Final report
6. Adjust room height and air distribution system
Increasing room height has a number of benefits, including the ability to naturally ventilate and daylight the office floors and to make it easier to use ceiling fans. A comparison of underfloor supply versus mixing ventilation indicated that cooling loads could be reduced in the former case but that these differences become less pronounced when the chilled ceiling is used, since convection from the ceiling tends to mix the space. The mixed ventilation system means that it is easier to increase cooling capacity if needed in the future by increasing supply air rates or decreasing supply air temperature.
7. Night time cooling
Employing night ventilation cooling has a significant benefit both for active and passive modes of operation. For active operation, cooling load is reduced by up to 30% when night time conditions are favourable for the TRY 2005 weather data. For the passive mode of operation, the modelling showed that the building is capable of operating for the majority of the year without the chilled ceiling in operation through just the use of night ventilation. The cost of automatic openings for night time ventilation should be reviewed against the savings achieved from reduced running costs.
8. Adjust thermal mass Increasing the amount of thermal mass by increasing the thickness of the floor slabs in the range of 250mm – 400mm (viewed to be a practical range for the building), was found to have a minor impact on performance, with only a small change in energy and around a 1°C reduction in peak temperatures in the passive mode of operation with night ventilation. This result reflects that there is significant thermal mass already present in the 250 mm thick slab.
9. Mixed mode ventilation
An energy saving of 2% in the current climate to 7% in the 2080s can be achieved by naturally ventilating the 4.5m perimeter zones. This is based on windows opening when the outdoor temperature is between 20-25oC and the internal summer design condition is set at 26oC. If the number of windows, or amount of controlled openable area, is increased the natural ventilation potential will also increase.
10. Increase cross ventilation potential
Analysis indicated that single-sided ventilation on still, warm days is unlikely to provide effective ventilation. Wind-driven cross ventilation would provide higher ventilation rates. The floor plate of 100 City Road is too deep to ensure good air quality in the central and downwind sides of the office against conventional design criteria. However, cross ventilation could be effectively used for night ventilation cooling and use of ceiling fans would further enhance these benefits.
Table 2: Summary of the results of each of the ten analyses
Following a presentation of the study and a qualitative cost/benefit analysis the client and landlord, Derwent London, the architects (AHMM) were asked to consider seven of the 10 recommended adaptation strategies further. These strategies were 1, 2, 3, 4, 7, 9 and 10.
TSB Project Reference 400192 | Final Report | \\GLOBAL.ARUP.COM\LONDON\ATG\JOBS\EP_GROUPDATA\CLIENTS+MARKETS\LEADS+POSSIBLES\176 TSB CLIMATE CHANGE - 100 CITY ROAD\TSB FINAL REPORT\ASSESSORS SECOND REPORT\TSB_100CITYRD_FINAL_REPORT_APRIL2013_FORSUBMISSION.DOCX
Page 7

TSB ‘Design for Future Climate’ competition 100 City Road Final report
Please note that the organisation and membership of the climate change adaptation team are set out in Section 4.1.
The adaptation strategies were identified as desirable to implement as they have ‘medium’ cost and ‘high’ impact on energy and/or comfort. Further, the scope for integration of these strategies is actually realistic for the client due to the stage of the building design and the client’s appetite for integrating climate change adaptation related recommendations.
The seven adaptation strategies which are being developed further are:
Adaptation strategy 1
• The client and design team are informing letting agents and potential tenants of the benefits of relaxing indoor temperatures and are providing workshops on comfort criteria and extending the definition of comfort beyond air temperature alone.
• These sessions have been on-going and have generated much interest in the building concept and a future model of office design.
Adaptation strategy 2
• The potential to integrate external shading devices will be investigated by the architect and client at a later date. This is because analysis indicated that there would be little energy/comfort/cost benefit until the 2050s.
Adaptation strategies 3 & 4
• Limiting the internal lighting and equipment gains are outside of the current architects brief but will be considered at a later stage of design, most likely when the building is being fitted out.
Adaptation strategy 7
• Night time cooling cycles are to be designed into the building management strategy. Night time cooling systems are also to be integrated to allow tenant choice with immediate benefits for both the building user and operators.
Adaptation strategies 9 & 10
• An increase in openable areas in the opaque area of the façade is currently being considered to enhance natural ventilation potential as part of a mixed mode ventilation strategy. Analysis indicates an energy/comfort/cost benefit which could be realised now through modifying the current design.
Recommendations for how to conduct adaptation work would include:
• Think scientifically and seriously but also creatively and visually. Adaptation measures need not constrain design ambitions nor limit design flexibility if risks and opportunities are considered early on and ideas are presented coherently and convincingly to the project team.
• Recognise that adaptation strategies can be operational or management focused and may not physically affect a design or structure.
TSB Project Reference 400192 | Final Report | \\GLOBAL.ARUP.COM\LONDON\ATG\JOBS\EP_GROUPDATA\CLIENTS+MARKETS\LEADS+POSSIBLES\176 TSB CLIMATE CHANGE - 100 CITY ROAD\TSB FINAL REPORT\ASSESSORS SECOND REPORT\TSB_100CITYRD_FINAL_REPORT_APRIL2013_FORSUBMISSION.DOCX
Page 8

TSB ‘Design for Future Climate’ competition 100 City Road Final report
• Talk to and involve the end client as early on as possible in the design process.
• Focus on and communicate the reasons for undertaking analysis of climate risk, developing adaptation options and strategies, and making decisions based upon them, namely: legislative and regulatory drivers for doing it (‘have to’) i.e. Climate Change Act 2008, CLG Building Regulations, Local Planning Authority requirements; financial drivers for doing it (‘should do’) i.e. reduced exposure to risks, capital costs versus operational savings, retaining market value of assets over time, and reputational and responsibility drivers for doing it (‘want to’) i.e. ‘USP’, good risk/asset management, marketing material, attracts responsible buyers/tenants, contributes to well-being, productivity and satisfaction of owners/occupants.
• For all adaptation options and strategies for addressing overheating risk think about the comfort, energy and cost relationships.
• Work in partnership with other engineers, built environment professionals (architects, surveyors), clients (developers) and occupants.
• Involve and communicate with project team on a regular basis.
How can this work be used to extend adaptation of other buildings?
• Property types of most relevance to this study include flagship headquarters, modern corporate buildings and creative studios. This study is ideally suited as a benchmark for analysis when these buildings are due for retrofit and refurbishment.
• It has been proven that lessons learnt in investigating energy savings in the operations of a single building can inform the management and operation of other new and existing buildings.
• Derwent London have shown interest in applying some of the adaptations suggested into 100 City Road and the ideas that have been established during the course of the project throughout their other commercial refurbishments, where appropriate. This exercise will include further consideration of costs.
• It should be stressed that the building design already includes many passive and active environmental systems (e.g. natural ventilation, exposed mass) to allow adaptation strategies to be implemented in the future without fundamental redesign of the building. This would not be the case in a conventional office building design, which are typically lightweight, sealed and fully air conditioned buildings.
Ways of further communicating the lessons learned from this study could include:
• 100 City Road and the surrounding buildings were built during the 1960s. Of the 1,035 office buildings listed in the Investment Property Databank in London, 131 were also built during this era with 92 in the West End and Mid-Town areas and 39 in the City (IPD, 2009). Many of these may be approaching a new refurbishment and letting cycle, and could learn from the design approach taken and adaptation strategies considered for 100 City Road.
TSB Project Reference 400192 | Final Report | \\GLOBAL.ARUP.COM\LONDON\ATG\JOBS\EP_GROUPDATA\CLIENTS+MARKETS\LEADS+POSSIBLES\176 TSB CLIMATE CHANGE - 100 CITY ROAD\TSB FINAL REPORT\ASSESSORS SECOND REPORT\TSB_100CITYRD_FINAL_REPORT_APRIL2013_FORSUBMISSION.DOCX
Page 9

TSB ‘Design for Future Climate’ competition 100 City Road Final report
• Many of the resources and tools used in this study could lend themselves to other building types and locations; however there are some resources, especially the literature that has been cited, which are London specific.
TSB Project Reference 400192 | Final Report | \\GLOBAL.ARUP.COM\LONDON\ATG\JOBS\EP_GROUPDATA\CLIENTS+MARKETS\LEADS+POSSIBLES\176 TSB CLIMATE CHANGE - 100 CITY ROAD\TSB FINAL REPORT\ASSESSORS SECOND REPORT\TSB_100CITYRD_FINAL_REPORT_APRIL2013_FORSUBMISSION.DOCX
Page 10

TSB ‘Design for Future Climate’ competition 100 City Road Final report
Introduction This report details the findings of a climate change adaptation study carried out on the proposed 100 City Road development in central London, an innovatively designed commercial office building which has achieved BREEAM Excellent criteria. The development consists of a new build 15 floor office block and a group of smaller commercial buildings of between 4 and 5 floors. A typical floor plate in the 15 floor block is approximately 1,000m2 therefore the total floor space in the block is approximately 15,000m2.
Although the study focused on the 15 floor office block the adaptation strategies identified and analysed could also be applied to the smaller commercial buildings as well as other commercial office buildings in London.
100 City Road is a unique building which is designed for mixed mode operation, using passive cooling strategies when external temperatures permit. It aims to redefine commercial, speculative office building design through its ‘long life, loose fit, low energy’ features which include:
• Exposed thermal mass of the building’s concrete structure;
• Generous floor to ceiling heights with deep plan floor plates for maximum flexibility;
• A high temperature chilled water system feeding embedded pipes within the structural slabs to provide radiant cooling;
• Low pressure central air handling units with heat recovery at roof level to provide fresh air supply to the office space, distributed by high level exposed ductwork. The ductwork is zoned to allow mixed mode operation;
• Openable windows to enable the space to operate in mixed mode when external conditions allow. This is predicted to be 50% of the time, and;
• Perimeter trench heaters from a low temperature hot water circuit fed from gas fired boilers with future possibility to connect to district heating supply.
These features mean that the building is already likely to be more able than most office buildings in London to deliver acceptable levels of comfort under current and future climate conditions in an energy efficient and resilient way.
Energy compliance studies carried out during the planning phase of the project (prior to this TSB funded study) demonstrated that:
1. In its ‘base case’ operation mode, the building was 20% more efficient than a conventional approach to sealing and air conditioning office buildings;
2. When passive design elements are implemented by tenants there is the potential to further reduce energy consumption by 10% - 20%;
3. The passive design allows internal air temperature to rise up to 28°C from the base case of 24°C. Therefore delaying the need for retrofit cooling up to a peak outside temperature of 33°C (in line with temperature increases in the 2020 90% climate change scenarios).
TSB Project Reference 400192 | Final Report | \\GLOBAL.ARUP.COM\LONDON\ATG\JOBS\EP_GROUPDATA\CLIENTS+MARKETS\LEADS+POSSIBLES\176 TSB CLIMATE CHANGE - 100 CITY ROAD\TSB FINAL REPORT\ASSESSORS SECOND REPORT\TSB_100CITYRD_FINAL_REPORT_APRIL2013_FORSUBMISSION.DOCX
Page 11

TSB ‘Design for Future Climate’ competition 100 City Road Final report
What this study aimed to do was to highlight additional measures which could be employed to reduce the energy consumption of the building whilst maintaining the required and desirable comfort levels. In particular, it focuses on options for reducing cooling load under future climate scenarios.
The adaptation study, funded by the Technology Strategy Board (TSB) as part of their Design for Future Climate competition, ran alongside the main design project with the intention of feeding as much information as possible into the design process.
Climate change related risks were assessed and evaluated at a design team workshop held at the beginning of the project. It was determined that the most significant climate change related risk to the building was the potential overheating of internal spaces throughout the lifetime of the building. Therefore this project focuses on analysing and addressing overheating risk for the building over the 21st Century.
Ten individual adaptation strategies were identified to explore overheating risk and the associated issues which include: ensuring acceptable levels of internal comfort for building occupants; meeting targets for energy efficiency; considering the resilience of power sources, and being mindful of capital and operational costs.
This report follows the structure specified by the TSB and consists of the following sections.
1. Building profile
A description of the building, its location, context and intended uses.
2. Climate change risks and exposure
An assessment of the risk exposure of the building to climate change and an explanation of the future weather files and climate change scenarios used for evaluation.
3. Adaptation strategies
The approach to analysing each of the ten adaptation strategies and the effects on energy use and occupant comfort given the warming climate over the 21st Century.
The ten adaptation strategies can be broadly divided into two groups; those which aim to reduce energy consumption by reducing the cooling loads on the mechanical cooling system for the building now and in the future (1-6) , and those which aim to reduce energy consumption through running the building in passive mode when external conditions allow (7-10).
High level costs and benefits are provided, with more detail for the three of the adaptation strategies considered viable by the client for potential realisation.
4. Learning from the work on this contract
Details about the team involved and the approach to the study are provided along with an overview of lessons learned and the resources and tools used.
5. Extension to other buildings
TSB Project Reference 400192 | Final Report | \\GLOBAL.ARUP.COM\LONDON\ATG\JOBS\EP_GROUPDATA\CLIENTS+MARKETS\LEADS+POSSIBLES\176 TSB CLIMATE CHANGE - 100 CITY ROAD\TSB FINAL REPORT\ASSESSORS SECOND REPORT\TSB_100CITYRD_FINAL_REPORT_APRIL2013_FORSUBMISSION.DOCX
Page 12

TSB ‘Design for Future Climate’ competition 100 City Road Final report
Consideration is made of the applicability of both the ‘base case’ design of 100 City Road and the ten adaptation strategies, to other office buildings in London and the UK.
The challenges to and the opportunities for adaptation of buildings within the commercial office sector including cost, regulation, legislation and cultural norms, are discussed.
TSB Project Reference 400192 | Final Report | \\GLOBAL.ARUP.COM\LONDON\ATG\JOBS\EP_GROUPDATA\CLIENTS+MARKETS\LEADS+POSSIBLES\176 TSB CLIMATE CHANGE - 100 CITY ROAD\TSB FINAL REPORT\ASSESSORS SECOND REPORT\TSB_100CITYRD_FINAL_REPORT_APRIL2013_FORSUBMISSION.DOCX
Page 13

TSB ‘Design for Future Climate’ competition 100 City Road Final report
1 Building profile
1.1 Description of 100 City Road development The 100 City Road development consists of a new build 15 floor office block and a group of smaller commercial buildings of between 4 and 5 floors. This project focuses on the 15 floor office block; however the adaptation strategies discussed could also be applied to the other smaller buildings within the development. A typical floor plate in the 15 floor block is approximately 1,000m2 therefore the total floor space in the block is approximately 15,000m2.
The climate change adaptation study began before planning was granted, however during the course of the study, which coincided with detailed design, planning was approved. At the time of writing the construction of the development is about to begin.
The building is located in central London at the junction between Old Street and City Road, as indicated in Figure 3. Due to its location on a busy roundabout the site experiences heavy traffic and noise levels are high. The lower floors are overshadowed by surrounding buildings; however this is not an issue for the majority of the higher levels. The planning stage design building is a concrete frame structure with a curtain wall façade and has been designed to improve upon Part L 2010 energy efficiency performance requirements. Section, plan and elevation views of the proposed development are shown in Figure 4-Figure 8. These are also available as larger documents in Appendix 1.
Figure 3: Map showing location of 100 City Road
TSB Project Reference 400192 | Final Report | \\GLOBAL.ARUP.COM\LONDON\ATG\JOBS\EP_GROUPDATA\CLIENTS+MARKETS\LEADS+POSSIBLES\176 TSB CLIMATE CHANGE - 100 CITY ROAD\TSB FINAL REPORT\ASSESSORS SECOND REPORT\TSB_100CITYRD_FINAL_REPORT_APRIL2013_FORSUBMISSION.DOCX
Page 14

TSB ‘Design for Future Climate’ competition 100 City Road Final report
Figure 4: Image of proposed development as seen from Old Street
Figure 5: Sectional view of proposed development
TSB Project Reference 400192 | Final Report | \\GLOBAL.ARUP.COM\LONDON\ATG\JOBS\EP_GROUPDATA\CLIENTS+MARKETS\LEADS+POSSIBLES\176 TSB CLIMATE CHANGE - 100 CITY ROAD\TSB FINAL REPORT\ASSESSORS SECOND REPORT\TSB_100CITYRD_FINAL_REPORT_APRIL2013_FORSUBMISSION.DOCX
Page 15
TSB ‘Design for Future Climate’ competition 100 City Road Final report
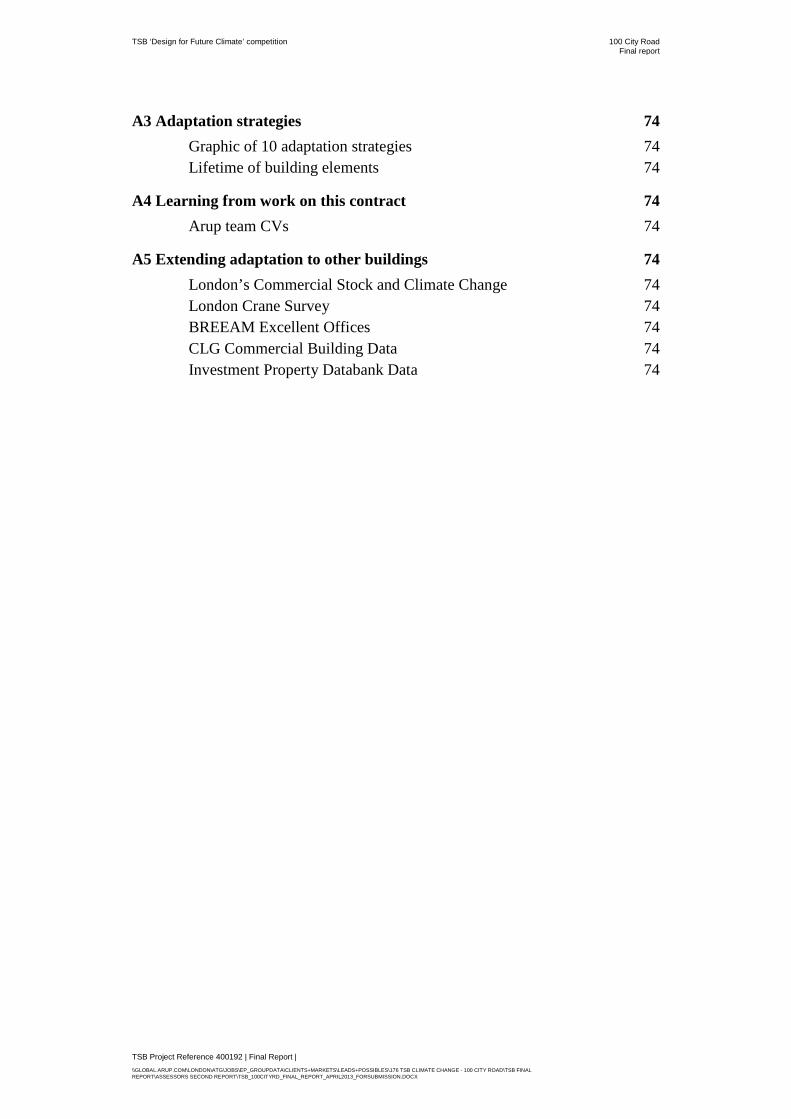
Figure 6: East elevation view of proposed development
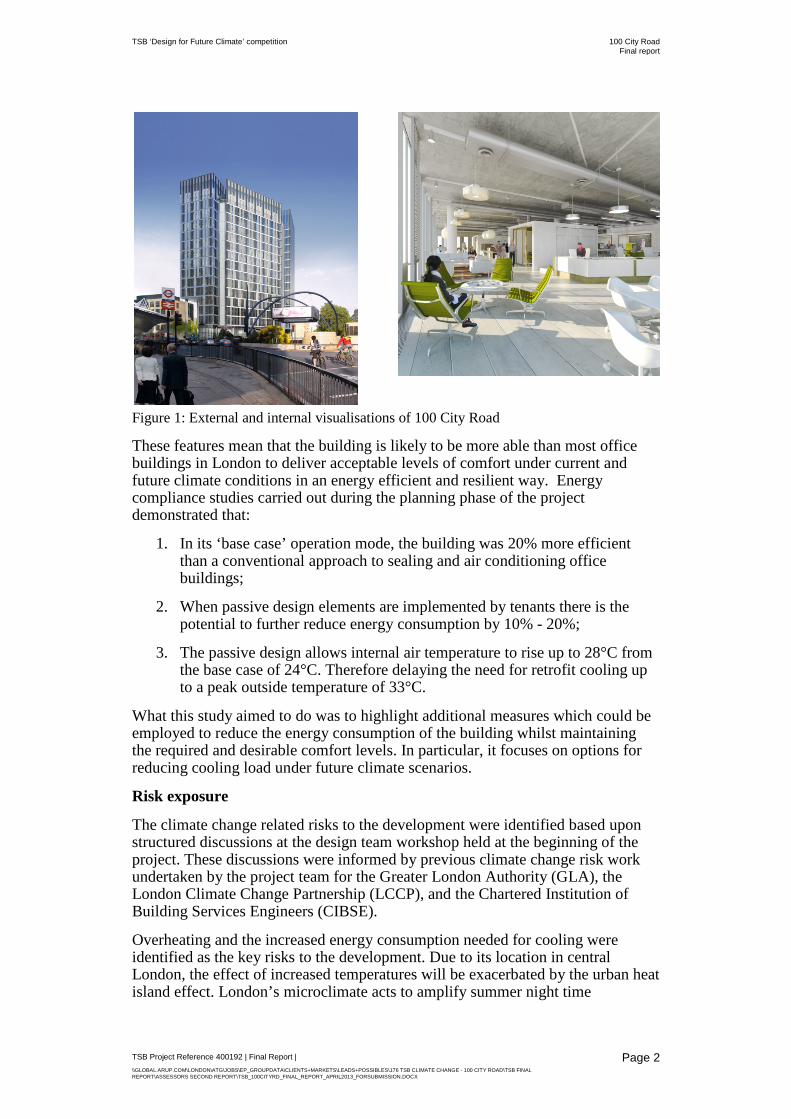
Figure 7: Plan view of a typical office
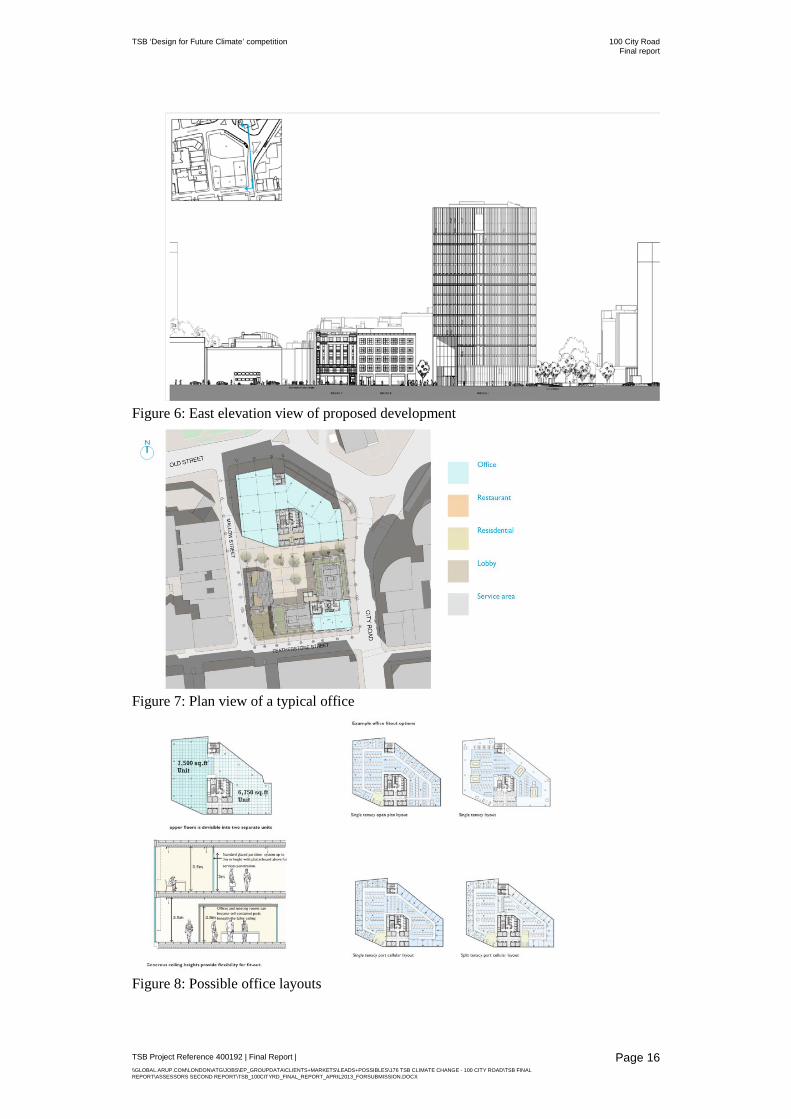
Figure 8: Possible office layouts
TSB Project Reference 400192 | Final Report | \\GLOBAL.ARUP.COM\LONDON\ATG\JOBS\EP_GROUPDATA\CLIENTS+MARKETS\LEADS+POSSIBLES\176 TSB CLIMATE CHANGE - 100 CITY ROAD\TSB FINAL REPORT\ASSESSORS SECOND REPORT\TSB_100CITYRD_FINAL_REPORT_APRIL2013_FORSUBMISSION.DOCX
Page 16

TSB ‘Design for Future Climate’ competition 100 City Road Final report
100 City Road is a unique building which is designed for mixed mode operation, using passive cooling strategies when external temperatures permit. It aims to redefine commercial, speculative office building design through its ‘long life, loose fit, low energy’ features which include:
• Exposed thermal mass of the building’s concrete structure;
• Generous floor to ceiling heights with deep plan floor plates for maximum flexibility;
• A high temperature chilled water system feeding embedded pipes within the structural slabs to provide radiant cooling;
• Low pressure central air handling units with heat recovery at roof level to provide fresh air supply to the office space, distributed by high level exposed ductwork. The ductwork is zoned to allow mixed mode operation;
• Openable windows to enable the space to operate in mixed mode when external conditions allow. This is predicted to be 50% of the time, and;
• Perimeter trench heaters from a low temperature hot water circuit fed from gas fired boilers with future possibility to connect to district heating supply.
These features mean that the building is likely to be more able than most office buildings in London to deliver acceptable levels of comfort under current and future climate conditions in an energy efficient and resilient way. This study aims to highlight additional measures which could be employed to reduce the energy consumption of the building, whilst maintaining the required and desirable comfort levels. In particular, it focuses on options for reducing cooling load under future climate scenarios.
TSB Project Reference 400192 | Final Report | \\GLOBAL.ARUP.COM\LONDON\ATG\JOBS\EP_GROUPDATA\CLIENTS+MARKETS\LEADS+POSSIBLES\176 TSB CLIMATE CHANGE - 100 CITY ROAD\TSB FINAL REPORT\ASSESSORS SECOND REPORT\TSB_100CITYRD_FINAL_REPORT_APRIL2013_FORSUBMISSION.DOCX
Page 17
TSB ‘Design for Future Climate’ competition 100 City Road Final report
2 Climate change risks and exposure of building
2.1 Identification of climate change risks Climate change projections indicate that throughout the 21st Century the South-East of England and London will experience, on average, warmer, wetter winters and hotter, drier summers. The likelihood of extreme weather events is also expected to increase. As a result, London faces a growing risk of high temperatures, floods and droughts.
The climate change related risks to the development were identified based upon structured discussions at the design team workshop held at the beginning of the project. These discussions were informed by previous climate change risk work undertaken by the project team for the Greater London Authority (GLA), the London Climate Change Partnership (LCCP), and the Chartered Institution of Building Services Engineers (CIBSE).
Overheating and the increased energy consumption needed for cooling were identified as the key risks to the development for the following reasons:
• In the last decade (2002-2012) the UK has experienced two prolonged periods of excessively hot weather (categorised as heat waves) in the summers of 2003 and 2006, and also experienced an unusually hot spring and autumn in 2011. The probability of periods of high temperatures such as these is increasing as average summers get hotter and heat waves increase in intensity.
• Due to its location in central London, the effect of increased temperatures will be exacerbated by the urban heat island effect. London’s microclimate acts to amplify summer night time temperatures so that buildings are unable to cool down before they begin to absorb heat again the next day.
• For commercial office buildings, where energy consumption is dominated by cooling loads, an increase in average temperatures and hot weather events is likely to result in significant increases in energy costs.
The London Regional Flood Risk Appraisal (2009) indicates that, Islington and 100 City Road lie outside of the London Flood Zone, which puts it at minimal risk of flooding from the River Thames and Thames tributaries. 100 City Road is also at limited risk from surface water flooding. Subterranean flood risk caused by, for example, bust water pipes or rising ground water levels, was not considered in this study. It is noted that all flood risks are likely to be exacerbated by climate change and so will change in the future. However, with appropriate city and neighbourhood scale adaptation it is expected that the 100 City Road site will remain at low risk of flooding.
Whilst flood risks and also water scarcity were acknowledged to be important climate change adaptation considerations for buildings in London, this study focuses on the impact of climate change on overheating and increased energy consumption within the 100 City Road building as the primary climate change risk to the building.
TSB Project Reference 400192 | Final Report | \\GLOBAL.ARUP.COM\LONDON\ATG\JOBS\EP_GROUPDATA\CLIENTS+MARKETS\LEADS+POSSIBLES\176 TSB CLIMATE CHANGE - 100 CITY ROAD\TSB FINAL REPORT\ASSESSORS SECOND REPORT\TSB_100CITYRD_FINAL_REPORT_APRIL2013_FORSUBMISSION.DOCX
Page 18
TSB ‘Design for Future Climate’ competition 100 City Road Final report
The climate change risks facing London and the UK in general are the subject of numerous studies. Key publications for London are Climate Change Risks for London; London’s Urban Heat Island; Mayors Climate Change Adaptation Strategy and weather files for current and future climate, these are all provided in Appendix 2. These publications are accepted by academia and industry as reliable and legitimate sources of information for the assessment of climate change risk, and are at the forefront of analysing and communicating urban heat risk for London.
The publications which are referenced have been co-produced by Arup, UCL, The University of Reading, GLA and CIBSE. These reports were all reviewed by the project team during the early stages of the project and it was determined that the existing understanding of urban heat risk for London was sufficient to provide the basis for the more detailed climate change adaptation study for 100 City Road. From the review of the documents summarising potential flooding and water scarcity risks for the area of this study, it was collectively decided that these risks did not warrant further analysis.
2.2 Weather and climate data used A Test Reference Year (TRY) weather file for London was used for comparison with UKCP09 future climate data for the 2020s, 2050s and 2080s based on the High Emissions scenario at the 90% probability level. A TRY year is a composite of the most typical months from a period of 20 years with the assessment of typicality based on a combination of temperature, wind speed and solar irradiance. The High Emissions scenario at the 90% probability level was used as it represents the upper end of the range of projections within the UKCP09 projections. In order to create the UKCP09 climate data, the London TRY 2005 data was climate change adjusted using the ‘morphing’ method by the Arup team for the 2020s, 2050s and 2080s.
The main reason for using ‘morphed’ data rather than UKCP09 Weather Generator data was that the single underlying TRY year provides a useful and robust baseline from which to project the future performance of the building. Long ensemble model runs that would exploit some of the statistical information provided by the weather generator output were not considered to be necessary to inform the types of design and adaptation decisions being investigated by the project.
As the UKCP09 climate change adjusted weather files are generated directly from the TRY files, they do not capture extreme weather events. Therefore using the TRY 2005 and the related UKCP09 weather files for the 2020s, 2050s and 2080s only provides an indication of the annual energy consumption of a building, rather than its behaviour during peak temperature conditions.
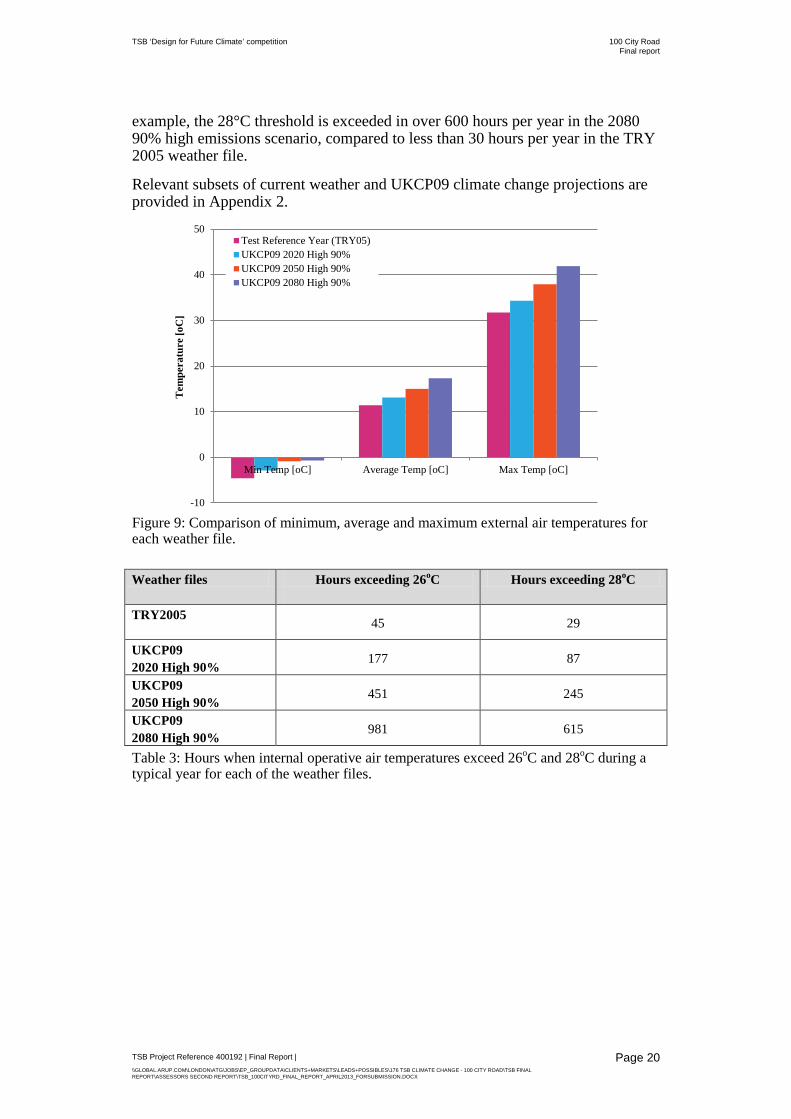
Figure 9 shows how minimum, average and maximum air temperatures as used in the TRY 2005 and the UKCP09 future weather files are projected to increase over the 21st Century. The projected increases in temperature will potentially have an impact on building occupant comfort, energy use and overheating risk.
Table 3 shows the projected increase in the annual number of hours when the CIBSE Guide A recommended overheating criteria of 26°C and 28°C are exceeded. This recommends a limit on the expected occurrence of operative temperature above 28°C to 1% of the annual occupied period (25-30 hours). For
TSB Project Reference 400192 | Final Report | \\GLOBAL.ARUP.COM\LONDON\ATG\JOBS\EP_GROUPDATA\CLIENTS+MARKETS\LEADS+POSSIBLES\176 TSB CLIMATE CHANGE - 100 CITY ROAD\TSB FINAL REPORT\ASSESSORS SECOND REPORT\TSB_100CITYRD_FINAL_REPORT_APRIL2013_FORSUBMISSION.DOCX
Page 19
TSB ‘Design for Future Climate’ competition 100 City Road Final report
example, the 28°C threshold is exceeded in over 600 hours per year in the 2080 90% high emissions scenario, compared to less than 30 hours per year in the TRY 2005 weather file.
Relevant subsets of current weather and UKCP09 climate change projections are provided in Appendix 2.
Figure 9: Comparison of minimum, average and maximum external air temperatures for each weather file. Weather files Hours exceeding 26oC
Hours exceeding 28oC
TRY2005
45 29
UKCP09 2020 High 90%
177 87
UKCP09 2050 High 90%
451 245
UKCP09 2080 High 90%
981 615
Table 3: Hours when internal operative air temperatures exceed 26oC and 28oC during a typical year for each of the weather files.
-10
0
10
20
30
40
50
Min Temp [oC] Average Temp [oC] Max Temp [oC]
Tem
pera
ture
[oC
]
Test Reference Year (TRY05)UKCP09 2020 High 90%UKCP09 2050 High 90%UKCP09 2080 High 90%
TSB Project Reference 400192 | Final Report | \\GLOBAL.ARUP.COM\LONDON\ATG\JOBS\EP_GROUPDATA\CLIENTS+MARKETS\LEADS+POSSIBLES\176 TSB CLIMATE CHANGE - 100 CITY ROAD\TSB FINAL REPORT\ASSESSORS SECOND REPORT\TSB_100CITYRD_FINAL_REPORT_APRIL2013_FORSUBMISSION.DOCX
Page 20
TSB ‘Design for Future Climate’ competition 100 City Road Final report
3 Adaptation strategies
3.1 The ten adaptation strategies The project team made a commitment to define possible adaptation strategies relevant to commercial office buildings in central London early on in the design process. Ten possible strategies; both technical and non-technical, were identified and discussed in the first project team workshop. These strategies are listed below and are graphically depicted in Figure 10. The adaptation strategies are listed in the following order; behavioural (1), those which limit heat gains (2-5) and those which optimise the passive and active aspects of the buildings’ systems (6-10).
The adaptation strategies can more broadly be divided into two groups; those which aim to reduce energy consumption by reducing cooling loads on the mechanical cooling system for the building now and in the future (1-6), and those which aim to reduce energy consumption through running the building in passive mode when external conditions allow (7-10).
1) Redefine thermal comfort design criteria
2) Limit solar gains
3) Limit internal lighting gains
4) Limit internal equipment gains
5) Modify building envelope
6) Adjust room height and air distribution systems
7) Night time cooling
8) Adjust thermal mass
9) Mixed mode ventilation
10) Increased cross ventilation potential
TSB Project Reference 400192 | Final Report | \\GLOBAL.ARUP.COM\LONDON\ATG\JOBS\EP_GROUPDATA\CLIENTS+MARKETS\LEADS+POSSIBLES\176 TSB CLIMATE CHANGE - 100 CITY ROAD\TSB FINAL REPORT\ASSESSORS SECOND REPORT\TSB_100CITYRD_FINAL_REPORT_APRIL2013_FORSUBMISSION.DOCX
Page 21
TSB ‘Design for Future Climate’ competition 100 City Road Final report
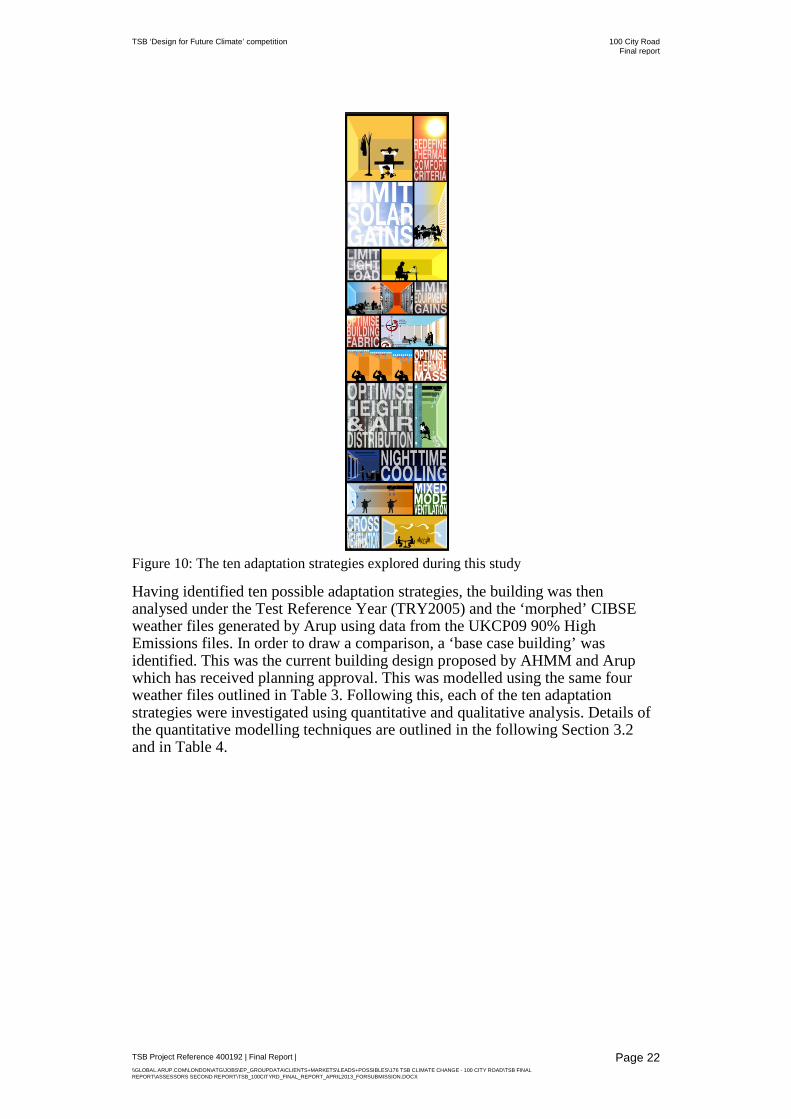
Figure 10: The ten adaptation strategies explored during this study
Having identified ten possible adaptation strategies, the building was then analysed under the Test Reference Year (TRY2005) and the ‘morphed’ CIBSE weather files generated by Arup using data from the UKCP09 90% High Emissions files. In order to draw a comparison, a ‘base case building’ was identified. This was the current building design proposed by AHMM and Arup which has received planning approval. This was modelled using the same four weather files outlined in Table 3. Following this, each of the ten adaptation strategies were investigated using quantitative and qualitative analysis. Details of the quantitative modelling techniques are outlined in the following Section 3.2 and in Table 4.
TSB Project Reference 400192 | Final Report | \\GLOBAL.ARUP.COM\LONDON\ATG\JOBS\EP_GROUPDATA\CLIENTS+MARKETS\LEADS+POSSIBLES\176 TSB CLIMATE CHANGE - 100 CITY ROAD\TSB FINAL REPORT\ASSESSORS SECOND REPORT\TSB_100CITYRD_FINAL_REPORT_APRIL2013_FORSUBMISSION.DOCX
Page 22

TSB ‘Design for Future Climate’ competition 100 City Road Final report
3.2 Analysis and modelling tools The investigation used two dynamic thermal modelling tools: IES Virtual Environment and the Oasys BEANS suite. IES has been used to establish building systems’ energy use as the program is known to provide a good indication of the projected use. The Oasys BEANS suite has been used for analysis of thermal mass and also to establish comfort conditions within the space. The commercial code Ansys CFX was used for the computational fluid dynamics (CFD) analysis. CFD was only used where the spatial variations in air flow needed to be considered.
Adaptation strategy Modelling tools Modelling details
1 Relax / redefine thermal comfort design criteria
IES Virtual Environment
Full year dynamic analysis to deduce the reduction in energy consumption of the building with relaxed design criteria.
2 Limit solar gains IES Virtual Environment
Full year dynamic analysis to deduce the reduction in heating and cooling loads.
3 Limit internal lighting gains IES Virtual Environment
Full year dynamic analysis to deduce the reduction in energy consumption of the building.
4 Limit internal equipment gains
IES Virtual Environment
Full year dynamic analysis to deduce the reduction in energy consumption of the building.
5 Modify building envelope IES Virtual Environment
Full year dynamic analysis to deduce the reduction in energy consumption of the building.
6 Adjust room height & air distribution system
Ansys CFX & Oasys BEANS
suite
Oasys BEANS to derive boundary conditions on a peak summer day. This is fed into Ansys CFX to produce CFD to evaluate air distribution and stratification effectiveness. The simulation is not dynamic.
7 Night time cooling Oasys BEANS suite
Full year dynamic simulation with automatic window opening when night time condition is favourable.
8 Adjust thermal mass Oasys BEANS suite
Full year dynamic simulation to evaluate various slab thicknesses under future climate files
9 Mixed mode ventilation IES Virtual Environment
Full year dynamic simulation with automatic window opening.
10 Cross ventilation & low energy air supply
Ansys CFX & Oasys BEANS
suite
Oasys BEANS to derive boundary conditions on a peak summer day. This is fed into Ansys CFX to produce CFD to evaluate air distribution and air change rates.
Table 4: Tools used to analyse the ten adaptation strategies
TSB Project Reference 400192 | Final Report | \\GLOBAL.ARUP.COM\LONDON\ATG\JOBS\EP_GROUPDATA\CLIENTS+MARKETS\LEADS+POSSIBLES\176 TSB CLIMATE CHANGE - 100 CITY ROAD\TSB FINAL REPORT\ASSESSORS SECOND REPORT\TSB_100CITYRD_FINAL_REPORT_APRIL2013_FORSUBMISSION.DOCX
Page 23

TSB ‘Design for Future Climate’ competition 100 City Road Final report
3.3 Planning stage design/ ‘base case’ building In the planning stage design of the building described in Section 1.1, referred to from here on as the ‘base case building’, cooling is provided by a chilled ceiling operating at between 17°C and 19°C delivering around 70W of cooling via fresh air delivered at 12 l/s/person and cooled to 19°C.
The base case building was analysed using IES under the TRY 2005 and weather files for the High 90% UKCP09 scenarios for the 2020s, 2050s and 2080s. The internal temperatures were controlled in the model to a maximum of 24oC, to reflect CIBSE and BCO guidance, assuming a mechanical cooling system.
The peak cooling demand required to maintain these conditions under each scenario is shown in Figure 11, and annual heating and cooling demands are shown in Figure 12 and 13 respectively.
Figure 11: Peak office cooling demand for the base case building (increase in cooling demand is due to the increase in fresh air load as external temperatures get higher, and increase in conduction and infiltration heat gains also due to higher external temperatures).
Peak cooling demands are presented in W/m2 in order to allow comparison with the capacity of the active slab to provide cooling.
Analysis of the ‘base case’ design illustrated a 32W/m2 increase in peak cooling demand from approximately 73 W/m2 to 105 W/m2 when comparing the TRY 2005 to the UKCP09 2080 high emissions scenario (see Figure 11). This increase in peak load is due to increased outside temperature so the comparative increase is similar for any office building design.
Although in the case of 100 City Road the peak cooling installation is sized to be able to operate to the UKCP09 2020 peak temperature of 34.3°C, the passive measures within the building such as thermal mass, openable windows and
TSB Project Reference 400192 | Final Report | \\GLOBAL.ARUP.COM\LONDON\ATG\JOBS\EP_GROUPDATA\CLIENTS+MARKETS\LEADS+POSSIBLES\176 TSB CLIMATE CHANGE - 100 CITY ROAD\TSB FINAL REPORT\ASSESSORS SECOND REPORT\TSB_100CITYRD_FINAL_REPORT_APRIL2013_FORSUBMISSION.DOCX
Page 24
TSB ‘Design for Future Climate’ competition 100 City Road Final report
allowing air temperature to cycle, will reduce peak cooling demand such that the building is resilient to the 2020 90% scenario without the need to implement adaptation measures or utilise the additional cooling capacity. In a conventional sealed building it would be necessary to retrofit additional cooling at this point or build in the capacity within the base design.
The peak dry-bulb temperatures in the weather files for the 2050s and 2080s are 37oC and 41oC respectively, compared to a peak dry bulb temperature of 29°C in the current TRY2005. This suggests that peak overall cooling demand would be significantly greater under these scenarios and suggests that additional cooling will need to be provided by the ventilation systems. This will require delivery of increased air volumes and/or lower supply temperatures. This potentially involves upgrading the chiller plant and increasing duct sizes before the 2050s. The current cooling provision in the ‘base case’ building design is not adequate to provide the projected 105W/m² cooling demand in 2080 without further consideration of adaptation strategies.
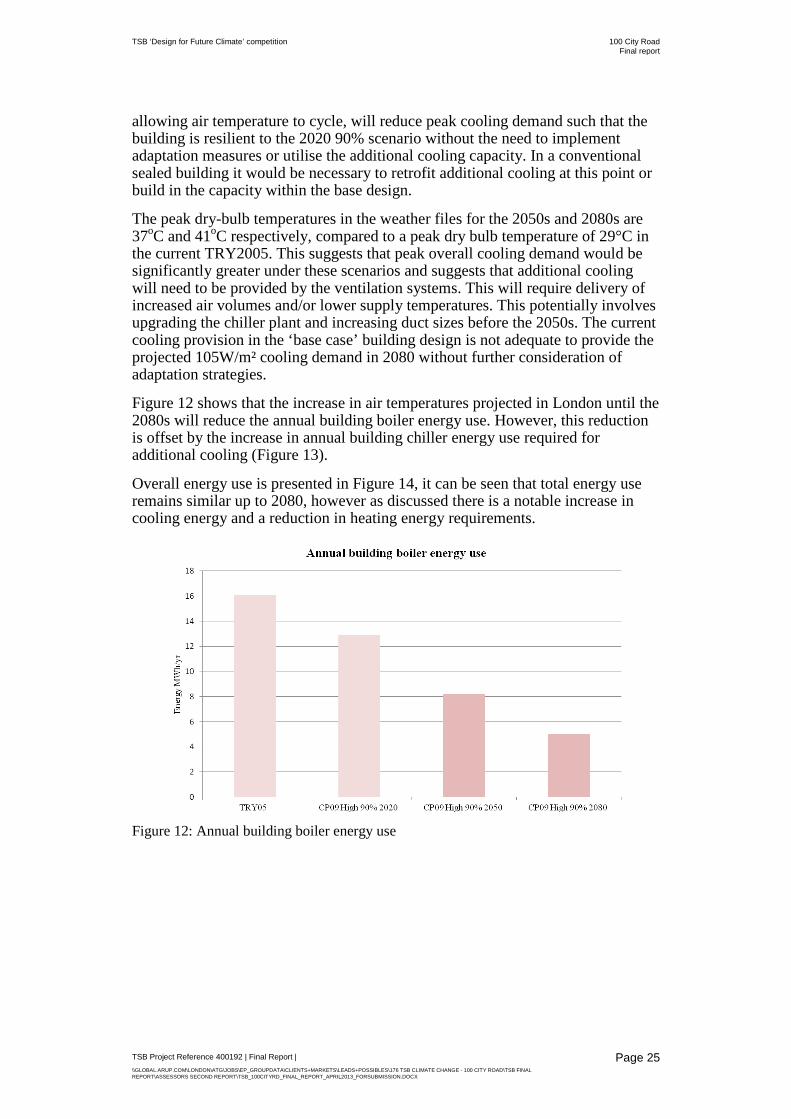
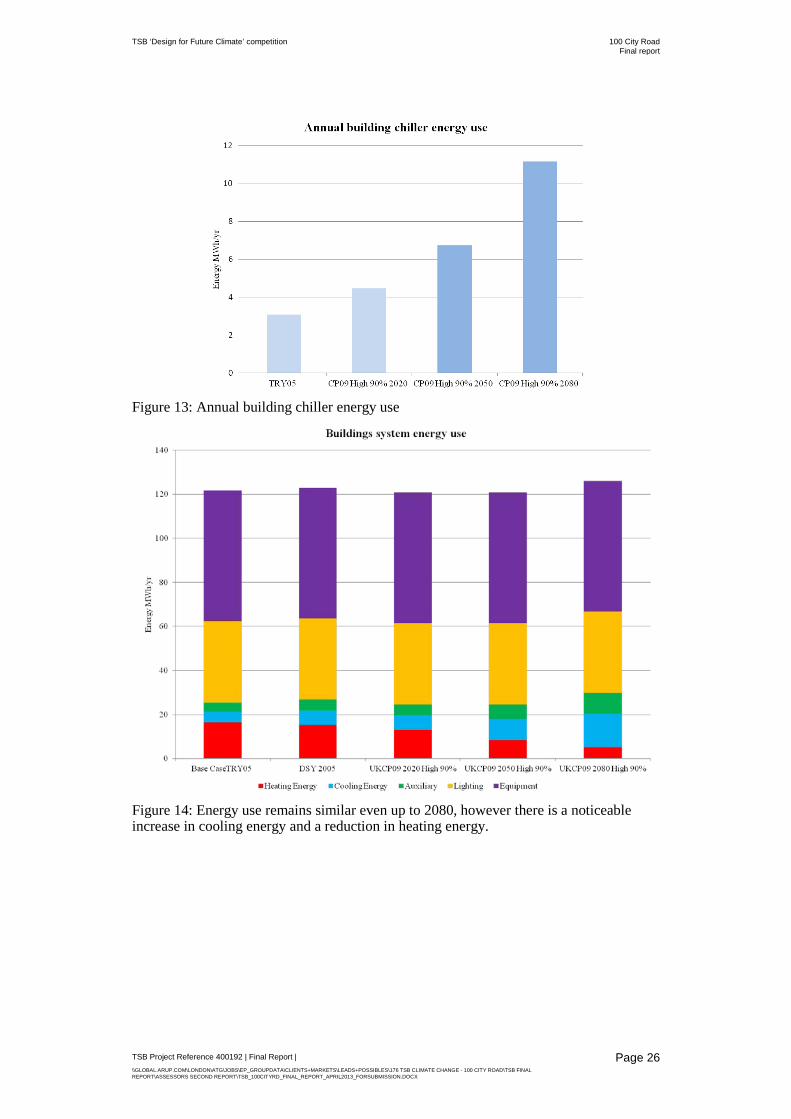
Figure 12 shows that the increase in air temperatures projected in London until the 2080s will reduce the annual building boiler energy use. However, this reduction is offset by the increase in annual building chiller energy use required for additional cooling (Figure 13).
Overall energy use is presented in Figure 14, it can be seen that total energy use remains similar up to 2080, however as discussed there is a notable increase in cooling energy and a reduction in heating energy requirements.
Figure 12: Annual building boiler energy use
TSB Project Reference 400192 | Final Report | \\GLOBAL.ARUP.COM\LONDON\ATG\JOBS\EP_GROUPDATA\CLIENTS+MARKETS\LEADS+POSSIBLES\176 TSB CLIMATE CHANGE - 100 CITY ROAD\TSB FINAL REPORT\ASSESSORS SECOND REPORT\TSB_100CITYRD_FINAL_REPORT_APRIL2013_FORSUBMISSION.DOCX
Page 25
TSB ‘Design for Future Climate’ competition 100 City Road Final report
Figure 13: Annual building chiller energy use
Figure 14: Energy use remains similar even up to 2080, however there is a noticeable increase in cooling energy and a reduction in heating energy.
TSB Project Reference 400192 | Final Report | \\GLOBAL.ARUP.COM\LONDON\ATG\JOBS\EP_GROUPDATA\CLIENTS+MARKETS\LEADS+POSSIBLES\176 TSB CLIMATE CHANGE - 100 CITY ROAD\TSB FINAL REPORT\ASSESSORS SECOND REPORT\TSB_100CITYRD_FINAL_REPORT_APRIL2013_FORSUBMISSION.DOCX
Page 26

TSB ‘Design for Future Climate’ competition 100 City Road Final report
3.3.1 Base case comparison with conventional approach to designing the same building
As part of the planning studies for the building the City Road design was compared to a geometrically identical building, but with a more conventional approach to its systems design which are compliant with the British Council of Offices (BCO) standards. The results showed a 10% to 20% improvement in the 100 City Road proposed design compared to a conventional sealed building using ceiling fed, air based and air conditioning systems. The results of these studies are shown in Figure 15 for information, but do not form part of this study.
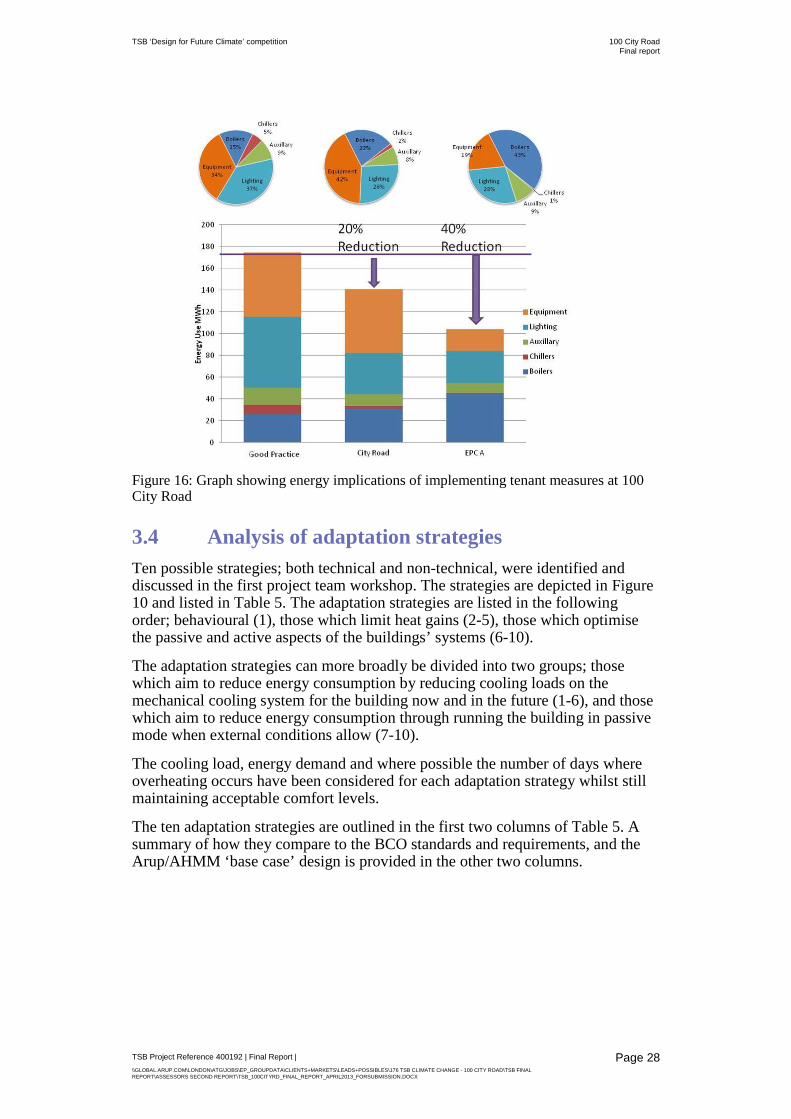
The City Road proposed design was modelled assuming that the building would be operated in a conventional way, controlling temperature to a fixed set point, without the use of mixed mode ventilation. This was to demonstrate minimum compliance. The City Road proposed design was also modelled to include measures that could be implemented by tenants to reduced energy consumption – such as mixed mode operation, reduced lighting and reduced ITC loads. The studies showed a potential reduction in energy demand between the conventional office building operation and implementing further measures of 20%, as shown in Figure 16. Again although this study is outside of the remit of this report it is provided here for information.
Although tenants could operate their air conditioning as efficiently as possible in a conventionally designed, sealed building, their scope for implementing further measures is limited as there are no passive measures designed into the building.
Figure 15: Comparison between a traditional fan coil unit system and the innovative embedded pipe system at 100 City Road.
TSB Project Reference 400192 | Final Report | \\GLOBAL.ARUP.COM\LONDON\ATG\JOBS\EP_GROUPDATA\CLIENTS+MARKETS\LEADS+POSSIBLES\176 TSB CLIMATE CHANGE - 100 CITY ROAD\TSB FINAL REPORT\ASSESSORS SECOND REPORT\TSB_100CITYRD_FINAL_REPORT_APRIL2013_FORSUBMISSION.DOCX
Page 27
TSB ‘Design for Future Climate’ competition 100 City Road Final report
Figure 16: Graph showing energy implications of implementing tenant measures at 100 City Road
3.4 Analysis of adaptation strategies Ten possible strategies; both technical and non-technical, were identified and discussed in the first project team workshop. The strategies are depicted in Figure 10 and listed in Table 5. The adaptation strategies are listed in the following order; behavioural (1), those which limit heat gains (2-5), those which optimise the passive and active aspects of the buildings’ systems (6-10).
The adaptation strategies can more broadly be divided into two groups; those which aim to reduce energy consumption by reducing cooling loads on the mechanical cooling system for the building now and in the future (1-6), and those which aim to reduce energy consumption through running the building in passive mode when external conditions allow (7-10).
The cooling load, energy demand and where possible the number of days where overheating occurs have been considered for each adaptation strategy whilst still maintaining acceptable comfort levels.
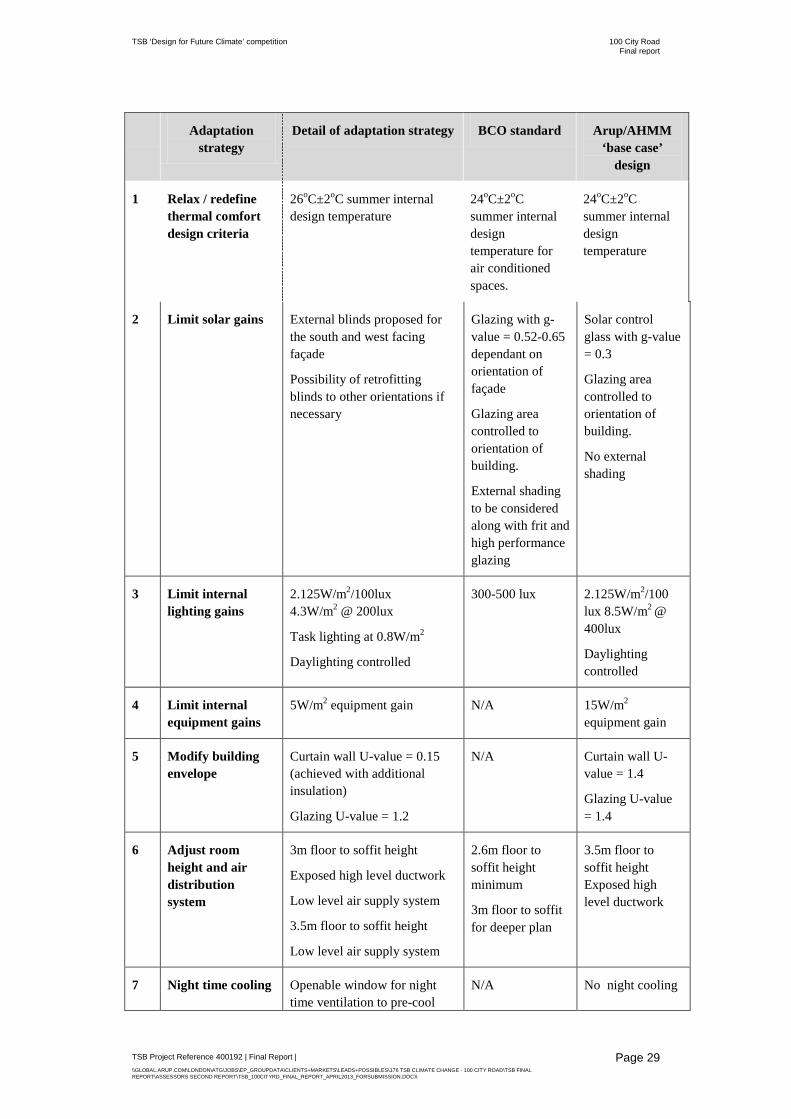
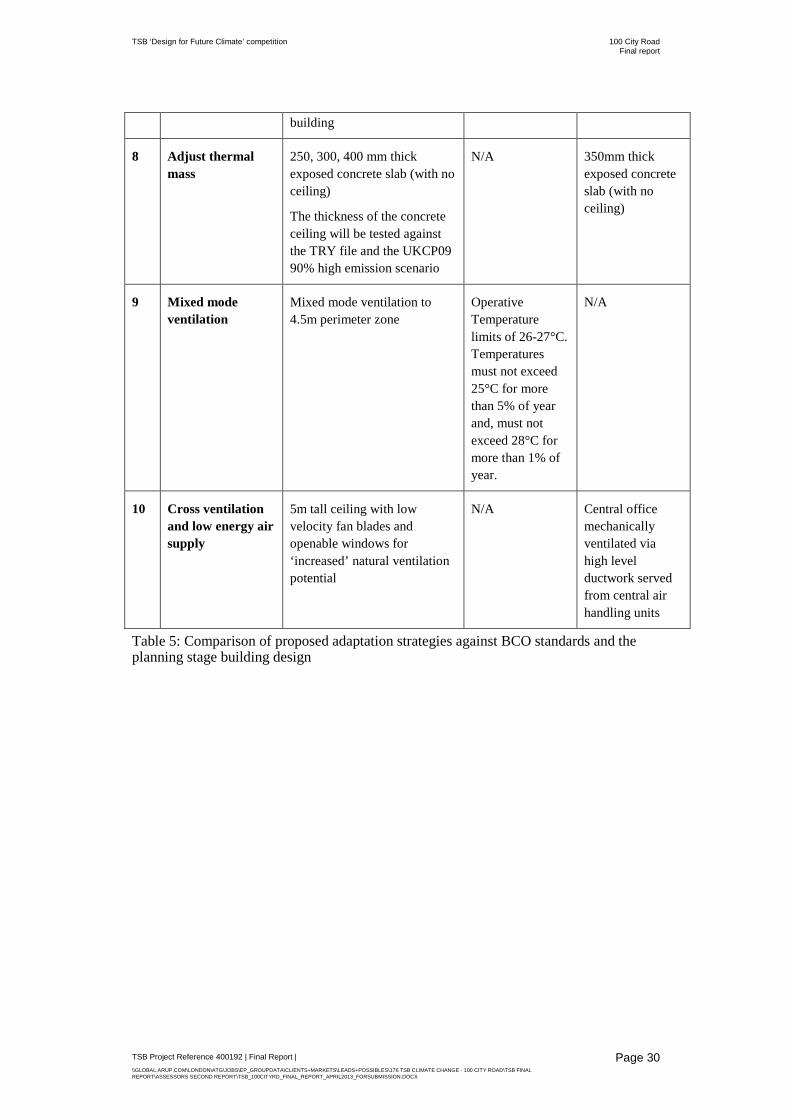
The ten adaptation strategies are outlined in the first two columns of Table 5. A summary of how they compare to the BCO standards and requirements, and the Arup/AHMM ‘base case’ design is provided in the other two columns.
TSB Project Reference 400192 | Final Report | \\GLOBAL.ARUP.COM\LONDON\ATG\JOBS\EP_GROUPDATA\CLIENTS+MARKETS\LEADS+POSSIBLES\176 TSB CLIMATE CHANGE - 100 CITY ROAD\TSB FINAL REPORT\ASSESSORS SECOND REPORT\TSB_100CITYRD_FINAL_REPORT_APRIL2013_FORSUBMISSION.DOCX
Page 28
TSB ‘Design for Future Climate’ competition 100 City Road Final report
Adaptation strategy
Detail of adaptation strategy BCO standard Arup/AHMM ‘base case’
design
1 Relax / redefine thermal comfort design criteria
26oC±2oC summer internal design temperature
24oC±2oC summer internal design temperature for air conditioned spaces.
24oC±2oC summer internal design temperature
2 Limit solar gains External blinds proposed for the south and west facing façade
Possibility of retrofitting blinds to other orientations if necessary
Glazing with g-value = 0.52-0.65 dependant on orientation of façade
Glazing area controlled to orientation of building.
External shading to be considered along with frit and high performance glazing
Solar control glass with g-value = 0.3
Glazing area controlled to orientation of building.
No external shading
3 Limit internal lighting gains
2.125W/m2/100lux 4.3W/m2 @ 200lux
Task lighting at 0.8W/m2
Daylighting controlled
300-500 lux
2.125W/m2/100 lux 8.5W/m2 @ 400lux
Daylighting controlled
4 Limit internal equipment gains
5W/m2 equipment gain N/A 15W/m2
equipment gain
5 Modify building envelope
Curtain wall U-value = 0.15 (achieved with additional insulation)
Glazing U-value = 1.2
N/A Curtain wall U-value = 1.4
Glazing U-value = 1.4
6 Adjust room height and air distribution system
3m floor to soffit height
Exposed high level ductwork
Low level air supply system
3.5m floor to soffit height
Low level air supply system
2.6m floor to soffit height minimum
3m floor to soffit for deeper plan
3.5m floor to soffit height Exposed high level ductwork
7 Night time cooling Openable window for night time ventilation to pre-cool
N/A No night cooling
TSB Project Reference 400192 | Final Report | \\GLOBAL.ARUP.COM\LONDON\ATG\JOBS\EP_GROUPDATA\CLIENTS+MARKETS\LEADS+POSSIBLES\176 TSB CLIMATE CHANGE - 100 CITY ROAD\TSB FINAL REPORT\ASSESSORS SECOND REPORT\TSB_100CITYRD_FINAL_REPORT_APRIL2013_FORSUBMISSION.DOCX
Page 29
TSB ‘Design for Future Climate’ competition 100 City Road Final report
building
8 Adjust thermal mass
250, 300, 400 mm thick exposed concrete slab (with no ceiling)
The thickness of the concrete ceiling will be tested against the TRY file and the UKCP09 90% high emission scenario
N/A 350mm thick exposed concrete slab (with no ceiling)
9 Mixed mode ventilation
Mixed mode ventilation to 4.5m perimeter zone
Operative Temperature limits of 26-27°C. Temperatures must not exceed 25°C for more than 5% of year and, must not exceed 28°C for more than 1% of year.
N/A
10 Cross ventilation and low energy air supply
5m tall ceiling with low velocity fan blades and openable windows for ‘increased’ natural ventilation potential
N/A Central office mechanically ventilated via high level ductwork served from central air handling units
Table 5: Comparison of proposed adaptation strategies against BCO standards and the planning stage building design
TSB Project Reference 400192 | Final Report | \\GLOBAL.ARUP.COM\LONDON\ATG\JOBS\EP_GROUPDATA\CLIENTS+MARKETS\LEADS+POSSIBLES\176 TSB CLIMATE CHANGE - 100 CITY ROAD\TSB FINAL REPORT\ASSESSORS SECOND REPORT\TSB_100CITYRD_FINAL_REPORT_APRIL2013_FORSUBMISSION.DOCX
Page 30
TSB ‘Design for Future Climate’ competition 100 City Road Final report
3.4.1 Relax / redefine thermal comfort design criteria
Proposed adaptation Current building services engineering best practice suggests a summer design temperature for internal environments within commercial buildings of 24oC±2oC (CIBSE). This temperature has also been adopted by the British Council of Offices (BCO). This criterion has been based upon certain assumptions including: office workers wearing traditional, smart, office attire; cultural and professional perceptions of what temperatures in office environments should be, and an expectation for fully mechanically cooled buildings within the commercial office sector.
This adaptation option explores the implications of a more relaxed attitude to clothing and what office temperatures and cooling systems could be. The Adaptive Thermal Comfort model indicates that people respond to warmer external air temperatures by wearing lighter clothing and also through other adaptive methods. It has been shown that occupants will accept a wider range of temperatures in situations where they are able to control their immediate environment (e.g. what they can wear, ability to open windows and adjust lighting).
Reflecting this, the upper limit of an acceptable internal temperature has been increased from 24±2oC to 26±2oC. The upper limit here is based on current CIBSE guidance for naturally ventilated offices which indicate that 1% of occupied hours over 28°C is acceptable. However, it should be noted that because 100 City Road is a deep plan building it does not formally adhere to the requirements of the Adaptive model.
This increase means that passive cooling can be used to achieve acceptable comfort temperatures for a larger proportion of the year, reducing mechanical cooling energy demand.
Outcomes Increasing the internal design temperature from 24oC±2°C to 26oC±2°C, modelled in IES and ROOM by selecting 26°C as the temperature limit, reduces both the peak cooling demand and the average annual cooling demand of the building. The building cooling system energy reductions for the current TRY 2005 and for the high 90% emissions climate change scenarios for the 2020s, 2050s and 2080s are presented in Figure 17. It can be seen that relaxing the comfort design criteria by 2°C can save 3.1MWhr/year in the current climate (a 12.2% reduction of the total annual cooling system energy), and as much as 6.4MWhr/year by the 2080s (a 21.4% reduction of the total annual cooling system energy).
Occupants will accept a wider range of temperatures in situations where they are able to control their immediate environment. Adaptive techniques such as wearing lighter clothing, opening windows and adjusting lighting will be employed. However, it should be noted that as 100 City Road is a deep plan building, and does not strictly conform to the requirements of the Adaptive model, and also that comfort is a subjective matter, there is the possibility that there will be occupants who do not find the increase in temperature acceptable.
TSB Project Reference 400192 | Final Report | \\GLOBAL.ARUP.COM\LONDON\ATG\JOBS\EP_GROUPDATA\CLIENTS+MARKETS\LEADS+POSSIBLES\176 TSB CLIMATE CHANGE - 100 CITY ROAD\TSB FINAL REPORT\ASSESSORS SECOND REPORT\TSB_100CITYRD_FINAL_REPORT_APRIL2013_FORSUBMISSION.DOCX
Page 31

TSB ‘Design for Future Climate’ competition 100 City Road Final report
Figure 17: Comparison of annual system energy use for internal comfort temperature set at 24±2oC and 26±2oC for the TRY05, 2020s, 2050s and 2080s.
TSB Project Reference 400192 | Final Report | \\GLOBAL.ARUP.COM\LONDON\ATG\JOBS\EP_GROUPDATA\CLIENTS+MARKETS\LEADS+POSSIBLES\176 TSB CLIMATE CHANGE - 100 CITY ROAD\TSB FINAL REPORT\ASSESSORS SECOND REPORT\TSB_100CITYRD_FINAL_REPORT_APRIL2013_FORSUBMISSION.DOCX
Page 32

TSB ‘Design for Future Climate’ competition 100 City Road Final report
3.4.2 Limiting solar gain
Proposed adaptation A decision was taken during the planning design stage to limit the amount of glazing, and to modify the glazing ratio according to façade orientation. Solar control glass was used as a secondary measure.
For this adaptation option, further refinements in the approach to glazing are explored. Increased shading, fritting, blinds and black out shutters are considered under the high emissions 90% climate change scenarios for the 2020s, 2050s and 2080s.
The tall windows on the planning stage design would make overhanging shades ineffective. Therefore, external blinds were proposed for the South and West facing façades. These can be used to limit solar gain, providing up to 100% shading under extreme weather conditions.
Outcomes The solar gains for the planning stage design are approximately 25W/m2 for over 90% of the occupied hours of the year. By introducing solar controlled external shading on the South and West facing façades and deploying the blinds when incident solar radiation is greater than 200W/m2 the maximum solar gains can be limited to approximately 15W/m2 .
The blinds act to reduce the required cooling loads in summer. However, due to the nature of the model, it was not possible to vary the control system in order to introduce more beneficial solar gain in winter months. As a result, the model indicated an increase in heating loads that in reality could be eliminated by the building’s management system.
Heating, cooling and auxiliary energy use is obtained by controlling the internal air temperature to 26oC and is presented alongside lighting and equipment use in Figure 18 for a typical office floor.
Focusing on the cooling energy used in Figure 18, it can be seen that the overall saving predicted by limiting solar gains through the use of blinds lies in the range of 10%-14% for the four weather scenarios tested.
Although the energy saving potential of blinds is positive, it does not take into account the negative psychological effects of reduced access to daylight for building users. In addition, increased deployment of blinds to control solar gain can increase the lighting energy demand during day light hours. Lighting energy demand is responsible for more than half of the total building energy system usage, but this has not been accounted for in this model.
To counteract this, and depending on the geometry of the office space, daylight controlled dimming can be used to reduce lighting energy by as much as 30% across all the scenarios. This saving is more significant than the saving achieved using external shading systems. In addition this has benefits in terms of office workers’ preference for natural daylight.
TSB Project Reference 400192 | Final Report | \\GLOBAL.ARUP.COM\LONDON\ATG\JOBS\EP_GROUPDATA\CLIENTS+MARKETS\LEADS+POSSIBLES\176 TSB CLIMATE CHANGE - 100 CITY ROAD\TSB FINAL REPORT\ASSESSORS SECOND REPORT\TSB_100CITYRD_FINAL_REPORT_APRIL2013_FORSUBMISSION.DOCX
Page 33

TSB ‘Design for Future Climate’ competition 100 City Road Final report
Therefore, if internal or external blinds are deployed, they should be fully or partially retractable when ambient conditions mean there is no risk of overheating or glare, in order to maximise the benefits of daylighting throughout the year, and to harness positive winter solar gain.
This adaptation strategy has informed the design of the façade by the architect at the clients’ request, see Section 3.5 for further information.
Figure 18: Annual building system energy use for different solar gain scenarios on a typical office floor
TSB Project Reference 400192 | Final Report | \\GLOBAL.ARUP.COM\LONDON\ATG\JOBS\EP_GROUPDATA\CLIENTS+MARKETS\LEADS+POSSIBLES\176 TSB CLIMATE CHANGE - 100 CITY ROAD\TSB FINAL REPORT\ASSESSORS SECOND REPORT\TSB_100CITYRD_FINAL_REPORT_APRIL2013_FORSUBMISSION.DOCX
Page 34

TSB ‘Design for Future Climate’ competition 100 City Road Final report
3.4.3 Limiting internal lighting gains
Proposed adaptation The Building Regulations Approved Document Part L 2010 includes stringent lighting power density targets. Although it is not mandatory to achieve the target, failure to do so makes it more difficult to achieve the required overall building carbon intensity requirements.
In the planning stage design, lighting power density has been set to achieve the Part L notional building target of 400 lux at 2.15M/m2/100 lux, giving a lighting load of 8.6W/m2.
In the proposed adaptation, the general lighting level has been reduced to 200lux, giving a lighting load of 4.3W/m2 giving a lighting load of 4.3W/m2. This will be supplemented by task lighting that consumes an additional 8W per desk to give a total lighting load of 5.1W/m2.
Daylight dimming control has also been proposed for the planning stage design; however this has been omitted for both the base case and the adaptation model, so that the impact of the adaptation described above can be more clearly understood.
Outcomes The average building system energy saving between the ‘base case’ design and the adaptation case was approximately 15% for the TRY 2005.
Reducing the lighting load to 5.1W/m2 causes heating energy requirements to increase by a small proportion, as can be seen by the heating energy increase between the base case and the TRY 2005 cases in Figure 19. However this is outweighed by reductions in cooling and auxiliary energy requirements, as shown by the reduction in green and blue bars from the base case to the TRY2005 case in Figure 19.
When subjected to the climate projection files the reduction in energy from the current levels remains at approximately 15%; however as there is an increase in cooling load when the external air temperature is increased from 2.4MWhr/yr in TRY2005 to 10MWhr/yr in 2080 High 90%. This will in turn increase overall building energy demand, as shown Figure 19.
TSB Project Reference 400192 | Final Report | \\GLOBAL.ARUP.COM\LONDON\ATG\JOBS\EP_GROUPDATA\CLIENTS+MARKETS\LEADS+POSSIBLES\176 TSB CLIMATE CHANGE - 100 CITY ROAD\TSB FINAL REPORT\ASSESSORS SECOND REPORT\TSB_100CITYRD_FINAL_REPORT_APRIL2013_FORSUBMISSION.DOCX
Page 35

TSB ‘Design for Future Climate’ competition 100 City Road Final report
Figure 19: Building system energy use with reduced lighting power densities.
TSB Project Reference 400192 | Final Report | \\GLOBAL.ARUP.COM\LONDON\ATG\JOBS\EP_GROUPDATA\CLIENTS+MARKETS\LEADS+POSSIBLES\176 TSB CLIMATE CHANGE - 100 CITY ROAD\TSB FINAL REPORT\ASSESSORS SECOND REPORT\TSB_100CITYRD_FINAL_REPORT_APRIL2013_FORSUBMISSION.DOCX
Page 36
TSB ‘Design for Future Climate’ competition 100 City Road Final report
3.4.4 Limiting internal equipment gains
Proposed adaptation For this adaptation, a ‘thin network’ system is proposed. This transfers processing functions from desk-based equipment to an isolated server, and thus reduces cooling demand in the occupied spaces. To reflect this, a reduction in the equipment load from 15W/m2 to 5W/m2is proposed.
Additional energy savings can be made in winter months by recovering heat from the server room exhausts to pre-heat the office air supply.
Three scenarios were reviewed:
1. An on-floor server room (typically 50 W/m²). Where the external temperatures are below 14oC, internal dampers draw air from the adjacent office space and exhaust hot air at high level back into the office. When external temperatures are above 14oC, the damper to the office will close while a second damper opens to allow hot air to be exhausted to outside.
2. Thin client technology where on floor equipment load is reduced from 15W/m2 to 5W/m2
3. Thin client technology with internal dampers to provide a proportion of waste heat from the server room back to the office during cold periods.
The thermal model was modified to include two 20m2 on-floor server rooms to serve two tenants on each floor under all three scenarios. The server room is rated at 10kW and runs at full load for 12 hours per day. The server loads are set back to 30% during the night time. The floors have been modelled with dampers in order to allow air movement between the two zones when conditions are favourable for Scenarios 1 and 3 described above.
Outcomes As server room equipment is run continuously the electrical energy demand is significant. Modelling the saving that can be made with a thin client system can be challenging as savings differ greatly between suppliers and different usage patterns can have a significant impact. Figure 20 shows the comparative energy usage for each of the investigated scenarios, equipment use is shown in purple
Modelling results in this case have shown a total energy saving for the TRY2005 of 1.5%, 10.6% and 13.1% for scenarios 1, 2 and 3 respectively (Figure 20). There is no real difference in total building energy consumption between the TRY2005 and the 90% high emissions climate change scenario 2080s models, but the proportion of cooling energy increases in relation to heating energy. This is because the increase in cooling energy is offset by the reduction in heating energy.
Due to the many variables associated with savings using a thin client system, it is highly recommended that more detailed modelling than is presented here takes place within the MEP design team to justify savings on a case by case basis.
Scenarios 1 and 3 both illustrate heating and cooling energy savings. Using thin client servers was found to reduce cooling energy by 10.8% in the 2080s 90% high emissions scenario.
TSB Project Reference 400192 | Final Report | \\GLOBAL.ARUP.COM\LONDON\ATG\JOBS\EP_GROUPDATA\CLIENTS+MARKETS\LEADS+POSSIBLES\176 TSB CLIMATE CHANGE - 100 CITY ROAD\TSB FINAL REPORT\ASSESSORS SECOND REPORT\TSB_100CITYRD_FINAL_REPORT_APRIL2013_FORSUBMISSION.DOCX
Page 37

TSB ‘Design for Future Climate’ competition 100 City Road Final report
Scenario 2 achieved savings in electrical equipment load at the expense of an increase in heating loads. The low performing curtain wall has as significant impact in winter where heating loads increase in order to maintain comfortable conditions.
In general, reducing on floor equipment gains and subsequent overheating risk has a significant impact on reducing building system energy consumption. Recovering the heat generated at the server room provides a significant saving in heating energy to the office.
Figure 20: Building system energy use with reduced equipment loads
TSB Project Reference 400192 | Final Report | \\GLOBAL.ARUP.COM\LONDON\ATG\JOBS\EP_GROUPDATA\CLIENTS+MARKETS\LEADS+POSSIBLES\176 TSB CLIMATE CHANGE - 100 CITY ROAD\TSB FINAL REPORT\ASSESSORS SECOND REPORT\TSB_100CITYRD_FINAL_REPORT_APRIL2013_FORSUBMISSION.DOCX
Page 38

TSB ‘Design for Future Climate’ competition 100 City Road Final report
3.4.5 Modification of the building envelope
Proposed adaptation This adaptation strategy is focused on improving the U-value of the building fabric, rather than the air tightness. The current planning stage design utilises a curtain wall system with a U-value of 1.4 W/m2K. This is better than Part L of the Building Regulations which requires the U-value of curtain walling to be 2.2W/m2K. However, it not as low a U-value as the Part L requirements for an external wall of 0.35 W/m2K. The proposed glazed area of the building has g-value of 0.3.
The thermal performance of the curtain wall system is lower than a traditional façade construction with continual insulation. The lower level of thermal insulation means that increased cooling energy is required to maintain comfortable temperatures during warm periods. Increased insulation would have benefits in terms of reducing thermal gain during hot weather. In addition improving the thermal performance of the envelope will reduce heat loss in the winter.
Outcomes By improving the thermal performance of the building envelope, the annual heating energy required can be reduced by up to 58% by the 2080s. However, for an office building, cooling is required for the majority of the year due to internal gains from ITC equipment, people and lighting. Improving the thermal performance of the building envelope means more heat would potentially be trapped within the building and more cooling energy is likely to be required.
Under TRY2005 conditions, improvements in the building envelope resulted in the required annual heating energy being reduced by 48% while cooling energy increased by 31%. Overall when lighting and auxiliary energy are also included, a net energy saving of approximately 10.8% on the building annual systems energy is seen for the TRY with improved fabric, as shown in Figure 21. Peak loads will reduce as these are likely to occur when hotter inside than outside (see Figure 22).
The heating energy saved is approximately 58% with the improved thermal envelope using the 2080 90% high emissions weather file,. However, the cooling load increases by 7%. The actual energy saved when reviewed against the overall building systems energy use is modest, at around 2.8%.
By improving the fabric U-value, both the peak heating and cooling demand of the office building will be affected (Figure 22). Whilst the peak heating load decreases, the peak cooling load increases under 2080 90% high emissions conditions due to heat being retained within the building envelope.
A typical chiller life is between 15-20 years; therefore the chillers will likely need to be replaced before the 2050s and 2080s, and there is no benefit to be gained from installing increased capacity for the ‘base case’ building now. However, the results of the modelling demonstrate that it is important to leave surplus space in the plant rooms, to allow for future instalment of chillers with increased capacities.
TSB Project Reference 400192 | Final Report | \\GLOBAL.ARUP.COM\LONDON\ATG\JOBS\EP_GROUPDATA\CLIENTS+MARKETS\LEADS+POSSIBLES\176 TSB CLIMATE CHANGE - 100 CITY ROAD\TSB FINAL REPORT\ASSESSORS SECOND REPORT\TSB_100CITYRD_FINAL_REPORT_APRIL2013_FORSUBMISSION.DOCX
Page 39
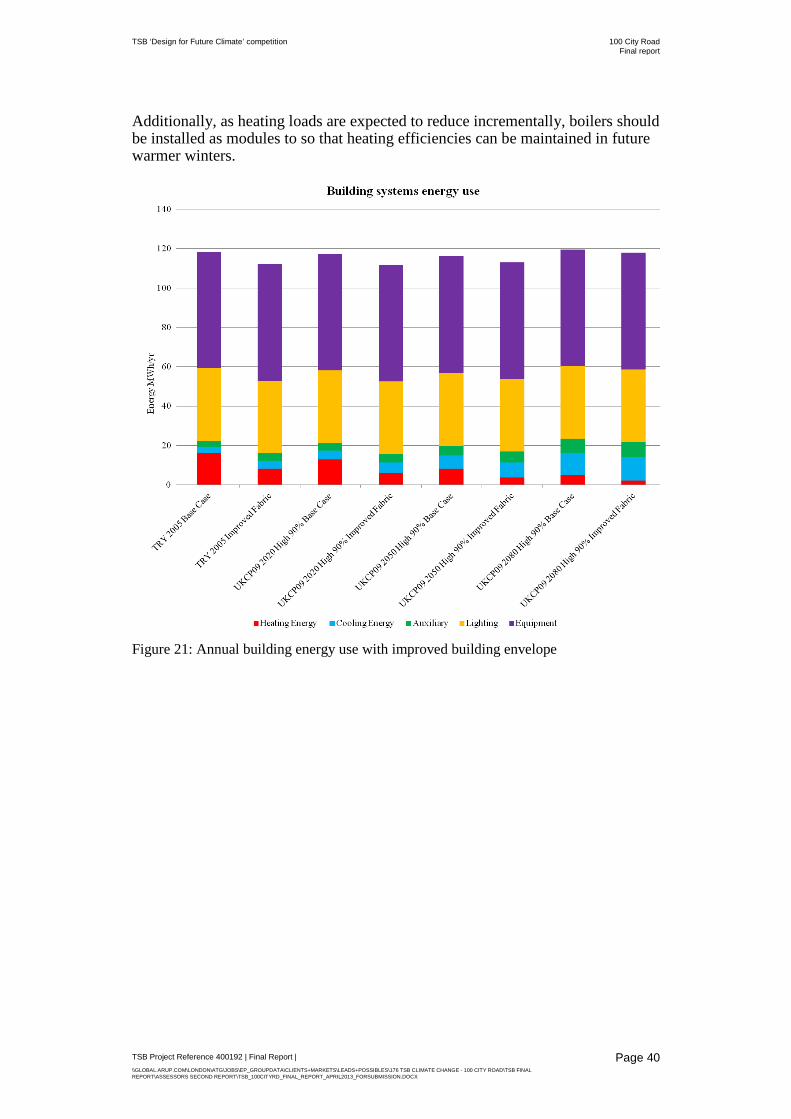
TSB ‘Design for Future Climate’ competition 100 City Road Final report
Additionally, as heating loads are expected to reduce incrementally, boilers should be installed as modules to so that heating efficiencies can be maintained in future warmer winters.
Figure 21: Annual building energy use with improved building envelope
TSB Project Reference 400192 | Final Report | \\GLOBAL.ARUP.COM\LONDON\ATG\JOBS\EP_GROUPDATA\CLIENTS+MARKETS\LEADS+POSSIBLES\176 TSB CLIMATE CHANGE - 100 CITY ROAD\TSB FINAL REPORT\ASSESSORS SECOND REPORT\TSB_100CITYRD_FINAL_REPORT_APRIL2013_FORSUBMISSION.DOCX
Page 40
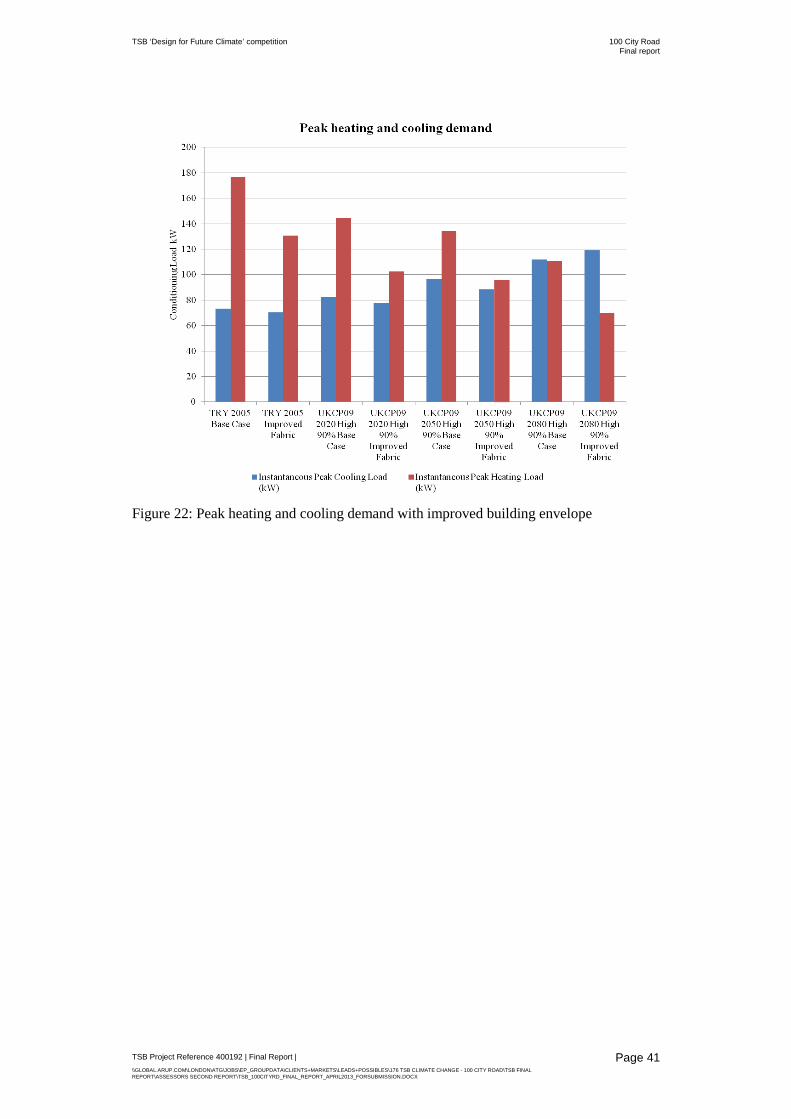
TSB ‘Design for Future Climate’ competition 100 City Road Final report
Figure 22: Peak heating and cooling demand with improved building envelope
TSB Project Reference 400192 | Final Report | \\GLOBAL.ARUP.COM\LONDON\ATG\JOBS\EP_GROUPDATA\CLIENTS+MARKETS\LEADS+POSSIBLES\176 TSB CLIMATE CHANGE - 100 CITY ROAD\TSB FINAL REPORT\ASSESSORS SECOND REPORT\TSB_100CITYRD_FINAL_REPORT_APRIL2013_FORSUBMISSION.DOCX
Page 41
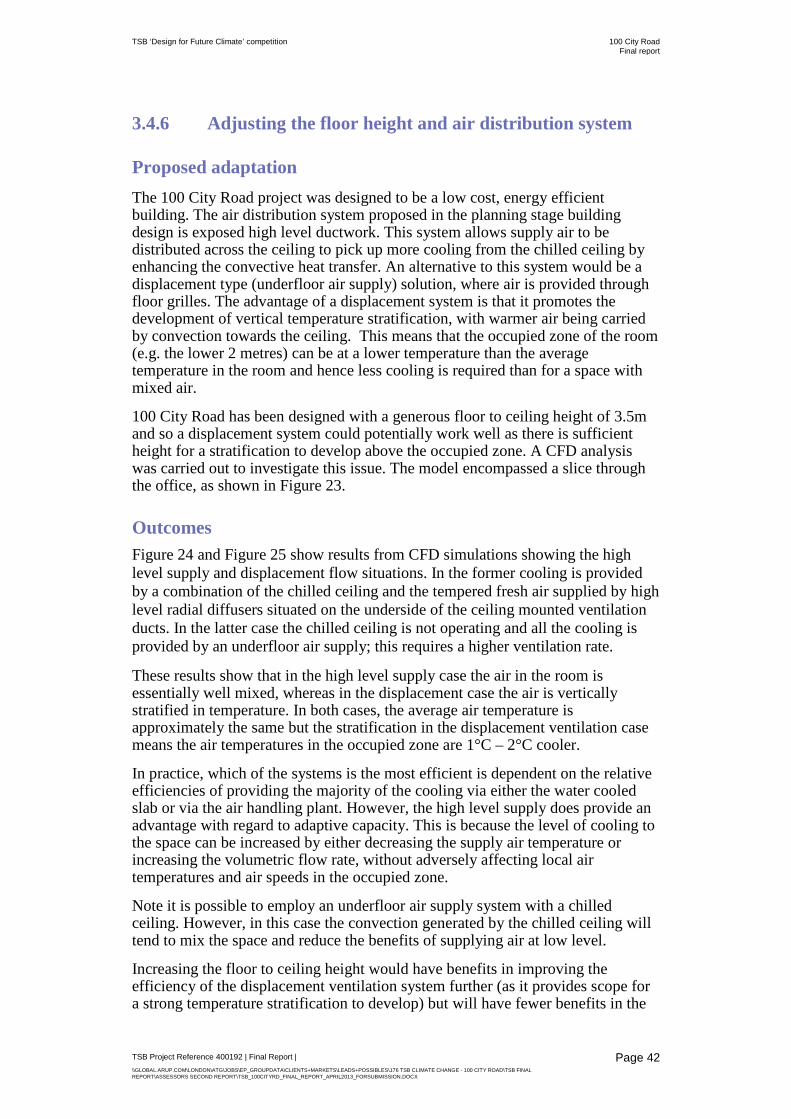
TSB ‘Design for Future Climate’ competition 100 City Road Final report
3.4.6 Adjusting the floor height and air distribution system
Proposed adaptation The 100 City Road project was designed to be a low cost, energy efficient building. The air distribution system proposed in the planning stage building design is exposed high level ductwork. This system allows supply air to be distributed across the ceiling to pick up more cooling from the chilled ceiling by enhancing the convective heat transfer. An alternative to this system would be a displacement type (underfloor air supply) solution, where air is provided through floor grilles. The advantage of a displacement system is that it promotes the development of vertical temperature stratification, with warmer air being carried by convection towards the ceiling. This means that the occupied zone of the room (e.g. the lower 2 metres) can be at a lower temperature than the average temperature in the room and hence less cooling is required than for a space with mixed air.
100 City Road has been designed with a generous floor to ceiling height of 3.5m and so a displacement system could potentially work well as there is sufficient height for a stratification to develop above the occupied zone. A CFD analysis was carried out to investigate this issue. The model encompassed a slice through the office, as shown in Figure 23.
Outcomes Figure 24 and Figure 25 show results from CFD simulations showing the high level supply and displacement flow situations. In the former cooling is provided by a combination of the chilled ceiling and the tempered fresh air supplied by high level radial diffusers situated on the underside of the ceiling mounted ventilation ducts. In the latter case the chilled ceiling is not operating and all the cooling is provided by an underfloor air supply; this requires a higher ventilation rate.
These results show that in the high level supply case the air in the room is essentially well mixed, whereas in the displacement case the air is vertically stratified in temperature. In both cases, the average air temperature is approximately the same but the stratification in the displacement ventilation case means the air temperatures in the occupied zone are 1°C – 2°C cooler.
In practice, which of the systems is the most efficient is dependent on the relative efficiencies of providing the majority of the cooling via either the water cooled slab or via the air handling plant. However, the high level supply does provide an advantage with regard to adaptive capacity. This is because the level of cooling to the space can be increased by either decreasing the supply air temperature or increasing the volumetric flow rate, without adversely affecting local air temperatures and air speeds in the occupied zone.
Note it is possible to employ an underfloor air supply system with a chilled ceiling. However, in this case the convection generated by the chilled ceiling will tend to mix the space and reduce the benefits of supplying air at low level.
Increasing the floor to ceiling height would have benefits in improving the efficiency of the displacement ventilation system further (as it provides scope for a strong temperature stratification to develop) but will have fewer benefits in the
TSB Project Reference 400192 | Final Report | \\GLOBAL.ARUP.COM\LONDON\ATG\JOBS\EP_GROUPDATA\CLIENTS+MARKETS\LEADS+POSSIBLES\176 TSB CLIMATE CHANGE - 100 CITY ROAD\TSB FINAL REPORT\ASSESSORS SECOND REPORT\TSB_100CITYRD_FINAL_REPORT_APRIL2013_FORSUBMISSION.DOCX
Page 42
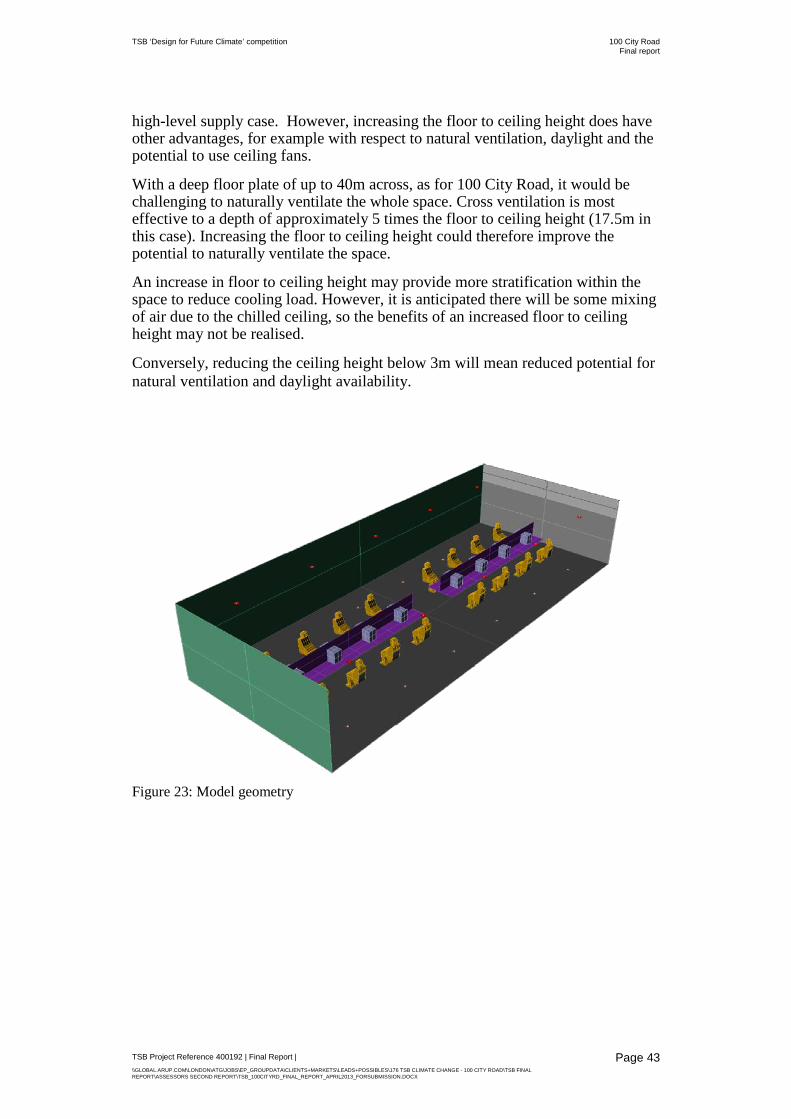
TSB ‘Design for Future Climate’ competition 100 City Road Final report
high-level supply case. However, increasing the floor to ceiling height does have other advantages, for example with respect to natural ventilation, daylight and the potential to use ceiling fans.
With a deep floor plate of up to 40m across, as for 100 City Road, it would be challenging to naturally ventilate the whole space. Cross ventilation is most effective to a depth of approximately 5 times the floor to ceiling height (17.5m in this case). Increasing the floor to ceiling height could therefore improve the potential to naturally ventilate the space.
An increase in floor to ceiling height may provide more stratification within the space to reduce cooling load. However, it is anticipated there will be some mixing of air due to the chilled ceiling, so the benefits of an increased floor to ceiling height may not be realised.
Conversely, reducing the ceiling height below 3m will mean reduced potential for natural ventilation and daylight availability.
Figure 23: Model geometry
TSB Project Reference 400192 | Final Report | \\GLOBAL.ARUP.COM\LONDON\ATG\JOBS\EP_GROUPDATA\CLIENTS+MARKETS\LEADS+POSSIBLES\176 TSB CLIMATE CHANGE - 100 CITY ROAD\TSB FINAL REPORT\ASSESSORS SECOND REPORT\TSB_100CITYRD_FINAL_REPORT_APRIL2013_FORSUBMISSION.DOCX
Page 43
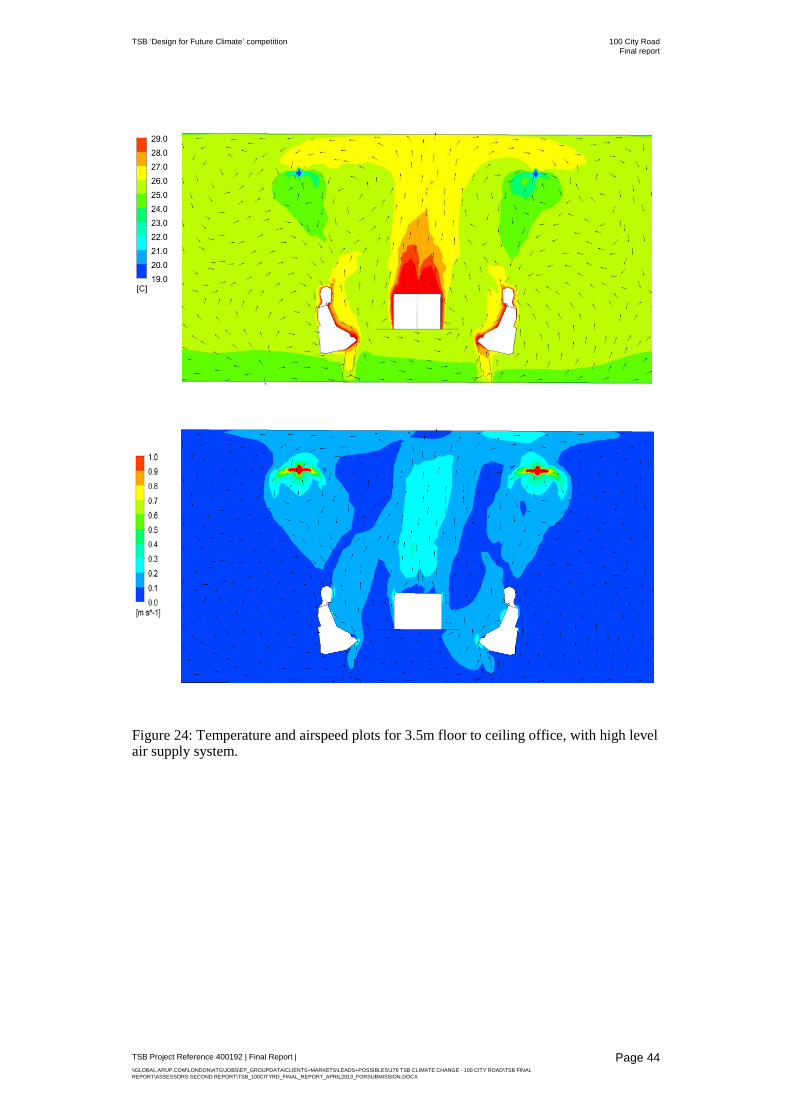
TSB ‘Design for Future Climate’ competition 100 City Road Final report
Figure 24: Temperature and airspeed plots for 3.5m floor to ceiling office, with high level air supply system.
TSB Project Reference 400192 | Final Report | \\GLOBAL.ARUP.COM\LONDON\ATG\JOBS\EP_GROUPDATA\CLIENTS+MARKETS\LEADS+POSSIBLES\176 TSB CLIMATE CHANGE - 100 CITY ROAD\TSB FINAL REPORT\ASSESSORS SECOND REPORT\TSB_100CITYRD_FINAL_REPORT_APRIL2013_FORSUBMISSION.DOCX
Page 44
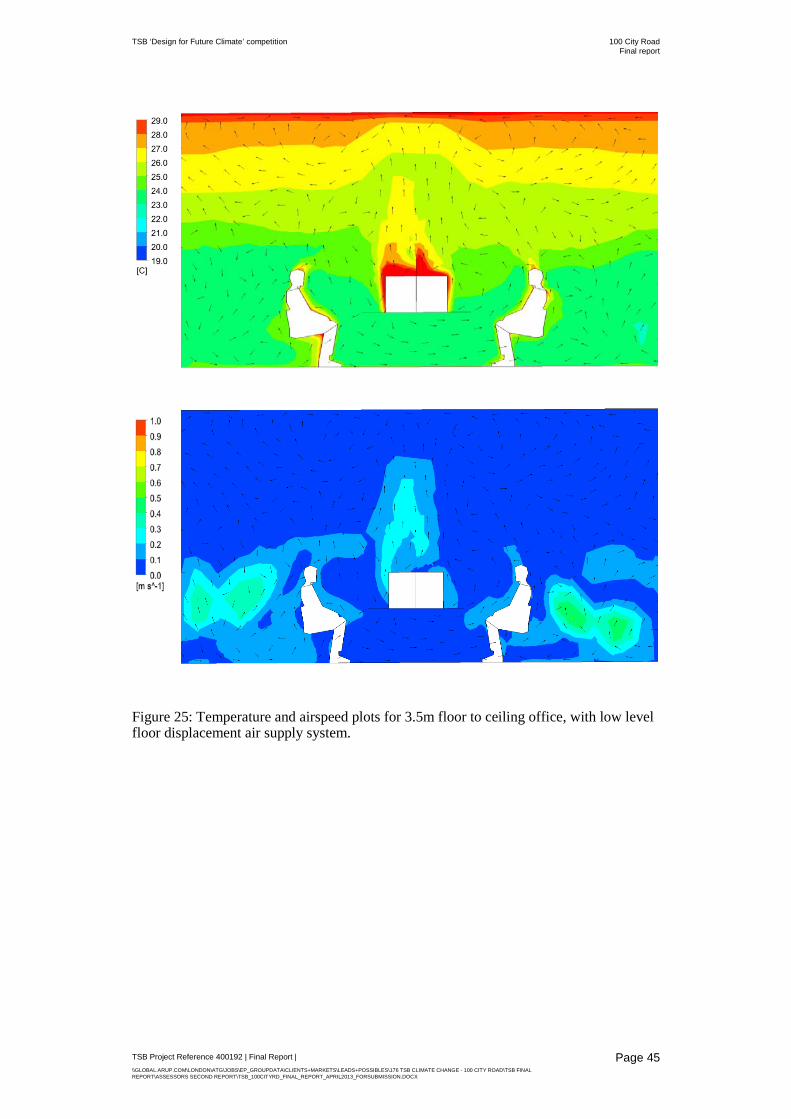
TSB ‘Design for Future Climate’ competition 100 City Road Final report
Figure 25: Temperature and airspeed plots for 3.5m floor to ceiling office, with low level floor displacement air supply system.
TSB Project Reference 400192 | Final Report | \\GLOBAL.ARUP.COM\LONDON\ATG\JOBS\EP_GROUPDATA\CLIENTS+MARKETS\LEADS+POSSIBLES\176 TSB CLIMATE CHANGE - 100 CITY ROAD\TSB FINAL REPORT\ASSESSORS SECOND REPORT\TSB_100CITYRD_FINAL_REPORT_APRIL2013_FORSUBMISSION.DOCX
Page 45

TSB ‘Design for Future Climate’ competition 100 City Road Final report
3.4.7 Night cooling
Proposed adaptation A feature of the design of 100 City Road is that the 300mm concrete ceiling slabs are left uncovered, thereby enabling the thermal mass in the ceiling slabs to be used as a means to regulate space temperatures. In order to utilise this thermal mass most effectively it is necessary to ventilate the offices at night to achieve ‘night cooling’. The night cooling causes the ceiling slab temperature to be lower at the start the day, meaning that the load on the chilled water system is reduced and energy savings are made. In certain periods of the year, it may be possible to use thermal mass with night cooling to passively regulate space temperatures without the use of the chilled ceiling. The effectiveness of the thermal mass of the building will be examined in both active and passive modes of operation.
One of the impacts of climate change will be an increase in average night time temperatures which will limit the effectiveness of night cooling in both modes.
For the purpose of the modelling, a night cooling control strategy was used in which night ventilation is operated between 9pm and 6am. In some of the future timeslices, night time temperatures are actually too high for night cooling to be beneficial and a more sophisticated control strategy would preclude night cooling on those evenings. It was assumed the ventilation is provided by natural means through the façade openings (see Section 3.4.9).
Outcomes We consider first the effect of night cooling when the chilled ceiling is in operation. Figure 26 shows the variation of the space temperatures over a three day warm period with and without night cooling in operation. During the day the space temperatures are very similar – because these are being controlled by the chilled ceiling – but at night it is evident that the space temperatures are reduced by the night cooling and this leads to a decrease in the cooling energy needed during the day. Figure 27 shows the predicted annual cooling energy with and without night cooling. For the TRY2005 data, night cooling reduces the cooling energy consumption by around 25%. For the 90% high emissions 2080s timeslice, the effect is somewhat reduced but is still appreciable.
Considering next the passive model of operation, Figure 28 shows the variation in space temperatures on and around the hottest day of the TRY2005 data with and without the chilled ceiling in operation and with and without night cooling. When the chilled ceiling is turned off and night cooling is not utilised the space temperature remains continuously warm (here, above the external air temperature). When night cooling is utilised, however, the performance is substantially improved with peak temperatures on the warmest day remaining below the outside peak temperature. These results indicate that it may be viable to passively cool the office spaces for much of the year using only night ventilation and thermal mass.
Figure 29 shows the percentage of the year that the space operative temperature is predicted to be above 26°C. For the TRY data, the chilled ceiling would only be needed for around 6% of the year, increasing to around 32% of the year by the 2050s. Also shown are results for the CIBSE Design Summer Year weather data
TSB Project Reference 400192 | Final Report | \\GLOBAL.ARUP.COM\LONDON\ATG\JOBS\EP_GROUPDATA\CLIENTS+MARKETS\LEADS+POSSIBLES\176 TSB CLIMATE CHANGE - 100 CITY ROAD\TSB FINAL REPORT\ASSESSORS SECOND REPORT\TSB_100CITYRD_FINAL_REPORT_APRIL2013_FORSUBMISSION.DOCX
Page 46
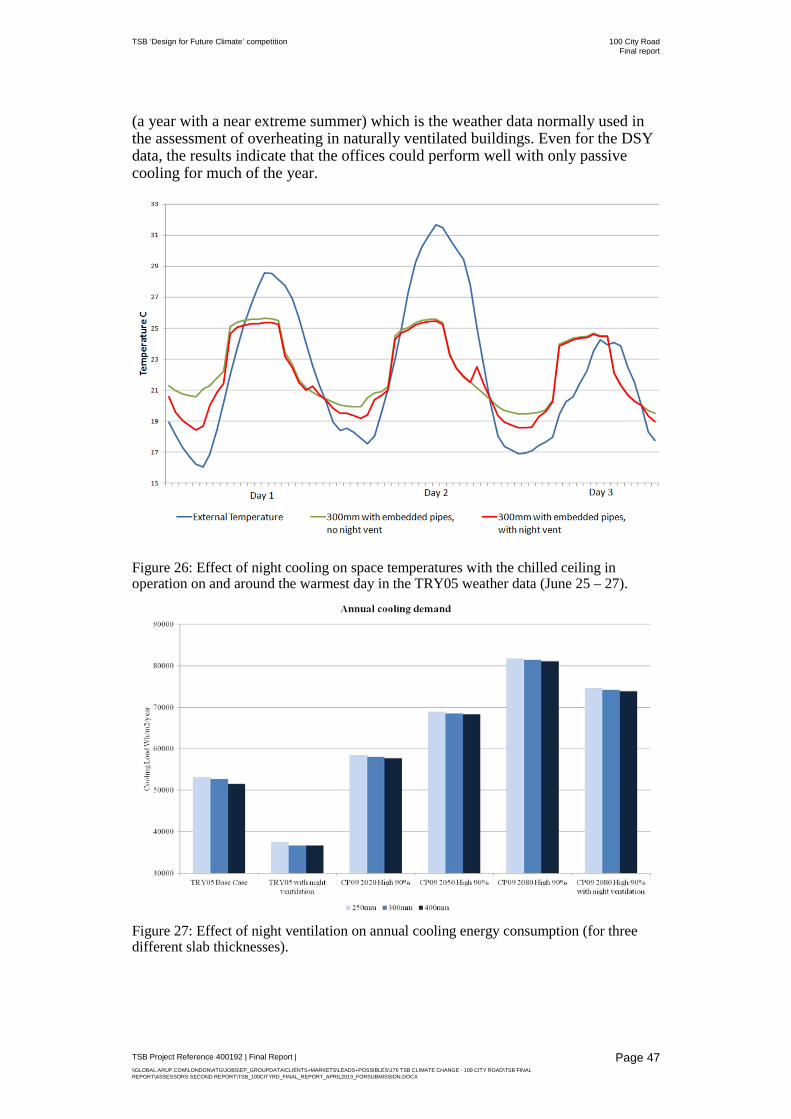
TSB ‘Design for Future Climate’ competition 100 City Road Final report
(a year with a near extreme summer) which is the weather data normally used in the assessment of overheating in naturally ventilated buildings. Even for the DSY data, the results indicate that the offices could perform well with only passive cooling for much of the year.
Figure 26: Effect of night cooling on space temperatures with the chilled ceiling in operation on and around the warmest day in the TRY05 weather data (June 25 – 27).
Figure 27: Effect of night ventilation on annual cooling energy consumption (for three different slab thicknesses).
TSB Project Reference 400192 | Final Report | \\GLOBAL.ARUP.COM\LONDON\ATG\JOBS\EP_GROUPDATA\CLIENTS+MARKETS\LEADS+POSSIBLES\176 TSB CLIMATE CHANGE - 100 CITY ROAD\TSB FINAL REPORT\ASSESSORS SECOND REPORT\TSB_100CITYRD_FINAL_REPORT_APRIL2013_FORSUBMISSION.DOCX
Page 47
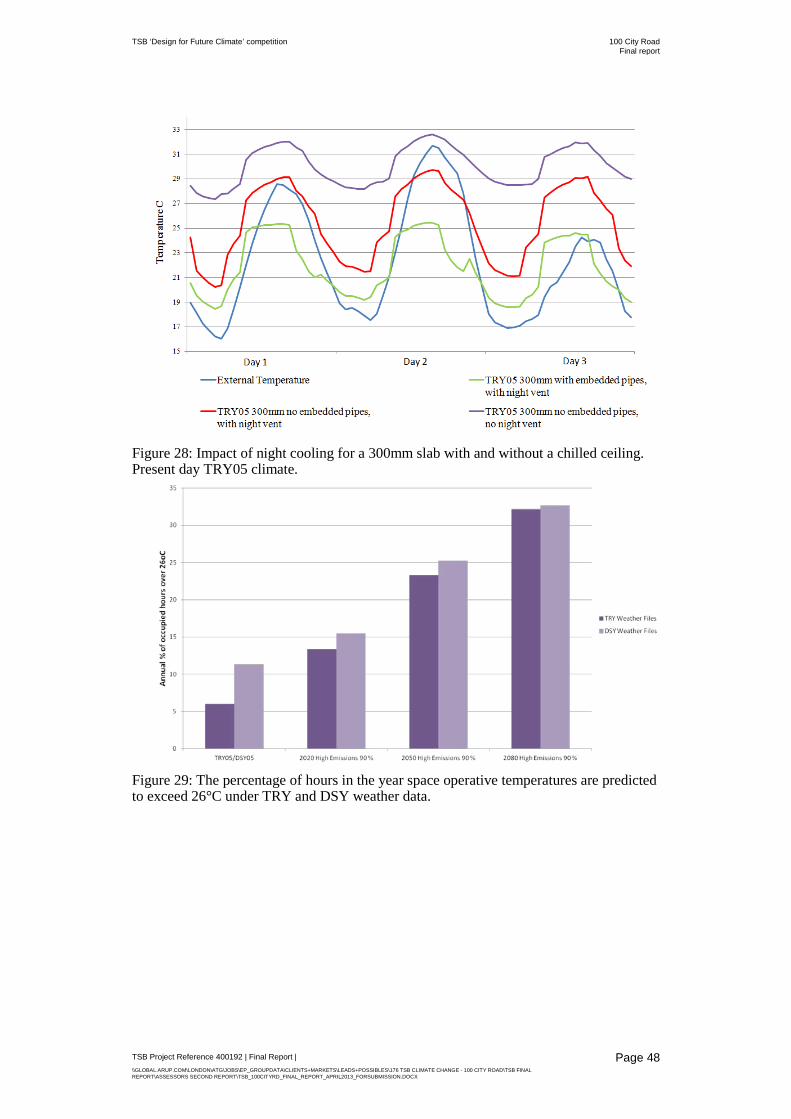
TSB ‘Design for Future Climate’ competition 100 City Road Final report
Figure 28: Impact of night cooling for a 300mm slab with and without a chilled ceiling. Present day TRY05 climate.
Figure 29: The percentage of hours in the year space operative temperatures are predicted to exceed 26°C under TRY and DSY weather data.
TSB Project Reference 400192 | Final Report | \\GLOBAL.ARUP.COM\LONDON\ATG\JOBS\EP_GROUPDATA\CLIENTS+MARKETS\LEADS+POSSIBLES\176 TSB CLIMATE CHANGE - 100 CITY ROAD\TSB FINAL REPORT\ASSESSORS SECOND REPORT\TSB_100CITYRD_FINAL_REPORT_APRIL2013_FORSUBMISSION.DOCX
Page 48

TSB ‘Design for Future Climate’ competition 100 City Road Final report
3.4.8 Adjusting the thermal mass
Proposed adaptation The ‘base case’ design includes a 300mm thick concrete slab. In this section we consider whether the thermal mass performance would be improved or decreased by using a heavier or lighter slab. Three slab thicknesses, 250mm, 300mm and 400mm have been tested against the TRY and UKCP09 data files. 250mm is the minimum slab thickness required for structural integrity and the 400mm option has been selected to investigate the impact of increased thermal mass.
Further issues that would need to be considered when establishing slab thickness include cost, cumulative height, the impact on number of floors and lettable areas, embodied carbon dioxide considerations, and structural integration issues.
Outcomes The impact of increasing the slab thickness on space temperatures when the chilled ceiling is operation and night cooling is employed is shown in Figure 30 and Figure 31. Changing the thickness of the slab has relatively little impact.
In the passive mode of operation (Figure 32), increasing the thickness of the ceiling slab was found to reduce peak temperature during summer, as would be expected, with the decrease moving from 250mm to 400mm thickness being just under 1°C on the warmest day in the TRY05 weather data.
Figure 30: Hourly predicted temperature considering thermal mass and embedded pipes for three different slab thicknesses for TRY05 climate scenario (June 25 – 27 the warmest day in the TRY05 weather data).
TSB Project Reference 400192 | Final Report | \\GLOBAL.ARUP.COM\LONDON\ATG\JOBS\EP_GROUPDATA\CLIENTS+MARKETS\LEADS+POSSIBLES\176 TSB CLIMATE CHANGE - 100 CITY ROAD\TSB FINAL REPORT\ASSESSORS SECOND REPORT\TSB_100CITYRD_FINAL_REPORT_APRIL2013_FORSUBMISSION.DOCX
Page 49

TSB ‘Design for Future Climate’ competition 100 City Road Final report
Figure 31: Hourly predicted temperature considering thermal mass and embedded pipes for three different slab thicknesses for UKCP09 2080 high emissions, 90 percentile scenario (June 25 – 27 the warmest day in the TRY05 weather data).
Figure 32: Effect on ceiling slab thickness on the passive performance of the space (warmest day and two days either side in the TRY05 weather data).
15
20
25
30
35
Tem
pera
ture
(0 C)
External air temperature 250 mm
300 mm 400 mm
Day 1 Day 2 Day 3
TSB Project Reference 400192 | Final Report | \\GLOBAL.ARUP.COM\LONDON\ATG\JOBS\EP_GROUPDATA\CLIENTS+MARKETS\LEADS+POSSIBLES\176 TSB CLIMATE CHANGE - 100 CITY ROAD\TSB FINAL REPORT\ASSESSORS SECOND REPORT\TSB_100CITYRD_FINAL_REPORT_APRIL2013_FORSUBMISSION.DOCX
Page 50

TSB ‘Design for Future Climate’ competition 100 City Road Final report
3.4.9 Mixed mode ventilation
Proposed adaptation The ‘base case’ design allows for the option of mixed mode ventilation where mechanical ventilation to the 4.5m perimeter zone can be switched off and natural ventilation can then be provided through façade openings. As a ‘rule of thumb’ single sided ventilation of this type is effective into the floor plate over a distance of around two and a half floor to ceiling heights (e.g. 8.75m for a 3.5m high ceiling), so a 4.5m perimeter zone can be considered to be safe distance to assume natural ventilation is effective.
Although it is not currently envisaged that natural ventilation will be used due to noise and pollution from traffic on City Road and Old Street, it is anticipated that the number of electric vehicles may rise in the future, and that areas of this roundabout may also become pedestrianised.
The proposed adaptation was investigated under the various climate change scenarios to assess the benefits of mixed mode ventilation. The configuration of façade openings modelled is shown in Figure 33. It was expected that the results of the analysis would quantify the saving from mixed mode operation.
66% glazed area 33% glazed area 50% glazed area 33% glazed area
Figure 33: Proposed façade configurations for 100 City Road. The non-glazed elements consist of ventilation openings covered by perforated panels with a 30% free area.
Outcomes As shown in Figure 34, mixed mode ventilation has a lower total energy use in all climate scenarios. An energy saving of 2% - 7% can be achieved between the TRY2005 and the 2080s respectively by naturally ventilating the 4.5m perimeter zones. This is based on windows opening when the outdoor temperatures are between 20°C-25oC and the internal summer design condition is increased to 26°C+2°C.
TSB Project Reference 400192 | Final Report | \\GLOBAL.ARUP.COM\LONDON\ATG\JOBS\EP_GROUPDATA\CLIENTS+MARKETS\LEADS+POSSIBLES\176 TSB CLIMATE CHANGE - 100 CITY ROAD\TSB FINAL REPORT\ASSESSORS SECOND REPORT\TSB_100CITYRD_FINAL_REPORT_APRIL2013_FORSUBMISSION.DOCX
Page 51
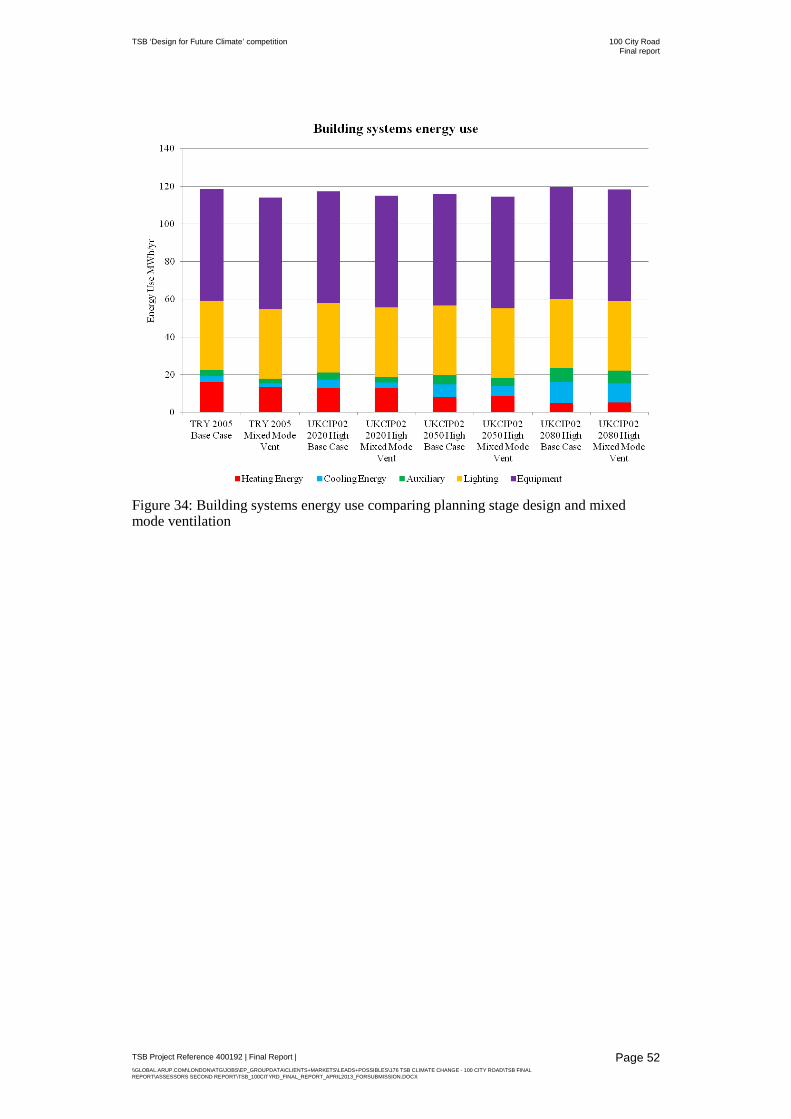
TSB ‘Design for Future Climate’ competition 100 City Road Final report
Figure 34: Building systems energy use comparing planning stage design and mixed mode ventilation
TSB Project Reference 400192 | Final Report | \\GLOBAL.ARUP.COM\LONDON\ATG\JOBS\EP_GROUPDATA\CLIENTS+MARKETS\LEADS+POSSIBLES\176 TSB CLIMATE CHANGE - 100 CITY ROAD\TSB FINAL REPORT\ASSESSORS SECOND REPORT\TSB_100CITYRD_FINAL_REPORT_APRIL2013_FORSUBMISSION.DOCX
Page 52

TSB ‘Design for Future Climate’ competition 100 City Road Final report
3.4.10 Increase cross ventilation potential
Proposed adaptation In the previous section the effect of naturally ventilating the perimeter of the office was examined. In this section the feasibility of naturally ventilating the whole depth of the floor plate via the façade openings is investigated using a CFD model. The possibility of cross ventilation has been examined using a model with a ceiling height of 3.5m, as this is the design which has been approved by planning in our ‘base case’.
The entire floorplate was modelled in order to identify areas of concern (Figure 35). It is anticipated that desks located centrally will have issues concerning air quality, most markedly on a still day.
Figure 35 CFD geometry for the natural ventilation study
Dynamic thermal models of the space illustrated that natural ventilation would only be appropriate in ‘shoulder’ months (i.e. spring and autumn) or summer months. With this in mind two scenarios were investigated:
1. A typical reference year was considered and the average external dry bulb for the applicable months established. This occurred on 9 April at 4pm.
2. A typical reference year was considered and the occasion was selected where there was a minimum difference between external and internal dry bulb temperatures. This equated to a warm day occurring on the 7 May at 2pm.
For these two scenarios a still day condition was considered. On a still day only the temperature differential between the external and the internal spaces will drive air through the space.
Outcomes On a still day in April, the analysis predicted that only 0.5 air changes per hour are achieved in the office space. This is insufficient for effective ventilation,
TSB Project Reference 400192 | Final Report | \\GLOBAL.ARUP.COM\LONDON\ATG\JOBS\EP_GROUPDATA\CLIENTS+MARKETS\LEADS+POSSIBLES\176 TSB CLIMATE CHANGE - 100 CITY ROAD\TSB FINAL REPORT\ASSESSORS SECOND REPORT\TSB_100CITYRD_FINAL_REPORT_APRIL2013_FORSUBMISSION.DOCX
Page 53

TSB ‘Design for Future Climate’ competition 100 City Road Final report
corresponding to around 4 l/s/person, compared to the advice in CIBSE guidance of 10 l/s/person. Temperatures are also relatively low within the space, although note heating was not included in the model (see Figure 36). To quantify the ventilation effectiveness and to identify stagnant zones within the space the ‘age of air’ was calculated. The age of air quantifies the time it takes for an elemental volume of outdoor air to reach a particular location within the indoor environment.
The simulations demonstrate that the central part of the office is relatively poorly ventilated (Figure 37 and Figure 38). The situation is more severe for the warmer day.
Figure 36: Internal dry-bulb temperatures for an average external dry-bulb temperature on a still day
Figure 37: Age of air for an average external dry-bulb temperature on a still day
TSB Project Reference 400192 | Final Report | \\GLOBAL.ARUP.COM\LONDON\ATG\JOBS\EP_GROUPDATA\CLIENTS+MARKETS\LEADS+POSSIBLES\176 TSB CLIMATE CHANGE - 100 CITY ROAD\TSB FINAL REPORT\ASSESSORS SECOND REPORT\TSB_100CITYRD_FINAL_REPORT_APRIL2013_FORSUBMISSION.DOCX
Page 54
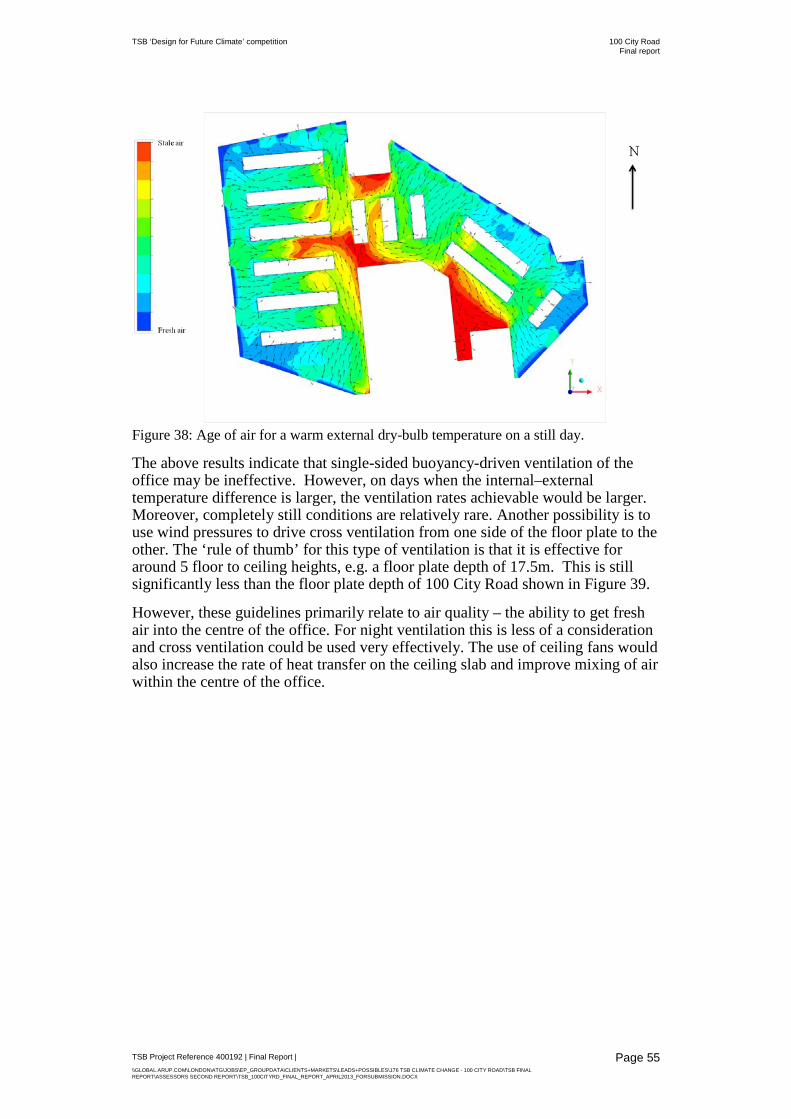
TSB ‘Design for Future Climate’ competition 100 City Road Final report
Figure 38: Age of air for a warm external dry-bulb temperature on a still day.
The above results indicate that single-sided buoyancy-driven ventilation of the office may be ineffective. However, on days when the internal–external temperature difference is larger, the ventilation rates achievable would be larger. Moreover, completely still conditions are relatively rare. Another possibility is to use wind pressures to drive cross ventilation from one side of the floor plate to the other. The ‘rule of thumb’ for this type of ventilation is that it is effective for around 5 floor to ceiling heights, e.g. a floor plate depth of 17.5m. This is still significantly less than the floor plate depth of 100 City Road shown in Figure 39.
However, these guidelines primarily relate to air quality – the ability to get fresh air into the centre of the office. For night ventilation this is less of a consideration and cross ventilation could be used very effectively. The use of ceiling fans would also increase the rate of heat transfer on the ceiling slab and improve mixing of air within the centre of the office.
TSB Project Reference 400192 | Final Report | \\GLOBAL.ARUP.COM\LONDON\ATG\JOBS\EP_GROUPDATA\CLIENTS+MARKETS\LEADS+POSSIBLES\176 TSB CLIMATE CHANGE - 100 CITY ROAD\TSB FINAL REPORT\ASSESSORS SECOND REPORT\TSB_100CITYRD_FINAL_REPORT_APRIL2013_FORSUBMISSION.DOCX
Page 55

TSB ‘Design for Future Climate’ competition 100 City Road Final report
Figure 39: Dimensions of the 100 City Road floor plate.
TSB Project Reference 400192 | Final Report | \\GLOBAL.ARUP.COM\LONDON\ATG\JOBS\EP_GROUPDATA\CLIENTS+MARKETS\LEADS+POSSIBLES\176 TSB CLIMATE CHANGE - 100 CITY ROAD\TSB FINAL REPORT\ASSESSORS SECOND REPORT\TSB_100CITYRD_FINAL_REPORT_APRIL2013_FORSUBMISSION.DOCX
Page 56

TSB ‘Design for Future Climate’ competition 100 City Road Final report
3.5 Summary of benefits of adaptations A summary of each of the adaptation strategies explored in Sections 3.4.1-3.4.10 is presented in Table 6. This table was used to summarise and communicate the indicative impacts of the ten adaptation strategies in terms of cost, energy and comfort, to the design team and the client. A quantity surveyor working on the design of 100 City Road project provided the cost estimates for each of the strategies considered, which are explored in more detail in in Section 3.6.
TSB Project Reference 400192 | Final Report | \\GLOBAL.ARUP.COM\LONDON\ATG\JOBS\EP_GROUPDATA\CLIENTS+MARKETS\LEADS+POSSIBLES\176 TSB CLIMATE CHANGE - 100 CITY ROAD\TSB FINAL REPORT\ASSESSORS SECOND REPORT\TSB_100CITYRD_FINAL_REPORT_APRIL2013_FORSUBMISSION.DOCX
Page 57
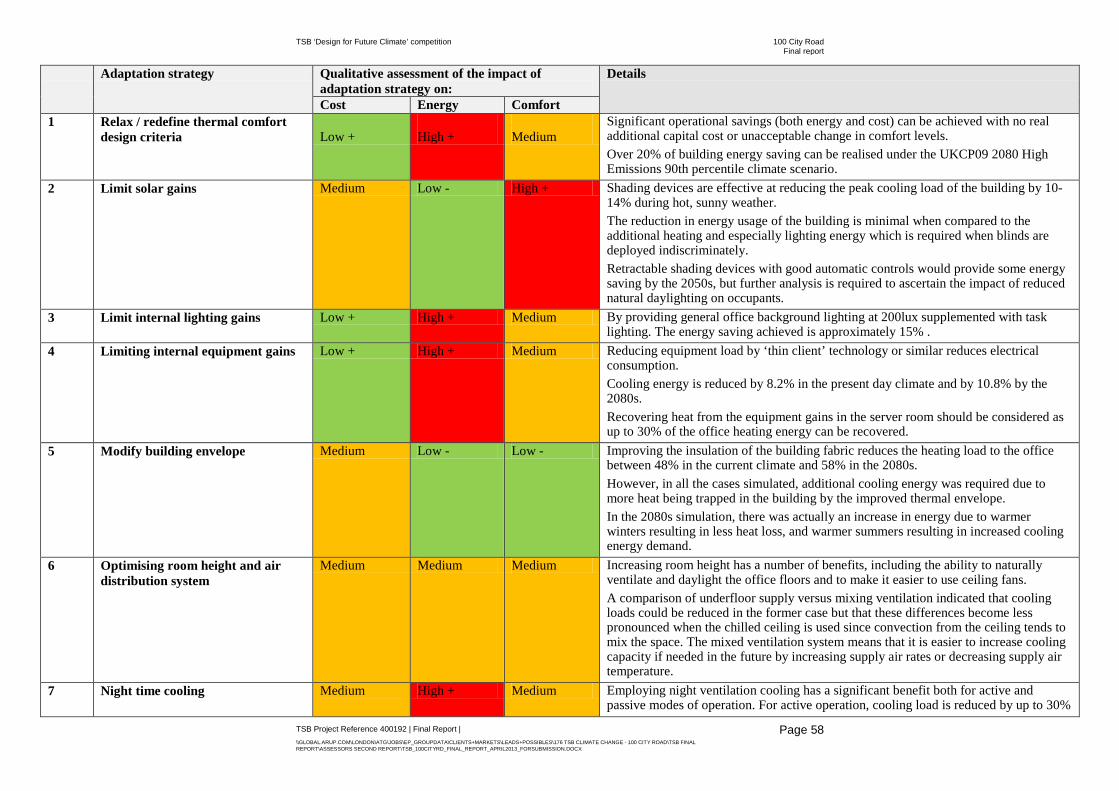
TSB ‘Design for Future Climate’ competition 100 City Road Final report
Adaptation strategy Qualitative assessment of the impact of adaptation strategy on:
Details
Cost Energy Comfort 1 Relax / redefine thermal comfort
design criteria Low +
High +
Medium
Significant operational savings (both energy and cost) can be achieved with no real additional capital cost or unacceptable change in comfort levels. Over 20% of building energy saving can be realised under the UKCP09 2080 High Emissions 90th percentile climate scenario.
2 Limit solar gains Medium Low - High + Shading devices are effective at reducing the peak cooling load of the building by 10-14% during hot, sunny weather. The reduction in energy usage of the building is minimal when compared to the additional heating and especially lighting energy which is required when blinds are deployed indiscriminately. Retractable shading devices with good automatic controls would provide some energy saving by the 2050s, but further analysis is required to ascertain the impact of reduced natural daylighting on occupants.
3 Limit internal lighting gains Low + High + Medium By providing general office background lighting at 200lux supplemented with task lighting. The energy saving achieved is approximately 15% .
4 Limiting internal equipment gains Low + High + Medium Reducing equipment load by ‘thin client’ technology or similar reduces electrical consumption. Cooling energy is reduced by 8.2% in the present day climate and by 10.8% by the 2080s. Recovering heat from the equipment gains in the server room should be considered as up to 30% of the office heating energy can be recovered.
5 Modify building envelope Medium Low - Low - Improving the insulation of the building fabric reduces the heating load to the office between 48% in the current climate and 58% in the 2080s. However, in all the cases simulated, additional cooling energy was required due to more heat being trapped in the building by the improved thermal envelope. In the 2080s simulation, there was actually an increase in energy due to warmer winters resulting in less heat loss, and warmer summers resulting in increased cooling energy demand.
6 Optimising room height and air distribution system
Medium Medium Medium Increasing room height has a number of benefits, including the ability to naturally ventilate and daylight the office floors and to make it easier to use ceiling fans. A comparison of underfloor supply versus mixing ventilation indicated that cooling loads could be reduced in the former case but that these differences become less pronounced when the chilled ceiling is used since convection from the ceiling tends to mix the space. The mixed ventilation system means that it is easier to increase cooling capacity if needed in the future by increasing supply air rates or decreasing supply air temperature.
7 Night time cooling Medium
High + Medium Employing night ventilation cooling has a significant benefit both for active and passive modes of operation. For active operation, cooling load is reduced by up to 30%
TSB Project Reference 400192 | Final Report | \\GLOBAL.ARUP.COM\LONDON\ATG\JOBS\EP_GROUPDATA\CLIENTS+MARKETS\LEADS+POSSIBLES\176 TSB CLIMATE CHANGE - 100 CITY ROAD\TSB FINAL REPORT\ASSESSORS SECOND REPORT\TSB_100CITYRD_FINAL_REPORT_APRIL2013_FORSUBMISSION.DOCX
Page 58
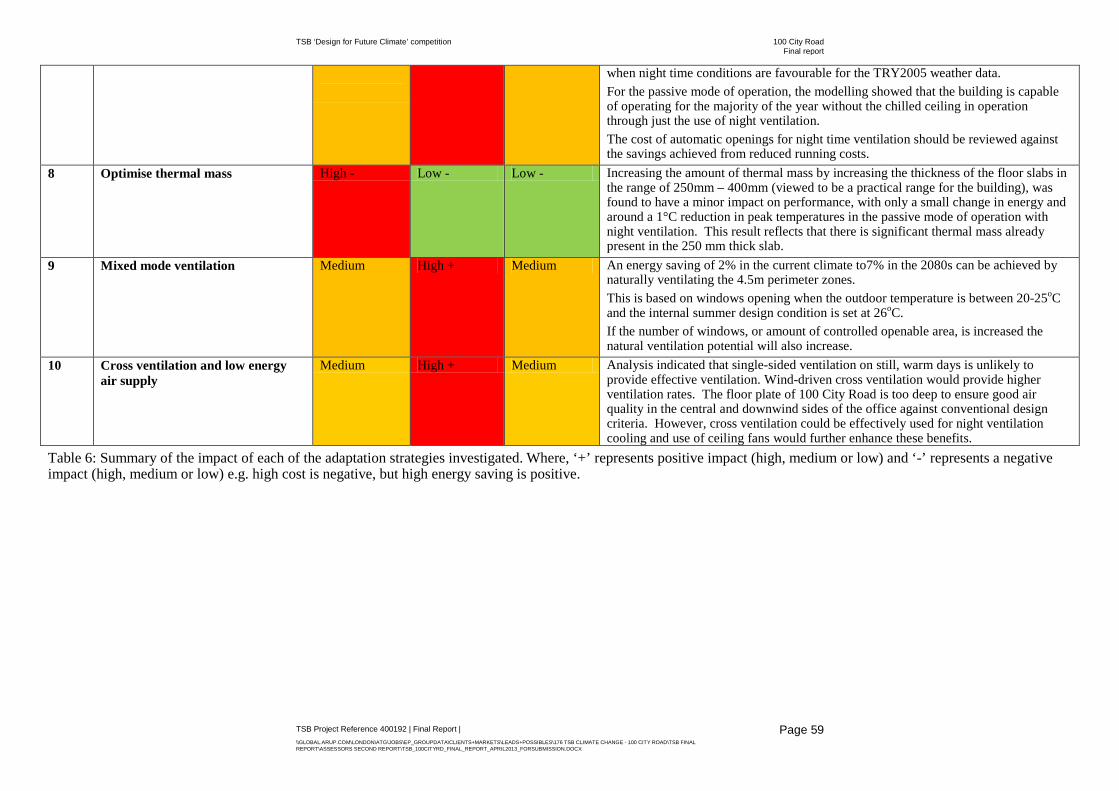
TSB ‘Design for Future Climate’ competition 100 City Road Final report
when night time conditions are favourable for the TRY2005 weather data. For the passive mode of operation, the modelling showed that the building is capable of operating for the majority of the year without the chilled ceiling in operation through just the use of night ventilation. The cost of automatic openings for night time ventilation should be reviewed against the savings achieved from reduced running costs.
8 Optimise thermal mass High - Low - Low - Increasing the amount of thermal mass by increasing the thickness of the floor slabs in the range of 250mm – 400mm (viewed to be a practical range for the building), was found to have a minor impact on performance, with only a small change in energy and around a 1°C reduction in peak temperatures in the passive mode of operation with night ventilation. This result reflects that there is significant thermal mass already present in the 250 mm thick slab.
9 Mixed mode ventilation Medium High + Medium An energy saving of 2% in the current climate to7% in the 2080s can be achieved by naturally ventilating the 4.5m perimeter zones. This is based on windows opening when the outdoor temperature is between 20-25oC and the internal summer design condition is set at 26oC. If the number of windows, or amount of controlled openable area, is increased the natural ventilation potential will also increase.
10 Cross ventilation and low energy air supply
Medium High + Medium Analysis indicated that single-sided ventilation on still, warm days is unlikely to provide effective ventilation. Wind-driven cross ventilation would provide higher ventilation rates. The floor plate of 100 City Road is too deep to ensure good air quality in the central and downwind sides of the office against conventional design criteria. However, cross ventilation could be effectively used for night ventilation cooling and use of ceiling fans would further enhance these benefits.
Table 6: Summary of the impact of each of the adaptation strategies investigated. Where, ‘+’ represents positive impact (high, medium or low) and ‘-’ represents a negative impact (high, medium or low) e.g. high cost is negative, but high energy saving is positive.
TSB Project Reference 400192 | Final Report | \\GLOBAL.ARUP.COM\LONDON\ATG\JOBS\EP_GROUPDATA\CLIENTS+MARKETS\LEADS+POSSIBLES\176 TSB CLIMATE CHANGE - 100 CITY ROAD\TSB FINAL REPORT\ASSESSORS SECOND REPORT\TSB_100CITYRD_FINAL_REPORT_APRIL2013_FORSUBMISSION.DOCX
Page 59

TSB ‘Design for Future Climate’ competition 100 City Road Final report
3.6 Qualitative cost of adaptation strategies A quantity surveyor working on the design of the 100 City Road project provided qualitative cost estimates for each of the strategies considered.
Of the 10 adaptation strategies considered, three of them were not within Derwent London’s power as landlord to control, as they were primarily operational and the tenant’s decision. The remaining seven strategies the landlord has some control over. The strategies which are within the control of the landlord or tenant are listed in Table 7. It is noted that the primary audience for this analysis is the landlord of the building.
A
daptation strategies
Operational / systems (tenant decision) Design (landlord decision)
1. Relaxing thermal comfort criteria 2. Limiting solar gains
3. Limiting internal lighting gains 5. Modification of building envelope
4. Limiting internal equipment gains 6. Adjusting thermal mass
7. Adjusting room height and air distribution system
8. Night time cooling
9. Mixed mode ventilation
10. Increased cross ventilation potential
Table 7: Tenant and landlord influence over the adaptation strategies.
The quantity surveyor reviewed all of the seven adaptation strategies within the control of the landlord. Due to the information available for this exercise it was only possible to provide a more detailed cost estimate for three of these strategies; adaptations 2, 7 and 9:
External shading strategies to reduce solar gain (Adaptation strategy 2)
• Fixed external shading devices cost approximately £300-£500 per m2
• Moving external shading devices cost an additional £150 per m2.
• Moving external shading devices would only be required on the upper floors of the South and South West facing façades, which is approximately 10,000m2 of cladding at a cost of £150 per m2.
• Approximately £1.5million (future adaptation)
Enhance floor heights to maintain comfort with reduced energy consumption (Adaptation strategy 7)
• Increasing the floor to ceiling height results in a reduction of floor space of 15,000 m2 per floor and associated loss of rental income.
• By raising the storey height by 250mm (to 4 metres) everything gets stretched and you need more conduits.
• Floor height of 3.5 metres is optimum for this scheme in terms of cost, comfort and energy benefits (no action required).
TSB Project Reference 400192 | Final Report | \\GLOBAL.ARUP.COM\LONDON\ATG\JOBS\EP_GROUPDATA\CLIENTS+MARKETS\LEADS+POSSIBLES\176 TSB CLIMATE CHANGE - 100 CITY ROAD\TSB FINAL REPORT\ASSESSORS SECOND REPORT\TSB_100CITYRD_FINAL_REPORT_APRIL2013_FORSUBMISSION.DOCX
Page 60
TSB ‘Design for Future Climate’ competition 100 City Road Final report
Alter façade to allow greater natural ventilation (Adaptation strategy 9)
• Double number of openings (high and low level ventilation).
• Openable windows cost approximately £600 each.
• Base case scheme has approximately 800 opening windows which cost approximately £480,000 in total
• Doubling this to 1,600 windows, costs increase by another £480,000.
• Approximately £500,000 (improve now).
3.6.1 Selection of adaptation options A presentation of the study and the qualitative benefit analysis shown in Table 6 was made to the client and Landlord Derwent London. Following this presentation Derwent London asked the architects (AHMM) to consider seven of the ten recommended adaptation strategies further. These strategies were 1, 2, 3, 4, 7, 9 and 10.
Please note that the organisation and membership of the climate change adaptation team are set out in Section 4.1.
The adaptation strategies were identified as desirable to implement as they have ‘medium’ cost and ‘high’ impact on energy or comfort. Further, the scope for integration of these strategies is actually realistic for the client due to the context of the stage of the building design and the appetite for integrating climate change adaptation related recommendations.
The seven adaptation strategies which are being developed further are:
Adaptation strategy 1
• The client and design team are informing letting agents and potential tenants of the benefits of relaxing indoor temperatures and they are providing workshops on comfort criteria and extending the definition of comfort beyond air temperature alone.
• These sessions have been on-going and have generated much interest in the building concept and a future model of office design.
Adaptation strategy 2
• The potential to integrate external shading devices will be investigated by the architect and client at a later date. This is because analysis indicated that there would be little energy/comfort/cost benefit until the 2050s.
Adaptation strategies 3 & 4
• Limiting the internal lights and equipment gains are outside of the current architects brief but will be considered at a later stage of design, probably when the building is being fitted out.
Adaptation strategy 8
• Night time cooling cycles are to be designed into the building management strategy. Night time cooling systems are also to be integrated to allow
TSB Project Reference 400192 | Final Report | \\GLOBAL.ARUP.COM\LONDON\ATG\JOBS\EP_GROUPDATA\CLIENTS+MARKETS\LEADS+POSSIBLES\176 TSB CLIMATE CHANGE - 100 CITY ROAD\TSB FINAL REPORT\ASSESSORS SECOND REPORT\TSB_100CITYRD_FINAL_REPORT_APRIL2013_FORSUBMISSION.DOCX
Page 61

TSB ‘Design for Future Climate’ competition 100 City Road Final report
tenant choice with immediate benefits for both the building user and operators.
Adaptation strategies 9 & 10
• An increase in openable areas in the opaque area of the façade is currently being considered to enhance natural ventilation potential as part of a mixed mode ventilation strategy. Analysis indicates an energy/comfort/cost benefit which could be realised now through modifying the current design.
The design of 100 City Road is already market leading in terms of energy, cost and comfort. Climate change risks, adaptation strategies and the results of these studies will be communicated to potential future tenants and agents to strengthen the already strong value case for occupying this building.
Although the considerable benefits of the adaptation strategies studied for this report have been outlined above, there are a number of notable barriers to implementation of some of these strategies. These include for example:
• the stage of building design and planning at which adaptation strategies are considered - this determines whether their implementation is technically feasible or financially viable;
• the fact that even if energy and comfort benefits are clearly communicated to the developer / landlord / client, the final decision to go ahead with the implementation of strategies often comes down to short term capital cost considerations rather than a longer term cost-benefit analysis over the lifetime of the building.
• certain building features are considered as ‘the norm’, ‘low risk’ and ‘easy to let’ by typical letting agents and tenants of commercial office buildings in London e.g. total air conditioning, which makes more innovative low energy features difficult to ‘sell’.
3.6.2 Timeframes for implementing adaptation strategies The intended timeframes for implementation of the adaptation strategies are summarised in Table 8. These strategies are classified as:
• ‘short-term’ - could be implemented as part of current design considerations;
• ‘medium-term’ - could be implemented as part of building fit out considerations;
• ‘long-term’ - strategies which may either require significant changes to building design and construction at a later date, because there are no immediate cost / comfort / energy benefits to be realised;
• ‘n/a’ - not considered feasible or beneficial.
TSB Project Reference 400192 | Final Report | \\GLOBAL.ARUP.COM\LONDON\ATG\JOBS\EP_GROUPDATA\CLIENTS+MARKETS\LEADS+POSSIBLES\176 TSB CLIMATE CHANGE - 100 CITY ROAD\TSB FINAL REPORT\ASSESSORS SECOND REPORT\TSB_100CITYRD_FINAL_REPORT_APRIL2013_FORSUBMISSION.DOCX
Page 62
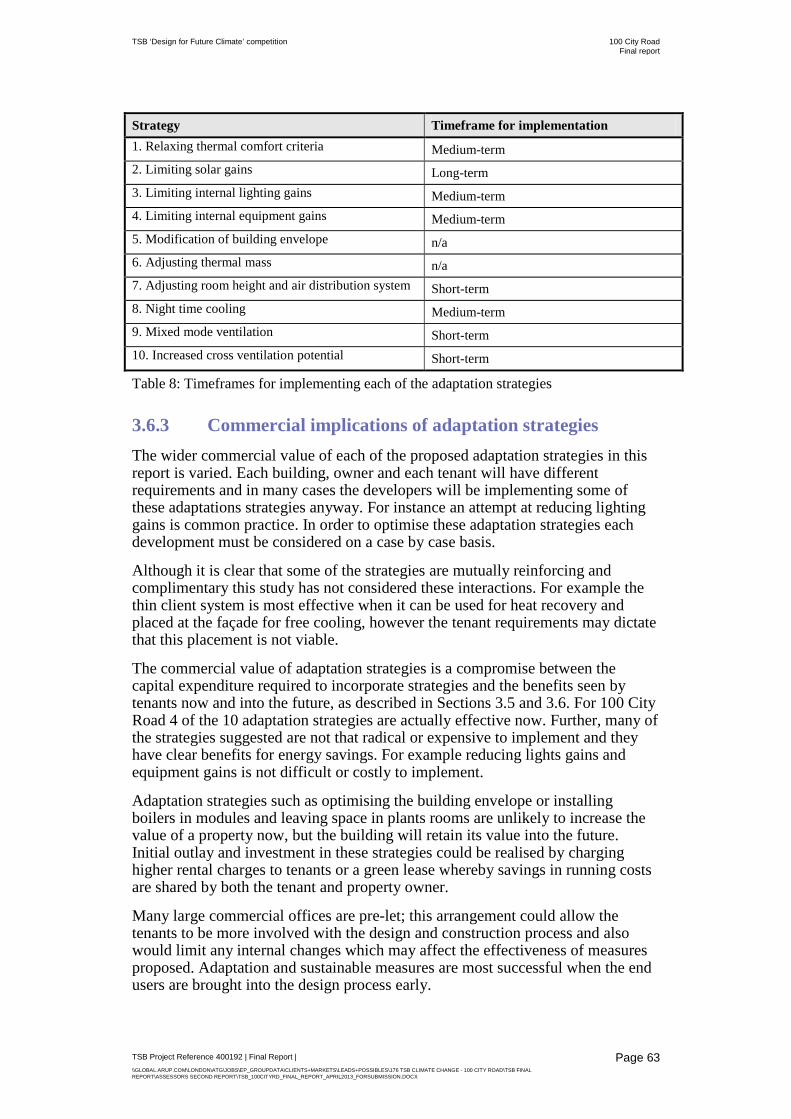
TSB ‘Design for Future Climate’ competition 100 City Road Final report
Strategy Timeframe for implementation 1. Relaxing thermal comfort criteria Medium-term 2. Limiting solar gains Long-term 3. Limiting internal lighting gains Medium-term 4. Limiting internal equipment gains Medium-term 5. Modification of building envelope n/a 6. Adjusting thermal mass n/a 7. Adjusting room height and air distribution system Short-term 8. Night time cooling Medium-term 9. Mixed mode ventilation Short-term 10. Increased cross ventilation potential Short-term
Table 8: Timeframes for implementing each of the adaptation strategies
3.6.3 Commercial implications of adaptation strategies The wider commercial value of each of the proposed adaptation strategies in this report is varied. Each building, owner and each tenant will have different requirements and in many cases the developers will be implementing some of these adaptations strategies anyway. For instance an attempt at reducing lighting gains is common practice. In order to optimise these adaptation strategies each development must be considered on a case by case basis.
Although it is clear that some of the strategies are mutually reinforcing and complimentary this study has not considered these interactions. For example the thin client system is most effective when it can be used for heat recovery and placed at the façade for free cooling, however the tenant requirements may dictate that this placement is not viable.
The commercial value of adaptation strategies is a compromise between the capital expenditure required to incorporate strategies and the benefits seen by tenants now and into the future, as described in Sections 3.5 and 3.6. For 100 City Road 4 of the 10 adaptation strategies are actually effective now. Further, many of the strategies suggested are not that radical or expensive to implement and they have clear benefits for energy savings. For example reducing lights gains and equipment gains is not difficult or costly to implement.
Adaptation strategies such as optimising the building envelope or installing boilers in modules and leaving space in plants rooms are unlikely to increase the value of a property now, but the building will retain its value into the future. Initial outlay and investment in these strategies could be realised by charging higher rental charges to tenants or a green lease whereby savings in running costs are shared by both the tenant and property owner.
Many large commercial offices are pre-let; this arrangement could allow the tenants to be more involved with the design and construction process and also would limit any internal changes which may affect the effectiveness of measures proposed. Adaptation and sustainable measures are most successful when the end users are brought into the design process early.
TSB Project Reference 400192 | Final Report | \\GLOBAL.ARUP.COM\LONDON\ATG\JOBS\EP_GROUPDATA\CLIENTS+MARKETS\LEADS+POSSIBLES\176 TSB CLIMATE CHANGE - 100 CITY ROAD\TSB FINAL REPORT\ASSESSORS SECOND REPORT\TSB_100CITYRD_FINAL_REPORT_APRIL2013_FORSUBMISSION.DOCX
Page 63
TSB ‘Design for Future Climate’ competition 100 City Road Final report
Climate change adaptation strategies have been cited by the RICS as a factor which will reduce insurance premiums. It is widely recognised that extreme weather events such as heatwaves will become increasingly commonplace. In UK aiming to reduce the negative impacts of these events should therefore become increasingly important to property owners.
Design represents a very small proportion of the lifetime cost of a building, however, done well it has a disproportionate impact on how well the building and surroundings perform. Investment at the design and construction phase of a project can pay dividends later in the life of a building.
The challenge for engineers is to illustrate the value of climate change risk assessments and explain the costs and benefits to developers. Specifically showing value for the ‘typical’ conventional office and not simply bespoke office buildings is particularly challenging. The bottom line has become increasingly important for large scale developers in this economic market.
Communicating the implications of climate change adaptation strategies on capital and running costs may not be a viable argument for those building owners that pass on running costs to their tenants. It will be a shift in the market and the demands of companies looking to rent office space that will drive the market. This will go some way to persuading developers that a sustainable office space which tenants want to let will have a greater value to their portfolio than a building which performs well now but will fail to attract tenants in the future.
There are a number of triggers for investment:
• legislative and regulatory drivers for doing it (‘have to’) i.e. Climate Change Act 2008, CLG Building Regulations, Local Planning Authority requirements;
• financial drivers for doing it (‘should do’) i.e. reduced exposure to risks, capital costs versus operational savings, retaining market value of assets over time;
• reputational and responsibility drivers for doing it (‘want to’) i.e. ‘USP’, good risk/asset management, marketing material, attracts responsible buyers/tenants, contributes to well-being, productivity and satisfaction of owners/occupants.
TSB Project Reference 400192 | Final Report | \\GLOBAL.ARUP.COM\LONDON\ATG\JOBS\EP_GROUPDATA\CLIENTS+MARKETS\LEADS+POSSIBLES\176 TSB CLIMATE CHANGE - 100 CITY ROAD\TSB FINAL REPORT\ASSESSORS SECOND REPORT\TSB_100CITYRD_FINAL_REPORT_APRIL2013_FORSUBMISSION.DOCX
Page 64
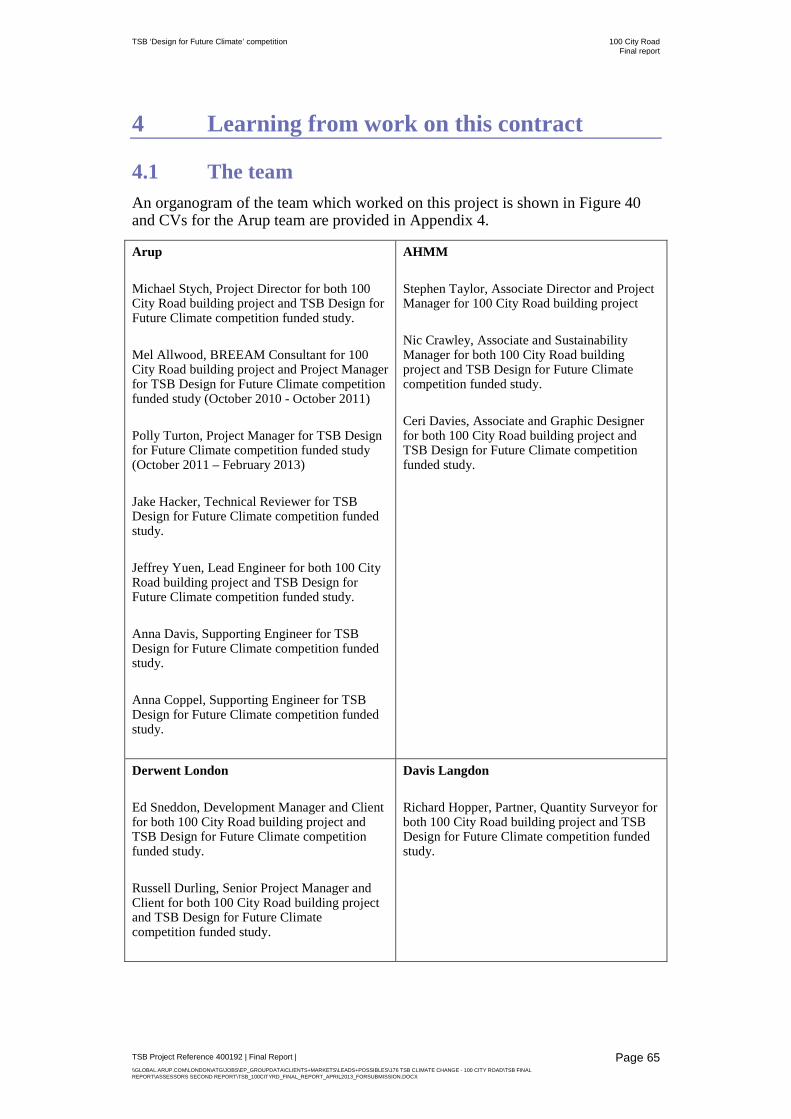
TSB ‘Design for Future Climate’ competition 100 City Road Final report
4 Learning from work on this contract
4.1 The team An organogram of the team which worked on this project is shown in Figure 40 and CVs for the Arup team are provided in Appendix 4.
Arup Michael Stych, Project Director for both 100 City Road building project and TSB Design for Future Climate competition funded study. Mel Allwood, BREEAM Consultant for 100 City Road building project and Project Manager for TSB Design for Future Climate competition funded study (October 2010 - October 2011) Polly Turton, Project Manager for TSB Design for Future Climate competition funded study (October 2011 – February 2013) Jake Hacker, Technical Reviewer for TSB Design for Future Climate competition funded study. Jeffrey Yuen, Lead Engineer for both 100 City Road building project and TSB Design for Future Climate competition funded study. Anna Davis, Supporting Engineer for TSB Design for Future Climate competition funded study. Anna Coppel, Supporting Engineer for TSB Design for Future Climate competition funded study.
AHMM Stephen Taylor, Associate Director and Project Manager for 100 City Road building project Nic Crawley, Associate and Sustainability Manager for both 100 City Road building project and TSB Design for Future Climate competition funded study. Ceri Davies, Associate and Graphic Designer for both 100 City Road building project and TSB Design for Future Climate competition funded study.
Derwent London Ed Sneddon, Development Manager and Client for both 100 City Road building project and TSB Design for Future Climate competition funded study. Russell Durling, Senior Project Manager and Client for both 100 City Road building project and TSB Design for Future Climate competition funded study.
Davis Langdon Richard Hopper, Partner, Quantity Surveyor for both 100 City Road building project and TSB Design for Future Climate competition funded study.
TSB Project Reference 400192 | Final Report | \\GLOBAL.ARUP.COM\LONDON\ATG\JOBS\EP_GROUPDATA\CLIENTS+MARKETS\LEADS+POSSIBLES\176 TSB CLIMATE CHANGE - 100 CITY ROAD\TSB FINAL REPORT\ASSESSORS SECOND REPORT\TSB_100CITYRD_FINAL_REPORT_APRIL2013_FORSUBMISSION.DOCX
Page 65
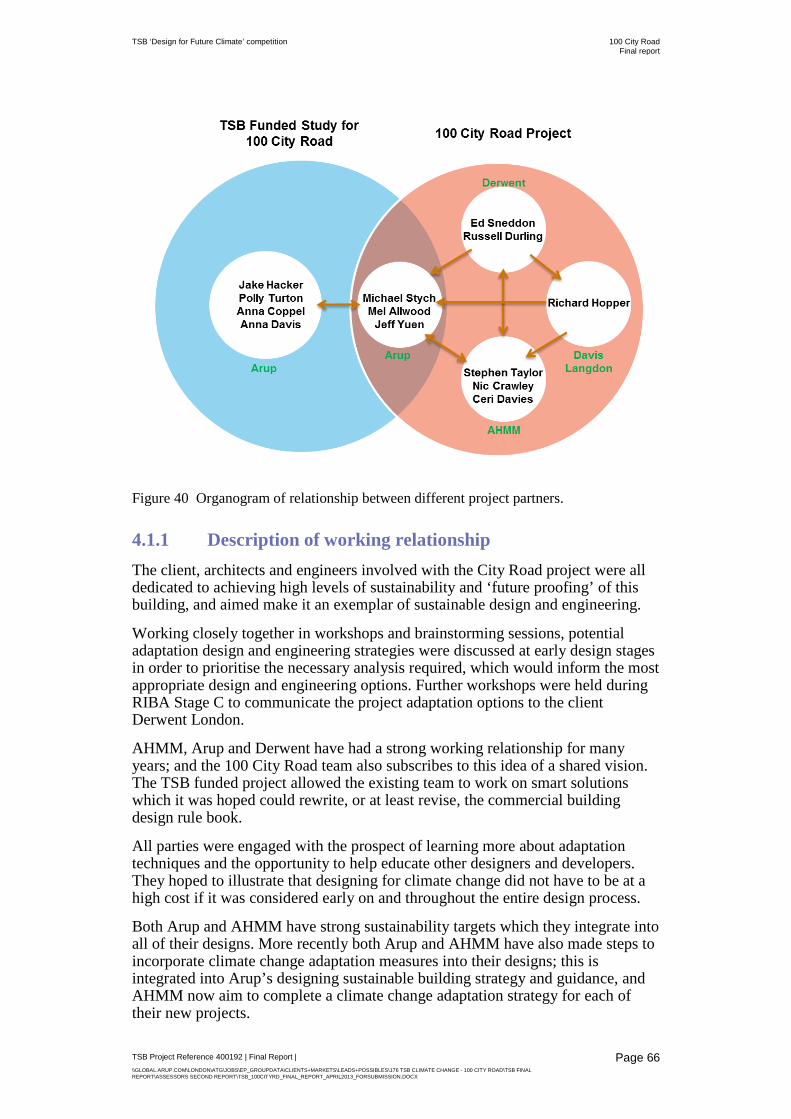
TSB ‘Design for Future Climate’ competition 100 City Road Final report
Figure 40 Organogram of relationship between different project partners.
4.1.1 Description of working relationship The client, architects and engineers involved with the City Road project were all dedicated to achieving high levels of sustainability and ‘future proofing’ of this building, and aimed make it an exemplar of sustainable design and engineering.
Working closely together in workshops and brainstorming sessions, potential adaptation design and engineering strategies were discussed at early design stages in order to prioritise the necessary analysis required, which would inform the most appropriate design and engineering options. Further workshops were held during RIBA Stage C to communicate the project adaptation options to the client Derwent London.
AHMM, Arup and Derwent have had a strong working relationship for many years; and the 100 City Road team also subscribes to this idea of a shared vision. The TSB funded project allowed the existing team to work on smart solutions which it was hoped could rewrite, or at least revise, the commercial building design rule book.
All parties were engaged with the prospect of learning more about adaptation techniques and the opportunity to help educate other designers and developers. They hoped to illustrate that designing for climate change did not have to be at a high cost if it was considered early on and throughout the entire design process.
Both Arup and AHMM have strong sustainability targets which they integrate into all of their designs. More recently both Arup and AHMM have also made steps to incorporate climate change adaptation measures into their designs; this is integrated into Arup’s designing sustainable building strategy and guidance, and AHMM now aim to complete a climate change adaptation strategy for each of their new projects.
TSB Project Reference 400192 | Final Report | \\GLOBAL.ARUP.COM\LONDON\ATG\JOBS\EP_GROUPDATA\CLIENTS+MARKETS\LEADS+POSSIBLES\176 TSB CLIMATE CHANGE - 100 CITY ROAD\TSB FINAL REPORT\ASSESSORS SECOND REPORT\TSB_100CITYRD_FINAL_REPORT_APRIL2013_FORSUBMISSION.DOCX
Page 66
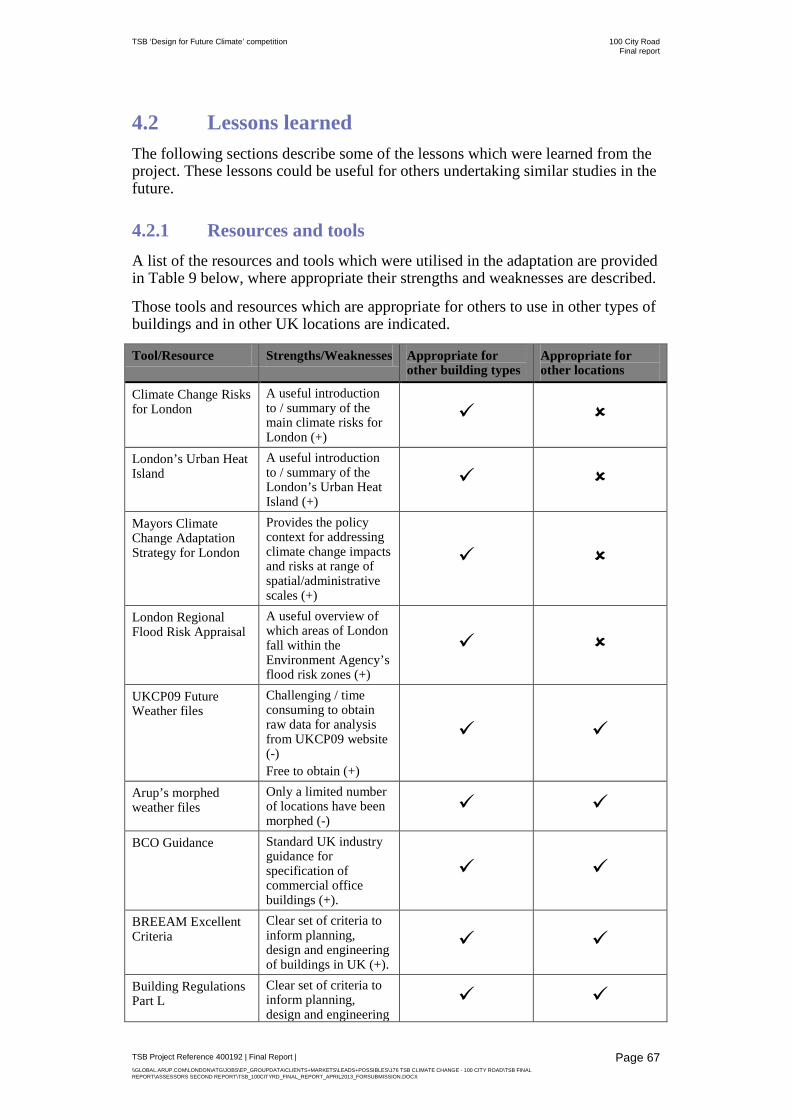
TSB ‘Design for Future Climate’ competition 100 City Road Final report
4.2 Lessons learned The following sections describe some of the lessons which were learned from the project. These lessons could be useful for others undertaking similar studies in the future.
4.2.1 Resources and tools A list of the resources and tools which were utilised in the adaptation are provided in Table 9 below, where appropriate their strengths and weaknesses are described.
Those tools and resources which are appropriate for others to use in other types of buildings and in other UK locations are indicated.
Tool/Resource Strengths/Weaknesses Appropriate for other building types
Appropriate for other locations
Climate Change Risks for London
A useful introduction to / summary of the main climate risks for London (+)
London’s Urban Heat Island
A useful introduction to / summary of the London’s Urban Heat Island (+)
Mayors Climate Change Adaptation Strategy for London
Provides the policy context for addressing climate change impacts and risks at range of spatial/administrative scales (+)
London Regional Flood Risk Appraisal
A useful overview of which areas of London fall within the Environment Agency’s flood risk zones (+)
UKCP09 Future Weather files
Challenging / time consuming to obtain raw data for analysis from UKCP09 website (-) Free to obtain (+)
Arup’s morphed weather files
Only a limited number of locations have been morphed (-)
BCO Guidance Standard UK industry guidance for specification of commercial office buildings (+).
BREEAM Excellent Criteria
Clear set of criteria to inform planning, design and engineering of buildings in UK (+).
Building Regulations Part L
Clear set of criteria to inform planning, design and engineering
TSB Project Reference 400192 | Final Report | \\GLOBAL.ARUP.COM\LONDON\ATG\JOBS\EP_GROUPDATA\CLIENTS+MARKETS\LEADS+POSSIBLES\176 TSB CLIMATE CHANGE - 100 CITY ROAD\TSB FINAL REPORT\ASSESSORS SECOND REPORT\TSB_100CITYRD_FINAL_REPORT_APRIL2013_FORSUBMISSION.DOCX
Page 67

TSB ‘Design for Future Climate’ competition 100 City Road Final report
of buildings in UK (+). CIBSE Guide A Standard UK industry
guidance for environmental design of buildings (+).
London’s Commercial Stock and Climate Change
A useful introduction to / summary of the main climate risks and financial / legal implications for commercial office buildings in London (+)
London Crane Survey Useful indicator of how many new buildings are being built during any given quarter in London (+).
CLG Commercial Building Data
Useful overview of makeup of commercial buildings in the UK and London (+).
Investment Property Databank Data
Useful overview of age, type and location of different buildings types in London (+).
Oasys BEANS suite Single zone only (-) Arup in house software code is well documented and understood (+) Spatial variation in radiation can be calculated (+) Relatively fast calculation (+) Can be adapted for specific cases (+) Lots of detail in one zone (+) Not commercially available (-)
IES Virtual Environment
Commercial software, code is not well documented or understood (-) Multi-zonal (-) Can also be used to perform compliance calculations (+) Relatively fast calculation (+) Difficult to adapt for special cases (-) Requires licence to be purchased (-)
TSB Project Reference 400192 | Final Report | \\GLOBAL.ARUP.COM\LONDON\ATG\JOBS\EP_GROUPDATA\CLIENTS+MARKETS\LEADS+POSSIBLES\176 TSB CLIMATE CHANGE - 100 CITY ROAD\TSB FINAL REPORT\ASSESSORS SECOND REPORT\TSB_100CITYRD_FINAL_REPORT_APRIL2013_FORSUBMISSION.DOCX
Page 68

TSB ‘Design for Future Climate’ competition 100 City Road Final report
ANSYS CFX Widely use commercial software well validated for many building physics problems (+) Licences costs are expensive (-) Calculation relatively slow (-) Detailed analysis of space (+) Operator needs good understanding of CFD methods (-)
Table 9: Strengths and weaknesses of tools and resources which were used in adaptation studies
4.2.2 Approach Based on our experience of working on this study, the strengths and weaknesses of the approach which was taken by the project team are:
• The project had a strong building engineering focus. This was as a result of initial discussions during the first workshop.
• It could have been interesting to consider the impacts of the planning design and management of the external space around 100 City Road. For example, to explore the effect of ‘greening’ the Old Street roundabout on local air temperatures and air quality, and the subsequent impact on building cooling energy demand. This however would have been outside of the remit of the Derwent London and would have required the involvement of the London Borough of Islington.
• Similarly the effect of shade, shelter, water features and planting in the public realm at the base of the 100 City Road building on the comfort of pedestrians and tenants, as well as on the building cooling energy demand could have yielded interesting results. However, as mentioned previously the study choses to take a building engineering approach, rather than a wider environmental urban design approach.
• Think scientifically and seriously but also creatively and visually. Adaptation measures need not constrain design ambitions nor limit design flexibility if risks and opportunities are considered early on and ideas are presented coherently and convincingly to the project team.
• Recognise that adaptation strategies can be operational or management focused and may not physically affect a design or structure.
TSB Project Reference 400192 | Final Report | \\GLOBAL.ARUP.COM\LONDON\ATG\JOBS\EP_GROUPDATA\CLIENTS+MARKETS\LEADS+POSSIBLES\176 TSB CLIMATE CHANGE - 100 CITY ROAD\TSB FINAL REPORT\ASSESSORS SECOND REPORT\TSB_100CITYRD_FINAL_REPORT_APRIL2013_FORSUBMISSION.DOCX
Page 69

TSB ‘Design for Future Climate’ competition 100 City Road Final report
4.2.3 Approach to working with client An assessment of the working relationship with the client during the adaptation work is discussed below:
• Talk to and involve the end client as early on as possible in the design process.
• Focus on and communicate the reasons for undertaking analysis of climate risk, developing adaptation options and strategies, and making decisions based upon them, namely: legislative and regulatory drivers for doing it (‘have to’) i.e. Climate Change Act 2008, CLG Building Regulations, Local Planning Authority requirements; financial drivers for doing it (‘should do’) i.e. reduced exposure to risks, capital costs versus operational savings, retaining market value of assets over time, and reputational and responsibility drivers for doing it (‘want to’) i.e. ‘USP’, good risk/asset management, marketing material, attracts responsible buyers/tenants, contributes to well-being, productivity and satisfaction of owners/occupants.
• For all adaptation options and strategies for addressing overheating risk think about the comfort, energy and cost relationships.
• Work in partnership with other engineers, built environment professionals (architects, surveyors), clients (developers) and occupants.
• Involve and communicate with project team on a regular basis.
• Provide project inputs and outputs in a timely fashion and strive to perform project management duties well.
TSB Project Reference 400192 | Final Report | \\GLOBAL.ARUP.COM\LONDON\ATG\JOBS\EP_GROUPDATA\CLIENTS+MARKETS\LEADS+POSSIBLES\176 TSB CLIMATE CHANGE - 100 CITY ROAD\TSB FINAL REPORT\ASSESSORS SECOND REPORT\TSB_100CITYRD_FINAL_REPORT_APRIL2013_FORSUBMISSION.DOCX
Page 70
TSB ‘Design for Future Climate’ competition 100 City Road Final report
5 Extending adaptation to other buildings
5.1 Applying the strategy to other Derwent London buildings
This study should be primarily considered with respect to how it may inform refurbishment projects within the Derwent London portfolio of projects. As at July 2012, Derwent London has an actively managed property portfolio valued at £26 billion in 14 areas across London. At the current time this comprises approximately 80 properties. Property types of most relevance to this study include flagship headquarters, modern corporate buildings and creative studios. This study is ideally suited as a benchmark for analysis when these buildings are due for retrofit and refurbishment.
Derwent London, the client for 100 City Road, recognises the value of investing in a sustainable future for their buildings, from an economic, environmental and socially responsible viewpoint. It has been proven that lessons learnt in investigating energy savings in the operations of a single building can inform the management and operation of other new and existing buildings.
It is anticipated that the lessons learnt from this project and the modelling that the TSB competition funding has enabled, will inform future Derwent projects. Derwent London have shown interest in applying some of the adaptations suggested into 100 City Road and the ideas that have been established during the course of the project throughout their other commercial refurbishments, where appropriate. This exercise will include further consideration of costs.
It should be stressed that the building design for 100 City Road already includes many passive and active environmental systems (e.g. natural ventilation, exposed mass) to allow adaptation strategies to be implemented in the future without fundamental redesign of the building. This would not be the case in a conventional office building design, which are typically lightweight, sealed and fully air conditioned buildings.
5.2 Applying the strategy to other office buildings in London
London presents a particularly challenging environment for low energy office buildings. This study shows that there is another way of designing office buildings which have clear energy, comfort and cost benefits, but also address overheating risks for consideration under future climate scenarios.
London has the highest number of offices (84,200) and the largest proportion of office floorspace (28,386,000 m²) of all regions in the UK (CLG, 2009) as of 1 April 2008. According to The Crane Survey of London there was approximately 855,000 m² (9.2 million ft²) of new office space being constructed as of May 2012. This study has purposefully focused on commercial buildings in London, as there are many of them and this therefore presents a real market opportunity to do things differently and better.
100 City Road and the surrounding buildings on the site were built during the 1960s. Of the 1,035 office buildings listed in the Investment Property Databank in
TSB Project Reference 400192 | Final Report | \\GLOBAL.ARUP.COM\LONDON\ATG\JOBS\EP_GROUPDATA\CLIENTS+MARKETS\LEADS+POSSIBLES\176 TSB CLIMATE CHANGE - 100 CITY ROAD\TSB FINAL REPORT\ASSESSORS SECOND REPORT\TSB_100CITYRD_FINAL_REPORT_APRIL2013_FORSUBMISSION.DOCX
Page 71
TSB ‘Design for Future Climate’ competition 100 City Road Final report
London, 131 were also built during this era with 92 in the West End and Mid-Town areas and 39 in the City (IPD, 2009). Many of these may be approaching a new refurbishment and letting cycle, and could learn from the design approach taken and adaptation strategies considered for 100 City Road.
Most new commercial buildings should now in theory be able to achieve a BREEAM excellent categorisation. However, according to BREEAM’s Green Book live website there are 25 buildings in London that qualify for the BREEAM Offices 2008 Excellent award. This represents only about 0.03% of the 84,200 office buildings in London.
5.3 Applying the strategy to other buildings types and locations in the UK
Many of the resources and tools used in this study could lend themselves to other building types and locations.
The approach detailed in this report could be replicated for office buildings in big cities across the UK. Cities such as Manchester and Birmingham also experience a noticeable urban heat island effect and the adaptation strategies described in this report could be replicated in office buildings in these cities.
The methodology which has been described may also be applicable for other building types. For example, large buildings such as schools and hospitals could utilise many of the adaptation strategies described in this report; such as mixed mode ventilation, adjusting thermal mass and limiting solar gains.
5.4 Discussion It is generally recognised and accepted that the climate has changed in recent years (for instance it is getting warmer, particularly in the South East of England), and climate change projections suggest that this trend will probably continue. What is unclear, however, is the exact extent to which the climate will change and how. Given this, there are still many uncertainties and it is a challenge to design for these appropriately.
Further, uncertainty in the economy raises a question about our ability to finance research and investment into climate change and adaptation measures. In the future will the UK government be able to fund studies such as this case study? It is hoped that the government will continue to make it a priority.
It needs to be recognised that the science of climate change, and the design and engineering responses associated with science, are evolving disciplines. Whilst our knowledge and experience is progressing quickly, it not as advanced or established as some branches of science and engineering, for example calculating and reducing carbon emissions. In recent years the quality and application of weather and climate data itself has received particular attention.
Addressing climate change adaptation, risk and resilience issues is not currently mandatory in building regulations nor in planning policy. Without formal, recognisable and understandable legislation and guidance on how to deal with climate change risks and how to develop adaptation strategies, such as those outlined in this report, it will be difficult to ensure that they become an essential and integral part of building design and engineering.
TSB Project Reference 400192 | Final Report | \\GLOBAL.ARUP.COM\LONDON\ATG\JOBS\EP_GROUPDATA\CLIENTS+MARKETS\LEADS+POSSIBLES\176 TSB CLIMATE CHANGE - 100 CITY ROAD\TSB FINAL REPORT\ASSESSORS SECOND REPORT\TSB_100CITYRD_FINAL_REPORT_APRIL2013_FORSUBMISSION.DOCX
Page 72
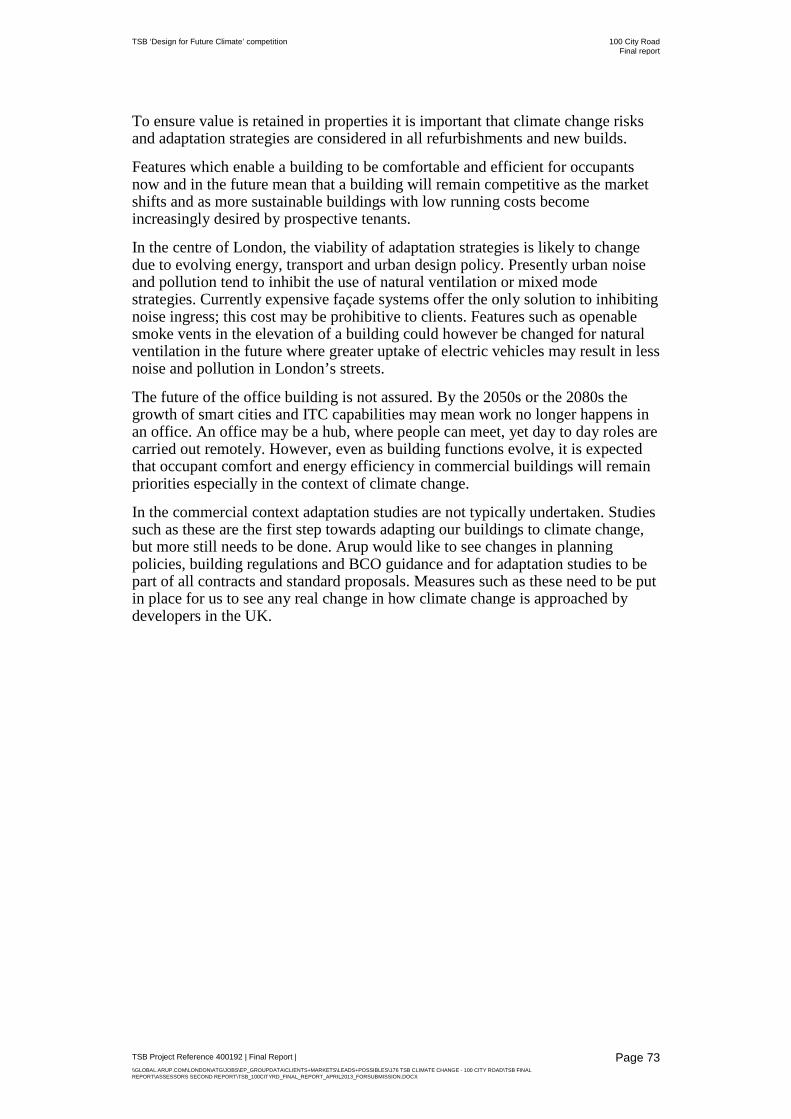
TSB ‘Design for Future Climate’ competition 100 City Road Final report
To ensure value is retained in properties it is important that climate change risks and adaptation strategies are considered in all refurbishments and new builds.
Features which enable a building to be comfortable and efficient for occupants now and in the future mean that a building will remain competitive as the market shifts and as more sustainable buildings with low running costs become increasingly desired by prospective tenants.
In the centre of London, the viability of adaptation strategies is likely to change due to evolving energy, transport and urban design policy. Presently urban noise and pollution tend to inhibit the use of natural ventilation or mixed mode strategies. Currently expensive façade systems offer the only solution to inhibiting noise ingress; this cost may be prohibitive to clients. Features such as openable smoke vents in the elevation of a building could however be changed for natural ventilation in the future where greater uptake of electric vehicles may result in less noise and pollution in London’s streets.
The future of the office building is not assured. By the 2050s or the 2080s the growth of smart cities and ITC capabilities may mean work no longer happens in an office. An office may be a hub, where people can meet, yet day to day roles are carried out remotely. However, even as building functions evolve, it is expected that occupant comfort and energy efficiency in commercial buildings will remain priorities especially in the context of climate change.
In the commercial context adaptation studies are not typically undertaken. Studies such as these are the first step towards adapting our buildings to climate change, but more still needs to be done. Arup would like to see changes in planning policies, building regulations and BCO guidance and for adaptation studies to be part of all contracts and standard proposals. Measures such as these need to be put in place for us to see any real change in how climate change is approached by developers in the UK.
TSB Project Reference 400192 | Final Report | \\GLOBAL.ARUP.COM\LONDON\ATG\JOBS\EP_GROUPDATA\CLIENTS+MARKETS\LEADS+POSSIBLES\176 TSB CLIMATE CHANGE - 100 CITY ROAD\TSB FINAL REPORT\ASSESSORS SECOND REPORT\TSB_100CITYRD_FINAL_REPORT_APRIL2013_FORSUBMISSION.DOCX
Page 73

TSB ‘Design for Future Climate’ competition 100 City Road Final report
Appendix list The following Appendices are included providing further information on issues covered in this report.
A1 Building profile Relevant drawings, images and plans
A2 Climate change risks and data Climate change risks for London London’s Urban Heat Island Mayor’s Climate Change Adaptation Strategy London Regional Flood Risk Appraisal Weather files for current and future climate
A3 Adaptation strategies Graphic of 10 adaptation strategies Lifetime of building elements
A4 Learning from work on this contract Arup team CVs
A5 Extending adaptation to other buildings London’s Commercial Stock and Climate Change London Crane Survey BREEAM Excellent Offices CLG Commercial Building Data Investment Property Databank Data
TSB Project Reference 400192 | Final Report | \\GLOBAL.ARUP.COM\LONDON\ATG\JOBS\EP_GROUPDATA\CLIENTS+MARKETS\LEADS+POSSIBLES\176 TSB CLIMATE CHANGE - 100 CITY ROAD\TSB FINAL REPORT\ASSESSORS SECOND REPORT\TSB_100CITYRD_FINAL_REPORT_APRIL2013_FORSUBMISSION.DOCX
Page 74