tshwane 33% · valued at r12.8bn 67 % of our portfolio is in tshwane 33 % of our portfolio is in...
TRANSCRIPT

Reviewed Provisional Annual Resultsfor the year ended 31 August
2019
33%
67%Tshwane
Johannesburg
285 properties valued at R12.8bn
67% of our portfolio is in
Tshwane
33% of our portfolio is in
Johannesburg
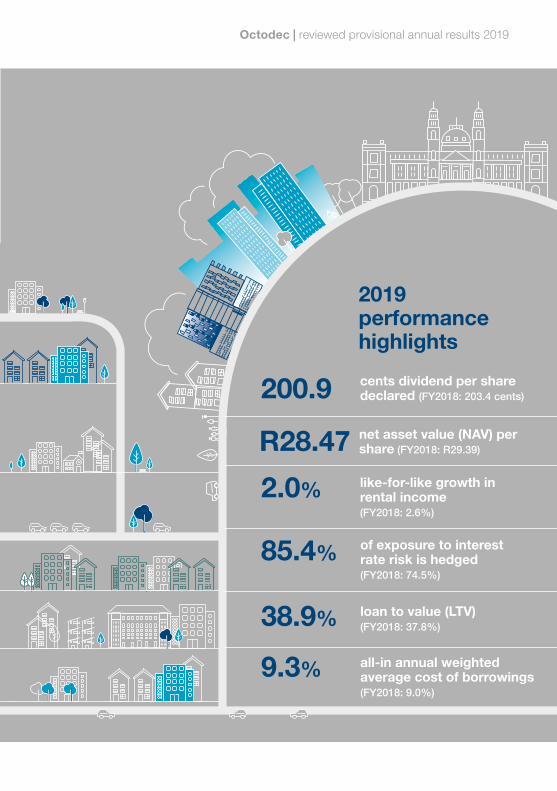
2019performance highlights
200.9 cents dividend per share declared (FY2018: 203.4 cents)
net asset value (NAV) per share (FY2018: R29.39)R28.47 like-for-like growth in rental income (FY2018: 2.6%)
2.0%
of exposure to interest rate risk is hedged (FY2018: 74.5%)
85.4%
loan to value (LTV) (FY2018: 37.8%)38.9%
all-in annual weighted average cost of borrowings (FY2018: 9.0%)
9.3%
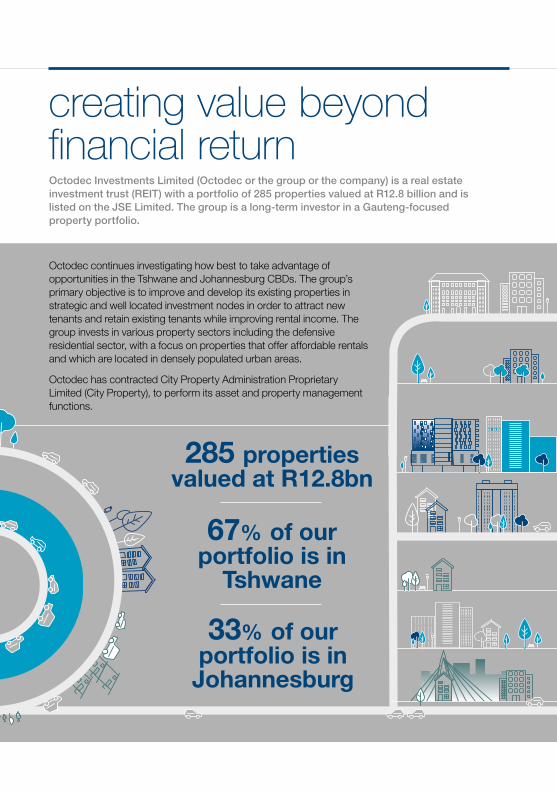
Octodec Investments Limited (Octodec or the group or the company) is a real estate investment trust (REIT) with a portfolio of 285 properties valued at R12.8 billion and is listed on the JSE Limited. The group is a long-term investor in a Gauteng-focused property portfolio.
creating value beyond financial return
Octodec continues investigating how best to take advantage of opportunities in the Tshwane and Johannesburg CBDs. The group’s primary objective is to improve and develop its existing properties in strategic and well located investment nodes in order to attract new tenants and retain existing tenants while improving rental income. The group invests in various property sectors including the defensive residential sector, with a focus on properties that offer affordable rentals and which are located in densely populated urban areas.
Octodec has contracted City Property Administration Proprietary Limited (City Property), to perform its asset and property management functions.
285 properties valued at R12.8bn
67% of our portfolio is in
Tshwane
33% of our portfolio is in
Johannesburg
2019performance highlights
200.9 cents dividend per share declared (FY2018: 203.4 cents)
net asset value (NAV) per share (FY2018: R29.39)R28.47 like-for-like growth in rental income (FY2018: 2.6%)
2.0%
of exposure to interest rate risk is hedged (FY2018: 74.5%)
85.4%
loan to value (LTV) (FY2018: 37.8%)38.9%
all-in annual weighted average cost of borrowings (FY2018: 9.0%)
9.3%
Octodec | reviewed provisional annual results 2019

Rental income % by sector
23.6% Retail
Retail
FY2018: 24.3%
15.8% OfficesFY2018: 16.0%
32.2% ResidentialFY2018: 31.1%
7.0% IndustrialFY2018: 7.1%
11.3% Specialised and otherFY2018: 11.4%
shops
10.1%FY2018: 10.1%
shopping centres
Geographical analysis of rental income
Tshwane
Other
JohannesburgC
BD
Tshwane
CBD
34.6%
Johannesburg andSurrounds
Silvertonand Surrounds
Tshwane
Arcadia
Tshwane
Hatfield
Waverley,
Gezina, M
oot
21.3%
12.5%
11.9%
6.5%
5.1%
4.3%
3.8%
% of total portfolio
* The information on rental income and property portfolio up to page 15 includes 100% of the joint ventures and not only the group’s share.

Rental income % by sector
23.6% Retail
Retail
FY2018: 24.3%
15.8% OfficesFY2018: 16.0%
32.2% ResidentialFY2018: 31.1%
7.0% IndustrialFY2018: 7.1%
11.3% Specialised and otherFY2018: 11.4%
shops
10.1%FY2018: 10.1%
shopping centres
Geographical analysis of rental income
Tshwane
Other
JohannesburgC
BD
Tshwane
CBD
34.6%
Johannesburg andSurrounds
Silvertonand Surrounds
Tshwane
Arcadia
Tshwane
Hatfield
Waverley,
Gezina, M
oot
21.3%
12.5%
11.9%
6.5%
5.1%
4.3%
3.8%
% of total portfolio
contentsreview of results 2
investing for the future 5
Developments 5Investments 5Disposals 5
vacancies 7
lease expiry profile 9
borrowings 10
prospects 12
declaration of cash dividend 13
Salient dates and times 13Tax implications for non-resident shareholders 14Tax implications for South African resident shareholders 15
financial statements 16
Condensed consolidated statement of financial position 16
Condensed consolidated statement of comprehensive income 17
Condensed consolidated statement of changes in equity 18
Consolidated statement of cash flows 19
Reconciliation of comprehensive income to headline earnings 20
Condensed consolidated segmental information 21
Reconciliation of earnings to distributable earnings 22
notes to the condensed consolidated financial statements 23
Basis of preparation 23
Fair value measurement 24
Events after the reporting date 26
Commitments 27
Related party transactions 27
Changes to the board 27
Business combination 28

Revenue earned on a contractual basis grew year-on-year by R94.6 million or 5.0%. This was mainly due to the increase in rental income from Sharon’s Place as well as the inclusion of 100% of Gerlan Properties (Pty) Ltd (Gerlan) (Toyota Auto dealership) and Jardtal Properties (Pty) Ltd (Jardtal) (Kempton Place and The Brooklyn).
The remaining 50% shareholdings in Gerlan and Jardtal were acquired on 1 July 2018 and 1 November 2018 respectively. Both of these investments were previously equity accounted and in these results are consolidated as wholly-owned subsidiaries.
% Change
31 August 2019
R’000
31 August2018
R’000
Revenue – earned on contractual basis* 5.0 1 988 381 1 893 806Net property income – earned on contractual basis* 2.9 1 058 787 1 028 895Investment property 0.8 12 846 539 12 743 363Shareholders’ funds 7 578 599 7 824 398Interest bearing borrowings 4 978 079 4 846 533Shares in issue ('000) 266 198 266 198NAV per share (cents) (3.1) 2 847 2 939LTV ratio (%) 2.9 38.9% 37.8%Distributable profit (1.2) 534 984 541 444Dividend per share (cents)– Interim 101.7 101.7– Final 99.2 101.7
Total (1.2) 200.9 203.4
review of results
Octodec’s board has declared a dividend of 200.9 cents per share for the year ended 31 August 2019, a year-on-year decrease of 1.2%. The dividend is in line with the guidance of negative growth of between 0% and 2% given previously to shareholders. This amounts to a first-half dividend of 101.7 cents and a second-half dividend of 99.2 cents. The dividend was negatively impacted by pressure on rental income growth as well as an increase in property operating costs.
The prevailing poor economic and trading environment has weighed heavily on consumer confidence and spending power. The group continues to focus on the core property fundamentals and has positioned itself to provide shareholders with long-term sustainable value.
Salient features
* Revenue for the year ended 31 August 2019 has been reduced by R2.5 million, which relates to the 40.9% rent reduction granted to Edcon in terms of the rent reduction agreement between Edcon and its landlords.
2

Percentage increase in like-for-like rental income for the year ended 31 August 2019
Residential
3.5484
Offices
0.6242
Percentage like-for-like rental income growth
Percentage increase
R’million like-for-like rental income
0.3
30
20
10
0
-10
-20
-30
%
12
10
8
6
4
2
0
-2
Shopping centres
Shops
3.6Education facilities
3.9R
esidential
Healthcare facilities
Educational facilities
Industrial
Places of worship
Hotels
Auto dealerships
Parking
2.2
Parking5.7
Places ofW
orship4.4
Auto D
ealerships 6.8
3.6
Industrial 0.3
0.3
Hotels
0.1
Offices
Retail
2.3
Healthcare
facilities11.8
(9.4)
12.7
18.7
(15.8)
16.2
3.3
357
158 109
31
38
8
17 17
67
Specialised and otherRetail
R’mil
500
400
300
200
100
0
%
The core portfolio, represented by those properties held for the previous comparable period with no major development activity, reflected like-for-like rental income growth of 2.0%. The weaker growth in like-for-like rental income is mainly attributable to the poor economic environment.
On a like-for-like basis, residential rental income increased by 3.5% (FY2018: 3.9%). This lower growth is mainly attributable to increased average vacancies and lower rental
rate escalations achieved during the year under review. A number of new competitors entered the Hatfield (Tshwane) and Johannesburg CBD markets, resulting in an increased supply of residential accommodation. Residential vacancies were reduced in the latter half of the financial year due to: concerted efforts of the marketing team; a newly introduced tenant retention strategy and an enhanced tenant offering that addressed this increase in competition.
3
Octodec | reviewed provisional annual results 2019

Cost to income ratios
31 August2019
%
31 August2018
%
Property costs
Gross basis 46.7 45.7Net basis (net of recoveries) 31.6 30.0
Total property and administration costs
Gross basis 50.6 50.0Net basis (net of recoveries) 36.7 35.6
Property costs, both on a gross and net basis, have increased compared to the prior year, mainly due to an increase in repairs and maintenance costs which were required and budgeted for in the current year.
Bad debt write-offs and provisions also increased during the year from 1.2% to 1.4% of total rental income. Residential bad debts contributed to the increase in the bad debt expense which is a result of the difficult economic conditions facing tenants. The increase is also attributable to the change in the determination of the provision for bad debts as a result of the adoption of IFRS 9. Despite sustained economic pressure, the group’s arrears remained at acceptable levels with tenant arrears remaining unchanged at 3.4% of rental income. This was aided by tight credit risk management and the group does not anticipate any significant deterioration in this regard in the near future.
It is pleasing to report that administration costs decreased by R4.3 million or 5.3% compared to the prior year.
This was mainly due to a reduction of certain once off costs incurred in prior periods. Asset management fees reduced to 0.42% of enterprise value subject to a minimum of R3.5 million per month, (previously 0.50% of enterprise value), as a result of the new asset and property management agreement with City Property which became effective from 1 July 2018. This has however been partly set off by additional fees for other services not included in the previous asset and property management agreement.
Net finance costs for the year amounted to R448.5 million, a year-on-year increase of 6.7%. The all-in weighted cost of borrowings increased to 9.3% per annum (FY2018: 9.0%), mainly due to the cost of additional hedging contracts entered into during the prior period as well as the interest expensed on the completed development, Sharon’s Place, which was previously capitalised to the cost of the development.
review of results continued
Despite comprising a smaller portion of the total portfolio, healthcare facilities, hotels and places of worship reflected the strongest growth in income of 12.7%, 18.7% and 16.2% respectively.
The education sector was negatively impacted by rent reversions on lease expiries and a number of tenants vacating premises. The auto dealerships sector was impacted by a McCarthy dealership vacating the premises during the year. This space has been let to a Volkswagen dealership with effect from November 2019, but at lower rentals.
4
review of results | continued

DevelopmentsDuring the current year, the group did not undertake any new major developments. The group has several smaller projects underway, in line with Octodec’s strategy to upgrade, maintain and extract value from its property portfolio. One of these is the refurbishment of The Park (previously known as Elarduspark Shopping Centre), a community shopping centre in a south-eastern suburb of Tshwane, at a cost of R44.2 million, which was completed in October 2019. These projects will not only improve the occupancy levels and enhance the value of the portfolio, but will also help uplift the areas in which Octodec is predominantly invested.
InvestmentsOctodec acquired the remaining 50% interest in Jardtal for a cash consideration of R36.5 million at an initial yield of 9.5% with effect from 1 November 2018.
Jardtal comprises two properties, Kempton Place, a residential complex with retail and parking, located in Kempton Park and The Brooklyn, a residential building with retail, located in the Johannesburg CBD.
DisposalsIn line with the decision to dispose of non-core or underperforming properties, the group disposed of a further 19 properties during the year. At 31 August 2019, 11 of these properties have been transferred for a total consideration of R129.2 million. The remaining 8 properties were sold for a total consideration of R83.7 million and transfer is expected to take place during the first half of the 2020 financial year.The
investing for the future
5
Octodec | reviewed provisional annual results 2019

Properties disposed of and transferred before 31 August 2019
Property Location
Total consideration
R’million
Profit/(loss) on disposal
R’millionTransfer
date
Exit yield
%
Medical Towers Johannesburg CBD 25.3 0.8 September 2018 3.3
Ken’s Court Tshwane CBD 44.6 1.6 September 2018 4.4
Brianley (2) Tshwane – Silverton 2.0 (0.7) December 2018 11.6
Midchurch Tshwane CBD 1.5 0.2 December 2018 –
TroymonaTshwane – Waverley 1.1 0.2 January 2019 8.2
The Pavilion Tshwane – Sunnyside 23.0 (1.5) February 2019 7.5
Supmall Tshwane – Silverton 11.1 0.1 April 2019 4.0
Notrevlis Tshwane – Silverton 11.2 0.4 April 2019 11.0
Goleda (3) Tshwane West 1.9 0.3 April 2019 3.5
Brianley (7) Tshwane – Silverton 1.7 0.4 June 2019 9.5
Brianley (4) Tshwane – Silverton 2.0 (0.3) June 2019 9.5
Monaco (9 out of 12 remaining sectional title units) Tshwane – Arcadia 3.8 1.1
September 2018 to August 2019 8.0
Total 129.2 2.6 5.7
Transfers expected to take place after 31 August 2019
Property Location
Total consideration
R’million
Profit/(loss) on disposal
R’million
Expectedtransfer
date
Exit yield
%
Viskin Tshwane CBD 2.7 (0.1) September 2019* 7.8
Hannyhof (1) Tshwane – Hermanstad 5.4 0.1 October 2019* 15.3
Armadale Johannesburg CBD 53.4 1.9 October 2019* 15.3
LPA Tshwane – Silverton 2.7 0.1 November 2019 8.4
Hannyhof (2) Tshwane – Hermanstad 2.7 0.1 December 2019 5.0
Talland Tshwane – Hatfield 4.2 (0.0) December 2019 (4.2)
Rosemitch (1) and (5) Tshwane West 12.6 0.6 January 2020 5.7
Total 83.7 2.7 12.0
* Already transferred
investing for the future continued
6
investing for the future | continued

Vacancies in the Octodec portfolio as at 31 August 2019, including properties held for redevelopment, amounted to 17.9% (FY2018: 18.6%) of the gross lettable area (GLA). The group’s core vacancies, which exclude the GLA relating to properties held for development and those recently redeveloped or sold, amounted to 11.5% (FY2018: 11.6%).
Vacancies by sector as at 31 August 2019
GLAm²
Total vacancies
%
Properties held for
redevelopment or recently developed
or sold %
Core vacancies
%
31 August 2019
Retail – shops 336 435 14.4 – 14.4
Retail – shopping centres 94 012 4.7 – 4.7
Offices 412 627 43.0 (24.7) 18.3
Residential 392 512 6.7 – 6.7
Industrial 246 363 10.2 (0.9) 9.3
Specialised and other
Educational facilities 58 903 – – –
Healthcare facilities 36 612 15.6 (1.2) 14.4
Places of worship 18 054 – – –
Auto dealerships 15 722 23.5 – 23.5
Hotels 13 458 – – –
Total 1 624 698 17.9 (6.4) 11.5
vacancies
7
Octodec | reviewed provisional annual results 2019

vacancies continued
Vacancies by sector as at 31 August 2018
GLAm²
Total vacancies
%
Properties held for
redevelopment or recently developed
or sold %
Core vacancies
%
31 August 2018
Retail – shops 349 633 13.2 (0.1) 13.1
Retail – shopping centres 95 009 5.2 – 5.2
Offices 413 581 45.1 (26.4) 18.7
Residential 393 643 6.4 (0.6) 5.8
Industrial 253 396 15.0 (1.0) 14.0
Specialised and other
Educational facilities 56 753 – – –
Healthcare facilities 36 566 14.1 (1.2) 12.9
Places of worship 16 672 – – –
Auto dealerships 15 722 – – –
Hotels 13 458 – – –
Total 1 644 433 18.6 (7.0) 11.6
There was a marginal decrease in core vacancies. The most notable reduction was in the industrial sector, although at the cost of lower rentals being achieved. The decrease in shopping centre vacancies was mainly as a result of the impact of the improved occupancy levels at Killarney Mall and Woodmead Value Mart. The vacancies at The Park increased slightly while the centre was being upgraded. With the upgrade now complete, occupancy levels are expected to improve with a number of national tenants already having signed new leases.
Octodec owns office properies with 101 046 m2 of mothballed space. These properties offer opportunities for residential conversion or office redevelopment. The company is actively considering the disposal of some of these properties.
vacancies | continued
8

The majority of the leases provide for a monthly agreement at expiry of the lease. On expiry an effort is made to conclude longer-term leases. This is especially typical of the residential market and leases with small to medium-sized enterprises. The lease expiry profile remains in line with historical trends and expectations. The significant movement in healthcare facilities arose as a result of the renewal of the lease with Louis Pasteur private hospital for a period of six years. Although Louis Pasteur private hospital is currently in business rescue, the rentals continue to be paid and the account is current.
Lease expiry profile as at 31 August 2019
By rental income (%) By GLA m2 (%)
Vacant%Sector
2020
2021
2022
2023
2024 and
beyond
2020
2021
2022
2023
2024 and
beyond
Retail – shops 40.5 21.0 20.4 10.9 7.2 39.7 18.0 14.7 8.0 5.2 14.4
Retail – shopping centres 33.3 26.3 16.1 8.0 16.3 37.9 19.5 12.5 8.9 16.5 4.7
Offices 75.7 11.2 4.5 7.0 1.6 41.8 6.7 3.0 4.1 1.4 43.0
Industrial 55.8 22.8 7.5 4.9 9.0 50.2 20.8 6.7 5.0 7.1 10.2
Specialised and other
Educationalfacilities 43.9 14.9 23.4 17.4 0.4 52.4 12.2 18.8 15.1 1.5 –
Healthcarefacilities 27.4 12.4 9.8 1.9 48.5 18.1 8.0 6.2 1.4 50.7 15.6
Places of worship 80.5 12.4 3.8 1.7 1.6 82.2 11.2 3.6 0.7 2.3 –
Auto dealerships 20.7 29.7 – 49.6 – 26.0 17.6 – 32.9 – 23.5
Hotels 1.1 98.9 – – – 0.6 99.4 – – – –
Subtotal 50.4 19.7 12.6 9.0 8.3 42.3 15.1 8.4 6.5 6.2 21.5
Residential 99.3 0.7 – – – 92.7 0.6 – – – –
Total 66.0 13.7 8.6 6.1 5.6 54.5 11.6 6.4 4.9 4.7 17.9
lease expiry profile
9
Octodec | reviewed provisional annual results 2019

Octodec reduced its exposure to interest rate risk by entering into interest rate swap contracts. As at 31 August 2019, 85.4%, of its borrowings were hedged (FY2018: 74.5%) with a weighted average term of 3.0 years. The all-in average weighted interest rate of all borrowings is 9.3% per annum (FY2018: 9.0%).
borrowings
Amount R’million
Weighted average interest rate per
annum%
Bank loans 4 030.0 8.8
Domestic medium-term note (DMTN) programme
Unsecured 578.8 8.4
Secured (unlisted HQLA) 369.3 8.8
Total borrowings 4 978.1 8.7
Cost of swaps – 0.6
Total borrowings 4 978.1 9.3
Octodec continues to strengthen its balance sheet, ensuring prudent financial management in a challenging South African economic environment. The terms to expiry of both loans and interest rate swap contracts were lengthened. The group’s LTV as at 31 August 2019 was 38.9% (FY2018: 37.8%), taking into account the loans and investment value of its equity-accounted joint ventures.
Borrowings as at 31 August 2019
10

50
40
30
20
10
2 000
1 500
1 000
500
0
R’mil
2 400
2 000
1 600
1 200
800
400
20232 000
(47.1%)
2022740
(14.9%)
148 (3.0%
)
20221 250
(29.4%)
2021
2021500
(11.8%)
2020
20232 057
(41.3%)
20241 083
(21.7%)950
(19.1%)
%
50
40
30
20
10
0
2024500
(11.7%)
R’mil
%
00
50
40
30
20
10
2 000
1 500
1 000
500
0
R’mil
2 400
2 000
1 600
1 200
800
400
20232 000
(47.1%)
2022740
(14.9%)
148 (3.0%
)
20221 250
(29.4%)
2021
2021500
(11.8%)
2020
20232 057
(41.3%)
20241 083
(21.7%)950
(19.1%)
%
50
40
30
20
10
0
2024500
(11.7%)
R’mil
%
00
Loan expiry profile per financial year (R’mil and %)
Total value of loans
R4.978 bn
Expiry profile of interest rate swap contracts per financial year (R’mil and %)
Total interest rate swaps
R4.250 bn
rating of A-(ZA) and revised the short-term rating to A2(ZA), (on the change in GCR’s Rating Scales, Symbols and Definitions, May 2019), with the outlook accorded as stable. Octodec had available unutilised banking facilities amounting to R625.5 million at 31 August 2019 (FY2018: R669.0 million).
Octodec participates in a DMTN programme through its subsidiary, Premium Properties Limited. As at 31 August 2019 the total unsecured issuance was at R578.8 million, or 11.6% (FY2018: R929.1 million or 19.2%) of the group’s borrowings. Global Credit Ratings (GCR) re-affirmed the long-term national scale
11
Octodec | reviewed provisional annual results 2019

The flat GDP growth, rife unemployment, reduced disposable income and the uncertain political environment remain at levels that are not conducive to local economic growth. This continued pressure will diminish the economic outlook for South Africa. As such, 2020 is expected to be another challenging year, which will have a negative impact on the company’s ability to deliver growth in distributions.
Despite these obstacles, Octodec is looking to ways of unlocking value. The group’s experienced management team, diversified portfolio, large tenant base, sound operating fundamentals and prudent capital management, provide Octodec with the resilience and flexibility necessary to continue navigating through these uncertain times.
The disposal of non-core or underperforming properties will remain a key focus area for the foreseeable future. Portfolio consolidation will remain of primary importance in 2020 and the group will continue to optimise its balance sheet and position its portfolio for long-term sustainability. Octodec has not committed to commence work on any major new developments because it cannot achieve the necessary initial yield in the current economic environment. Instead it will continue to focus on improving the existing portfolio and tenant retention.
The forecast dividend for the period ending 31 August 2020 is expected to be similar to the dividend for the year ended 31 August 2019 and therefore no growth in dividend per share is expected for FY2020.
This guidance is based on:
• the current market and trading conditions prevailing for the property portfolio
• the current forecast investment property income calculated using contractual rentals and assumed market-related renewals
• allowance for vacancies using assumptions and historical experience
• no major corporate and tenant failures occurring
• no further deterioration in the political and socio-economic environment
This forecast has been neither reviewed nor reported on by the group’s auditors.
prospects
12
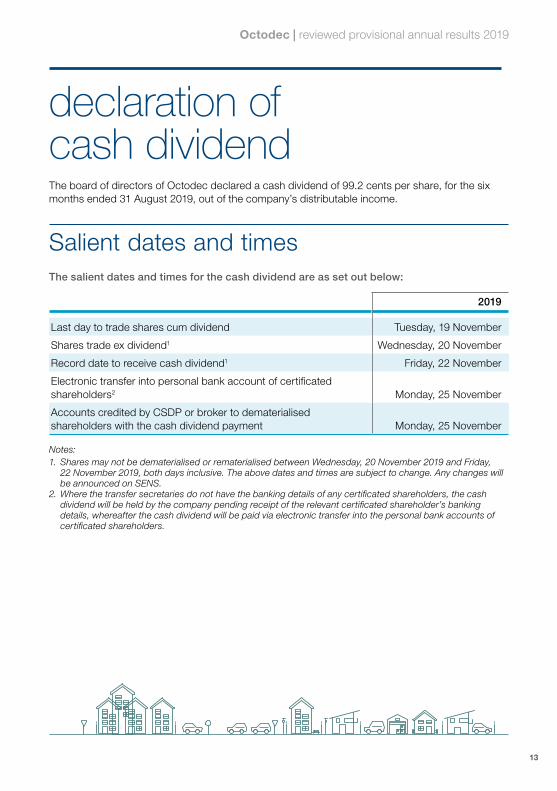
declaration ofcash dividend
The salient dates and times for the cash dividend are as set out below:
2019
Last day to trade shares cum dividend Tuesday, 19 November
Shares trade ex dividend1 Wednesday, 20 November
Record date to receive cash dividend1 Friday, 22 November
Electronic transfer into personal bank account of certificated shareholders2 Monday, 25 November
Accounts credited by CSDP or broker to dematerialised shareholders with the cash dividend payment Monday, 25 November
Notes:1. Shares may not be dematerialised or rematerialised between Wednesday, 20 November 2019 and Friday,
22 November 2019, both days inclusive. The above dates and times are subject to change. Any changes will be announced on SENS.
2. Where the transfer secretaries do not have the banking details of any certificated shareholders, the cash dividend will be held by the company pending receipt of the relevant certificated shareholder’s banking details, whereafter the cash dividend will be paid via electronic transfer into the personal bank accounts of certificated shareholders.
The board of directors of Octodec declared a cash dividend of 99.2 cents per share, for the six months ended 31 August 2019, out of the company’s distributable income.
Salient dates and times
13
Octodec | reviewed provisional annual results 2019

Dividends received by non-resident shareholders from a REIT will not be taxable as income and will be exempt from income tax in terms of the exemption in section 10(1)(k)(i) of the Income Tax Act. Any dividend received by a non-resident from a REIT is subject to dividend tax at 20%, unless the rate is reduced in terms of any applicable agreement for the avoidance of double taxation agreements (DTA) between South Africa and the country of residence of the non-resident shareholders. Assuming dividend tax will be withheld at a current rate of 20% the net dividend amount due to non-resident shareholders is 79.36 cents per share.
A reduced dividend tax in terms of the applicable DTA may only be relied on if the non-resident shareholder has submitted the following forms to his/her CSDP or broker, as the case may be, in respect of uncertificated shares, or the transfer secretaries, in respect of certificated shares:
• A declaration that the dividend is subject to a reduced rate as a result of the application of the DTA; and
• A written undertaking to inform the CSDP, broker or the transfer secretaries, as the case may be, should the circumstances affecting the reduced rate change or the beneficial owner cease to be the beneficial owner,
both in the form prescribed by the Commissioner for the South African Revenue Services (SARS).
If applicable, non-resident shareholders are advised to contact the CSDP, broker or the company, as the case may be, to arrange for the above-mentioned documents to be submitted prior to payment of the dividend, if such documents have not already been submitted.
Tax implications for non-resident shareholders
declaration of cash dividend | continued
14
Tax implications for South African resident shareholders Dividends received by or accrued to South African tax residents must be included in the gross income of such shareholders. They are not exempt from income tax in terms of the exclusion to the general dividend exemption contained in section 10(1)(k)(i)(aa) of the Income Tax Act because they are dividends distributed by a REIT. These dividends are, however, exempt from dividend withholding tax (dividend tax) in the hands of South African resident shareholders, provided that the South African resident shareholders have made submissions to the CSDP or broker, as the case may be, in respect of uncertificated shares, or the company in respect of certificated shares, a DTD (EX) (Dividend tax declaration that the dividend is exempt from dividends tax and a written undertaking to inform the CSDP,
broker or the company, as the case may be, should the circumstances affecting the exemption change or the beneficial owner ceases to be the beneficial owner, both in the form prescribed by the Commissioner for the South African Revenue Services (SARS)).
If resident shareholders have not submitted the above-mentioned documentation to confirm their status as a South African resident they are advised to contact their CSDP or broker, as the case may be, to arrange for the documents to be submitted prior to payment of the cash dividend.
Shareholders are encouraged to consult with their professional advisors should they be in any doubt as to the appropriate action to take.
The number of shares in issue at the date of this declaration is 266 197 535 and Octodec’s tax reference number is 9925/033/71/5.
By order of the board
S Wapnick JP WapnickChairman Managing director
25 October 2019
15
Octodec | reviewed provisional annual results 2019

16
financial statementsCondensed consolidated statement of financial position
Reviewed31 August
2019R’000
Audited31 August
2018R’000
ASSETSNon-current assets 12 733 048 12 590 121
Investment property 12 500 173 12 228 808 Plant and equipment 1 841 3 463 Straight-line rental income accrual 104 099 111 282 Tenant installations and lease costs 31 127 35 210 Interest in and loans to joint ventures 21 044 128 740 Loan granted 74 764 75 000 Derivative financial instruments – 7 618
Current assets 201 633 199 099
Accounts receivable and prepayments 119 274 130 498 Derivative financial instruments – 1 986 Loan granted – 3 028 Taxation receivable 675 675 Cash and bank balances 81 684 62 912 Non-current assets held for sale 209 300 364 600
TOTAL ASSETS 13 143 981 13 153 820
EQUITY AND LIABILITIESEquity 7 578 599 7 824 398
Stated capital 4 210 134 4 210 134 Non-distributable reserve 3 029 059 3 262 710 Retained income 339 406 351 554
Non-current liabilities 4 220 988 3 345 332
Long-term borrowings 4 027 644 3 240 759 Derivative financial instruments 99 694 17 977 Deferred taxation 93 650 86 596
Current liabilities 1 344 394 1 984 090
Short-term borrowings 950 435 1 605 774 Trade and other payables 393 959 378 216 Derivative financial instruments – 100
TOTAL EQUITY AND LIABILITIES 13 143 981 13 153 820

Condensed consolidated statement of profit or loss and other comprehensive income
% Change
Reviewed31 August
2019R’000
Audited31 August
2018R’000
Revenue 4.6 1 982 695 1 895 288 earned on contractual basis 5.1 1 990 886 1 893 806 straight-line rental income accrual (8 191) 1 482
Property operating expenses 7.5 (929 594) (864 911)
Net property income 2.2 1 053 101 1 030 377 Administrative and corporate expenses (5.3) (78 515) (82 875)Net operating profit 2.9 974 586 947 502 Fair value changes (232 599) 589 investment property (138 873) (39 084)unlisted equity shares (2 505) – interest rate derivatives (91 221) 39 673
Profit from operations 741 987 948 091 Profit/(loss) on sale of investment property 2 629 (916)Gain/(loss) on derecognition of share in joint venture 3 029 (2 770)Impairment of goodwill – (1 992)Share of income from joint ventures 3 595 9 954 share of after tax profit 517 9 291 share of fair value gains/(losses) 342 (9 747) interest received 2 736 10 410
Profit from ordinary activities before finance costs (21.1) 751 240 952 367 Net finance costs 6.7 (448 541) (420 297)finance income 18 844 18 584 finance costs 3.4 (467 385) (451 967)finance costs capitalised – 13 086
Profit before taxation 302 699 532 070 Taxation charge (7 052) 8 493 current – 6 971 deferred (7 052) 1 522
Profit for the year (45.3) 295 647 540 563 Other comprehensive income – –
Total comprehensive income for the year attributable to shareholders (45.3) 295 647 540 563
Basic and diluted earnings per share (cents) (45.3) 111.1 202.9
17
Octodec | reviewed provisional annual results 2019

Condensed consolidated statement of changes in equity
StatedcapitalR’000
Non-distributable
reserveR’000
Retainedearnings
R’000Total
R’000
Balance at 1 September 2017 (audited) 4 221 477 3 269 053 337 699 7 828 229 Total comprehensive income for the year – – 540 563 540 563 Shares repurchased (11 343) – – (11 343)Dividends paid – – (533 051) (533 051)Transfer to non-distributable reserve
profit on sale of investment property – (916) 916 – loss on derecognition of investment in joint venture – (2 770) 2 770 –impairment of goodwill – (1 992) 1 992 –deferred tax – 8 493 (8 493) –fair value changes
investment property – (39 084) 39 084 –investment property - joint ventures – (9 747) 9 747 – interest rate derivatives – 39 673 (39 673) –
Balance at 31 August 2018 (audited) 4 210 134 3 262 710 351 554 7 824 398 Total comprehensive income for the year – – 295 647 295 647 Dividends paid – – (541 446) (541 446)Transfer to non-distributable reserveprofit on sale of investment property – 2 629 (2 629) – gain on derecognition of share in joint venture – 3 029 (3 029) – deferred tax – (7 052) 7 052 – fair value changes –
investment property – (138 873) 138 873 – investment property - joint ventures – 342 (342) – unlisted equity shares – (2 505) 2 505 – interest rate derivatives – (91 221) 91 221 –
Balance at 31 August 2019 (reviewed) 4 210 134 3 029 059 339 406 7 578 599
financial statements | continued
18

Condensed consolidated statement of cash flows
Reviewed31 August
2019R’000
Audited31 August
2018R’000
Cash flows from operating activitiesNet rental income from properties 974 586 947 502 Adjusted for:straight-line rental income accrual 8 191 (1 482)depreciation and amortisation 15 989 17 558 working capital changes 25 213 42 629
Cash generated from operations 1 023 979 1 006 207 Interest income 18 844 18 584 Finance costs (471 737) (446 227)Dividend paid (541 446) (533 051)
Net cash flows from operating activities 29 640 45 513
Cash flows from investing activitiesAcquisition of investment property (82 617) (173 062)Purchase of subsidiary (35 585) (32 858)Repayment of loan granted 3 264 (2 817)Repayment to joint ventures (5 199) – Income from joint ventures 2 861 24 916Proceeds from disposal of investment property 129 179 61 608
Net cash flows from investing activities 11 903 (122 213)
Cash flows from financing activitiesShares repurchased – (11 343)Proceeds from borrowings 2 781 576 3 149 087 Repayment of borrowings (2 804 347) (3 128 888)
Net cash flows from financing activities (22 771) 8 856
Net increase/(decrease) in cash and bank balances 18 772 (67 844)Cash and bank balance at beginning of year 62 912 130 756
Cash and bank balance at end of year 81 684 62 912
19
Octodec | reviewed provisional annual results 2019

financial statements | continued
Reviewed31 August
2019R’000
Audited31 August
2018R’000
Total profit for the year attributable to shareholders 295 647 540 563
Headline earnings adjustments(Profit)/loss on sale of investment properties (2 629) 916 Impairment of goodwill – 1 992 (Gain)/loss on derecognition of interest in joint venture (3 029) 2 770 Fair value changesinvestment property 138 873 39 084 investment property - joint ventures (342) 9 747
Headline earnings attributable to shareholders 428 520 595 072
Headline and diluted headline earnings per share (cents) 161.0 223.4
Weighted number of shares in issue (000) 266 198 266 389
Reconciliation of profit or loss and other comprehensive income to headline earnings
20

Condensed consolidated segmental informationThe group earns revenue in the form of property rentals. On a primary basis the group is organised into five major operating segments:
Rental income by sector
Reviewed31 August
2019R’000 %
Audited31 August
2018R’000 %
Retail 517 226 33.3 502 923 34.2Offices 247 456 15.9 244 470 16.6Residential 499 610 32.2 446 730 30.4Industrial 110 287 7.1 109 254 7.4Specialised and other:Parking 68 043 4.4 65 080 4.4Healthcare facilities 37 434 2.4 33 223 2.3Auto dealerships 16 911 1.1 13 543 0.9Hotels 16 793 1.1 14 448 1.0Places of worship 7 534 0.5 6 627 0.5Educational facilities 30 928 2.0 34 151 2.3
Total rental income 1 552 222 100.0 1 470 449 100.0Recoveries and other income 430 473 424 839
Revenue 1 982 695 1 895 288
Further segment results cannot be allocated on a reasonable basis due to the “mixed use” of certain of the properties. It is the company’s philosophy to invest predominantly in properties situated in the Gauteng area and therefore the company has not reported on a geographical basis.
21
Octodec | reviewed provisional annual results 2019

Reconciliation of earnings to distributable earnings
%
Reviewed31 August
2019R’000
Audited31 August
2018R’000
Total comprehensive income attributable to shareholders 295 647 540 563 (Profit)/loss on sale of investment properties (2 629) 916 (Gain)/loss on derecognition of investment in joint venture (3 029) 2 770 Impairment of goodwill – 1 992 Fair value changesInvestment property 138 873 39 084 Investment property - joint ventures (342) 9 747 Unlisted equity shares 2 505 – Interest rate derivatives 91 221 (39 673)
Straight-line rental income accrual 8 191 (1 482)Taxation - Current and deferred 7 052 (8 493)
537 489 545 424 Amount not distributedAmount attributable to Edcon rent reduction* (2 505) – Share of after tax profit of joint venture – (3 980)
Distributable earnings attributable to shareholders 534 984 541 444
Represented by:Revenueearned on contractual basis* 5.0 1 988 381 1 893 806
Property operating expenses 7.5 (929 594) (864 911)
Net property income 2.9 1 058 787 1 028 895 Administrative and corporate expenses (5.3) (78 515) (82 875)
Net operating profit 3.6 980 272 946 020 Share of income from joint ventures 3 253 15 721
Distributable profit before finance costs 983 525 961 741 Net finance costs 6.7 (448 541) (420 297)
Distributable income before taxation (1.2) 534 984 541 444 Taxation - Current and deferred – –
Distributable earnings attributable to shareholders (1.2) 534 984 541 444
* Revenue for the year ended 31 August 2019 has been reduced by R2.5 million, which relates to the 40.9% rent reduction granted to Edcon in terms of the rent reduction agreement between Edcon and its landlords. Management valued the shares acquired in lieu of the rent reduction at nil value and reduced the distributable amount accordingly.
22
financial statements | continued

notes to the condensed consolidated financial statementsBasis of preparationThe condensed consolidated provisional financial statements are prepared in accordance with the JSE Listings Requirements and the requirements of the Companies Act, 71 of 2008. The condensed consolidated provisional financial statements have been prepared in accordance with the conceptual framework and the measurement and recognition requirements of International Financial Reporting Standards (IFRS), the South African Institute of Chartered Accountants (SAICA) Financial Reporting Guides as issued by the Accounting Practices Committee, the Financial Pronouncements as issued by the Financial Reporting Standards Council and as a minimum, contains the information required by IAS 34 Interim financial reporting. The accounting policies applied in the preparation of the condensed consolidated financial statements, with the exception of the adoption of IFRS 9 – Financial instruments and IFRS 15 – Revenue, are consistent with those applied in the preparation of the previous consolidated financial statements. The adoption of IFRS 9 and IFRS 15 did not have any significant impact on the 2019 financial statements. Revenue from recovery of utilities and other income continues to be measured and recognised as revenue on the same basis as under IAS 18 and the adoption of the new impairment model under IFRS 9 did not result in a significant change to the amounts reported in the current year.
These results have been prepared under the historical cost convention, except for investment properties, which are measured at fair value, and certain financial instruments, which are measured at either fair value or amortised cost.
These reviewed condensed consolidated provisional financial statements were prepared under the supervision of Mr AK Stein CA (SA), in his capacity as group financial director.
The condensed consolidated provisional financial statements were reviewed by Deloitte and Touche and their report is available for inspection at the company’s registered address.
23
Octodec | reviewed provisional annual results 2019

notes to the condensed consolidated financial statements | continued
Fair value measurement The group measures investment properties as well as financial instruments (which includes interest rate swaps and unlisted equity investments) at fair value at each reporting date. The fair values of financial instruments measured at amortised cost are disclosed when the carrying value of these instruments does not reasonably approximate their fair value at the reporting date.
Fair value hierarchyThe fair value hierarchy reflects the significance of the inputs used in making fair value measurements. The level within which the fair value measurement is categorised in its entirety is determined on the basis of the lowest level input that is significant to the fair value measurement in its entirety.
The different levels have been defined as follows:
• Level 1: Quoted prices (unadjusted) in active markets for identical assets or liabilities• Level 2: Input other than quoted prices included within Level 1 that is observable for the asset or
liability, either directly (i.e. as prices) or indirectly (i.e. derived from prices)• Level 3: Input for the asset or liability that is not based on observable market data
(unobservable input)
Level 2 instruments
The fair values of the interest rate swaps are determined on a mark-to-market valuation, by discounting the estimated future cash flows based on the terms and maturity of each contract and using the market interest rate indicated on the SA swap curve.
Level 3 instruments
The investment properties are valued bi-annually by a dedicated valuation team at City Property and the portfolio valuation is reviewed and approved by the board. In terms of the JSE Listings Requirements, all the properties are valued at least once over a rolling three-year period by external independent valuers. ln the current year 94 properties representing 24.7% of the portfolio, with a carrying amount of R3.2 billion were externally valued.
Valuation of property portfolio
The portfolio was valued by the following independent valuers who are all registered valuers in terms of section 19 of the Property Valuers Profession Act, 47 of 2000 and have extensive experience in property valuations.
Entity Valuator Qualifications
Jones Lang LaSalle (Pty) Ltd Shawn Crous MRICS, Professional valuer
Mills Fitchet Global William HewittNDPV, MIEA, FIVSA, RICS Registered Valuer
Realworx CC Stanton Alberts Professional Associate Valuer
Amanda de Wet Consultants and Investors CC Amanda Bruyns
BProc.LLB (UP) N.D RE (Unisa), Professional Valuer
Gert van Zyl Valuation Gerhardus Jacobus Van Zyl Professional Associate Valuer
24

Jones Lang LaSalle (Pty) Ltd and Mills Fitchet Global valued the properties using the discounted cash flow model and Realworx CC, Amanda de Wet Consultants and Investors CC and Gert van Zyl Valuation valued the properties using the capitalisation of income method. The entire property portfolio was also internally valued using the capitalisation of income method.
The key assumptions and unobservable inputs used by the group in determining fair value were as follows:
2019
Range (weighted average)2018
Range (weighted average)
Capitalisation rate (%) 8.5 – 14.5 (9.5) 8.0 – 13.0 (9.3)
Expense ratio (%) 5.1 – 44.1 (26.2) 5.7 – 49.1 (25.1)
Long-range vacancy factor (%) 0.0 – 35.0 (5.7) 0.0 – 30.0 (5.6)
Relationship of unobservable inputs to fair value
The significant unobservable inputs used in the fair value measurement of the group’s investment properties are the capitalisation rates, the expense to income ratios and the long range vacancy factor. Significant increases/(decreases) in any of these inputs in isolation would result in a significantly lower/(higher) fair value measurement.
Effect of a 1% shift on the carrying value of investment property
2019R’000
2018R’000
Increase of 1%
Decrease of 1%
Increase of 1%
Decrease of 1%
Movement in capitalisation rates, while all other inputs remain constant (1 217 789) 1 505 343 (1 224 992) 1 519 461
Movement in expense ratio, while all other inputs remain constant (172 764) 172 764 (168 784) 168 784
Movement in long-range vacancy factor, while all other inputs remain constant (135 187) 135 187 (133 957) 133 957
Investment properties and derivative financial instruments have been categorised as Level 3 and Level 2, respectively, and there have been no significant transfers made between Levels 1, 2 and 3 during the year. There have been no material changes in judgements or estimates of amounts as reported in previous reporting periods.
25
Octodec | reviewed provisional annual results 2019

Movement in Level 3 instruments
Investment property, plant and equipment
R’000
Balance as at 31 August 2018 12 743 362Total fair value changes for the year included in profit and loss (138 873)Straight-line rental income accrual (8 191)Depreciation and amortisation (15 989)
Acquisitions, disposals and other movements:Developments and subsequent expenditure 82 616Acquired through business combination 310 165Disposals (126 550)
Balance as at 31 August 2019 12 846 540
Included in profit and loss for the year: Changes in fair value of investment property (138 873)
Valuation of unlisted equity shares
The unlisted equity shares relate to the shares and notes acquired from Edcon in lieu of the rent reduction given to Edcon in terms of the rent reduction agreement between Edcon and its landlords.
Due to the uncertainty around the manner of disposal of the unlisted equity shares and notes at the end of the ‘rent reduction’ term and the uncertainty regarding the financial position of Edcon, the fair value of the shares and notes has been estimated at nil value and this will be reassessed once more information is available.
Events after the reporting date There have been no material subsequent events that require reporting.
Fair value measurement continued
notes to the condensed consolidated financial statements | continued
26

Commitments The group has approved capital commitments in the sum of R39.5 million (FY2018: R25.6 million), relating to various redevelopments, upgrades of properties, committed tenant installations and property contracts. These will be funded out of existing unused banking facilities.
Related party transactions Octodec and City Property are related parties in that Jeffrey Wapnick and Sharon Wapnick are directors of Octodec and City Property and members of the Wapnick family are shareholders of both companies.
Total payments made to City Property amounted to R201.9 million (FY2018: R197.1 million). This included fees for collections, leasing, property and asset management, commission on acquisitions and disposals, upgrades and developments as well as repairs. Octodec received R8.4 million from City Property in respect of rent and operating costs recovered.
As at 31 August 2019, the following amounts were owing from/(to) City Property:
2019R’000
2018R’000
Due to City Property (2 220) (4 617)
Due by City Property 1 068 1 209
Changes to the board The board welcomes Mr NC Mabunda, who was appointed to the board with effect from 11 February 2019, and looks forward to working with him.
27
Octodec | reviewed provisional annual results 2019

Business combination With effect from 1 November 2018, Joybee Properties (Pty) Ltd (Joybee), a subsidiary of the group, acquired the remaining 50% shareholding in Jardtal, a property-owning company, for a consideration of R36.5 million, settled in cash, increasing its shareholding from 50% to 100%. This resulted in Joybee acquiring control of Jardtal and Jardtal changed from a joint venture to a subsidiary of the group.
Fair value of assets acquired and liabilities recognised at the date of acquisition
R’000
Non-current assets Investment property 310 165
Current assets Loans receivable 2 994Accounts receivable and prepayments 1 590Bank balance and cash 915
5 499 Non-current liabilitiesInterest bearing borrowings (154 316)
Current liabilities
Interest bearing borrowings (74 100)Non-interest bearing borrowings (8 189)
(82 289)
Total identifiable net assets 79 059Fair value of equity interest held before the business combination (39 530) Bargain purchase on acquisition (3 029)
Acquisition date fair value consideration paid in cash 36 500
Net cash outflow on acquisition
R’000
Cash consideration paid 36 500
Bank and cash acquired (915)
Net cash outflow on acquisition 35 585
Octodec acquired the remaining shares in Jardtal as it provided Octodec shareholders with an attractive return.
Impact of acquisition on the results of the group
Revenue for the year includes an amount of R39.9 million and the loss for the year has decreased by R5.1 million (after the fair value change to investment property of R5.8 million) as a result of the Jardtal acquisition. If the acquisition had occurred on 1 September 2018, consolidated revenue for the year ended 31 August 2019 would have been R1 991.0 million compared to R1 982.7 million and profit after tax would have been R295.0 million compared to R295.6 million.
notes to the condensed consolidated financial statements | continued
28