tsip protocol sept2018 · risk screening model: pollutant – migration – pathway – people 7...
TRANSCRIPT

1
TOXICSITES IDENTIFICATION PROGRAM
INVESTIGATOR HANDBOOK
3
This Handbook is made possible by the generous support of the American People through the United States Agency for International Development (USAID). The contents are the responsibility of Pure Earth and do not necessarily reflect the views of USAID or the United States Government. Revised September 2018

4
Table of Contents
APPENDICES 5ACRONYMS 5ABOUT THE TOXIC SITES IDENTIFICATION PROGRAM AND INITIAL SITE SCREENING 6PURE EARTH 6TOXIC SITES IDENTIFICATION PROGRAM 6THE INITIAL SITE SCREENING 6STRUCTURE OF THIS DOCUMENT 7RISK SCREENING MODEL: POLLUTANT – MIGRATION – PATHWAY – PEOPLE 7 POLLUTANT 8 MIGRATION ROUTE 8 PATHWAY 9 PEOPLE 9
ISS QUESTIONNAIRE 10 PART 1. SCREENING RISK ASSESSMENT 10PART 2. PHYSICAL DESCRIPTION 13PART 3. RELEASE RISK 15PART 4. SITE STAKEHOLDERS – MEETING DETAILS 18PART 5. LINKED REPORTS AND IMAGES 19ESTIMATING EXPOSED POPULATION 19SOURCE, PATHWAY, RECEPTOR 19ESTIMATING EXPOSED POPULATION PER SECTOR 19ESTIMATING EXPOSED POPULATION PER TARGET SAMPLE 20ESTIMATING ADDITIONAL POSSIBLY EXPOSED POPULATION 21

5
CONFIRMING POPULATION ESTIMATE WITH LOCAL AUTHORITY 21SAMPLES AND LAB DATA 21SOIL SAMPLING PROTOCOL FOR METALS (LAB ANALYSIS) 26WATER SAMPLING PROTOCOL 28OPERATIONAL 28BEFORE YOUR SITE SCREENING 28DURING YOUR SITE SCREENING 30AFTER YOUR SITE SCREENING 31FREQUENTLY ASKED QUESTIONS 32
Appendices Appendix A – Health and Safety Guidelines Appendix B – How to Draw and Plot a Site Map Appendix C – Blacksmith Index Calculation Appendix D – Pollutant Summaries Appendix E - Reference Levels
Acronyms GPS – Global Position System ISS – Initial Site Screening LMIC - Low and Middle Income Country NGO – Non Governmental Organization PMEH – Pollution Management and Environmental Health pXRF – Portable X-Ray Fluorescence instrument TSIP – Toxic Sites Identification Program TSIP – Toxic Sites Identification Program VOC – Volatile Organic Compound WGS – World Geodetic System

6
About the Toxic Sites Identification Program and Initial Site Screening
Pure Earth Pure Earth is a New York based not-for-profit organization that partners with governments, NGOs and community groups to mitigate health risks at contaminated sites in low- and middle-income countries.
Toxic Sites Identification Program The Toxic Sites Identification Program (TSIP) endeavors to identify and screen industrially contaminated sites in low- and middle-income countries (LMICs) with a potential human health impact. As part of the TSIP more than 3,400 sites have been screened in 47 countries since 2009. The TSIP program has been supported by the European Commission, the United Nations Industrial Development Organization, the United Nations Development Program, the Food and Agriculture Organization of the United Nations, the Asian Development Bank and the World Bank. The purpose of TSIP is to quantify the approximate scope of industrial soil and water contamination in a given country. In some cases, high priority sites are targeted for intervention to mitigate exposures. The program aims to assess sites that have: • Toxic pollution • From a “point-source” (a fixed location, not air pollution from cars and trucks) • In concentrations or levels that can cause adverse human health impacts • Where there is a migration route and exposure pathway to humans • In low- and middle-income countries
The Initial Site Screening The Toxic Sites Identification Program (TSIP) utilizes a rapid assessment protocol known as the Initial Site Screening (ISS). The ISS is completed on site over a period of 2-3 days by professionally trained investigators and is designed to collect information related to human health risk. Completed ISSs are entered into an online password-protected database (tsipdatabase.org). The ISS is not a comprehensive assessment tool and is insufficient to fully characterize health risks. The ISS is not designed as the basis for epidemiological studies. Results should be considered indicative rather than definitive with regard to human health outcomes. The ISS is limited by a number of factors including cost, available analytical methods, and existing data on contaminated sites. These limitations result in geographic and thematic biases. Thus certain pollutants or geographic areas may be overly represented in the TSIP database. Additionally, individual quality of assessments varies. Users of the

7
TSIP database are cautioned to note the ISS status of individual site entries. Sites coded as approved are the most technically robust, while sites in other categories are in various states of completion. The protocol provided herein is intended is to supplement instruction site investigators have received at a TSIP training. Alone it is not sufficient guidance for the assessment of contaminated land.
Structure of This Document This document contains five major sections: the Risk Model; the ISS Questionnaire; Estimating Exposed Population, Sampling and Lab Analysis, and Operational Guidance. In the first section, Risk Model, the conceptual background of the TSIP approach is explained. Investigators are encouraged to read and understand this content before advancing onto the later operational sections. In the second section, the ISS Questionnaire, every question contained in the protocol is listed. For questions with predefined finite responses, those possible responses are listed. Guidance is provided for each question. In the third section, Estimating Exposed Population, guidance is provided to assist investigators in determining the number of people that are exposed at a given site. This estimation is perhaps the most challenging aspect of conducting an ISS. Hence it receives special attention in this section. In the fourth section, Sampling, guidance is given for collecting and analyzing samples in a manner consistent with the ISS protocol. In the fifth major section, Operational Guidance, instructions are given on preparation for site visits. This section is directed at the individual site investigator and is intended to help the investigator mitigate common issues that emerge during the site assessment process. Finally, in addition to the main text, the protocol includes a number of potentially useful annexes intended to support field investigators in identifying and assessing sites.
Risk Screening Model: Pollutant – Migration – Pathway – People Central to the TSIP’s approach is the model of Pollution-Migration-Pathway-People as the basis for understanding and assessing risks at a particular site. This model is consistent with risk screening approaches used internationally but is simplified for the purpose of conducting rapid risk screenings. The TSIP is focused on people’s health. However, many health impacts from pollution are chronic and are difficult to attribute directly to one source. In the context of an Initial Site Screening (ISS) it is unusual to be able to demonstrate clearly the health
8
consequences of a particular site. What can be done is to show that there is a credible risk attached to the site and that this risk deserves further investigation, as part of the design of an intervention. In simple terms, the health impact of a compound on an individual is a function of its toxicity and the dose received by people. The dose is a function of the concentration of the toxic compound, the time that people are exposed, and the pathway into the body. There are three basic pathways: inhalation – entry into the body through breathing; ingestion – entry through eating or drinking; and dermal – entry through skin contact and absorption. The existence of a public health risk at a site depends on three components: 1) There must be a source of pollution with a severe enough toxicity and a high enough level or concentration to be hazardous; 2) There must be a migration route for the pollution get to an area used or occupied by people; and 3) There must be a pathway into the body whereby people have the contaminant in their bodies for a long enough time for a significant dose to occur. The ISS is the process by which these components are identified and assessed at a site.
Pollutant There are many substances that are hazardous to peoples’ health. In the experience of the TSIP there are a relatively small number of key pollutants that occur repeatedly. These include heavy metals, some organic chemicals, and in certain places, radionuclides. The form and characteristics of the pollutant are important (mercury, for example, is relatively harmless as a solid but toxic as a vapor). The amount of the pollutant is also critical. Investigators try to estimate the total area affected by a hazardous material and the level of contamination. A key factor here is the concentration, which is measured by sampling and subsequent testing. The critical parameter is the “over-standard” – the factor by which the concentrations of the pollutant exceed relevant international standards. This is the quantitative indicator of the hazard posed by the site.
Migration Route The migration route should not be confused with the “pathway.” Pathway relates to how a substance enters the body. Migration route refers to how a contaminant is spread from a source to a community or the environment. Common migration routes include: • Airborne emission of dust or vapors from a specific source • Spread of dust by wind from waste piles or contaminated areas • Spread of dust or contaminated waste or soil by direct transport, such as by trucks carrying waste • Spread of dust or contaminated soil by water, such as in storm runoff, and then deposition in an area used by people • Transport of soluble toxics or very fine particles in surface or ground water, to places where the water is used as a drinking water source (such as a well, pond or stream)

9
• Uptake of toxic contaminants into plants or animals, most often from contaminated water, which then enter the food chain of people
Pathway A pathway is the physical mechanism by which pollution enters the body. This can happen through ingestion (swallowing, often in food or water), through inhalation (as dust or vapor), or by direct dermal (skin) contact. Radioactivity can, in some forms, act at a distance without direct contact and so proximity itself is a pathway. Note that most dust, unless of a very small size (less than 2.5 microns), actually enters the body through ingestion. Dust that is inhaled in is often caught in nose, throat and lung tissue and then coughed up and swallowed. In practical terms, people can be directly exposed to toxic chemicals from a waste site if they inhale or ingest dust or vapor from the site, get dust or vapor from the site on their skin, or drink groundwater or surface water flowing under or through the site. People can be indirectly exposed if they eat food (plants or animals) grown on land contaminated by dust or vapor from the site or irrigated with water contaminated with toxic chemicals from the site.
People A hazard becomes a risk when a population is actually exposed to or is impacted by the pollution at a dose high enough to potentially cause health impacts. A challenge for the investigator is to identify the relevant population, as the levels of contamination, substance toxicity, migration routes and pathways that exist will determine the exposure. The first step is to identify all the population groups within the probable area of influence of the polluted site, starting with populations immediately adjacent to the site, as well as those downstream and downwind from the site. This is best done using a local map and local information to identify nearby villages and urban areas (with estimated populations). Not all of these people will be at risk: that depends on the pollutant, migration route and pathways. The overall result of going through this logic is to be able to identify the populations that are potentially affected though the Pollution-Migration-Pathway-People connection. These people are the population at risk. Public health risk is easier to demonstrate when the migration routes are direct, the pathways are clear and the data on contamination is good. However, the objective of the ISS is not to conclusively prove or quantify a specific health impact. It is to identify a credible and significant risk to a population. Further studies are generally necessary to evaluate and quantify the risks and health impacts, which then hopefully lead to interventions to reduce the risks and impacts. Note that interventions can be focused on any or all of the components creating a toxic contamination problem. These could include: elimination of the source (such as waste removal or elimination of use of a toxic substance in a process); control of migration routes (such as installation of pollution control equipment or covering waste piles); elimination of pathways (such as covering or paving contaminated areas or providing clean drinking water sources); or reducing the people in contaminated areas (such as by fencing off disposal sites).

10
ISS Questionnaire
At the heart of the TSIP program is the online database accessible at tsipdatabase.org. All questions in the online database are listed below, organized by section.
Part 1. Screening Risk Assessment ISS Complete: This box should be checked after all required fields have been completed. Site Name: Select a name that identifies the source of pollution AND the location (city and state). For example: “John’s Lead Smelter, Kisongo, Arusha.” If the site is a whole village with many sources or no clear source, please use the village name. For example: “Bati Village, Thumen Country, Trivoli State.” Country: Select the appropriate country. Province: Select the appropriate province. ISS Date: Date of actual site visit (not the date of data entry). Site Coordinates: Using decimal degrees WGS 1984, input a latitude and longitude for the source of contamination (or approximate center of multiple sources). Note: Decimal degrees are formatted with as follows: 40.8703124,-74.2145468. Include a minimum of 6 digits after the decimal. Another common format, degree minutes seconds, is not acceptable and is formatted as: 40°52’13.12”, -74° 12' 52.37". Issue: Please select if the issue is an isolated site or if it is a regional problem. A regional problem is defined as: one source impacting different locations (for example several villages) or several small sources (for example several small mining operations) affecting a whole region. For instance, artisanal gold mining commonly occurs across regions. It is not necessary for our purposes to assess every village where artisanal and small-scale gold mining is occurring. Rather, assess the health exposures in one of the affected villages, and estimate the exposed population in the region; in this case, mark the “regional problem” check box. Similarly, contaminated river basins occur in many major cities around the world, and can impact millions of people. The pollution is diffuse and the sources are often disparate. In these cases, mark “regional problem” and estimate the population exposed. By contrast “local site” is categorized as having a well-defined population and
11
clear pollution source. Several small-scale battery recyclers in a single village would compose a "local" site. Abstract: Please enter a 3 to 5-sentence description of the problem. Clearly identify the source, the pollutant, the migration route and the pathway. For example: “A leather tannery in the town of Smithville dumped chromium waste behind the facility. The waste is not protected by walls or covered from rain or wind. The waste is leaching chromium into the local surface waters and groundwater. The local community uses wells dug into the contaminated groundwater aquifer as a potable water source.” Key Pollutant: Please select the key pollutant for the site from the drop down menu. The “Key Pollutant” is the contaminant that both has known toxicological effects and exceeds the recommended level. You are likely to encounter multiple sites where several pollutants are present. In these cases it is your responsibility to select the appropriate chemical as the key pollutant. Consider the following example. Residential soil in a community has become contaminated by wind blown dust from nearby mine tailings. Samples collected and analyzed show copper at very high levels. They also show arsenic slightly below the recommended level, and lead (Pb) at 1.5 times the recommended level. Arsenic is a known carcinogen and its levels are clearly elevated, though they are still within international standards. Copper levels well exceed international standards, though the toxicological effects of copper are not as significant. Finally, lead (Pb) has known neurological and cardiovascular effects and exceeds the international standard. Therefore lead (Pb) is the Key Pollutant. Select “Lead” from the drop down menu on the Screening Risk Assessment page. Enter sample results for lead and arsenic in the next section. Finally, originals of all sampling data (including that for copper) should be uploaded as an attachment. If the pollutant is a “Poly Aromatic Hydrocarbon,” “Pesticide,” or a “Volatile Organic Compound," select the specific pollutant from the drop-down menu. If the pollutant is a “Radionuclide” enter details in the free text field. If the pollutant is not listed, please select “other” and enter the pollutant name in the free text field. It is essential that the Key Pollutant field be properly completed. Direct any questions to the appropriate executing agency representative. Recommended Level: This value will usually populate automatically. If a local standard exists, please enter it in the adjacent free text field. The default recommended levels used by the TSIP can be accessed at the following link: http://www.pureearth.org/wp-content/uploads/2014/12/Maximum-Recommended-Levels.xls Sample Matrix: *Please review and understand the sampling and population estimate guidelines below before attempting to complete this section.
12
After you have selected the “key pollutant” please enter the following information in the matrix for each sample you have taken. A minimum of 15 readings should be taken using the pXRF, and a range of 5 to 10 soil samples per site should be taken if you are using laboratory analysis. Sample sector: Indicate the sector from which the sample was acquired. Sample type: Indicate if the sample is a composite or a targeted sample. Media: Select the type of substance that was sampled (air, soil, water, urine, hair, blood, etc.) Pathway: Please select how the population enters in contact with the pollutant. Population: See the relevant section below for instructions on estimating the population at risk. Test Results: Please enter the pollutant concentration from each sample. The measurement units will be automatically entered once you select a “media”. Please ensure that the sampling data you enter uses the same units that are automatically generated. Coordinates of Sampling Data: Using decimal degrees WGS 1984, input a latitude and longitude for each sample. Note: Decimal degrees are formatted with as follows: 40.8703124,-74.2145468. Include a minimum of 6 digits after the decimal. Another common format, degree minutes seconds, is not acceptable and is formatted as: 40°52’13.12”, -74° 12' 52.37". Upload XRF File: Format XRF (or other sampling data) appropriately and upload via this link. The appropriate format may be downloaded in the database adjacent to the Upload XRF File link. Additional Possibly Exposed Population: Follow population estimate instructions below. Population estimate confirmed with local authority: Check this box if the population estimates were confirmed by a local authority (e.g. mayor or school principal). Data Source Type: Select the category of source used to get the sample results. Data Source Citation: Please include a detailed description or citation of your data source. Upload Data Source: Upload original report or publication as an attachment, if applicable. Test Data Certainty: Please use your best judgment to indicate the reliability of the data source. For example, if you took samples that were analyzed in a certified lab, the certainty should be high. If the data is old, or comes from a local advocacy group, the certainty may be low.
13
Population estimate explanation: Explain three to five sentences how the population affected was estimated. For example, “Only people living within 300m2 around the source were included, national census data from 2009 was used. DDT is not highly water soluble and is therefore unlikely to migrate far beyond the secure storage area.” Population estimate confirmed with local authority: Check this box only if population estimates were verbally confirmed by a local authority.
Part 2. Physical Description Location & Site Description: Please write at least four detailed paragraphs addressing the following: Geography, Source, Migration, Pathway, and Receptor.
• Geography: Location and geographical description of the site (size, topography, distance from town, nearby rivers, lakes, mountains, etc.)
• Source: Detailed description of the pollution source (is it a factory? Is it abandoned? What did it make? How many people worked there? What kinds of wastes did it produce? Where were they dumped?)
• Migration: Description of the contaminant migration route (fugitive dust carried off-site from a lead smelter to the neighboring community; contaminated soil dumped in the open next to a school; or a surface stream contaminated by storm runoff from a sludge pile)
• Pathway: Description of the pathway into the human body (dust inhalation or ingestion, surface water ingestion, contaminated food ingestion, etc.)
• Receptor: Description of the population that is affected (Where do they live? Where do they get their drinking water? What kind of houses do they have? Are there many kids? Do the kids have direct contact with the pollution? Are they downwind from the pollution source? Do they pass the source on their way to work or school?)
Size of Contaminated Areas: Select the approximate size of the contaminated area:
• <100m2 • 100-500m2 • 500-1,000m2 • 5,000-1000m2 (1 hectare); • 1 hectare-5 hectare; • 5 hectare.
Estimated Depth of Contamination: Enter value in meters if known. Leave blank is unknown. Was a test pit dug to determine the depth of contamination: Select yes or no.
14
Is there a strong smell associated with the site attributed to contamination: Select yes or no. Soils and Geographic Data: This section populates automatically and is intended to guide estimates of site investigators. It cannot be edited. Land use: If the contaminated area is on land, please select the category that best describes use given to land. List the number of people in the following categories: Enter population data into the 4x3 table (4 categories of location and 3 categories of activity). Note: categories are exclusive; populations should not be entered in two separate boxes. Site accessibility to animals that are later consumed by humans: Choose which best describes the area
• food animals/fish on site • food animals/fish within 100m, • accessible to occasional food animals
How far are crops produced from the contaminated area:
• No crops are produced within 100m • Crops are produced within 100m of contaminated area • Crops are produced within 10m of contaminated area • Crops are produced in contaminated area
If water at the site is contaminated, is there another source of clean water available?: Select yes or no Describe the access to the contaminated area:
• Controlled access; entry difficult • Remote locations; less accessible • Moderate access; entry more difficult • Easy access; few barriers to entry
Describe the ground cover over the contaminated area:
• The site is covered by a concrete slab or other type of engineering • The site is covered with concrete or other type of engineering in very poor
condition • There is complete grass cover and other vegetation • There is sparse grass cover • The contaminated area is bare

15
Source Industry: Choose the primary industry that is the source of the pollution. Please read the full list of industries. Some industries are very similar, for example “mining and ore processing” and “artisanal mining.” Please choose carefully. Active, Legacy, or Both: An “active” site is one where the industrial process or facility is open and active. A “legacy” site is one where the facility or process has ended or is closed. A “Both” site is one where the facility or process is open and active, but where soil or groundwater pollution exist from years of past industrial activities. For example, an active facility that is the source of years of heavy metal pollution in soil and sediments is a “both.” Formal or Informal Industry: Select appropriate category Documented Health Effects: Select yes or no. Describe credible health impact of pollutant: Please describe the health impact of the pollutant and its particular pathway to the population at risk. Anecdotal, peer-reviewed, or media accounts of any health effects on local pollution are accepted. Attach any existing studies (scan and pdf).
Part 3. Release Risk Is there permanent surface water on the site: Select yes or no Possible Groundwater Contamination: This box should be checked if the investigator feels the site may pose a significant risk to groundwater, regardless of whether that groundwater is currently used by area residents. What is it used for?:
• Other • Unknown • Irrigation • Fishing • Bathing/Washing • Drinking
Is there evidence of a high water table or ground water downstream of the contaminated site: Select yes or no Depth of the water table:

16
• Shallow <2m • Medium 2 – 10m • Deep 10-50m • Very Deep >50m
Is the site in a flood plain: Select yes or no Distance to the closest river or water body:
• 0 to 300m • 300m-1k • 1-5km • >5km
Type of Water Body:
• Not specified • Not Applicable • Pond (less than 1 hectare) • Small lake (1-10 hectares) • Large Lake (more than 10 hectares) • Estuaries • Ocean • Small River/ Stream • Large River • Wetland
Distance to the closest well:
• No well in vicinity • Within 500m of contamination; • Within 100m of contamination • Within 50m of contamination
In which direction:
• North • Northeast • East • Southeast • South • Southwest
Use of the Well:
• Water supply • Irrigation • Livestock water supply • Not known

17
• West • Northwest
Position of the contaminant(s) relative to the slope: This question is asking where the contaminant is relative to the slope of the ground. Is it on the surface (above ground) or deeper in the soil (below ground)? The second part of the question is asking if the site is on a hill and if that hill is steep. Please choose the description that fits best:
• Contaminants above ground level and slope is steep • Contaminants at or below ground level and slope is steep • Contaminants above ground level and slope is intermediate • Contaminants at or below ground level and slope is intermediate • Contaminants above ground level and slope is flat • Contaminants at or below ground level and slope is flat • Not known
Is this a storage facility for chemicals such as pesticides?: Select Yes or No If “yes,” a new series of questions will appear automatically:
• Number of Containers. Please enter how many containers are on site. • Additional Sources
o Uncontained piles, o Residue or spills only, o Not applicable (containers only)
• Please list the chemicals stored at the site: • If Uncontained piles, estimate quantity: Indicate quantity in cubic meters • Size of Containers: Estimate size in liters (if applicable) • Type of Container:
o Steel or metal drum o Metal can or pail o Plastic drum o Paper container o Bags o Other
• Container Age: o 1-5 Years, o 5-10 Years o 10- 20 Years o >20 Years
• Formulation: Check appropriate boxes
o Liquid, o Powder o Solidified o If Liquid Identify Dilutant:
18
§ Water § Oils § Volatile Solvents § Nonvolatile solvents
• Please describe the floor:
o Concrete or similar (good condition) o Concrete or similar (poor condition) o Soil, or other permeable surface
• Specify concentration of Pesticide if known: in ppm • Identification Method:
o Good, legible labels o Inventory or written records o Unreliable labels o Verbal or Informal records o Location: o Inside building with good roof, o Inside building with poor roof o Outdoors o Below ground
• If Building, select: o Good walls o Incomplete or poor walls o Not applicable (Outside)
• If cover, select: o Not applicable o Tarpaulin or plastic in good condition, o Other or poor cover, o No cover
Please provide any additional information about the facility you think may have not been captured by the questions above:
Part 4. Site Stakeholders – Meeting Details Please identify all relevant government agencies, non-profit organizations and business that have any authority or interest in the site. If any government official accompanied you to the site visit, please document his/ her name and title in this section. At a minimum, you must indicate the total number of stakeholders interviewed and their gender.
19
Part 5. Linked Reports and Images Upload relevant files and provide descriptions Minimum requirements At least 10 photos of the site, source, pollution, exposure pathways and affected population (ask permission before taking photos of people). A site map (copied or drawn) showing the boundaries of the site, location of the source of pollution, the location of the affected population, the pathway to people and the most contaminated areas (scan and pdf). Beneficial Additions Studies of health impacts, if (scan and pdf). Other reports or articles with relevant information (scan and pdf). Any Internet links to source of data, media information, etc. Public View: Certain sections of the TSIP database are accessible to the public, including linked reports and images. Therefore, when uploading documents, you are given the option of whether or not to make that particular document accessible to the public. Please exercise caution in choosing “yes.” Documents that include any biological samples results or names of any people should NOT be made public. Images of people should also be checked “no.” Published papers and images of the site (that do not include people) can be made public, as can maps and other documentation that describes the site in general.
Estimating Exposed Population
Source, Pathway, Receptor The ISS uses a source–pathway–receptor model common in risk assessment. In short, a site must have a source of contamination (e.g. a leaking underground petroleum tank), a human exposure pathway (e.g. a proximate well) and a receptor (e.g. a residential neighborhood using the well) to pose a risk. All three must be present for the hazard (i.e. the petroleum) to become a risk. The number of receptors is synonymous with the exposed population.
Estimating Exposed Population Per Sector

20
This is the most straightforward of the population estimates the investigator is charged with developing. It is defined as the number of people living or working within the relevant sector and coming into contact with the pathway defined for the sector. For the purpose of illustration, consider a sector for which the investigator has collected one composite surface soil sample. The sample is taken as indicative of exposure for the sector as a whole. If the contaminant is a metal, the exposure pathway is likely ingestion of contaminated soil as dust. If the contaminant is a volatile organic compound (VOC), the exposure pathway might be inhalation as well as ingestion. The investigator is asked to consider and elect the most dominant pathway. Now consider that the sector includes a school with 70 students, 3 houses and mechanic’s shop. Regarding the houses, the investigator might inquire about the occupants to determine the number of residents, or simply make an educated guess as to their number. In most cases, 2-5 residents per house is an acceptable estimate. In some countries the number is closer to 5-7, this often varies from rural to urban areas. Investigators are asked to choose the best estimate for their specific case. The table below presents regional averages and can be used as a guide. Region Household Size Africa 3–6 Central Asia and Eastern Europe 2–4
Central America 3–5 South America 2–4 South Asia 4–7 Southeast Asia 3–5
Regarding the school, consider the students, but also consider the teachers, the staff and anyone else spending significant time at the school. Finally, regarding the mechanic’s shop, consider the workers. In general, visitors should not be counted here as the duration of exposure is simply too short to be comparable with the risk posed to residents or workers. Take the sum of these receptors as the total population exposed. School 70 students + 2 teachers + 1 care taker = 74 Houses 4 residents per house x 3 houses = 12 Mechanics shop 1 mechanic + 2 assistants = 3 Total Exposed Population (Sector 1) = 89
Estimating Exposed Population Per Target Sample As a general rule, in the case of soil samples this number should be very small (<10 people). It is the number of people estimated to come into direct contact with the area where the target sample was taken. It is not indicative of the sector as a whole. For water samples, this number might be much larger. A tap sample from a well used by a
21
whole community is indicative of exposure for that whole community. Thus, in the case of water this number could also be several hundred people. In communities where several homes have their own taps but rely on the same aquifer or water distribution system, samples should be taken at multiple taps (>3) to confirm the source of contamination. The results of that analysis would inform the decision on the size of the exposed population.
Estimating Additional Possibly Exposed Population In many cases it will not be practical for the site investigator to visit and collect samples from the full extent of the contaminated area. In these cases, the additional possibly exposed population should be determined. This is defined as the population coming into contact with the pollutant outside of the sample sectors. These exposure are likely far less severe than those within the sectors. Visitors to schools or shops within a sector might be included in this group. Populations regularly eating food grown or stored within the contaminated area might also be considered. In some cases these exposures may exceed those closer to the site in severity. Consider a lead smelter with good emissions controls but a poor worker safety regime. Smelter workers that return home in their work clothes can contaminate the home environment. As a general rule, investigators should be conservative when estimating the size of exposed population in all categories. Isolated site populations rarely exceed 1000 people. Estimates exceeding 1000 receptors should receive special attention. Regional problems by contrast often exceed 1000 receptors. In this case, population estimates above 5000 receptors should receive special attention. The database includes a population density field. This automatically populates based on the coordinates of the sites. Depending on the quality of data available, this this estimate can vary widely in quality. Use cautiously if attempting to guide your estimate with this value.
Confirming Population Estimate with Local Authority Once you have developed your population estimates, confirm them with a local authority. This may be the mayor, a local school principal or community leader. Census data is often rare or non existent. In these cases, the community leader may be your best source of information.
Samples and Lab Data High quality sampling and analysis, like population estimates, is fundamental to the ISS. In many cases, a separate agency may have already carried out sampling at a site.
22
When these samples are available, credible and recent, the results can be used in lieu of additional site sampling. If no sampling data exists, investigators should conduct sampling according to the guidelines below. Each sample should come from a known or suspected human exposure area and should relate to an identifiable pathway. For example, samples collected from a drinking water source are preferred to those from an industrial effluent pipe. Similarly, samples from soil inside a community are preferred to those inside an industrial estate or workshop. Before samples are collected, a reliable and certified regional laboratory should be identified. The laboratory will have specific handling instructions for the contaminant and medium. These instructions should be followed when collecting and transporting samples. Tell the laboratory which parameters/pollutants to test for based on which pollutants are most harmful to human health and your investigation of the pollution source. If samples are being analyzed with field equipment such as a pXRF or mercury vapor analyzer the investigator should ensure that the analysis is done in a manner consistent with the manufacturer’s instructions. All sampling data should be entered in the database as described above. Be sure to clean your equipment between each sample. Usually a thorough wipe with a paper towel wetted with bottled water is sufficient. For water samples, rinse the bottle only if there is no additive or agent. As a general rule, begin collecting samples away from the source and working your way closer as you collect more samples. This will help reduce the risk of cross-contamination. Investigators should wear latex gloves during sampling. Additional PPE may be required before visiting sites. Investigators should check with executing agency before visiting a site to discuss PPE requirements. At no time should investigators enter confined spaces. Certain types of sites present acute hazards and require specialized PPE and training (e.g. pesticides stores and radioactive sites). Consult with your executing agency before visiting such sites.

23
SOIL SAMPLING PROTOCOL FOR METALS (XRF)
MATERIALS REQUIRED• GPSdeviceifavailable• XRF(withTroubleshootingGuide)• Camera• Mapofsite;Notepadandpen• Clear,polypropylenebagsorothercollectionmethodasspecifiedbylab
• Permanentmarker(preferablySharpie®)• SampleLog• Metalspoon(1);Spatula(1);Shovel(notusu-allyrequired)
• Gloves• PersonalProtectiveEquipment(PPE)asneeded
HEALTH AND SAFETY FollowhealthandsafetyguidelinesdetailedintheInvestigatorHandbook.
MAPPINGAmapshouldbemadeofthesitethatproperlyindicatessamplinglocationsandkeyfeatures(Schools,homes,andthepollutionsource).Electronicmapsarepreferable,thoughascanorphotographofahand-drawnmapisperfectlyacceptable.
INTERVIEWINGInterviewswithlocalresidentsandcommunityleadersarekeytounderstandingthepathwayspresent.Trytounderstandwhichareasarecommonlyusedandwhicharerarelyused.Thiswillhelpguidehowyoudividesectors.
XRF READINGSDividethesiteinto‘sectors’basedonuse(residential;public;agricultural;school;industrial).Largersitesmayrequireasmanyas6sectors,smallersitesmaybecoveredinasfewas2(SeeFigure1).
Samplingnotonlydeterminesconcentrationofcontamination,butitalsohelpstodeterminehowfarfromasourcecontaminationhasspread.Thus,whenpossibleradialsequentialsamplingistobeusedineachsector:
•Establishlinesfromthesourceofcontaminationinthedirectionthatthecontaminationmayhavebeenspread*
•Takereadingsalongeachline,typicallyoneevery5mfor50m,foratotalof10readings
ESTIMATING POPULATIONEstimatetheapproximatenumberofpeoplecomingintocontactwiththepollutantineachsector.Makenoteofthegroupsatrisk(suchaschildren,workers,elderly).RefertoPopulationTableintheHandbook.
Agricultural Residential Public
fig. 1
1
2
3
4
5 6

24
25
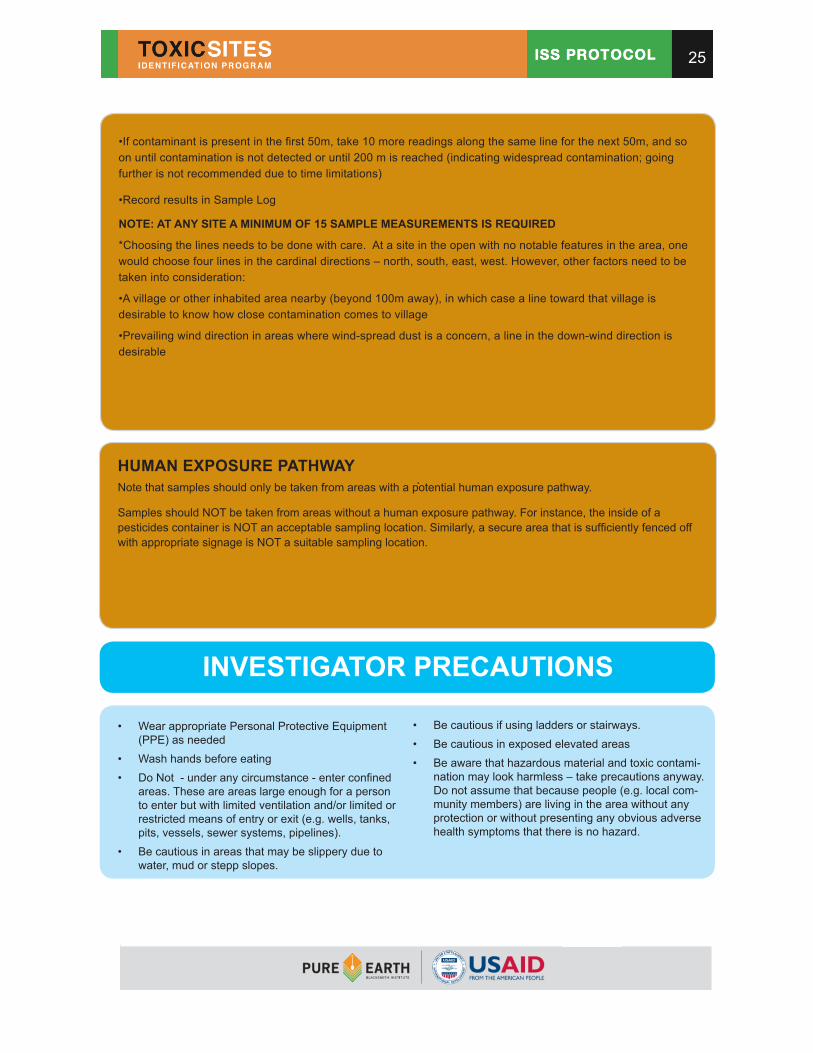
•Ifcontaminantispresentinthefirst50m,take10morereadingsalongthesamelineforthenext50m,andsoonuntilcontaminationisnotdetectedoruntil200misreached(indicatingwidespreadcontamination;goingfurtherisnotrecommendedduetotimelimitations)
•RecordresultsinSampleLog
NOTE: AT ANY SITE A MINIMUM OF 15 SAMPLE MEASUREMENTS IS REQUIRED
*Choosingthelinesneedstobedonewithcare.Atasiteintheopenwithnonotablefeaturesinthearea,onewouldchoosefourlinesinthecardinaldirections–north,south,east,west.However,otherfactorsneedtobetakenintoconsideration:
•Avillageorotherinhabitedareanearby(beyond100maway),inwhichcasealinetowardthatvillageisdesirabletoknowhowclosecontaminationcomestovillage
•Prevailingwinddirectioninareaswherewind-spreaddustisaconcern,alineinthedown-winddirectionisdesirable
HUMAN EXPOSURE PATHWAYNotethatsamplesshouldonlybetakenfromareaswithapotentialhumanexposurepathway.
SamplesshouldNOTbetakenfromareaswithoutahumanexposurepathway.Forinstance,theinsideofapesticidescontainerisNOTanacceptablesamplinglocation.Similarly,asecureareathatissufficientlyfencedoffwithappropriatesignageisNOTasuitablesamplinglocation.
• WearappropriatePersonalProtectiveEquipment(PPE)asneeded
• Washhandsbeforeeating• DoNot-underanycircumstance-enterconfined
areas.Theseareareaslargeenoughforapersontoenterbutwithlimitedventilationand/orlimitedorrestrictedmeansofentryorexit(e.g.wells,tanks,pits,vessels,sewersystems,pipelines).
• Becautiousinareasthatmaybeslipperyduetowater,mudorsteppslopes.
INVESTIGATOR PRECAUTIONS
• Becautiousifusingladdersorstairways.• Becautiousinexposedelevatedareas• Beawarethathazardousmaterialandtoxiccontami-
nationmaylookharmless–takeprecautionsanyway.Donotassumethatbecausepeople(e.g.localcom-munitymembers)arelivingintheareawithoutanyprotectionorwithoutpresentinganyobviousadversehealthsymptomsthatthereisnohazard.
475RiversideDrive,860NewYork,NY10115USA+12128703490

26
Soil Sampling Protocol for Metals (Lab Analysis)SOIL SAMPLING PROTOCOL FOR METALS (LAB)
MATERIALS REQUIRED• GPSdeviceifavailable• Camera• Mapofsite;Notepadandpen• Clear,polypropylenebagsorothercollectionmethodasspecifiedbylab
• Permanentmarker(preferablySharpie®)• SampleLog• Labelsforbags,printedandcut• Metalspoon(1);Spatula(1);Shovel(notusu-allyrequired)
• Gloves• PersonalProtectiveEquipment(PPE)asneeded
HEALTH AND SAFETY FollowhealthandsafetyguidelinesdetailedintheInvestigatorHandbook.
MAPPINGAmapshouldbemadeofthesitethatproperlyindicatessamplinglocationsandkeyfeatures(Schools,homes,andthepollutionsource).Electronicmapsarepreferable,thoughascanorphotographofahand-drawnmapisperfectlyacceptable.
INTERVIEWINGInterviewswithlocalresidentsandcommunityleadersarekeytounderstandingthepathwayspresent.Trytounderstandwhichareasarecommonlyusedandwhicharerarelyused.Thiswillhelpguidehowyoudividesectors.
COMPOSITE SAMPLINGDividethesiteinto‘sectors’basedonuse(residential;public;agricultural;school;industrial).Largersitesmayrequireasmanyas6sectors,smallersitesmaybecoveredinasfewas2(SeeFigure1).
Dependingonsectorsize,collectfrom3to10samplesofsurfacesoilpersector,evenlydistributed.Notethatlargersectorswillrequiremoresamples.Eachsampleshouldbeaboutonehalfteaspoon(2.5cubiccm,5grams).Combineallthesamplesinthesamebagandblendthematerialtoforma‘composite.’LabelaccordingtoLabelingSamplesinstructionsonreverse.
ForCompositeSampling,recordonesetofGPScoordinatesusingdecimaldegrees.Usethecentermostpointofyourcollected
ESTIMATING POPULATIONEstimatetheapproximatenumberofpeoplecomingintocontactwiththepollutantineachsector.Makenoteofthegroupsatrisk(suchaschildren,workers,elderly).RefertoPopulationTableintheHandbook.
Agricultural Residential Public
fig. 1
1
2
3
4
5 6

27
HUMAN EXPOSURE PATHWAYNotethatsamplesshouldonlybetakenfromareaswithapotentialhumanexposurepathway.SamplesshouldNOTbetakenfromareaswithoutahumanexposurepathway.Forinstance,theinsideofapesticidescontainerisNOTanacceptablesamplinglocation.Similarly,asecureareathatissufficientlyfencedoffwithappropriatesignageisNOTasuitablesamplinglocation.
• WearappropriatePersonalProtectiveEquipment(PPE)asneeded
• Washhandsbeforeeating• DoNot-underanycircumstance-enterconfined
areas.Theseareareaslargeenoughforapersontoenterbutwithlimitedventilationand/orlimitedorrestrictedmeansofentryorexit(e.g.wells,tanks,pits,vessels,sewersystems,pipelines).
• Becautiousinareasthatmaybeslipperyduetowater,mudorsteppslopes.
TARGETED SAMPLINGInadditiontocompositesampling,upto4targetsamplesshouldbetaken(SeeFigure2).Targetsamplesshouldbeindividualsurfacesoilsamplesof25to30grams*andshouldbetakenfromsuspected‘hotspots,’suchasresidentialareasadjacenttoacontaminationsource.GPScoordinatesshouldalsobetakenforeachtargetedsample.Labelsamplesaccordingtoinstructionsbelow(Labelsshouldbepre-printedandcut).
*Makesuretoconfirmwithlocallabthespecifiedamountsand/orotherspecialhandlingrequirementstheymayhave.
INVESTIGATOR PRECAUTIONS
LABELING SAMPLESEachsampleshouldbelabeledinthefollowingorder:1. Sample#2. SiteName(Town)3. Date4. GPSCoordinates
Labels should be pre-printed and cut. Samples should be double bagged with labels placed in between bags.
• Becautiousifusingladdersorstairways.• Becautiousinexposedelevatedareas• Beawarethathazardousmaterialandtoxiccontami-
nationmaylookharmless–takeprecautionsanyway.Donotassumethatbecausepeople(e.g.localcom-munitymembers)arelivingintheareawithoutanyprotectionorwithoutpresentinganyobviousadversehealthsymptomsthatthereisnohazard.
Targeted
Composite fig. 2
475RiversideDrive,860NewYork,NY10115USA+12128703490

28
Water Sampling Protocol
Operational
Before Your Site Screening
Before visiting a site, the following preparations should be made. Step 1: Coordinate your site screening with the executing agency to make sure
your plans are consistent with the regional priorities, budget, and timeline. Discuss any potential health and safety issues at the site.
Step 2: Research the site. Look for sampling data from other research projects.
Examine available maps, such as those from Google Maps, Google Earth or government sources, to familiarize yourself with the area and key features such as the locations of roads, residential areas, industrial or mining areas and water bodies. Do your best to ensure the site is within the scope of the TSIP program. Key criteria include the following: 1. Chemical pollution (including heavy metals, POPs, radionuclides,
dioxins, PCBs, POPs, VOCs, among others—not biological pollution, such as from poor sewage treatment)
2. Pollution occurring in concentrations above internationally accepted levels
3. Point source pollution (not cars and trucks, or multi-source contamination ad in an entire river system)
4. Likely migration to areas occupied or used by people 5. A likely exposure pathway to humans
Step 3: Identify a local contact or guide. Call local people to schedule interviews,
including interviews to take place at the field site on the day of testing. Try to meet with:
29
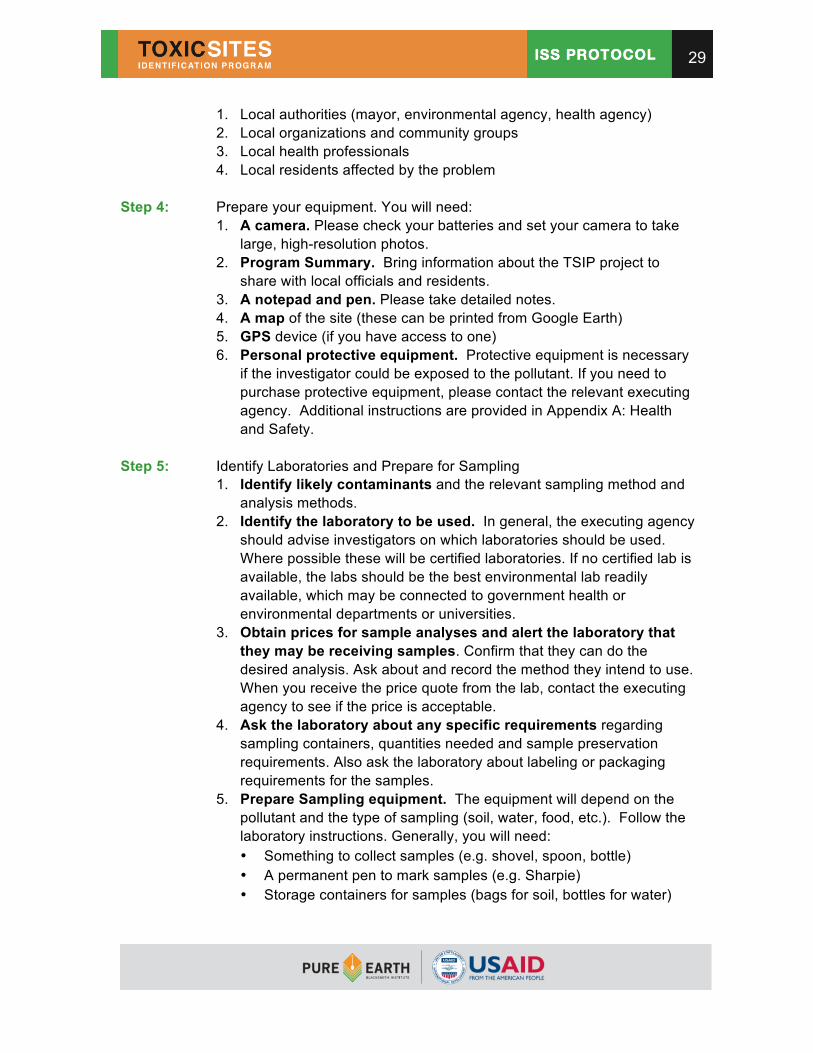
1. Local authorities (mayor, environmental agency, health agency) 2. Local organizations and community groups 3. Local health professionals 4. Local residents affected by the problem
Step 4: Prepare your equipment. You will need:
1. A camera. Please check your batteries and set your camera to take large, high-resolution photos.
2. Program Summary. Bring information about the TSIP project to share with local officials and residents.
3. A notepad and pen. Please take detailed notes. 4. A map of the site (these can be printed from Google Earth) 5. GPS device (if you have access to one) 6. Personal protective equipment. Protective equipment is necessary
if the investigator could be exposed to the pollutant. If you need to purchase protective equipment, please contact the relevant executing agency. Additional instructions are provided in Appendix A: Health and Safety.
Step 5: Identify Laboratories and Prepare for Sampling
1. Identify likely contaminants and the relevant sampling method and analysis methods.
2. Identify the laboratory to be used. In general, the executing agency should advise investigators on which laboratories should be used. Where possible these will be certified laboratories. If no certified lab is available, the labs should be the best environmental lab readily available, which may be connected to government health or environmental departments or universities.
3. Obtain prices for sample analyses and alert the laboratory that they may be receiving samples. Confirm that they can do the desired analysis. Ask about and record the method they intend to use. When you receive the price quote from the lab, contact the executing agency to see if the price is acceptable.
4. Ask the laboratory about any specific requirements regarding sampling containers, quantities needed and sample preservation requirements. Also ask the laboratory about labeling or packaging requirements for the samples.
5. Prepare Sampling equipment. The equipment will depend on the pollutant and the type of sampling (soil, water, food, etc.). Follow the laboratory instructions. Generally, you will need: • Something to collect samples (e.g. shovel, spoon, bottle) • A permanent pen to mark samples (e.g. Sharpie) • Storage containers for samples (bags for soil, bottles for water)

30
During Your Site Screening Please take lots of notes and pictures, and keep all receipts for expenses. Step 1: Interview. Meet with local people that understand the site and may be
aware of health impacts from the site or community health problems. Ask them about the source, the migration routes, pathways, and the points where people are exposed. These local people could be a Mayor, employees of environmental organizations, a local doctor or nurse, the owner of the site, local school officials or other residents.
Ask these locals if they have any reports, studies, maps, about the site. If they have these, make copies there. Upload these documents to the online database when you return.
Step 2: Explore Site. Walk around site to understand the source, the pollutant, the migration routes, the pathways and the impacts. Use appropriate personal protective equipment if necessary. Take lots of pictures (at least 10) of the pollution source, migration routes, and the contaminated areas (such as streams, storm runoff channels or off-site waste piles). If there are people in or near the impacted area, please take pictures to show that potential for contact between the pollution and people (ask their permission to be photographed). Define the areas that might be impacted by the pollution and which should be considered part of the “site.”
Step 3: Map. The map can be drawn by hand or made using free mapping
software (Google Earth, Bing, ESRI etc.) Divide the map into sectors based on land use: Agriculture; Critically Sensitive Receptors (Schools, Hospitals, Etc.); Dumpsite; Housing/Residential; Industrial (active); Industrial (vacant or closed facility); Natural Area; Vacant Land. On your map, mark the location of the pollution source, the migration route, the local neighborhoods that are affected, the location of your samples, and any other important landmarks or sites. It is important to include orientation (i.e. a north arrow) and scale.
Step 4: GPS. If you have a GPS recording unit, record GPS coordinates for:
• The center of the affected area (you will enter these coordinates into the database).
Step 5: Sample. If there are no credible test results from other reports, please
take samples (see the Sampling Guides above). Please record your

31
sampling locations on your map and record the GPS coordinates for each sampling location. If you are collecting target samples, please take the GPS coordinate of each sample. If you are collecting a composite sample, take the GPS at the center of each sector.
Step 6: Estimate Population at Risk. See instructions above.
After Your Site Screening Step 1: Enter Data. Enter your notes and data into the online database as soon
as possible. It is best to enter you screening into the database on the same day.
Step 2: Upload. Upload your photos, notes from interviews, maps, reports, and
any other documents into the online database. Step 3: Contact Laboratory. If you took samples, contact the laboratory
previously identified for use, and inform them of the number of samples collected and the contaminants for which the samples are to be analyzed. Bring or ship the samples to the laboratory according to their instructions. Confirm the cost for the analysis and how long it will take to receive results. Be clear and specific as to whom the results should be sent and how (such as a specific name and email address). Follow up with the laboratory if results are not received when expected.
Step 4: Finalize and Notify. Once your site screening is entered into the online
database, mark “ISS Complete” in the online site screening and inform the executing agency.
32
Frequently Asked Questions
What is the definition of a “site”? A “site” typically includes the pollution source (which may be an active or legacy site), the migration route, and any areas where people can be exposed to pollution above standards. How is the information in the database used? The database is used to help national governments evaluate existing and potential environmental health problems, analyze trends, and set priorities for cleanup. Will my site screening lead to a cleanup project at the site? One goal of the inventory is to help local governments identify sites that require immediate attention. There is never a guarantee that your site screening will lead to a cleanup project, but if the screening indicates there is a significant public health risk, it is a possibility. Investigators should explain the program goals to any curious locals, but should not promise any further action or create expectations among the local population that the site will be cleaned. How do I locate polluted sites to assess? There are many ways to identify sites. Here are some good sources:
• Ask the executing agency for a site list.
• Ask a local environmental organization or university environmental studies department.
• Ask the local government (starting with the pollution control agency or health agency). Specifically ask about industrial areas.
• Search newspaper records for articles about polluted sites.
• Search for reports from the government, World Health Organization, United Nations Environment Program, or other relevant organizations.
• Search for peer-reviewed journal articles about polluted sites.
What if a site does not currently affect people, but could in the near future? Some sites do not have immediate chemical exposures to humans but may pose a risk to people in the near future. For example, a rusting storage tank of ammonia is threatening to burst and poison a local population. While there are no test results that show an immediate pathway to a population, clearly this site is a risk to human health. In this case, list the affected population as the number of people at risk if the tank were to fail. List as much information related to the potential hazard as you can – describing the issue to others so they can visualize the problem, and your thinking on your screening. What language should I use when I enter information into the database?

33
You are free to enter information in your local language or English. If you enter your screening in your local language, we will translate it and paste English text next to your original text. We will not delete your text. What is the Blacksmith Index? The Blacksmith Index is a score from 0-10 that indicates the relative human health risk posed by a site (10 indicates the highest risk). The Pure Earth Index is automatically generated from data about pollutant types, pollutant concentrations, pathways, and populations at risk that investigators enter into the database.

34