tsp symposium 2009 4rd annual software engineering … · 4rd annual software engineering institute...
TRANSCRIPT

4rd Annual Software Engineering Institute Team Software Process Symposium
www.sei.cmu.edu/tsp/symposium
September 21-24, 2009 • Royal Sonesta Hotel, New Orleans, Louisiana
TSP SYMPOSIUM 2009ESTAblIShIng A ComPETITIvE AdvAnTAgE

The following authors granted special permission to reproduce the following documents:
TSP Secure © Noopur Davis, William R. Nichols, Philip L. Miller, and Robert C. Seacord
TSP SM -Agile Showdown: The Gunsmoke Clears © Alan Padula, Intuit
A Star is Made: Attaining Excellence through Deliberate Practice © William R. Nichols, Ph.D. and Marsha M. Pomeroy-Huff, Ed.D
Implementation of the TSP in Small and Medium Size Software Enterprises © Roberto Alonso Ramos Zapata
Updating the TSP Quality Plan Using the Monte Carlo Simulation© David R. Webb
The ideas and findings in this report should not be construed as an official DoD position. It is published in the interest of scientific and technical information exchange.
The ideas and findings in this publication should not be construed as an official Carnegie Mellon position. It is published in the interest of scientific and technical information exchange.
Copyright 2009 Carnegie Mellon University.
NO WARRANTYTHIS CARNEGIE MELLON UNIVERSITY AND SOFTWARE ENGINEERING INSTITUTE MATERIAL IS FURNISHED ON AN “AS-IS” BASIS. CARNEGIE MELLON UNIVERSITY MAKES NO WARRANTIES OF ANY KIND, EITHER EX-PRESSED OR IMPLIED, AS TO ANY MATTER INCLUDING, BUT NOT LIMITED TO, WARRANTY OF FITNESS FOR PUR-POSE OR MERCHANTABILITY, EXCLUSIVITY, OR RESULTS OBTAINED FROM USE OF THE MATERIAL. CARNEGIE MELLON UNIVERSITY DOES NOT MAKE ANY WARRANTY OF ANY KIND WITH RESPECT TO FREEDOM FROM PAT-ENT, TRADEMARK, OR COPYRIGHT INFRINGEMENT.
Use of any trademarks in this report is not intended in any way to infringe on the rights of the trademark holder.
This work was created in the performance of Federal Government Contract Number FA8721-05-C-0003 with Carnegie Mellon University for the operation of the Software Engineering Institute, a federally funded research and development center. The Government of the United States has a royalty-free government-purpose license to use, duplicate, or disclose the work, in whole or in part and in any manner, and to have or permit others to do so, for government purposes pursuant to the copyright license under the clause at 252.227-7013. Requests for permission to reproduce this document or pre-pare derivative works of this document should be addressed to the SEI Licensing Agent at [email protected].
Trademarks and Service MarksCarnegie Mellon Software Engineering Institute (stylized),Carnegie Mellon Software Engineering Institute (and de-sign), and the stylized hexagon are trademarks of Carnegie Mellon University. ® Capability Maturity Model, Carnegie Mellon, CMM, and CMMI are registered in the U.S. Patent and Trademark Office by Carnegie Mellon University.
SM CMM Integration, Personal Software Process, PSP, SCAMPI, SCAMPI Lead Appraiser, SEPG, Team Software Process, and TSP are service marks of Carnegie Mellon University. For information and guidelines regarding the proper referential use of Carnegie Mellon University service marks and trademarks, see Trademarks and Service Marks at www.sei.cmu.edu/about/legal-trademarks.html.
©2009 by Carnegie Mellon University
1.5.4 Tracking Project ProgressOnce the TSP Launch has been completed and the plans approved by management, the team uses these plans to guide their work. The team also checks progress against the plans during their weekly meetings. The Quality Manager, for example, reports on the current defect injection rates and yields for modules complete to date. He or she also provides feedback on the current Product Quality Index, Defect Removal Profile and so forth (Figure 1).
With the new Monte Carlo generated Quality Plan, the Quality Manager has additional information to present at the weekly meetings. For example, he or she could present how many defects have actually been found in inspection or test activities, versus those predicted by the model. Another new metric is an updated estimate of the Predicted Defects Remaining. Calculating remaining defects is a simple matter of using the estimates for defects injected and subtracting the estimates for defects removed. Once actual project quality data begins to come in, we can again use these models, but replace the estimated values with actual values and re-run the Monte Carlo Simulation. This provides a new prediction for defects remaining that can be tracked throughout the project duration.
It is important to point out that this new way of examining and predicting the quality of the product in no way supplants those currently being used by TSP projects. This is simply one more weapon to add to the quality arsenal.
1.6 SummaryThe TSP Quality Plan, currently produced during Meeting 5 of the TSP launch, is a very effective way of focusing the team on the tracking and resolution of defects early in the project life cycle. However, the current version of the TSP Quality Plan does not take into account variability. The application of the Monte Carlo Simulation to data already being collected by TSP teams, provides a more robust insight into the Quality processes TSP teams employ, and gives them further insight into what can be expected in terms of product and process quality. The TSP teams at Hill Air Force Base have recently begun using this technique and are still gathering data on its usefulness.
1.7 References/Bibliography(Endnotes)
1 Humphrey, Watts S., TSP – Leading a Development Team, 2006, p. 138
2 Humphrey, Watts S., TSP – Leading a Development Team, 2006, p. 87
3 Weisstein, Eric W. “Monte Carlo Method.” From MathWorld--A Wolfram Web Resource. http://mathworld.wolfram.com/MonteCarloMethod.html
4 Wittwer, J.W., “Monte Carlo Simulation Basics” From Vertex42.com, June 1, 2004, http://vertex42.com /ExcelArticles/mc/MonteCarloSimulation.html
David R. WebbDavid R. Webb is a Senior Technical Program Manager for the 520th Software Maintenance Squadron of the 309th Software Maintenance Group at Hill Air Force Base in Utah, a CMMI Level 5 software organization. David is a project management and process improvement specialist with 22 years of technical, program management, and process improvement experience on Air Force software. He is a SEI authorized instructor of the Personal Software Process, a Team Software Process launch coach (unobserved), and he has worked as an Air Force manager, SEPG member, systems software engineer, lead software engineer and test engineer. He is a frequent contributor to technical journals and symposiums. David holds a Bachelor’s Degree in Electrical and Computer Engineering from Brigham Young University.

1
TS
P S
YM
PO
SIU
M 2
009
| ES
Tab
lIS
hIn
g a
CO
MP
ET
ITIv
E a
dv
an
Tag
E
Team Software Process Symposium Proceedings September 21-24, 2009 • Royal Sonesta Hotel, New Orleans, Louisiana
Program Committee 2
Research Areas
TSP Secure 3Noopur Davis, William R. Nichols, Philip L. Miller, Robert C. Seacord
TSP SM -Agile Showdown: The Gunsmoke Clears 9Alan Padula, Intuit
A Star is Made: Attaining Excellence through Deliberate Practice 15William R. Nichols, Ph.D.Marsha M. Pomeroy-Huff, Ed.D
Implementation of the TSP in Small and Medium Size Software Enterprises 23 Roberto Alonso Ramos Zapata
Updating the TSP Quality Plan Using the Monte Carlo Simulation 27David R. Webb
Editor’s NoteThe experiences and ideas presented in these papers are those of the authors, and not necessarily of the SEI. Most individuals and teams customize the TSP and the PSP to best fit their own needs. The processes were designed to be flexible and support customization. As always, use judgment before following advice from others. Take special caution when modifying basic principles of the PSP and the TSP. Examples include the use of personal data for anything besides personal improvement and providing team status.

2
TS
P S
YM
PO
SIU
M 2
009
| ES
Tab
lIS
hIn
g a
CO
MP
ET
ITIv
E a
dv
an
Tag
E
Program Committee
Lana Cagle, NAVO
Anita Carleton, SEI
Tim Chick, SEI
Tom Hilburn, Embry Riddle University
Jodie Nesta, SEI
David Saint Amand, NAVAIR
Rafael Salazar, Tec de Monterrey
Rajan Seriampalayam
Karen Smiley, ABB
Kathy Smith, EDS
David Webb, Hill Air Force Base
3
TS
P S
EC
UR
E
Noopur DavisWilliam R. NicholsPhilip L. MillerRobert C. Seacord
The TSP Secure Initiative is a collaborative effort between the SEI Process program and CERT to extend the existing TSP process to develop secure software systems. Practically speaking, secure systems are systems that are free from known vulnerabilities. These vulnerabilities result from errors in requirements, design, and implementation. Securing existing systems, developed using ad hoc practices, is a non-trivial exercise; TSP Secure will, in the future, define processes for remediating and securing legacy software.
Software vulnerabilities that enable an attacker to control machines, networks and information systems of unsuspecting victims, are a significant and growing problem. Vulnerable software not only causes financial losses, but also puts individual, company, and national security at risk. Software companies devote enormous resources to patching released software, to address vulnerabilities discovered in their products. It is well documented that the cost of fixing defects discovered in the field is significantly higher than prevention or early removal. [Boehm 1981, NIST 2002]. In cases where these defects result in security breaches, the costs can be much higher as shown by these findings [Wilson 2006]:
• In a study of Department of Justice data published in August 2006, Phoenix Technologies and law enforcement agencies found that, in cases where stolen IDs and passwords were used, the average loss per incident was $1.5 million. Some attacks caused as much as $10 million in damages [Bosen 2006].
• According to the annual report by the Computer Security Institute and the FBI, the average loss per company due to security breaches in 2008 was just under $300,000. Twenty-seven percent of respondents said they had detected at least one targeted malware attack aimed exclusively at the respondent’s organization or at organizations within a small subset of the general business population [Richardson 2008].
• In a study conducted by Ponemon Institute and sponsored by PGP Corporation, companies lost an average of $6.65 million per breach per incident when customer data losses were incurred in 2008. The range of total cost among the
43 data breach incidents contained in this year’s study is a minimum of $613k to more than $32 million. The magnitude of the breach event ranged from 4,200 to 113,000 lost or stolen records [Ponemon 2009].
• In a study published in 2004, the Aberdeen Group found that the cost of Internet-based business disruptions is about $2 million per incident [Aberdeen Group 2004].
This situation can be remedied, because the vast majority of vulnerabilities exist because the software was developed with insufficient attention to known secure development practices.
CERT’s Secure Coding Initiative (SCI) leads a highly collaborative, community-based effort to develop secure coding standards for commonly used programming languages such as C, C++, and Java as well as tools that support adoption of those standards. One output of SCI is The CERT C Secure Coding Standard [Seacord 2008] that establishes 221 guidelines for secure coding in C.
SEI’s Team Software Process (TSP) provides disciplined development approach that hundreds of teams have used to produce software that is nearly defect-free [Davis 2003, Nichols 2009]. TSP includes comprehensive frameworks for planning, measurement and quality management. These frameworks support and enable implementation of software development processes and standards [Humphrey 1995]. TSP supports the use of processes and standards in multiple ways, by planning for quality, by tracking and managing the development plan, and by developing disciplined, self-directed teams committed to common goals, and management and mitigation of risks.
TSP Secure is a specialization of TSP with special attention on software security. Security emphasizes the behavior of a system in response to a determined adversary. Consequently, much of the focus is on preventing an attacker from performing functionality that is not inherently part of the system, for example, by running arbitrary code with the permissions of a vulnerable process.
The TSP Secure development process requires appropriate training in both TSP and secure development practices. TSP training includes training in the Personal Software Process (PSP) and the Team Software Process (TSP). PSP and TSP training are language independent. Appropriate training in secure development practices, in contrast, is highly dependent upon implementation languages, libraries,
TSP Secure

4
TS
P S
EC
UR
E
operating systems, and other details of the development and runtime environments. Training exists today for secure coding in C and C++.1 Secure coding training in other programming languages and environments can be acquired or developed.
TSP-Secure addresses security concerns in the TSP planning, process, quality, and measurement frameworks. The planning, tracking, process, and quality frameworks are being tailored to address secure software development. The measurement framework, not yet addressed, will be modified to determine the appropriate measures, especially predictive measures. Similarly, the requirements, design, implementation, and test processes are being updated. Finally, the TSP design templates may be augmented with secure design and architectural patterns [Dougherty 2009, Ryoo 2009], practices like Capture-Recapture will be assessed for usefulness for prediction of remaining vulnerabilities, and the defect filter model will be assessed for applicability to vulnerabilities.
Because the landscape for TSP-Secure is vast, the initial focus is on secure coding practices and incorporating static analysis tools in the development process.
Secure coding requires properly trained and disciplined developers. First, training is needed to understand and apply secure development techniques. Second, the techniques employed, for example selection of appropriate standards, personal reviews and peer inspections, are ineffective without proper training. Third, the sizable body of knowledge – note the 221 guidelines in the CERT C standard alone – cannot be fully mastered in a course; support tools, collaborative efforts, and on the job learning environments must be employed. Fourth, process discipline often breaks down under schedule pressure, developers must be trained to plan for the required security related activities and maintain the discipline under pressure.
1 http://www.sei.cmu.edu/products/courses/p63.html#description
Because compilers and other static analysis tools cannot properly diagnose all vulnerabilities in code, secure coding is not possible unless the software developer understands which software constructs are insecure, how coding errors may be exploited, and what strategies can be applied to mitigate the risk of exploitation. Testing, while important, is insufficient because a failure to account for every possible combination of inputs could result in an exploitable vulnerability. Consequently, it is critical that software developers have detailed, in-depth knowledge of the programming language and operating environment of the application.
Our tailored approach includes selection of a secure coding standard prior to launch meeting 1, during the initial requirements phase of the project. The standard that is selected must be appropriate for the language and domain of the application under development. CERT Secure Coding Initiative2 has developed The CERT C Secure Coding Standard and it is in the process of developing a secure coding standard for C++ [CERT 2009a]. CERT and Sun Microsystems are collaborating to develop The CERT Sun Microsystems Secure Coding Standard for Java [CERT 2009b]. Other development languages and environments can be addressed using the same research approach.
Figure 1 illustrates a notional TSP Secure process for an implementation effort based upon the C programming language [ISO/IEC 9899:1999]. This process augments the normal TSP effort. It defines the additional role of a Security Manager. It has the additional inputs of one or more secure coding standards and appropriate static analysis tools. It introduces a launch process that determines the items that will appear on both personal review checklists and team inspection checklists. Finally it introduces new testing methods such as fuzz testing.
2 http://www.cert.org/secure-coding/
Figure 1 TSP-Secure Process

5
TS
P S
EC
UR
E
Even before the TSP launch a planning stage must be held to determine if the project should employ TSP-Secure.
Meetings 0.1, 0.2, and 0.3 can be held before the launch. Care must be taken so that already heavily burdened Launch Meetings are not consumed by lengthly tasks. As in a normal TSP process, developers use a checklist-based review to ensure that source code being developed has low defect density. As noted above the number of rules and guidelines is too large for a simple checklist approach therefore tools automate the process where that makes sense. Secure Launch Scripts identify the process for winnowing down the guidelines to that subset which will appear on review and inspection checklists. The source code is compiled at high warning levels and is subjected to other forms of source code analysis and testing. Any defect patterns detected in the code during compilation and analysis are added to the review checklist, because the developer failed to successfully detect these errors.
As noted, static analysis tools are frequently incapable of verifying that source code is free from various kinds of defects, which are often difficult to automatically diagnose. Similarly, code coverage, input combinations, environment and other factors limit the effectiveness of testing. Consequently, these techniques alone are inadequate to ensure that delivered software is free from defects and vulnerabilities. However, detection of these errors in a particular module serves as an indicator for the presence of other undetected defects. The TSP quality plan
projects the number of defects most likely to be injected during development and removed during review, compile, inspection, and test. Closely monitoring the planned and actual number of defects removed in each phase gives the development team insight into the effectiveness of the defect removal and the effectiveness of the development practices used. For example, a properly TSP-developed software component should have few defects found by the compiler. A component that generates an unexpectedly high number of compiler warnings and analysis errors should be treated with extra care, because this indicates that the component was not developed with enough attention to quality. Consequently, these components are candidates for further scrutiny by manual inspection or other advanced analysis techniques that maybe too costly to apply in all cases. TSP-Secure does not deviate from the fundamental tenants of the philosophy of TSP: i. right the first time and ii. quality cannot be tested into defective software. Nevertheless, TSP-Secure leverages software tools by integrating them into a security toolkit.
TSP Secure introduces additional processes to ensure that source code is developed in conformance with a secure coding standard. These processes include checklist based personal reviews and peer inspections of design and code. The reviews also require secure design and implementation standards. The TSP Security Manager, who may also be the Quality Manager in small software projects, evaluates the overall scope and objectives of the project and identifies a domain and application specific subset of secure coding guidelines that can be seeded as part of the initial checklist. Although the mechanism used for seeding the checklist can
The TSP Secure Launch Process (new and modified launch meetings are shaded)

6
TS
P S
EC
UR
E
vary we have captured the approach below in modified forms and scripts.
1. Identify each programming language that will be used during development and identify the appropriate secure coding standards.
2. Identify the source code analysis that will be used during software assurance, and determine which secure coding guidelines can be enforced through the use of these tools.
3. For those guidelines that cannot be adequately enforced, identify those guidelines from which the project can safely deviate; and document your rationale.
4. From the remaining guidelines, prioritize according to the likelihood of these coding errors resulting in vulnerability (if undetected) and the severity of the consequences.
5. Populate the checklist from the prioritized list.
The integrated TSP metric, planning and quality framework enables rational economic tradeoffs when evaluating costs and risks. Because of schedule and/or resource constraints, it may not be possible to address all coding guidelines. Project specific tradeoffs, for example, prioritizing of guidelines, purchasing source code analysis tools additional training may need to be considered by the Security Manager and the development team. TSP planning data will be invaluable when committing to realistic development plans to achieve the project goals. By committing to achievable plans, developers will have adequate time to apply to the secure development activities
TSP Developers are trained to frequently revise their review and inspection checklists based on data they have collected on defect frequency and cost. Checklist items are removed from the checklist when they become infrequent, and more frequently or costly defects types are added. In this way, TSP reflects and encourages the developer learning process. That is, over time, through experience and feedback from the review and post mortem evaluation processes, developers learn to avoid types of defects. By evaluating defect escapes, developers also identify the root causes of new types of defects and are therefore, capable of augmenting and informing the continued development of the CERT secure coding guidelines. Attention to insecure coding practices that result in vulnerabilities may impose fresh thinking regarding types of defects (which can lead to a modified defect taxonomy), how to record them, when and how best to remove them, and so forth.
The CERT Secure Coding Initiative provides a number of products and services to assist in the application of TSP-Secure. Most of the guidelines in the CERT Secure Coding Standards include a section on “Automated Detection” which indicates which source code analysis tools and compilers are capable of diagnosing violations of that particular guideline. This can be useful in determining which tools can be used, individually or in combination, to provide broad coverage of the standard, and which guidelines are strong candidates for inclusion on TSP Secure checklists. Some commercial static analysis can have integrated compliance checking for CERT secure coding guidelines. Liverpool Data Research Associates Ltd. (LDRA), for example, has integrated support for the CERT C Secure Coding Standard into its TBsecure®3 product. The CERT Secure Coding Initiative has also worked with Lawrence Livermore National Laboratory to extend Compass/ROSE4 to detect violations of CERT secure coding guidelines.5
Testing for security is, of course, a part of system test. Applications can be certified with respect to one or more of the CERT Secure Coding Standards through the CERT SCALe (Source Code Analysis Lab). Therefore system test includes CERT SCALe certification. CERT SCALe certification provides an independent assessment of whether secure coding practices have been properly applied during the software development life cycle through an examination of software artifacts. This certification is necessarily limited by existing tools and techniques and does not guarantee that the software is secure. It does, however, guarantee that best practices have been applied to discover violations of secure coding rules, and that these security flaws have been eliminated.
SummarySecure software development requires a disciplined engineering process. The Team Software Process for Secure Software Development (TSP-Secure) helps developers build secure software in several ways. First, because secure software is not built by accident, TSP-Secure assists in planning for security. Second, because schedule pressures and people issues get in the way of implementing best practices, TSP-Secure helps to build self-directed development teams and then put these teams in charge of their own work. Third, because security and quality are closely related, TSP-Secure helps manage quality throughout the product development life cycle [Davis 2006].
3 http://www.ldra.com/tbsecure.asp 4 http://www.ldra.com/tbsecure.asp 5 http://www.ldra.com/tbsecure.asp

7
TS
P S
EC
UR
E
References[Aberdeen 2004] Aberdeen Group. Internet Business Disruptions Benchmark Report. http://www.aberdeen.com/summary/report/benchmark/ibd.asp
[Boehm 1981], Barry Boehm, Software Engineering Economics, Prentice-Hall, 1981
[Bosen 2006], Bill Bosen, Network Attacks: Analysis of Department of Justice Prosecutions 1999 – 2006,
A study by Trusted Strategies, L.L.C. commissioned by Phoenix Technologies, Ltd., Trusted Strategies, L.L.C., 2_9 Main Street Suite E, Pleasanton, CA 94566, (925) 229-9919, www.trustedstrategies.com http://74.125.47.132/search?q=cache:6v14GceB5z8J:www.govexec.com/pdfs/cyberdoc_8-22d+Department+of+Justice+data+published+in+August+2006,+Phoenix+Technologies&cd=1&hl=en&ct=clnk&gl=us&client=firefox-a
[CERT 2009a] The CERT C++ Programming Language Secure Coding Standard. Pittsburgh, PA: Software Engineering Institute, CERT, 2009. https://www.securecoding.cert.org/confluence/x/fQI
[CERT 2009b] The CERT Sun Microsystems Secure Coding Standard for Java. Pittsburgh, PA: Software Engineering Institute, CERT, 2009. https://www.securecoding.cert.org/confluence/x/Ux
[Davis 2006] Noopur Davis, Secure Software Development Life Cycle Processes, May 2006. https://buildsecurityin.us-cert.gov/daisy/bsi/articles/knowledge/sdlc/326-BSI.html
[Davis 2003] Davis, Noopur and Mullaney, Julia, The Team Software Process (TSP) in Practice: A Summary of Recent Results, CMU/SEI-2003-TR-014, September 2003
[Dougherty 2009] Chad Dougherty. Kirk Sayre. Robert C. Seacord. David Svoboda. Kazuya Togashi. Secure Design Patterns. March 2009. TECHNICAL REPORT. CMU/SEI-2009-TR-010.
[Humphrey 1995] Humphrey, Watts S., A Discipline for Software Engineering Addison-Wesley, Reading, MA, 1995, 0-201-54610-8,
[ISO/IEC 9899:1999] ISO/IEC. Programming Languages---C, 2nd ed (ISO/IEC 9899:1999). Geneva, Switzerland: International Organization for Standardization, 1999.
[Nichols 2009] William Nichols, Salazar, Rafael, Deploying TSP on a National Scale: An Experience Report from Pilot Projects in Mexico, CMU/SEI-2009-TR-011 April 2009.
[NIST 2002] National Institute of Standards & Technology, US Dept of Commerce, The Economic Impacts of Inadequate Infrastructure for Software Testing, May 2002
[Ponemon 2009] Ponemon Institute. Fourth Annual US Cost of Data Breach Study: Benchmark Study of Companies, January 2009. http://www.ponemon.org/local/upload/fckjail/generalcontent/18/file/2008-2009%20US%20Cost%20of%20Data%20Breach%20Report%20Final.pdf
[Richardson 2008] Robert Richardson. 2008 CSI Computer Crime & Security Survey. http://www.gocsi.com/
[Ryoo 2009] J. Ryoo, P. Laplante, R. Kazman, “In Search of Architectural Patterns for Software Security”, IEEE Computer, June 2009.
[Seacord 2008] Seacord, Robert C. The CERT C Secure Coding Standard. Boston: Addison-Wesley, 2008.
[Wilson 2006] Tim Wilson. How Much Does a Hack Cost? DarkReading. Aug 16, 2006 http://www.darkreading.com/security/vulnerabilities/showArticle.jhtml?articleID=208803989

8
TS
P S
EC
UR
E
Biographies
Noopur [email protected]
William R. [email protected]
Philip L. [email protected]
Dr. Miller joined the Software Engineering Institute in 2005. He heads an academic initiative, is responsible for bringing Internet based blended learning to the SEI, was the prime mover in establishing the Mexican TSP Initiative, has developed fresh approaches to selected courses in the CMMI sequence, and is the SEI lead in the SEI/Carnegie Mellon Master of Science in Software Engineering – Software Engineering Management (MSIT-SEM).
Dr. Miller founded iCarnegie Incorporated in July 1998, along with Allan Fisher. iCarnegie is majority owned by Carnegie Mellon University. Its mission is to leverage Internet mediated education through partnering institutions to bring world-class software development curricula to students who would otherwise have no access.
Dr. Miller was on the Computer Science faculty at Carnegie Mellon University from 1979 until the creation of iCarnegie. At CMU Dr. Miller built and directed the Introductory Programming Group throughout his tenure. He was principal investigator on numerous research awards that were funded by the National Science Foundation, Apple Computer, and DARPA. The research focus was the application of advanced compiler technology to teaching science and computer science. He was founder and first director of Carnegie Mellon’s Center for Art and Technology, a research oriented department that was administered by both the College of Fine Arts and the School of Computer Science.
Dr. Miller is a frequent keynote speaker, led the creation of the College Board’s Advanced Placement Course, and served on the SAT Mathematics Oversight Committee.
Robert [email protected]
Robert C. Seacord leads the Secure Coding Initiative at CERT, located in Carnegie Mellon’s Software Engineering Institute (SEI) in Pittsburgh, PA. CERT, among other security related activities, regularly analyzes software vulnerability reports and assesses the risk to the Internet and other critical infrastructure. Robert is an adjunct professor in the Carnegie Mellon University School of Computer Science and in the Information Networking Institute and part-time Faculty at the University of Pittsburgh. An eclectic technologist, Robert is author of four books, The CERT C Secure Coding Standard (Addison-Wesley, 2009), Secure Coding in C and C++ (Addison-Wesley, 2005), Building Systems from Commercial Components (Addison-Wesley, 2002) and Modernizing Legacy Systems (Addison-Wesley, 2003) as well as more than 50 papers on software security, component-based software engineering, Web-based system design, legacy-system modernization, component repositories and search engines, and user interface design and development. Robert started programming professionally for IBM in 1982, working in communications and operating system software, processor development, and software engineering. Robert also has worked at the X Consortium, where he developed and maintained code for the Common Desktop Environment and the X Window System. He represents CMU at PL22.11 (ANSI “C”) and is a technical expert for the JTC1/SC22/WG14 international standardization working group for the C programming language.

9
TS
PS
M -
AG
ILE
SH
OW
DO
WN
: T
HE
GU
NS
MO
KE
CLE
AR
S
Alan PadulaIntuit [email protected]
AbstractThe results are in! Two TSP-Agile Blend (TAB) pilot projects are completed. Intuit’s TAB process introduced at last year’s TSP symposium (“TSP-Agile Showdown”) leverages the best of both the TSP 1and agile worlds. TSP has enabled Intuit to create high-quality products in a predictable and repeatable fashion. We also wanted to increase our competitive advantage in a fast time-to-market web world with rapidly changing and vague customer or technology requirements.
The learnings from the TAB projects helped evolve its definition including:
• The expanded version of “Iteration 0” preceding the release launch and first iteration
• A streamlined process with a repeatable set of meetings and workshops to launch new teams
• The type of TAB metrics collected
This paper describes the benefits and challenges from actual TAB projects and solutions to manage them. It also identifies TSP or agile viewpoints that exacerbate those challenges including:
• Early visibility that full scope is not achievable
• Initial Release Plan uncertainty
• Individual task hours valued over team completed user stories
• Resistance to force-ranking of the backlog
• Light user stories over detailed requirements
• Concurrent, continuous testing
• Perception of too many meetings
First, we examine the definition of the TAB process and measures collected. Then we look at adoption challenges and mitigation strategies along with the benefits experienced in the gritty world of two real TAB projects.
SMTSP – Team Software Process and TSP are service marks of Carnegie Mellon University.
1 Introduction – Why TSP-Agile Blend (Tab)?
At Small Business Division (SBD) of Intuit, teams have used TSP with great success. TSP projects in many ways set the standard for schedule predictability, project budget management, and high quality. Meanwhile, projects using an agile methodology did an excellent job of managing changing customer and technical requirements while enabling a fast-time-to-market paradigm for web-based products. The TSP-Agile Blend (TAB) attempts to marry the best attributes of both.
2 TAB Model TAB is Intuit’s version of agile development inside the TSP framework. The TSP framework easily accommodates different development methodologies. As such, there are very few real conflicts between TSP and TAB. TSP is indifferent to TAB specifications such as light requirements, short iterations, incremental delivery, and daily standup meetings. TAB commonalities include jelled teams, data-driven planning, technical excellence, retrospectives, and task hour tracking. TAB differences include the measures collected, the emphasis on defect analysis, and estimation methods. The commonalities and differences that do exist were presented in the “TSP-Agile Showdown” at last year’s symposium and will not be repeated in this paper.
TAB consists of Iteration 0 activities with the Release Planning Launch and a series of Recurring Iterations.
Iteration 0 activities consist of:
• Architectural Design Spike,
• User-Centered Design Spike,
• User Story Design Spike,
• Infrastructure Planning Prep, and
• Release Planning Launch
The Architectural Design Spike defines a high-level architecture or system design and may encompass prototyping.
The User-Centered Design Spike defines Experience Design (XD) specialist’s work. They conduct brief research that includes high-level process flows, overall conceptual models, personas, scenarios, etc.
TSPSM -Agile Showdown: The Gunsmoke Clears

10
TS
PS
M -
AG
ILE
SH
OW
DO
WN
: T
HE
GU
NS
MO
KE
CLE
AR
S
The User Story Design Spike refines user stories to make them “good” and of the right granularity. It includes working sessions to estimate user stories.
Infrastructure Planning Prep sets up the development, build, test, and deployment environments and strategies. It also drives quality, process, tool, and other planning activities.
The one-day Release Planning Launch defines a longer-term release plan and the work for Iteration 1.
The Iteration 0 pre-planning phase is time-bounded from 0-6 weeks. Projects with significant unknowns with the technology, customer needs, or domain space fall in the upper spectrum of that range. Well-understood projects with simple product enhancements may require little pre-planning time.
Recurring iterations follow Iteration 0 and consist of planning, developing, tracking, and releasing software. This is essentially a Scrum process with some nuances described in 2.3 Recurring Iterations.
The recommended recurring iteration length for a new team is 3 – 4 weeks. The team ultimately decides. Most TAB projects are 4 weeks. The desire to be exactly in-synch with regular “release trains” drives a 6-week iteration length option.
2.1 MEETINGS OVERVIEWA series of TAB meetings support Iteration 0 and the Recurring Iterations. Iteration 0 consists of 1-on-1 and team meetings. Recurring Iterations consist of just team meetings. This repeating, chronological set of meetings to prepare, plan, and launch recurring iterations define the process mechanics of TAB. Everyone readily understands “meetings”. These meetings or “constructive collaborations” prepare for or actually produce working software of value to the customer – a key agile tenet. TSP advocates used to more formality in meetings appreciate a familiar, chronological model that is easy to understand and apply. “What” needs to happen and “when” is clear.
The Iteration 0 “1-on-1” meetings align expectations and define responsibilities with various functional managers. They include:
• Initiative (or Project) Manager• Product Development Director or Sponsor• Product Marketing Manager
• QA Manager
• ScrumMaster
• War Room Creation
The Iteration 0 Team meetings address planning and development. They include:
• Overview and Process Selection Kickoff
• Process Customization
• Quality and Done Definition
• User Story Refinement
• User Story Point Estimation
• Release Planning Launch
The Quality and Done Definition measures are described in section 3 TAB Metrics. The Release Planning Launch is described in Error! Reference source not found..
The Recurring Iteration Team meetings include:
• Iteration Planning
• Daily Standups
• Mid-Iteration Review
• Next Iteration Prep
• Demo and Review
• Retrospective
The Mid-Iteration Review and Next Iteration Prep meetings are described in 2.3 Recurring Iterations.
2.2 TSP AND TAB RELEASE PLANNING LAUNCH
The Release Planning Launch finalizes the larger release plan and identifies the Iteration 1 stories with their work breakdown structure (WBS). The WBS identifies the story and task owners, and task hour estimates. Effort planning uses 3 hours of project-related task work per day based on past TSP project data. Individually owned tasks are no more than six hours or two calendar days of direct project work.
The one-day TAB event is similar to a 9-meeting TSP launch but with some differences depending on the point of view. TAB requires slightly less architecture and high-level design work than the typical Intuit TSP project. The blend means selecting from only 3 roles. Requirements are in the form of user stories. The release plan is estimated in story points. The quality plan is short and includes a definition of “done”. The work breakdown structure is created strictly for the first iteration. There is a greatly reduced emphasis on defect analysis and prediction. These are all significant differences from the traditional implementation of TSP inside of Intuit.

11
TS
PS
M -
AG
ILE
SH
OW
DO
WN
: T
HE
GU
NS
MO
KE
CLE
AR
S
The TAB Release and Iteration 1 Planning agenda does not follow a standard TSP one nor does it produce deliverables in a TSP template format. However, it does achieve many of the same outcomes as a TSP Launch but without many of the detailed deliverables. The product and business goals are agreed to, a small set of roles and responsibilities are defined, the development process and strategy is laid out, estimates are solidified, a release plan is created, a WBS is committed to for the 1st iteration only, quality processes and goals are defined, risks are identified, and a management summary is presented.
2.3 RECURRING ITERATIONSRecurring iterations essentially follow a Scrum process. Simplistically, this means selecting stories to be done from the product backlog, planning the work for the iteration, doing the work, reviewing daily progress, demoing the code, and conducting a retrospective. There is a large volume of work published on Scrum and we are not trying to recreate it here. TAB has a defined set of six meetings to guide us through the process.
They include the Iteration Planning meeting, Daily Standups, Iteration Demo and Review, and Retrospective meetings, which are standard Scrum. The other two meetings: Mid-Iteration Review and Next Iteration Prep are different from pure Scrum. The Mid-Iteration Review meeting checks whether the project is on track both feature and quality-wise to meet the goals for the iteration. It is patterned after the TSP weekly meetings. Often resources are re-allocated or stories split in order to meet the goals of the iteration.
The Next Iteration Prep meeting is short. The team plans basic process housekeeping to make the upcoming Iteration Planning meeting successful and “doable” inside of a day. This type of pre-planning work is easy to get lost in the day-to-day grind to meet the current iteration’s goals. The meeting refines the user stories anticipated for next iteration into “good” ones and conducts any necessary high-level technical analysis. XD checks to make sure they have the support they need to be ready for iteration planning day and beyond. The team analyzes unestimated stories and assigns them story points. Epics from the bottom of the product backlog gravitate towards the top. The team decomposes those epics and estimates the resulting new stories. The Product Manager makes sure all the stories in the product backlog are in force-ranked order and that the release plan is up to date.
3 TAB MetricsThe Quality and Done Definition meeting identifies the metrics to be collected. TAB overlaps with TSP and agile types of measures. The four major sets of TAB measures are for:
• Schedule
• Scope
• Productivity
• Quality
There is also another set of “quality” criteria, measures, and charts not discussed in this paper that typically are associated with agile projects in defining “Done” for a story or iteration. They are not discussed as it is well-covered in the literature. This paper’s focus is on the overlap of the TSP and agile processes.
3.1 SCHEDULE METRICSFor Schedule, we track:
• Iteration Burndown i.e. task hours remaining to complete an iteration over time
• Release Burndown i.e. story points remaining to complete the release over time
• Individual Task Hours – Actual, Planned
• Story Points – Actual, Planned
• Earned Value and TAB’s Release Burndown are similar yet markedly different. Both of them indicate remaining work. The big difference is a Release Burndown only reflects work resulting in a completed story.
3.2 SCOPE METRICSFor Scope changes, we track
• Story Points
3.3 PRODUCTIVITy METRICSFor Productivity, we track
• Velocity i.e. Story Points per Iteration which is by far, the most commonly used TAB measure; however, using LOC/Hour is acceptable

12
TS
PS
M -
AG
ILE
SH
OW
DO
WN
: T
HE
GU
NS
MO
KE
CLE
AR
S
3.4 QUALITy METRICSFor Quality, there are three primary buckets: Reviews, Test, and Defects. Generally, agile does not specify any measures but TAB does.
For Reviews, we track some common TSP review measures including:
• Review Time and Number of Defects found
• Design to Design Review time
• Code to Code Review time
• Test to Test Review time
• Design to Code time
For Test, we track
• Test Code Coverage % (when practical)
• Feature/Story Coverage %
• Test Execution Results – Actual, Passed
• Test Automation Result %
For Defects, we track
• Number of Defects/KLOC
• Number of Incoming Defects Open, Closed
• Number Open by Impact and Severity
• Number of Post Release Defects
For reviews, TAB projects most commonly used a collaborative tool to independently review and record defects of other’s code at a time of their choosing. Team members also employed pair programming and collaborative white board design as review methods.
In practice, the Test and Defect buckets have more metrics than listed here. Intuit monitors quality of its products with these and many other corporate quality measures. Agilists may balk at this and say the customer is the only one that matters and if they are satisfied with the quality then we are done. However, TAB requires two customers be satisfied: the end user and the business sponsors.
Defect insertion phase and defect removal phase are two TSP type measures not required. However, TAB teams are encouraged to collect any additional metrics that they feel will improve their productivity and quality of their code.
How can TAB projects afford fewer measures? They incur a low risk of continued investment in the development of poor quality code. The team improves their quality practices when they gain visibility to a rising defect count. TAB’s frequent iterations and releases provide that post-production defect visibility right away.
4 Challenges and Benefits of TAB Adoption
Some of the challenges along with benefits experienced in the adoption of TAB and “off-the-shelf ” agile include:
4.1 EARLy VISIBILITy THAT FULL SCOPE IS NOT
aChIEvablEDesired features not likely to be in a release become fairly clear after 2-3 iterations depending on the project size and complexity. It is disappointing to hear the “bad news” of what will not make it. It is not unusual for other projects to discover that news during the later phases of development.
Mitigation: Before the project starts, make it clear that features that will not make the release will become transparent right up front. This will help defuse any accusations of a faulty agile-like TAB process. Emphasize the benefit of knowing this earlier when something can actually be done about it.
4.2 INITIAL RELEASE PLAN UNCERTAINTyNew teams without a known velocity find it difficult to plan what will be in the final release. They can only guess now many story points per iteration they will do and hence, how many for the release. This emphasizes the importance of a force-rank order product backlog. The team completes highest business value features first.
Mitigation: Advise management that the team can only make a complete release plan commitment with confidence after it has established a velocity. Describe a force-rank order backlog with the highest business value items at the top. Explain that the team will commit to lower priority items when a velocity is set after 2-3 iterations. Suggest using shorter iteration lengths to derive a velocity faster.
4.3 INDIVIDUAL TASK HOURS VALUED OVER TEAM-
COMPLETED USER STORIESInitially, some team members focused on logging individual task hours over working on “someone else’s” assigned task that would result in a completed story. TAB focuses on story completion. Completed stories are the customer’s smallest unit of value and the way TAB shows project progress.
Mitigation: Sell the value of completing stories over logging individual task hours. Reinforce the value of teaming which may be the single most important factor to higher productivity. Celebrate completed stories as they occur in the early going.

13
TS
PS
M -
AG
ILE
SH
OW
DO
WN
: T
HE
GU
NS
MO
KE
CLE
AR
S
4.4 RESISTANCE TO FORCE-RANK BACKLOGTAB requires the product owner to force-rank order the product backlog. This is often hard to do. A product offering release inevitably requires a critical minimum set of stories to provide value to the customer. Product owners sometimes struggle unpacking that set and then ranking them as discrete stories.
Mitigation: Hold a meeting with the product owner before the project starts. Explain their role, responsibilities, and deliverables. Discuss the importance of a force-ranked product backlog in tracking project progress, managing scope, and ensuring delivery of the highest value stories first. Help them break a feature into small stories. Prioritize them into lower and higher value items. Confirm their commitment.
4.5 LIGHT USER STORIES OVER DETAILED
REQUIREMENTSWorking with user stories instead of detailed requirements can be a serious issue that cuts across functional lines.
Mitigation: Align the team on a mindset of collaboration and continual cross-functional and customer interaction to flesh out details. This is fundamental for light user stories to succeed. Constant collaboration with the customer or their proxy dramatically increases the number of requirements that actually meet the customer’s needs. It may be easier to operate from a functional silo, but is not as productive for the customer. Suggest use cases as a first “task” in developing especially risky, complex user stories or as a prelude to iteration planning preparation.
4.6 MAKING STORIES FIT IN AN ITERATIONTAB manages projects on a basis of story completion. Creating small stories that can be completed in a single iteration can be difficult.
Mitigation: First, it is critical to convince the team that “it is possible” to split stories into small ones that fit in an iteration. Instruct the team on several methods to split stories. Occasionally, splitting a story into a part A and B to be completed in different iterations is all right. However, emphasize part A still be “demo-able” even if standalone it is not of immediate customer value. Explain how containing stories to an iteration facilitates iteration and release planning.
4.7 CONCURRENT, CONTINUOUS TESTINGTAB projects rely on a continuous, collaborative effort between developers and testers. Old-style, thinking of “throw it over the fence when done coding” is not allowed.
Mitigation: Align testers and developers on the value of working collaboratively. Advise them to create tests before or at least concurrently with the development of the user story. Testing this way helps detect defects early when they are easier to find and fix. Check that stories are continuously being “done” including their testing and not just at the end of the iteration. This provides a smooth workload balance for testers.
4.8 PERCEPTION OF TOO MANy MEETINGSSome TAB team members have reported feeling they spend more time in meetings than on previous non-TAB projects and are wasting time.
Mitigation: Differentiate TAB meetings from “status” or reiterating “review” meetings. Most TAB meetings are very small. They are often about understanding a story better so we build the right thing. They are also frequently about identifying the tasks and how to get them done over the next few days. This is project development time spent precisely how it should be. Ask team members to reframe negative connotations of traditional meetings with that of “constructive collaboration”. Point out requirements development, design, coding, and testing all happen in one iteration instead of separate phases of perhaps months. This means the work is fresh in everyone’s mind, requires less documentation, and is closer to what the user wants at the actual time of coding. Finally, a huge plus is user stories that do not make the final release do not have time wasted on developing requirements and creating designs.
5 The TAB ProjectsThe two Intuit TAB projects referred to in this paper had about 10 team members each. Development time was planned to be about 5-6 months. One project was stopped after 3 months due to a change in business direction. The other project has successfully completed through functional test complete. System test will not be complete until after the final submittal date of this paper so final quality data will not be available here.

14
TS
PS
M -
AG
ILE
SH
OW
DO
WN
: T
HE
GU
NS
MO
KE
CLE
AR
S
6 ConclusionTAB was introduced at last year’s symposium and is now in use at SBD in Intuit. It is a blend of TSP and agile processes. The “heart” of TAB is Iteration 0 pre-planning work, the Release Launch, and the process for execution in the succeeding Recurring Iterations.
Iteration 0 consists of an Architectural Design Spike, a User-Centered Design Spike, a User Story Spike, Infrastructure/Planning Prep, and the TAB Release Launch that leverages that work.
The TAB Release Launch includes an overall release plan, Iteration 1 work breakdown structure, and many other elements that are similar to that of a TSP Launch. TAB differences from TSP include the measures collected, the emphasis on defect analysis, and estimation methods.
Recurring Iterations consist of an Iteration Planning meeting, Daily Standups, Iteration Demo and Review, Retrospective, Mid-Iteration Review, and Next Iteration Prep meeting. The latter two meetings are somewhat different from pure Scrum.
In executing these iterations, TAB collects measures in four buckets: Schedule, Scope, Productivity, and Quality. There are fewer measures collected than in a typical TSP project at Intuit. Some TAB measures are the same as those used in previous Intuit TSP projects while others like Iteration Burndown, Story Points, and Velocity are more agile-like.
TAB projects benefit from blending TSP practices that produce predictable schedules and high quality products with agile mindsets and practices that provide great flexibility to adapt to changing or unknown customer and technology requirements.
Alan PadulaSenior Software Engineering Process ManagerIntuit Alan Padula is a Senior Software Engineering Process Manager at Intuit where he is currently a TSP and Agile Coach. He defined the TSP-Agile Blend (TAB) and Agile Done Right (ADR) processes used at Small Business Division (SBD). He has been at Intuit for 4 years.
Before joining Intuit, he was a Senior Technology & Business Process Consultant in Product Generation Consulting (PGC) at Hewlett-Packard (HP). The last 10 years of his 28-year HP career was spent in the R&D Labs consulting on software (SW) technology and process improvement in a variety of areas. Some of the areas he directly consulted with clients include:
Engineering Management: SW Lifecycles, Core Competency Planning, SW Management Training, Partnering & Strategic Alliances, Visioning, Evolutionary SW Development, & Change Leadership
General Software Engineering: Requirements Management, Reverse Engineering, Maintainability Index, SW Maintenance Process, SW Configuration Management, SW Architecture, and Fusion
Software Quality & Testing: Quality Assessments, SEI CMM Assessments, Improvement Planning & Execution, Quality & Test Planning, Risk Management, Test Outsourcing, Root Cause/Failure Analysis, SW Testing Fundamentals, Metrics, Software Inspections, & Test Strategies
The first 15 years of his HP career was spent in the R&D Labs of various Product Generation Divisions in various roles as a SW Project Manager, Program Manager, Project lead, and Engineer. Products developed include HP SRC (revision control system), HP TOOLSET (Development Environment), HP BROWSE, HP SEARCH, & RAPID/3000 (a fourth-generation programming language development system).
Padula has written technical papers & presented at various technical conferences in Kyoto, Montreal, Brussels, Boston, Nice, Capri, La Jolla, Phoenix, San Diego, Lawrence Livermore Labs, and San Francisco.
Padula holds a MS in Computer Science, a BS in Physics, & a BS in Astronomy from Louisiana State University.

15
A S
TAR
IS M
AD
E:
ATT
AIN
ING
Ex
CE
LLE
NC
E T
HR
OU
GH
DE
LIB
ER
AT
E P
RA
CT
ICE
William R. Nichols, Ph.D.Marsha M. Pomeroy-Huff, Ed.DSoftware Engineering Institute, Carnegie Mellon University, Pittsburgh, Pennsylvania 15213
Introduction Since the dawn of recorded history, people have tried to explain why some individuals attain greatness within a particular domain: why do some artists or musicians or athletes or scholars perform better than others? Socrates and Plato ascribed the possession of superior knowledge or skill to a gift of natural ability, bestowed by the gods on a fortunate few [Amirault 2006]. In medieval and renaissance times, people attributed excellence to the possession of a “divine spark,” giving rise to the term “spark of genius.” Even now, most people subscribe to the notion that individuals such as Albert Einstein, Thomas Edison, Tiger Woods, or Yo-Yo Ma became star performers in their fields due to inborn abilities that “far exceed normal comprehension, …[so that they] are best approached with reverential awe” [Brooks 2009]. However, educational and psychological studies – including work done by Benjamin Bloom and K. Anders Ericsson – show that genius very likely has a much more mundane source. The key factor separating those who excel in their domains from those who merely perform well is not a high I.Q., good genes, or even talent; it’s good, old-fashioned hard work, with a twist.
Thomas Edison said, “Genius is one percent inspiration, ninety-nine percent perspiration” [Rosanoff 1932]. However, “perspiration” – or the aforementioned good, old-fashioned hard work – is in itself insufficient to achieve excellence; the work must be sustained over a long period of time and focused specifically on improving not just a specific skill (or set of skills), but also on honing every tiny component making up those skills. Anders Ericsson calls this type of concentrated effort deliberate practice [Ericsson 1993].
In the software engineering domain, the Personal Software ProcessSM (PSPSM) and the Team Software ProcessSM (TSPSM) learning tools can be understood as examples of deliberate practice in operation. The PSP is a structured process for software development that enables individual software engineers to analyze and improve their performance by using disciplined methods [Humphrey 1995]. The TSP is an operational process methodology that enables PSP-
trained individuals to collaborate effectively as members of software-intensive development teams [Humphrey 2000]. The deliberate practice model explains how PSP and TSP are effective methods for achieving performance improvement at both personal and team levels. PSP instructors and TSP coaches need to understand how and why deliberate practice works, so that when they are teaching students or coaching development teams, they can focus on assuring that most the important elements of deliberate practice are satisfactorily achieved and that the proper environment is maintained. Moreover, a theoretical basis that supports and helps to explain the empirical results attained from using these methods, both in the classroom and on the job, can inspire confidence that the improvements achieved from implementing PSP and TSP can be consistently replicated on a variety of projects and in a variety of development environments.
Automaticity and Deliberate PracticeAccording to the information processing theory of learning [Newell 1958], people learn from sensory input received from their surrounding environment. Information enters the short-term memory and undergoes processing (“encoding”), then is moved to long-term memory for storage and later retrieval in carrying out tasks. The ability to learn some skills, such as initial language acquisition, appears to be hardwired into the human brain, and begins without any conscious effort on the learner’s part [Rosenberg 2007]. However, learning other information requires the learner to pay active attention to the stimulus in order for it to be processed in short-term memory and then encoded and stored [Hamilton 1994].
Research on human cognition conducted since the 1950s suggests that the information-processing activities related to new learning are concentrated in the short-term memory, which is thought to be limited to holding and processing about seven pieces (or “chunks”) of information at any one time [Miller 1956, Simon 1996]. Simon defines a “chunk” as a substructure of the informational stimulus; for example, a random syllable such as BQT consists of three chunks (“B,” “Q,” and “T”), whereas the syllable DOG consists (for English speakers) of one chunk, a word denoting a domestic animal of the type canis familiaris. According to Simon [Simon 1996], it takes about 30 seconds per chunk for new information to be encoded into long-term memory (about 8 seconds for initial acquisition and another 22 seconds
A Star is Made: Attaining Excellence through Deliberate Practice

16
A S
TAR
IS M
AD
E:
ATT
AIN
ING
Ex
CE
LLE
NC
E T
HR
OU
GH
DE
LIB
ER
AT
E P
RA
CT
ICE
to encode for permanent retention). However, if a chunk can be related to one or more already-encoded chunks in long-term memory (structures that Simon calls “recall structures” or “templates”), the time required to incorporate that chunk into the existing template is only about one or two seconds. Simon estimates that a world-class professional possesses at least 50,000 chunks of domain-specific information (which assumes 30 seconds for learning each chunk and working 4 hours a day over the course of a decade), and as many as 1.8 million chunks (assuming 4 hours of work per day over the course of a decade, but with a shorter encoding time based on the existence of recall structures). Once encoded, it takes only a few hundred milliseconds to retrieve information from existing templates. Simon’s research indicates that this retrieval time holds constant regardless of the complexity of the information being retrieved, whether the recall structure being accessed consists only of simple linear strings of chunks (such as a telephone number) or a complex semantic network (such as a doctor’s mental library of knowledge that must be searched in order to arrive at a diagnosis based on a list of symptoms or other parameters). With enough practice, most fundamental information in a domain has been learned to such a degree that it can be recalled virtually automatically, allowing tasks to be performed without conscious awareness or attention, a phenomenon called automaticity [Poldrack 2005].
As automaticity develops for a particular task, information is encoded and stored in a recall structure or a linked network of structures which function cognitively as a single chunk. As a result, a proficient practitioner of a specialized skill or domain can access a larger amount of information than a novice, and can do so more quickly. In addition, as automaticity develops, practitioners are able to perform more than one task at a time, enabling them to multi-task (such as driving a car while talking to a passenger) or to focus cognitive effort on higher-order skills such as elaboration, evaluation, and creativity.
Automaticity can be reinforced and actually enhanced by the implementation of the process that Anders Ericsson has named “deliberate practice” [Ericsson 1993]. With deliberate practice, expert performers can build and refine their skills in a specific domain by consciously focusing on achieving small but gradual improvements in their technique, leading to an overall improvement in performance. Deliberate practice also can be characterized as a specific instantiation of “metacognition,” which is a specific type of higher-order thinking in which the learner takes active control of the cognitive processes involved in learning [Livingston 1997]. Metacognitive skills include consciously analyzing one’s personal learning style, planning and selecting learning strategies, monitoring the progress of learning, correcting errors, analyzing the effectiveness of the learning strategies employed, and changing learning behaviors and strategies when necessary [Ridley 1992].
During learning, the deliberate application of metacognition enables the brain to regulate the type and quality of information that is stored, since the merest sensory perception of a stimulus can result in encoding and storage. The brain processes and encodes almost all information it receives, without conscious effort or regard for the quality (or lack thereof) of the stimulus. Information does not have to be accurate, nor does a skill have to be performed well in order to be encoded; as far as automaticity goes, learning something “well enough” (or even incorrectly) is sufficient for retention and automaticity to occur [Hamilton 1994]. However, if learners deliberately concentrate on practicing a task accurately, focusing conscious effort on mastering each component or sub-skill composing the task, they force their brains into internalizing an optimized pattern of performance [Brooks 2009]. With regard to learning new skills – or to perfecting existing skills – the adage that “practice makes perfect” is accurate only in direct proportion to the quality of the practice. It is more accurate to say that “practice makes permanent,” since the initial cognitive process of encoding and storing information affects how it will be used later, and also affects the performance quality of skills or tasks that are associated with or dependant on the initial learning.
The Elements of Deliberate PracticeDeliberate practice consists of an extended period of focused experience and continuous feedback on the execution of specialized tasks [Ericsson 1993], allowing practitioners of a discipline to sharpen their skills and achieve expertise. Deliberate practice occurs when a performer consciously applies metacognitive skills in a disciplined manner to repeatedly rehearse specific tasks or sub-tasks necessary for performance in the domain. The purposeful application of these metacognitive skills allow performers to refine the quality of the domain-specific knowledge that they have amassed in their recall structures, so that as the various skills and concepts that achieve automaticity are of sufficiently high quality to enable consistent masterful performance. The defining elements of deliberate practice are as follows:
1. Focusing as much on the techniques and processes of performance as on the outcome. Deliberate practice is designed specifically to enable performers to identify and isolate precise aspects of performance that need to be improved, and then concentrate effort on changing their performance processes or techniques in order to achieve the desired improvements. Average performers tend to focus their practice sessions on reinforcing the performance aspects that they already do well, but great performers use practice approaches that have been deliberately designed to stretch themselves and enable successful performance that is just beyond their current abilities. This type of practice is difficult not only from the inherent challenge of striving

17
A S
TAR
IS M
AD
E:
ATT
AIN
ING
Ex
CE
LLE
NC
E T
HR
OU
GH
DE
LIB
ER
AT
E P
RA
CT
ICE
for a higher achievement level than is currently possible, but also because most people find it less than enjoyable to attempt to do things they are not good at. It requires a great deal of mental discipline to sustain the level of effort required to improve even a single aspect of performance; great performers work on improving all aspects of their performance, first mastering one element and then moving on to the next skill or sub-skill that they want to improve.
2. Setting specific and measurable goals. With deliberate practice, improvement comes one goal at a time. Superior performers set immediate goals, often pertaining to what will be done on one particular day. Their goals are not only about the outcome, but also about the process of reaching the outcome: “I’ll shoot 400 balls and hit the 18th green within 5 feet of the pin at least 75% of the time when using a 9-iron.” Average performers set general goals that focus only on the outcome without regard for the process: “I’ll shoot 10 balls with the 9-iron, and then 10 balls with the driver, and another 10 with the wedge, and I’ll try to hit the green every time.” The superior performer does not move on to the next goal until achieving 300 shots that land within 5 feet of the pin on the 18th green; the average performer hits 10 balls each with every club in the bag, moving on to the next one even if not all of the balls land on the green.
3. Receiving immediate and meaningful feedback, and using the feedback to improve technique. Practice without feedback is meaningless. Whether the feedback comes from a mentor, coach, or teacher, or from within in the form of self-assessment (or “self-talk”), performers need some sort of input regarding their performance against the goal. Self-assessment is one of the most valuable tools available in improving performance, since it provides the most immediate form possible for feedback. Immediate input from a coach or teacher is valuable because it not only provides a timely and objective performance assessment, but also can identify weaknesses that may not be readily apparent to the performer.
4. Maintaining a disciplined approach to practice. Achieving excellence in a domain requires adhering to a regular schedule of deliberate practice over a long period of time. Studies conducted by Benjamin Bloom, Anders Ericsson, and other researchers show that at least 10,000 hours – which translates into about 10 years – of practice is required to achieve the level of mastery associated with world-class expertise [Bloom 1985, Ericsson 1993]. According to Simon, “if it takes thirty seconds of attention to store a new chunk in long-term memory (8 seconds for initial acquisition, say, plus 22 seconds to overlearn for permanent retention), then 10 years of intensive study at 1,500 hours per year (about four
hours per day),” is required to produce a memory store sufficient for mastery in a particular domain [Simon, 1996]. High repetition is the most important difference between deliberately practicing a task and performing the task for real under less-than-ideal conditions, when accurate or masterful performance may be especially critical. Disciplined practice leads to the formation of good performance habits, which means that a skill or behavior has become automatic rather than conscious, enabling the performer to act the same way every time, without thinking. Disciplined practice enables superior performance to become habitual, an advantage that may make the difference between making the winning free shot just before the game-end buzzer versus missing the basket under pressure.
5. Having a supportive environment. Most superior performers started down the path towards mastery in a domain because of encouragement from parents or teachers who praised their successes and encouraged them when they failed to learn from their mistakes and try again. Although they may be considered as masters in their domains, many expert performers continue to seek input from others, through participation in masters’ classes, collaboration with other superior performers in the same field, or ongoing instruction from mentors; even with more than a dozen major tournament titles to his credit, Tiger Woods still regularly works with a coach.
6. Having a passion for the domain. Deliberate practice is, above all, effortful focus and concentration, which puts high mental demands on the performer. It is very hard work, both cognitively and physically, to continually seek out performance aspects that are less than satisfactory and then focus extreme concentration on improving both the performance techniques and the outcomes. Research shows that, as a general rule, superior performers love what they do so much that they don’t see disciplined practice as grinding work to be endured; they see it as an effective means of achieving their performance goals [Ericsson 1993]. Their passion for their work and their desire to achieve the best possible performance provides the necessary motivation to sustain a level and duration of practice that most people would view as unrelenting drudgery.

18
A S
TAR
IS M
AD
E:
ATT
AIN
ING
Ex
CE
LLE
NC
E T
HR
OU
GH
DE
LIB
ER
AT
E P
RA
CT
ICE
The defining characteristics of deliberate practice, such as purposefully designed process changes with immediate and meaningful feedback, allow performers to continuously focus in a disciplined way on improvement; when conscientiously implemented over a long period of time, deliberate practice can result in superior performance or mastery in a particular domain. In the words of the Greek philosopher Aristotle, “Excellence is an art won by training and habituation.... We are what we repeatedly do. Excellence, then, is not an act but a habit.”
Disciplined Practice in Software Development: PSP and TSPThe PSP is a structured software development process that enables individual software engineers to analyze their performance and then improve it through use of disciplined methods. The PSP methodology requires developers to focus on improving one area of the development process at a time, to set improvement goals and use data to track progress against those goals, and then to analyze the feedback received (in the form of personal process data) to make continuing improvements in the process, thereby leading to higher-quality software components or products [Humphrey 1995]. In its focus on improving both the process and the outcome, setting meaningful and measurable goals, providing feedback that can be used to make continuing improvements to both the process and the performance, and maintaining a disciplined approach to improvement, the PSP is an instantiation of deliberate practice.
The TSP is an operational process methodology that enables PSP-trained individuals to create the supportive environment needed for successful team-building and teamworking when collaborating on software-intensive development projects [Humphrey 2000]. Although there currently is only a small body of research pertaining to the application of deliberate practice at the team or group level, the available data indicate that individual excellence can be replicated at the team level when the principles of deliberate practice are applied by all team members and the team coach [Helsen 1998; Ward 2007]. TSP teams use the techniques learned in PSP training to set measureable and meaningful goals for both schedule and product quality, to track their progress against these goals using an aggregate of the data collected by each team member, and then use that data to make adjustments in their work to ensure that their quality goals are met. At all times, the team members use disciplined methods to produce the various components or products for which they are responsible. The TSP framework also provides the necessary elements of a supportive environment and objective input from an experienced coach which, combined with the collective beneficial practices used by the PSP-trained team members, provide TSP with the essential elements for a relevant instantiation of deliberate practice at the team level.
The following sections provide specific descriptions of how PSP and TSP practices can be mapped to the principles of deliberate practice in a software development environment.
1. PSP requires software developers to focus as much on the techniques and processes of performance as on the outcome. The PSP training is specifically designed to introduce process improvements gradually (in seven increments and ten programs) across the duration of the training. Although the number of repetitions is low and cannot lead to full-blown mastery of the various sub-tasks being addressed in each increment, the controlled introduction of process changes does allow PSP students to compare their performance (in terms of time spent on programming tasks, estimation accuracy, and quality measured as defect density) throughout the duration of the training and to quantify the direction and magnitude of change in performance. The PSP process changes are introduced in a series of scripts that first provide a stable baseline for the basic process, then gradually adds elements such as coding standards, size measures, size and time estimating procedures, testing standards, design reviews, code reviews, and customized review checklists that can be tailored to focus the developers’ improvement efforts on their own particular areas of weakness. By using a standardized process that is delineated by the PSP scripts, developers can focus on properly implementing good programming practices; by collecting data about size, time, and defects on the appropriate PSP forms, engineers can measure their progress towards internalizing an improved process and can make needed process adjustments to optimize their performance as a software developer. From a learning-theory perspective, improvements in both the development process and the work products most likely can be attributed to changes in the developers’ metacognition; the data provided by PSP and TSP help practitioners to become more aware of what they do, how they do it, and which aspects of their work require continued refinement. Not only does working in a disciplined way allow developers to enhance their skills and improve their products, but the very act of doing disciplined work causes developers to change their own metacognitive processes [Kidd 1994] so that high-quality software development becomes a habit.
An additional benefit to developers who master the process mechanics of development is that they are able to focus more of their time and energy on actual development, instead of spending a great deal of time debugging their work. Some skeptics and critics of disciplined methods attribute their resistance to adopting disciplined techniques to their fear of losing creativity: they argue that adhering to and continually refining one specific process is a sure-fire recipe for stifling their creative abilities. However, research on cognition and expert performance indicates that experts not only consistently outperform their less-skilled fellow

19
A S
TAR
IS M
AD
E:
ATT
AIN
ING
Ex
CE
LLE
NC
E T
HR
OU
GH
DE
LIB
ER
AT
E P
RA
CT
ICE
practitioners, they also are more creative. Hamilton explains that people who can skillfully conduct the routine operations in a particular domain expend less of their available intellectual capacity on those performing operations, freeing that capacity for other cognitive activities [Hamilton 1994]. Consistently superior performance actually enables and facilitates creativity, since the practitioner no longer needs to consciously focus on technique. Once the fundamentals skills have become automatic, performers can focus their cognitive energy on creating new approaches to problems in the domain.
2. PSP and TSP require individuals and teams to set specific and measurable goals. The PSP sets three recommended process goals: developers should (1) strive to produce zero-defect products (2) on schedule and (3) within planned costs; use of the TSP has been shown to be effective in enabling developers to reach these goals [Humphrey 2000]. Individuals using the PSP can measure their baseline parameters such as defect levels, productivity rates, and types of defects most frequently made during programming; then, using these baseline measures, developers can set goals such as reducing the total number of defects in their code, or finding all defects before unit test, and so on. They can then implement specific changes to their development processes that help them to achieve these goals, such as customizing design and code review checklists to focus on finding the defects that they make most often. PSP-trained individuals who work on TSP teams devote one entire meeting of the project planning activities to setting measurable team goals for quality, schedule, functionality, and the like. Since both the PSP and TSP require individuals to record specific data on time, component or product size, defects injected and defects removed, and so on, specific performance measures for these goals are easily quantified.
3. PSP and TSP practitioners receive immediate and meaningful feedback, and use the feedback to improve both the process and the performance. The most obvious feedback to individuals using the PSP and to teams using the TSP comes in the form of data gathered on actual performance; a comparison of the actual performance to the goal parameters for a particular process aspect provides immediate knowledge about whether the goal has been met, and if not, knowledge of how much improvement still must be made. Defect data such as phase yield can provide information regarding progress towards quality goals, as well as giving insight on areas of process weakness that continue to require improvement. Keeping track of time data also provides valuable feedback: whereas logging their practice hours helps elite performers in fields such as sports or music to stick to their training schedules, individuals and teams can assess their schedule performance by tracking the earned
value for completed tasks, and can use performance data to identify steps for changing their processes if they do not meet the earned value goals.
Both anecdotal and research evidence suggest that the very act of setting goals and actively thinking or talking about the goals and goal-related activities can provide and sustain the motivation necessary to maintain the self-discipline required for achieving excellence [Paivio 2007]. By using their data to track progress towards their goals, by producing graphical representations of their data (such as earned value charts), and by discussing their progress with other practitioners, both individuals and teams engage in self-talk about goals. TSP teams also devote a portion of their weekly team meetings to discussing their collective goals, providing the team members with the motivation for continuing to work hard to meet those goals and with information that can be used to adjust current performance and make any needed improvements to enable goal realization.
4. PSP and TSP practitioners maintain a disciplined approach to practice. Disciplined practices are both the foundation for and the defining feature of the PSP and TSP methodologies. The acts of following process scripts, collecting and using data, refining processes and plans based on data and performance outcomes, and setting higher quality goals each time their current goals are met, are all part of maintaining a disciplined approach to improving individual and/or team performance as outstanding software developers. With sufficient use of PSP and TSP methodologies, a focus on producing high-quality code becomes habitual behavior for software developers.
5. PSP and TSP provide a supportive environment for deliberate practice. Organizations that have committed to using PSP and TSP have a financial incentive to realize a return on their investment in the training and coaching support required to introduce the technology into a business enterprise. Management knows that it is vital for them to provide support for continued implementation of the methodologies in the form of rewards for consistent process use, as well as for achievement of schedule-, budget-, or quality-related goals. When management visibly supports and rewards individuals and teams for successful superior performance, they provide some of the necessary extrinsic motivation needed to continue the hard work of maintaining disciplined software practices. The TSP framework provides additional support in the form of an expert coach who can provide encouragement, motivation, and corrective feedback to the members of TSP teams; TSP also establishes team leadership with the designation of role managers who are responsible for ensuring that the team has all of the resources necessary to carry out their work and to reach their goals.
20
A S
TAR
IS M
AD
E:
ATT
AIN
ING
Ex
CE
LLE
NC
E T
HR
OU
GH
DE
LIB
ER
AT
E P
RA
CT
ICE
6. PSP and TSP practitioners have a passion for the technologies and for their work. The level of effort required to maintain the necessary focus and concentration on process improvement impose high mental demands on PSP and TSP practitioners. Once they overcome the learning curve associated with adopting new methods of working, and realize positive outcomes in the form of improved schedule and quality outcomes, many PSP and TSP practitioners come to believe that they cannot work any other way than using disciplined processes. They come to value both the methodology and the outcomes so much that they don’t see disciplined practice as work. Their passion for their work and their desire to achieve the best performance possible provides the necessary motivation to sustain the level and duration of effort required for continuous process improvement, often to the extent that they continue to use the methodologies even if their organizations discontinue use of PSP/TSP or when they take new positions in organizations that have yet to adopt these methodologies.
Conclusion Research on excellence in performance has shown that the single most significant factor separating average performers from superior performers is not intrinsic ability or years of experience, but rather, the implementation of deliberate practice. If focused and persistent in engaging in deliberate practice in one specific domain, anyone can achieve a significant improvement in performance.
Deliberate practice consists of several elements, including consciously designing and implementing an improvement strategy, focusing on improving both performance processes and outcomes, setting improvement goals and getting feedback on progress towards those goals, correcting errors, analyzing the effectiveness of the improvement strategy, and changing strategies when necessary. PSP and TSP include practical instantiations of deliberate practice that, when implemented by trained software developers, provide proven effective methodologies for improving the quality of both the development process and the resulting outcomes.
References[Amirault 2006] Amirault, Roy J., & Branson, Robert K.
“Educators and Expertise: A Brief History of Theories and Models,” 3-19. The Cambridge Handbook of Expertise and Expert Performance (K. Anders Ericsson, Neil Charness, Paul J. Feltovich, & Robert R. Hoffman, eds.), New York: Cambridge University Press, 2006.
[Bloom 1985] Bloom, Benjamin S. (Ed.). Developing Talent in Young People. New York: Ballentine Books, 1985.
[Brooks 2009] Brooks, David. “Genius: The Modern View.” New York Times, 30 April 2009. Online at http://www.nytimes.com/2009/05/01/opinion/01brooks.html?_r=2&em
[Ericsson 1993] Ericsson, K. Anders; Krampe, Ralf Th.; & Tesch-Römer, Clemens. “The Role of Deliberate Practice in the Acquisition of Expert Performance.” Psychological Review, 100, 3 (July 1993): 363-406.
[Hamilton 1994] Hamilton, Richard, & Ghatala, Elizabeth. Learning and Instruction. New York: McGraw-Hill, 1994.
[Helsen 1998] Helsen, Werner F.; Starkes, Janet L.; & Hodges, Nicola J. “Team Sports and the Theory of Deliberate Practice.” Journal of Sport & Exercise Psychology, 20, 1 (March 1998): 12-34.
[Humphrey 1995] Humphrey, Watts S. A Discipline for Software Engineering. Reading, MA: Addison-Wesley Publishing Co., 1995.
[Humphrey 2000] Humphrey, Watts S. The Team Software ProcessSM (TSPSM) (CMU/SEI-2000-TR-023, ESC-TR-2000-023). Software Engineering Institute, Carnegie Mellon University, 2000.
[Kidd 1994] Kidd, Alison. “The Marks are on the Knowledge Worker” (186-191). Proceedings Companion of CHI, 1994 (Boston, MA, April 24-28, 1994). New York: ACM, 1994.
[Livingston 1997] Livingston, Jennifer A. Metacognition: An Overview. [Online] http://www.gse.buffalo.edu/fas/shuell/CEP564/Metacog.htm

21
A S
TAR
IS M
AD
E:
ATT
AIN
ING
Ex
CE
LLE
NC
E T
HR
OU
GH
DE
LIB
ER
AT
E P
RA
CT
ICE
[Miller 1956] Miller, George A. “The Magical Number Seven, Plus or Minus Two.” Psychological Review, 63, 2 (Mar. 1956): 81-97.
[Newell 1958] Newell, Allen; Shaw, J. C., & Simon, Herbert A. “Elements of a Theory of Problem Solving.” Psychological Review, 65, 3 (May 1958), 151-166.
[Paivio 2007] Paivio, Allan. Mind and its Evolution. New York: Routledge, 2007.
[Poldrack 2005] Poldrack, Russell A.; Sabb, Fred W.; Foerde, Karin; Tom, Sabrina M.; Asarnow, Robert F.; Bookheimer, Susan Y.; & Knowlton, Barbara J. The Neural Correlates of Motor Skill Automaticity. Journal of Neuroscience, 25, 22 (1 June 2005): 5356-5364.
[Ridley 1992] Ridley, S. D.; Schutz, P. A.; Glanz, R. S.; & Weinstein, C. E. “Self-regulated Learning: The Interactive Influence of Metacognitive Awareness and Goal-Setting.” Journal of Experimental Education, 60, 4 (Winter 1992): 293-306.
[Rosanoff 1932] Rosanoff, Martin André. “Edison in His Laboratory.” Harper’s Monthly, Sept. 1932: 402-417. (http://www.harpers.org/archive/1932/09)
[Rosenberg 2007] Rosenberg, Alexander. Philosophy of Social Science (3rd Ed.). Boulder, CO: Westview Press, 2007.
[Simon 1996] Simon, Herbert A. The Sciences of the Artificial. Cambridge, MA: MIT Press, 1996.
[Ward 2007] Ward, Paul; Hodges, Nicola J.; Starkes, Janet L.; & Williams, Mark A. “The Road to Excellence: Deliberate Practice and the Development of Expertise.” High Ability Studies, 18, 2 (Dec. 2007): 119-153.
Marsha Pomeroy-Huff, Ed.D.Software Engineering InstituteDr. Marsha Pomeroy-Huff is a member of the technical staff at the Software Engineering Institute (SEI). She holds BA and MS degrees in science education, and received MS and doctorate degrees in instructional design from the University of Pittsburgh.
Since joining the SEI in 1992, she has focused her work in the area of technology transition, specializing in the development and delivery of educational products and courses for software engineering practitioners. She has contributed to numerous technical courses in areas such as software architecture, metrics, software acquisition, and process improvement. As a member of the PSP/TSP Initiative Team from 1997 to 2007, Dr. Pomeroy-Huff collaborated on refinement of the PSP coursework and on the development of the TSP technology suite. She is the primary author of the PSP Body of Knowledge and has co-authored or contributed to various technical reports and journal articles about PSP and TSP in practice. She is also holds SEI certifications as a PSP Developer and Team Software Coach, and is currently coaching a TSP student team in the Master of Software Engineering (MSE) program at Carnegie Mellon University (CMU).
Dr. Pomeroy-Huff is currently a member of the SEI Credentials and Professional Certification Team and a studio mentor and adjunct lecturer for the CMU MSE program.
William R. NicholsSenior Member of the Technical StaffSEPMBill Nichols joined the Software Engineering Institute (SEI) in 2006 as a senior member of the technical staff and serves as a PSP instructor and TSP coach with the Team Software Process (TSP) Program. . Prior to joining the SEI, Dr. Nichols lead a software development team at the Bettis Laboratory near Pittsburgh, PA, where he had been developing and maintaining nuclear engineering and scientific software for 14 years. His publications include the interaction patterns on software development teams, design and performance a physics data acquisition system, analyzes and results from a particle physics experiment, and algorithm development for use in neutron diffusion programs. He has a doctorate in physics from Carnegie Mellon University
William R. Nichols, PhD (412) 268-1727 [email protected]

22
A S
TAR
IS M
AD
E:
ATT
AIN
ING
Ex
CE
LLE
NC
E T
HR
OU
GH
DE
LIB
ER
AT
E P
RA
CT
ICE

23
IMP
LEM
EN
TAT
ION
OF
TH
E T
SP
IN S
MA
LL A
ND
ME
DIU
M S
IzE
SO
FTW
AR
E E
NT
ER
PR
ISE
S
Roberto Alonso Ramos zapataKernel Technologies Group Padre Mier 516 Poniente Col. Centro, CP 64000, Monterrey, NL Tel. (52) 1 8180881922 Email: [email protected]
1.1 ABSTRACTThis paper shows the strategy used for implementing and maintaining the TSP in an enterprise with a software area of 5 to 10 developers who handled projects whose average size was about 2,000 man-hours, and how the TSP has allowed the growth of Kernel’s development area from 10 people to over 50 programmers in about 18 months.
We will also show how this strategy allows us now to successfully deliver projects greater than 10,000 man-hours, and change our organization from being an enterprise of 70% staffing and outsourcing engineers and 10% projects, to a 60% project development oriented enterprise, using currently TSP fully in the 100% of the software development projects.
1.2 INTRODUCTIONIn order to think of achieving successful high standard goals, one must always think of a well developed process and strategy, including a plan to follow it, a structure to support it and goals and metrics to measure it. As much as these principles could easily apply to any company size, it is vital for small software enterprises to pay special attention on sustainable structure and constant measurement.
1.3 STRATEGy1.3.1 WHAT TO DOThe process of implementing great changes must be done in a continuous improvement way, and not modifying everything that can be changed at one time. For small enterprises this becomes extremely important, thinking of the impact that an ineffective change could have.
The key for doing this and obtaining good and quick results relies on the performance of the “Plan, Do, Check, Act” paradigm as a continuous improvement process for making this changes.
1.3.2 WHERE TO STARTFor a company, small or big, when implementing changes, it is not only recommended but basic, to start attacking the problem from the root, which in the case of software enterprises it is also the place where the most impact is created when changes are made, this place is the design and construction phase of the development cycle.
Small companies should not try to implement the new process in everyplace of the cycle, you need to be aware that every phase has its own especial needs and challenges. Implement the new process where the most impact is done, and as you progress, start spreading the process across all the development cycle.
In Kernel Technologies Group we started our TSP projects after the Analysis phase for the first 2 projects, and only after we felt comfortable and ready did we started spreading it to other areas.
1.3.3 WHICH PROJECT TO CHOOSEThere are two things to look for when selecting your first TSP project: type of project and type of customer. Challenge yourself with the customer, not with the type of project. If you are new to a technology or a type of software, do not use it as your first TSP project, even if all developers are trained in PSP. TSP requires from them sometime to get used to their new tasks as managers and it can get tough to be learning also a new technology, even if you considered this learning time on your planning.
On the other hand, consider that TSP will give you the best tools for a better administration of your project, so do not doubt about choosing an important client and try to get the best experience out of it. Also, if possible, choose a client that has a mature sense of quality on a development process and the importance of it, regardless of the extra cost that this may represent.
In Kernel, for our first project we selected an important client, but also a technology that was new to some of the developers. This was a very difficult challenge for the team at the beginning of the project and they ended up putting more hours every week than estimated because they had to spend time on both learning the technology and TSP at the same time. The great advantage here was that even though they had to invest extra time, they identified the issue soon enough.
Implementation of the TSP in small and medium size software enterprises

24
IMP
LEM
EN
TAT
ION
OF
TH
E T
SP
IN S
MA
LL A
ND
ME
DIU
M S
IzE
SO
FTW
AR
E E
NT
ER
PR
ISE
S
1.3.4 HOW TO PERFORM 1.3.4.1 TrainingDo not hesitate on this subject, since this will set the basis for the success of the TSP implementation project. Early training will give the company a good understanding of the changes that are going to happen in every level of the enterprise, this is needed to perform goodly and also to avoid common obstacles that will show with the implementation of the new process.
Since designing and construction phases where chosen to be the first to apply the TSP, start training the developers and its upper levels. As you plan to apply it to the next areas, continue training the next areas. Every person that is going to apply the TSP must be trained to do so correctly and without affecting the going of the project.
While focusing on PSP/TSP don’t forget to train your people on the technology to be used in case is necessary.
1.3.4.2 Team StructureSmall software companies, like the ones we are addressing, usually are form of teams or team of at the most 4 to 6 developers, plus a team leader and a coach. This represents a problem when all of them are new to TSP and each member of the team can have any level of experience participating in a project.
For those reasons, it becomes of great importance to wisely form the team structure, especially when selecting key roles for a first TSP project.
Coach and Team Leader must be not lightly selected, since they will be the orchestrators of a fine TSP performance. It is totally recommended that for your first TSP project you select an experience Coach, this is taking in account that for not experienced teams, the coach will have practically no time to analyze the data produced by it, and the analysis (which is required) must be done fast and without losing certainty. Since another key element of success will be the performance of the team member’s roles, the coach’s experience comes in play again to correctly guide every member to do the right way the role they’ve selected, on their first project, planning and process manager need special attention.
The case of team leaders is a little different since it must be a member of your crew. You must be very careful in whom to select, sometimes your current best leader is not necessarily the best option for your first TSP team leader, look for leaders who are convince of the methodology and leaders who are open to changes on the way they lead their teams.
1.3.5 WHEN AND WHAT TO MEASUREFor a small enterprise, the cost of deviation in a project’s effort could mean the end of the company. Having one of your teams working 40 to 50% of their time on testing (up to 1,450hrs/man in a 10 month project of 6 developers), can make a project’s cost get out of budget. When you are small and plan to grow, the productivity of your teams becomes a subject to keep an eye on, but is also a subject hard to measure on initial stages of a project, there for, in order to get a better productivity we must focus on quality.
While we accomplish spending less time on testing we can manage to deliver the same functionality in less time, or what is better, more product functionality in the same time.
For initial TSP projects, instruct the coach into putting an extra effort on focusing on quality, measure PQI and yields following standard TSP procedures, make sure the subject is addressed every week in the team meetings and management reports, and every 3 to 4 weeks at higher levels. Don’t take lightly the obtained results for they will lead you or deviate you from the path of success in a project.
Look for a Process Quality Index higher than the usual .4 in your first projects because the performance on your reviews and inspections will take time improve, and in order to hit a 70% yield or higher you will need to do them in a slower pace at start look for at number at least close to .55.
Also another hint to perform with quality that will not only help you to reduce the defect but also to develop faster and more consistently is the reuse of elements, try to identify every single reusable part from the beginning and as the project move forward define your own libraries for subsequent projects.

25
IMP
LEM
EN
TAT
ION
OF
TH
E T
SP
IN S
MA
LL A
ND
ME
DIU
M S
IzE
SO
FTW
AR
E E
NT
ER
PR
ISE
S
1.4 ACQUIRED ExPERIENCE1.4.1 PROBLEMS AND SOLUTIONS1.4.1.1 Team members inclusionThe inclusion of a team member in TSP projects usually faces two main issues, the training and the inclusion of on the team per se. Usually, when you are a small company, is hard to afford in time or cost the training of one new member alone, for this reason it’s important to plan carefully members inclusion in small groups and with enough hiring anticipation, at least 2 weeks before they get to work on the project, also consider the recommendation of this training to be “PSP Fundamentals” and not “PSP for engineers”, is better that they have the second week to catch up, rather than being just finishing the training when they are already working on the project.
As for the inclusion on the team problem, just make sure your team follows all the standard TSP procedures for including new members on a team, including re-launches if necessary.
I our experience, there have been nothing worst to a TSP project than including a not trained member to it. Even if is your top developer don’t take lightly this comment.
1.4.1.2 Initial estimation deviationsWhen working for the first time with TSP, deviations on the estimation are usual, and could be drastic. This can come from many places on your initial experience, from not considered items to lack of data to correctly estimate. Since this is likely to happen, don’t spend a whole lot of time on the problem and focus on the solution. The key element for this is to keep the team owning the plan, and there for owning the commitment they made. A common mistake when this problem starts to show at early stages of the project is the desire to intervene, this can cause a team to lose confidence on the plan, and that is something that you may never gain back, let the team decide how are they going to get back to their committed dates.
1.4.1.3 Resistance to changeUsually this problem gets solve with the correct training of all people that is going to be involved in TSP projects, but when this is not the case, try to avoid conflict, use simple convincing phrases like “the past strategy have not work for us, lets try this for this project and see the results”, try not to spend too much effort on the convincing part and let the work do the talking.
Sales strategyIt’s going to take time to develop the belief that extra work done in TSP projects is worth the trip, not only for the software companies but also to their customers.
In the meanwhile it is important to have a clear strategy to support the usage of such methodology, but not only relaying on quality, which is something the customer already expects from you but also in how the using of this strategy also helps the business. TSP allows you to develop in increments, which can allow your client to have complete functional deliverables in short periods of 3 months. Also relate the methodology to the technology you are going to implement so the customers feels comfortable and secure that he is making a sound decision, even if he is paying a little more for it.
A problem that we have face in Kernel while trying to sale to the Mexican market is justifying methodologies always in terms of cost-benefit which is sometimes difficult to understand for the customer. They way we do it now is showing the benefits in past projects in terms of time and post-work which is clear for them that reflects in cost.
1.4.3 MAINTENANCEThe first TSP project is only the first step to become a full TSP company. To spread and maintain the methodology across the enterprise, when you are a small company is of high importance to apply your budget correctly. So the moment that you prove the methodology works, is time to do a couple of things in order to accomplish the set goal, first, learn how to fish, stop training developers and leaders and start training one or two instructors, and now that you have some experience in real projects stop hiring outside coaches and start training one or two people to do this job. The other important thing, and now that you have instructors is not to wait to perform training on people, as soon as you hire new people, start the training immediately to avoid this people to struggle once they join a Team Software Process project. To do this set also a hiring strategy with human resources people in order to avoid extra work on the continuous training.

26
IMP
LEM
EN
TAT
ION
OF
TH
E T
SP
IN S
MA
LL A
ND
ME
DIU
M S
IzE
SO
FTW
AR
E E
NT
ER
PR
ISE
S
1.5 REFERENCESW. E. Deming and W. Edwards Deming. 1982. The Quality Productivity and Competitive Position. Massachusetts Inst Technology.
Watts S. Humphrey. 2005. TSP: Leading a Development Team. Addison-Wesley Professional
Watts S. Humphrey. 2005. PSP: A Self-Improvement Process for Software Engineers. Addison-Wesley Professional
Roberto Alonso Ramos zapataChief of SW Development DepartmentKernel Technologies Group
Roberto Ramos is a manager in the software development area at the Mexican software company Kernel Technologies Group.
Before joining Kernel, Ramos was a project leader for CRM projects in a small company in Monterrey called BlockNetworks where he started working after obtaining his University degree in 2005.
Ramos holds a degree in Computers Systems Engineering from the Instituto Técnológico y de Estudios Superiores de Monterrey “Tec de Monterrey”.

27
UP
DA
TIN
G T
HE
TS
P Q
UA
LITy
PLA
N U
SIN
G T
HE
MO
NT
E C
AR
LO S
IMU
LAT
ION
David R. Webb
1.1 AbstractThe Team Software Process (TSP) Quality Plan is composed during meeting 5 of the launch by determining the defect injection rates and yields for each phase of the product development process. Using the team’s historical averages for these rates and estimated hours per phase, the team can predict how many defects will likely be injected and removed as products move through this process. Unfortunately, these averages do not take into account normal variability in the process. However, applying a Monte Carlo simulation to the standard TSP quality planning process, a team can determine the historical distribution of process variability and produce a plan with ranges for expected defects injected and removed, as well as measures of “goodness” for the product and process.
The 309th Software Maintenance Group at Hill Air Force Base has begun implementing this updated version of the TSP Quality Plan. This paper presents an overview of why an updated quality plan with variability is needed, what data the model requires to be useful, and how the new model works. Actual data from Hill Air Force Base projects that have implemented this method are presented for review.
Updating the TSP Quality Plan Using the Monte Carlo Simulation
1.2 The TSP Quality PlanOne of the hallmarks of projects using the Team Software Process (TSP) is the attention to quality or, more accurately, the ability to manage product defects. In fact, Watts Humphrey, creator of the TSP, says “defect management must be a top priority, because the defect content of the product will largely determine your ability to develop that product on a predictable schedule and for its planned costs.” 1 A chief component of this focus is the Quality Plan developed during Meeting 5 of the TSP launch. This plan is composed by estimating defects injected and removed during the various phases of the software process. The team uses historical averages of defects injected per hour to determine defects injected and similar averages for Yield (the percent of existing defects found and fixed during a phase) to determine those removed. (See Figure 1). According to Mr. Humphrey, the true purpose of the quality plan “is to establish team yield goals for each process step.” 2 If the team does not have sufficient historical data, average injection and removal data collected by SEI can be employed. Using this approach, the team estimates final product quality and then determines whether or not that quality will meet their customer, management and team goals. If those goals are not met, the team decides what process changes should be made to meet them.
TSP (v1) Rollup Plan Summary
Quality Summary
Defect Density Phase Yields
Defects/KLOC Plan Actual Plan ActualDetailed Design Review 164 Requirements Review 70%Detailed Design Inspection 49.1 Requirements Inspection 70%Code Review 395 HLD Review 70%Compile 87.9 HLD Inspection 70%Code Inspection 61.6 Detailed Design Review 70%Unit Test 31.1 Detailed Design Inspection 70%Build and Integration Test 2.76 Code Review 70%System Test 0.55 Compile 50%
Total Development 1038 Code Inspection 70%Total 1.04 Unit Test 90%
Build and Integration Test 80%System Test 80%
Inspection / Review RatesDefect Injection Rates
Plan ActualCode Review 28.5 Defects Injected per HourCode Inspection 5.51 Plan Actual
Requirements 0.25
Cost of Quality High-Level Design 0.25
Plan Actual Detailed Design 0.75% Appraisal COQ 32.70% Code 2% Failure COQ 4.69% Compile 0.3AFR 6.98 Unit Test 0.07
Figure 1: Sample TSP Quality Plan Created During Meeting 5

28
UP
DA
TIN
G T
HE
TS
P Q
UA
LITy
PLA
N U
SIN
G T
HE
MO
NT
E C
AR
LO S
IMU
LAT
ION
Once the plan has been developed and the launch completed, it is the role of the team’s Quality Manager (assigned during the launch) to monitor progress against the Quality Plan. Results of the monitoring activities are discussed during the team’s weekly meeting. In addition to monitoring actual values for defects injected and removed, the Quality Manager can help focus the team on quality issues by examining other metrics, such as the Defect Removal Profile (the defects / KLOC removed from software components as they move through the development lifecycle) and Product Quality Index. (See Figure 2.) Exercises such as “Capture/Recapture” can even predict how many defects may have escaped a personal review or inspection. When done properly, these measures, metrics and activities can improve the team’s quality focus, reducing rework and improving on-time and within-budget performance.
Many TSP teams that have no issues with most TSP concepts, struggle with this one. While teams are excited about producing the Quality Plan during the Launch, after a few weeks, the Quality Manager no longer reports quality progress, other than announcing when the next quality event (inspection, test, etc.) will take place. At project Postmortem, the team dutifully collects the quality data needed for the next launch, but notes in the lessons learned that they “need to do a better job on the Quality Plan in the future.” In this author’s experience, there are few key reasons for the fall-off of the quality focus:
• The team has not collected sufficient historical data for defect injection and removal; they utilize the “by the book” numbers provided by SEI, but do not really believe them, because they are not “their” numbers.
• Historical averages blend the results of high performers with average or low performers. Depending upon who is working on a module or series of modules, the
predictions may or may not truly represent the work being done, so the team doesn’t trust them, and certainly does not use them to guide their work.
• Defect injection rates are based upon the effort estimate for each module; while TSP teams are great at using Earned Value techniques to balance workloads to meet their estimates, not every module is accurately estimated, making the defect injection numbers suspect.
• Team members are not consistently collecting defect data; either individuals are counting defects differently or they are not measuring them at all, making any defect prediction model inaccurate, and thus, unusable.
• When actual data begins to come in, the Quality Manager, Team Leader and sometimes even the Coach, don’t really know what to make of them (e.g., does a lower number of defects than expected mean the team is just very good, or that the quality activity was badly executed?).
All of these issues can be addressed by two basic practices: 1) consistently collect data; and 2) properly use the concepts of variability in developing and tracking the Quality Plan. This paper will examine some simple ways to ensure quality data are consistently and properly collected, and will discuss the use of the Monte Carlo simulation to account for inherent process variability, thus making the Quality Plan more accurate and usable.
Figure 2: Sample Defect Removal Profile and Product Quality Index Charts

29
UP
DA
TIN
G T
HE
TS
P Q
UA
LITy
PLA
N U
SIN
G T
HE
MO
NT
E C
AR
LO S
IMU
LAT
ION
1.3 Consistent Data CollectionFrom an examination of the data of 10 randomly selected Personal Software Process (PSP) students from various classes over a 5 year period, it becomes obvious that the rate at which defects are injected per hour (DIR) varies widely by person (Figure 3). Even the plots of the averages of defect injection rates show that every person is different – sometimes vastly different (Figure 4).
S tude
nt 10
Stud
ent 9
S tude
n t 8
Stud
ent 7
Stud
ent 6
Stud
ent 5
S tude
nt 4
S tuden
t 3
S tude
nt 2
Stud
e nt 1
60
50
40
30
20
10
0
De
fect
s /
Ho
ur
Boxplot of DIR in Design
S tude
n t 10
S tude
nt 9
Stud
ent 8
S tude
nt 7
Stud
ent 6
S tude
nt 5
S tude
nt 4
Stude
nt 3
Stud
ent 2
S tude
nt 1
20
15
10
5
0
De
fec
ts /
Ho
ur
Boxplot of DIR in Code
0.00
5.00
10.00
15.00
20.00
25.00
30.00
35.00
Average DIR in Design
0.00
2.00
4.00
6.00
8.00
10.00
12.00
Average DIR in Code
Figure 3: Comparisons of DIR Distributions for PSP Students
Figure 4: Comparisons of Average DIR for PSP Students

30
UP
DA
TIN
G T
HE
TS
P Q
UA
LITy
PLA
N U
SIN
G T
HE
MO
NT
E C
AR
LO S
IMU
LAT
ION
While some of this variability has to do with individual capabilities, the programming environment used, the difficulty of the assignment, and personal coding styles, much of it also has to do with common operational definitions and recording practices. Anyone who has taught a PSP class has noticed that not everyone fills out their defect logs the same way; some students record several missing semi-colons as a single defect then fix them all at once, while others count each semi-colon as an individual defect with distinct fix times. Most instructors allow this individual style of defect logging, as long as the student is consistent in the method used; however, when determining team defect injection rates, this kind of instability in definitions and recording methods can cause a prediction model to behave erratically. This leads the observer to doubt the validity of using personal defect logs, unless all engineers are somehow coerced into using identical logging techniques.
Another reason to suspect that personal defect data may not be the best fit for a quality prediction model can be seen in the “actual project” data. Figure 5 shows the distributions in personal defect logs collected over an 18 month period from a TSP team at Hill Air Force Base, Utah. During this project’s execution, the variability in personal defect logging noted in the classroom data did not stabilize or become more consistent. Perhaps, the most disturbing trend in these data is the severe lack of personally recorded data, as evidenced by the number of engineers with data from only one module or no defects logged at all. It is important to note that these data come from a team with strong coaching and a heavy quality focus (they have never released a major defect).
For these reasons, it appears to be undesirable to use personal defect log data for defect injection analyses. That being the case, the question is “what kinds of data would make sense?” Interviews with the engineers on the project noted above, and other TSP projects at Hill, suggest that more consistency may be found in defect data from inspection and test databases. These public databases require more strict control to ensure that defects are properly identified, analyzed, addressed, and tracked. This typically requires users to enter data according to a defined procedure and to use common definitions for defects and defect types. This kind of control seems to drive more stable operational definitions and data recording practices than evidenced in the personal defect logs.
In Figure 6, which shows design and code inspection data from the same project referenced earlier, we can see that the distributions are much tighter than those in the personal logs, without the problem of a lack of recorded data. That being said, there is still some variability in the data – higher in the code inspections than the design inspections, in this case. For example, on both the design and code review data, the average DIR is toward the lower end of the distribution, suggesting a skewed normal or lognormal distribution in defect injection rates.
A possible conclusion, therefore, of this analysis is that personal defect log data is not as useful in creating a quality model for the Quality Plan as is data from public databases, such as the inspection and test databases. However, even in these data, the defect injection rates display a certain amount of variability that should be accounted for in our quality model.
One very important note here is that this analysis should not be used to suggest or validate the idea that personal defect logs are not useful. Several engineers interviewed found them very useful for personal improvement – they simply are not consistent from person to person, making the data unusable for team modeling purposes. Strict coaching and Quality Manager oversight, focusing on common operational definitions and recording procedures, may make these data more usable.
Engineer 7Engineer 6Engineer 5Engineer 4Engineer 3Engineer 2Engineer 1
0.8
0.7
0.6
0.5
0.4
0.3
0.2
0.1
0.0
De
fect
s p
er H
our
Boxplot of DIR in Design Using Defect Logs
Engineer 7Engineer 6Engineer 5Engineer 4Engineer 3Engineer 2Engineer 1
1.6
1.4
1.2
1.0
0.8
0.6
0.4
0.2
0.0
De
fect
s p
er H
our
Boxplot of DIR in Code Using Defect Logs Figure 5: Comparisons of DIR Distributions Using Personal Defect Logs from a TSP Project

31
UP
DA
TIN
G T
HE
TS
P Q
UA
LITy
PLA
N U
SIN
G T
HE
MO
NT
E C
AR
LO S
IMU
LAT
ION
Code DIRDesign DIR
1.4
1.2
1.0
0.8
0.6
0.4
0.2
0.0
De
fect
s p
er
Ho
ur
Boxplot of Design DIR, Code DIR, Using Inspection Data
Figure 6: DIR for Design and Code from Inspection Database from a TSP Project
1.4 The Monte Carlo SimulationOne method of taking into account the variability of the defect injection rates and yields in our quality model would be using a technique called the Monte Carlo Simulation. The Monte Carlo Method is any technique using random numbers and probability distributions to solve problems , . Monte Carlo uses the brute force of computational power to overcome situations where solving a problem analytically would be difficult. Monte Carlo Simulation iteratively uses the Monte Carlo Method many hundreds or even thousands of times to determine an expected solution.
The basic approach of Monte Carlo is captured in Table
Step # Description
1 Create a parametric model
2 Generate random inputs
3 Evaluate the model and store the results
4 Repeat steps 2 and 3 many, many times
5 Analyze the results of the runs Table 1: Monte Carlo Steps
This is useful in creating a form of prediction interval around an estimate. For example, assume the number of defects in a software product in the design phase of development can be predicted by multiplying the historical defects injected per hour by the number of hours estimated for the phase. We can improve that estimate by using the ratio of historically estimated hours to actual hours (the Cost Productivity Index or CPI). The CPI represents how well tasks have been estimated in the past; a number near 1 means that estimates
have been fairly accurate in the past, a number greater than 1, tells us that we tend to overestimate; a number less than one says we typically underestimate our tasks. Dividing the estimated hours by the CPI will compensate for any tendencies to over- or under-estimate. Thus, our final prediction equation for design defects injected is the DIR for design times the number of estimated hours in the design phase, divided by the CPI for design (Figure 7). This is the parametric model needed for Step 1 of the Monte Carlo simulation.
Figure 7: Predicted Defects (d) in the Design phase, based upon Defect Injection Rate (DIR)
Next, in Step 2, we need to generate random inputs to the DIR and CPI variables of the equation, since these are parameters that are subject to variability in our historical data. (Let’s assume we determined Hours earlier via PROBE or other estimating model.) The question is: where do we get these random values from? The answer can be found by examining each of the variables. For example, the typical TSP approach to estimating design defects would be to use the average historical values for DIR and CPI, as defined in Table 2. The only problem with that approach is that, while the average Defect Injection Rate (DIR) in design is 2.1, it can vary from 1 to 5, in a lognormal fashion (Figure 9). Additionally, the historical data in Table 2 show that the average CPI for design is 1, but it varies from 0.5 to 1.5 according to a normal curve (Figure 10). So, we would use these distributions to generate our random input data for Step 2 of the Monte Carlo process. Having previously estimated using PROBE that we should spend 8.3 hours in design, we randomly select values from each of these distributions and choose 0.88 defects per hour for DIR and a value of 1.12 for CPI (Figure 8). This gives us the value of 6.52 defects, which is how we evaluate the model and store the results for Step 3 of the process.
Figure 8: Predicted Defects Using Estimated Hours and Random Values for DIR and CPI

32
UP
DA
TIN
G T
HE
TS
P Q
UA
LITy
PLA
N U
SIN
G T
HE
MO
NT
E C
AR
LO S
IMU
LAT
ION
Completing the Monte Carlo process simply requires us to repeat Steps 2 and 3 many, many times, each time storing away the newly generated answers. Let’s say, we do 10,000 of these calculations and store them all away; when complete, we will have built up a new distribution for “d”, the results of the equation.
Project DIR – Design CPI - Design
P1 1.02 0.50
P2 1.33 1.15
P3 2.06 0.67
P4 1.13 0.88
P5 5.00 0.96
P6 2.50 1.35
P7 1.30 1.50
P8 4.10 0.62
P9 3.20 1.50
P10 1.08 1.38
P11 1.00 0.98
P12 1.62 0.89
P13 1.88 0.78
P14 3.10 0.88
P15 1.23 0.92
Average 2.10 1.00
Table 2: Notional Historical Data for DIR and CPI
Figure 9: Distribution of Design DIR from Table 2
Figure 10: Distribution of CPI from Table 2
Figure 11: Distribution of Results from Monte Carlo Simulation of Defects Injected in Design
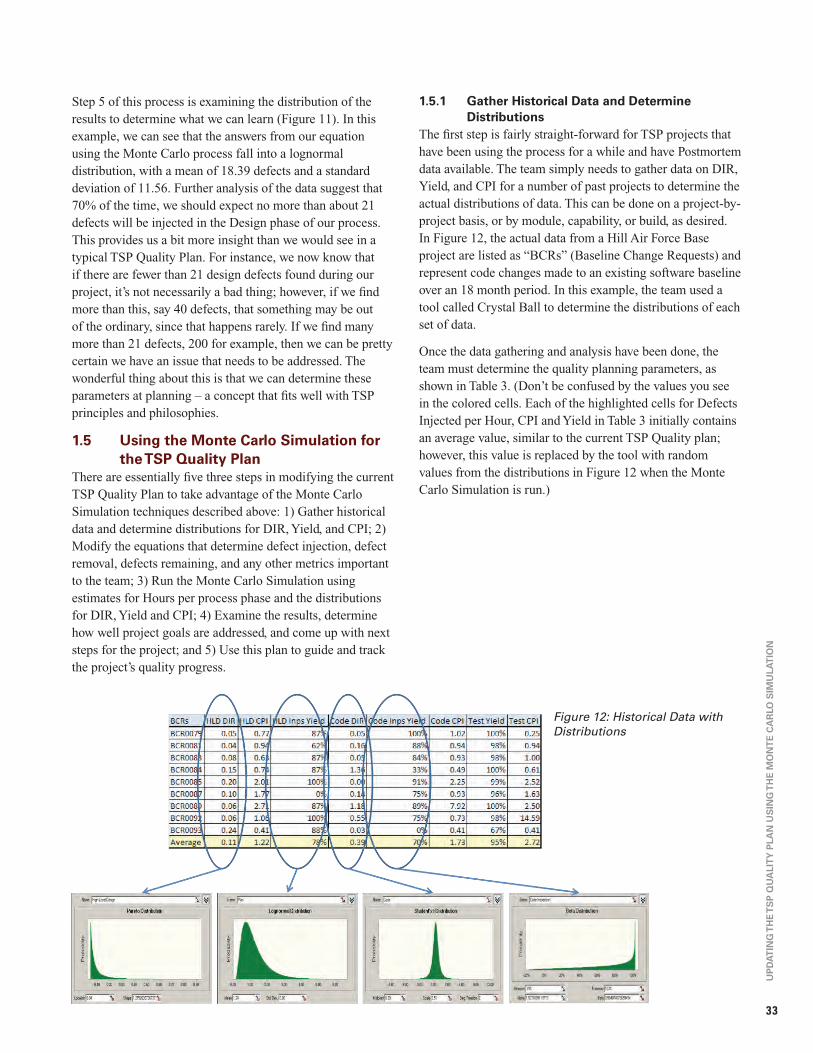
33
UP
DA
TIN
G T
HE
TS
P Q
UA
LITy
PLA
N U
SIN
G T
HE
MO
NT
E C
AR
LO S
IMU
LAT
ION
Step 5 of this process is examining the distribution of the results to determine what we can learn (Figure 11). In this example, we can see that the answers from our equation using the Monte Carlo process fall into a lognormal distribution, with a mean of 18.39 defects and a standard deviation of 11.56. Further analysis of the data suggest that 70% of the time, we should expect no more than about 21 defects will be injected in the Design phase of our process. This provides us a bit more insight than we would see in a typical TSP Quality Plan. For instance, we now know that if there are fewer than 21 design defects found during our project, it’s not necessarily a bad thing; however, if we find more than this, say 40 defects, that something may be out of the ordinary, since that happens rarely. If we find many more than 21 defects, 200 for example, then we can be pretty certain we have an issue that needs to be addressed. The wonderful thing about this is that we can determine these parameters at planning – a concept that fits well with TSP principles and philosophies.
1.5 Using the Monte Carlo Simulation for the TSP Quality Plan
There are essentially five three steps in modifying the current TSP Quality Plan to take advantage of the Monte Carlo Simulation techniques described above: 1) Gather historical data and determine distributions for DIR, Yield, and CPI; 2) Modify the equations that determine defect injection, defect removal, defects remaining, and any other metrics important to the team; 3) Run the Monte Carlo Simulation using estimates for Hours per process phase and the distributions for DIR, Yield and CPI; 4) Examine the results, determine how well project goals are addressed, and come up with next steps for the project; and 5) Use this plan to guide and track the project’s quality progress.
1.5.1 Gather Historical Data and Determine Distributions
The first step is fairly straight-forward for TSP projects that have been using the process for a while and have Postmortem data available. The team simply needs to gather data on DIR, Yield, and CPI for a number of past projects to determine the actual distributions of data. This can be done on a project-by-project basis, or by module, capability, or build, as desired. In Figure 12, the actual data from a Hill Air Force Base project are listed as “BCRs” (Baseline Change Requests) and represent code changes made to an existing software baseline over an 18 month period. In this example, the team used a tool called Crystal Ball to determine the distributions of each set of data.
Once the data gathering and analysis have been done, the team must determine the quality planning parameters, as shown in Table 3. (Don’t be confused by the values you see in the colored cells. Each of the highlighted cells for Defects Injected per Hour, CPI and Yield in Table 3 initially contains an average value, similar to the current TSP Quality plan; however, this value is replaced by the tool with random values from the distributions in Figure 12 when the Monte Carlo Simulation is run.)
Figure 12: Historical Data with Distributions

34
UP
DA
TIN
G T
HE
TS
P Q
UA
LITy
PLA
N U
SIN
G T
HE
MO
NT
E C
AR
LO S
IMU
LAT
ION
TSP Quality Plan w/ Monte CarloEst. Time Plan Actual Phase Yields Plan ActualHigh-Level Design 434.93 High-Level Design Inspection 78%High-Level Design Inspection 147.28 Code Inspection 70%Code 901.87 Unit Test 95%Code Inspection 175.82Unit Test 275.87 Est. Defects Found Plan Actual
High-Level Design Inspection 30.61Defects Injected per Hour Plan Actual Code Inspection 143.83High-Level Design 0.11 Unit Test 65.82Code 0.39
Est. Defects Remaining After Plan ActualProject CPI Plan Actual High-Level Design Inspection 8.85High-Level Design 1.22 Code Inspection 154.21Code 1.73 Unit Test 88.39Unit Test 2.72
Table 3: Planning Parameters for the New Quality Plan
1.5.2 Updating the EquationsCurrently, the TSP Quality Plan predicts measures that are useful in the planning stages of the project and can be used to guide the engineers during project execution. Some of these measures include Defect Densities per Phase of Review/Inspection, Review Rates, and Appraisal-to-Failure Ratios. In crafting the new Quality Plan, we can now be more specific and predict the actual numbers of defects that can be expected to be found in each of the quality phases and how many defects are remaining in the product, with a prediction interval. The equations for doing this are a modification of the equation previously created, predicting how many defects will be injected in the Design phase (see Figure 7). Using this formula, we simply multiply by the planned yield of the inspection phase to estimate how many defects will be removed, as show in Figure 13 below. (In this situation, Yield must be a decimal number between 0 and 1 instead of 0% and 100%.)
Figure 13: Equation to Estimate Defects Found in the Design Inspection
Similar equations can be generated for every phase, based upon the historical data from Figure 12. We can then use these equations, along with the distributions identified, to determine the results for our Monte Carlo Simulations, as shown in the Estimated Defects portions of Table 3. (The highlighted cells for “Est. Defects Found” and “Est. Defects After” in this table show the results of the parametric equations using the average values; these are replaced with the results of the calculations using random values from the distributions, during the Monte Carlo simulation.)
1.5.3 Running the Monte Carlo Simulation & Examining the Results
At this point, during Meeting 5 of the TSP Launch, the Monte Carlo Simulation is run with the variable inputs and the prediction equations as established above. The simulation can create distributions of results for all 14 predictions highlighted in Table 3. The team can predict, for example, the minimum number of defects they would expect to find in each inspection phase, within a given prediction range (e.g., 70% of the time), as shown in Figure 14. In this case, the total number of defects found in High-Level Detailed Design Inspection should be at least 16, and 5 in Code Inspection, 70% of the time, according to historical data.

35
UP
DA
TIN
G T
HE
TS
P Q
UA
LITy
PLA
N U
SIN
G T
HE
MO
NT
E C
AR
LO S
IMU
LAT
ION
Figure 14: Estimated Defects Found in Design and Code Inspections, with 70% Prediction Range
To make this prediction even more useful, the team should run the Monte Carlo Simulation for each module following Launch Meeting 6. At this point in the TSP Launch process, bottom-up plans have been made and hours have been estimated for each process phase of every module in the “Next Phase” plan. Assuming every individual performs within the parameters established from the team data, the Monte Carlo Simulation can now be run for each module. Table 4, for example, shows a single BCR update to a software baseline, with its own design and code inspection predictions. Note how the numbers are much lower for this single update than for the combined numbers of the entire project update, shown in Table 3. When the Monte Carlo
Simulation is run for these planning numbers, the charts look similar (see Figure 15); however, the key advantage is that we can now predict that 70% of the time the design inspection for this update should find at least 3 defects but it would not be unusual for the code review to find zero defects. This gives us some indication of the “goodness” of the inspections and a lower limit that we can look for during the execution of the project. Likewise, we can see that in the unit test for this change, we should find no more than 12 defects, 70% of the time (Figure 16). In this case, we look for the upper limit, since our goals are to find more defects in inspections than in testing.
Table 4: TSP Quality Plan with Monte Carlo for a Single Update

36
UP
DA
TIN
G T
HE
TS
P Q
UA
LITy
PLA
N U
SIN
G T
HE
MO
NT
E C
AR
LO S
IMU
LAT
ION
Figure 15: Estimated Defects Found in Design and Code Inspections for a Single BCR at 70%
Figure 16: Estimated Maximum Defects Found in Unit Test for a Single BCR