tst ss - nasa · 6.1: component layout diagram 6-4 ... aircraft lift curve due to flap deflection...
TRANSCRIPT

I
NASA-CR-195537
.,/fi5 u;,'- ¢,/D_ r
UNIVERSITY ofNOTRE DAME
///-,. ./
/ / .... D
NASA/USRA UNIVERSITYADVANCED DESIGN PROGRAM
1992-1993
PROJECT CENTER MENTOR"NASA-AMES DRYDEN FLIGHT RESEARCH FACILITY
FINAL DESIGN PROPOSAL
tSt ss
A Simulated Commercial Air Transportation Study
April 1993
Department of Aerospace and Mechanical EngineeringUniversity of Notre Dame
Notre Dame, IN 46556
(NASA-CR-195537) THE 3UNNY: A
Sr_ULATEO COMMERCIAL AIR
TRANSPORTATION STUCY Final Design_ro_osal (Notre 0ame Univ.) 123
N94-25001
P Unclas
G3/05 0204263
https://ntrs.nasa.gov/search.jsp?R=19940020519 2018-07-15T18:11:12+00:00Z
SunshineAeronautics
a division of AE441 Inc.
David Fulton
Patrick GallagherWilliam Grannan
Jennifer Martin
Nicole MastejBrett Wujek
Final Design Proposal4/8/93
The B unny ,,
Section 1:
Section 2:
Section 3:
Section 4:
Section 5:
Section 6:
Section 7:
Section 8:
Table of Contents
Executive Summary
Mission Definition
2.1 Market Analysis2.2 Design Requirements and Objectives
Concept Selection3.1 Aileron Design
3.2 Tapered Wing Design3.3 Triple-deck Design3°4 The Bunny
Aerodynamic Design Detail4.1 Airfoil Selection
4.2 Wing Design4.2.1 Wing Sizing, Aspect Ratio, and Taper
4.2.2 Polyhedral and Low-wing Placement4.2.3 Flaps4.2.4 Wing Design Specifications and
Aircraft Lift Curve
4.3 Drag Prediction
Propulsion5.1 Requirements and Objectives5.2 System Selection5.3 Motor Selection
5.4 Propeller Selection5.5 Battery Pack Selection
5.6 Propulsion Performance Predictions5.7 Motor Control
Weight Estimation6.1 Preliminary Estimation6.2 Final Values and Estimates
6.3 Center of Gravity
Stability and Control7.1 Longitudinal Stability7.2 Longitudinal Control7.3 Lateral/Directional Stability and Control7.4 Control Mechanisms
Performance
8.1 Takeoff and Landing8.2 Range and Endurance8.3 Power Available and Power Required8.4 Climb and Glide Performance8.5 Turn Performance
2-12-3
3-13-13-43-4
4-14-4
4-54-74-10
4-144-16
5-15-1
5-25-55-65-75-8
6-16-1
6-3
7-17-57-67-10
8-18-28-48-4
8-6
Section9:
Section 10:
Aopendices
Appendix A:Appendix B:Appendix C:Appendix D:
Slxuctural Design9.1 Materials Selection and Structural Design
9.2 The Wing9.3 The Fuselage9.4 Landing Gear
9.5 Empennage9.6 Loading
Economic Analysis10.1 Cost Estimates10.2 Cost Per Seat Per 1000 Feet
List of References
Stability and Control Analysis MethodsData Base
Primary Deliverables: Figures and Tables
9-19-29-59-79-8
9-9
10-110-3
A-1B-1C-1D-1

List of Figures
Section 1
Figure i. 1:Figure 1.2:Figure 1.3:
External View - isometric
External View - three-viewInternal View
1-31-4
1-5
Figure 2.1: Market Assessment 2-1
Section 3
Figure 3.1:Figure 3.2:Figure 3.3:
Aileron DesignTapered Wing DesignTriple-deck Design
3-23-33-5
Section 4
Figure 4.1:Figure 4.2:Figure 4.3:Figure 4.4:
Figure 4.5:Figure 4.6:Figure 4.7:Figure 4.8:Figure 4.9:Figure 4.10:Figure 4.11:
Figure 4.12:Figure 4.13:Figure 4.14:Figure a. 15:Figure 4.16:Figure 4.17:
C1 vs. Alpha for Various 2-D Airfoil SectionsCd vs. Alpha for Various 2-D Airfoil SectionsC1/Cd vs. Alpha for Various 2-D Airfoil Sections
C1 & Cd vs. Alpha for FX 63-137 AirfoilCL vs. Take-Off Distance (various wing areas)
Relationship Between Induced Drag and TaperInduced Drag Dependency on Aspect RatioThe Bunny Wing Design
CLwing vs. Alpha (with flap deflection)CDwing vs. Alpha (with flap deflection)Wing L/D vs. Alpha (with flap deflection)CLmax vs. Flap Deflection Angle (various cf/c)Max L/D vs. Flap Deflection Angle (various cf/c)
CLwing vs. Alpha (with flap deflection)Aircraft CL vs. Alpha (with flap deflection)
Aircraft Drag PolarAircraft L/D vs. Alpha
4-24-24-34-4
4-64-74-74-94-11
4-124-124-134-13
4-144-164-204-20
Section 5FigureFigureFigure
5.1: Variation in Torque with Current for Astro- 15 Motor5.2: EffectiveVoltage vs. Engine Speed for Astro-15 Motor5.3: Propeller Efficiency vs. Advance Ratio
5-35-35-5
$_ction 6
FigureFigure
6.1: Component Layout Diagram 6-46.2: Weight Balance Diagram 6-5
Section 7
FigureFigureFigureFigureFigure
7.1: Cm and CL vs. Tail Incidence Angle 7-3
7.2: Pitching Moment Coefficient vs. Alpha for forward and aft c.g. 7-47.3: Pitching Moment Coefficient vs. Alpha for trim 7-67.4: Variation in Roll Control Power with Rudder Size Ratio 7-8
7.5: Dihedral Angle and Vertical Tail Area for Desired Roll Control 7-8
Section 8
Figure 8.1: Range and Endurance vs. Velocity 8-3
FigureFigureFigure
8.2: Payloadvs.Range8.3: PowerRequiredandPowerAvailable vs. Cruise Velocity8.4: Power Required and Power Available vs. Velocity
8-38-5
8-5
Section 9
Figure 9.1: Wing LoadingFigure 9.2: I-Beam WedgeFigure 9.3: Side View of Fuselage Structure
Figure 9.4: Engine MountFigure 9.5: Landing Gear - side viewFigure 9.6: Landing Gear - top viewFigure 9.7: Horizontal Tail
Figure 9.8: Vertical TailFigure 9.9: V-n Diagram
9-39-49-69-6
9-79-79-89-8
9-10
Figure 10.1: CPSPK variation for a fully loaded aircraftFigure 10.2: Variation of CPSPK with range for different capacities
10-410-4
Se¢¢ion ITable
Table
Section 2TableTableTable
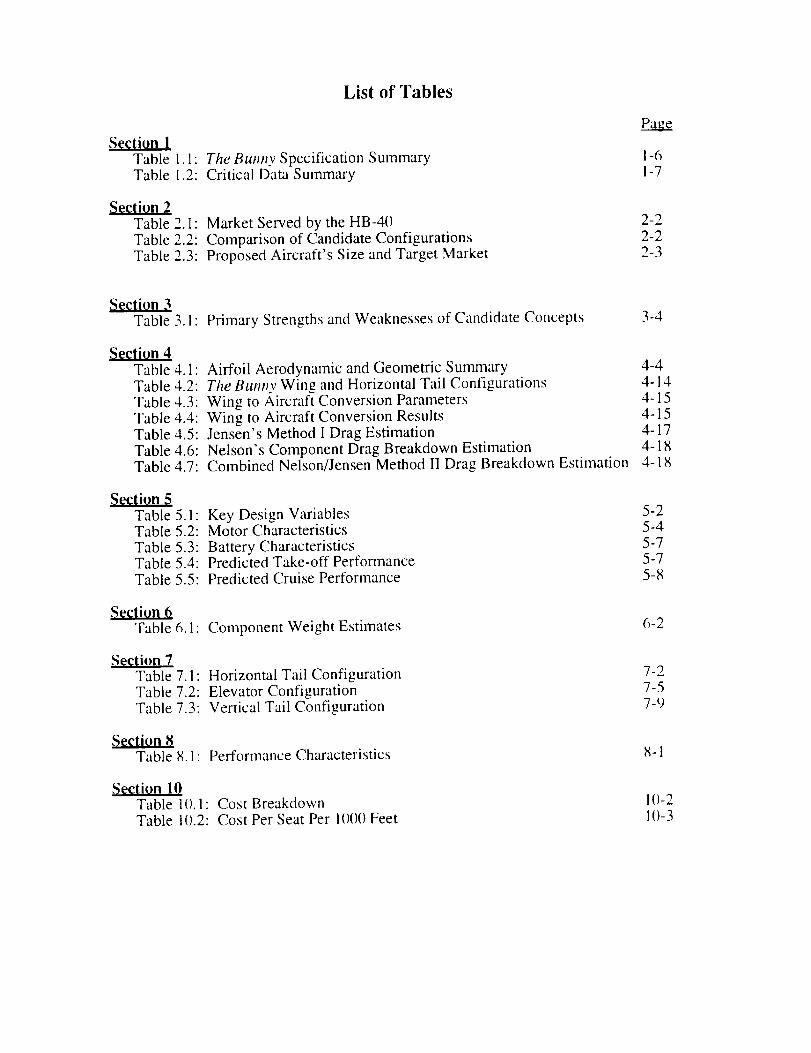
List of Tables
1.1" The Bunny Specification Summary1.2: Critical Data Summary
2.1" Market Served by the HB-4()2.2: Comparison of Candidate Configurations2.3: Proposed Aircraft's Size and Target Market
1-6I-7
2-22-22-3
Section 3
Table 3.1" Primary Strengths and Weaknesses of Candidate Concepts
Section 4
TableTableTableTable
TableTableTable
3-4
4.1: Airfoil Aerodynamic and Geometric Summary 4-44.2: The Bumlv Wing and Horizontal Tail Configurations 4-14
4.3: Wing to Aircraft Conversion Parameters 4-154.4: Wing to Aircraft Conversion Results 4-154.5: Jensen's Method I Drag Estimation 4-17
4.6: Nelson's Component Drag Breakdown Estimation 4-184.7: Combined Nelson/Jensen Method II Drag Breakdown Estimation 4-18
Key Design VariablesMotor Characteristics
Battery CharacteristicsPredicted Take-off PerformancePredicted Cruise Performance
Section 5Table 5.1:Table 5.2:Table 5.3:Table 5.4:Table 5.5:
Section 6Table 6.1" Component Weight Estimates
Section 7Table 7. l: Horizontal Tail Configuration
Table 7.2: Elevator ConfigurationTable 7.3: Vertical Tail Configuration
Section 8Table 8.1" Performance Characteristics
Cost BreakdownCost Per Seat Per l()00 Feet
Section 10Table 1().1:Table 10.2:
5-25-45-75-75-8
6-2
7-27-5
7-9
8-1
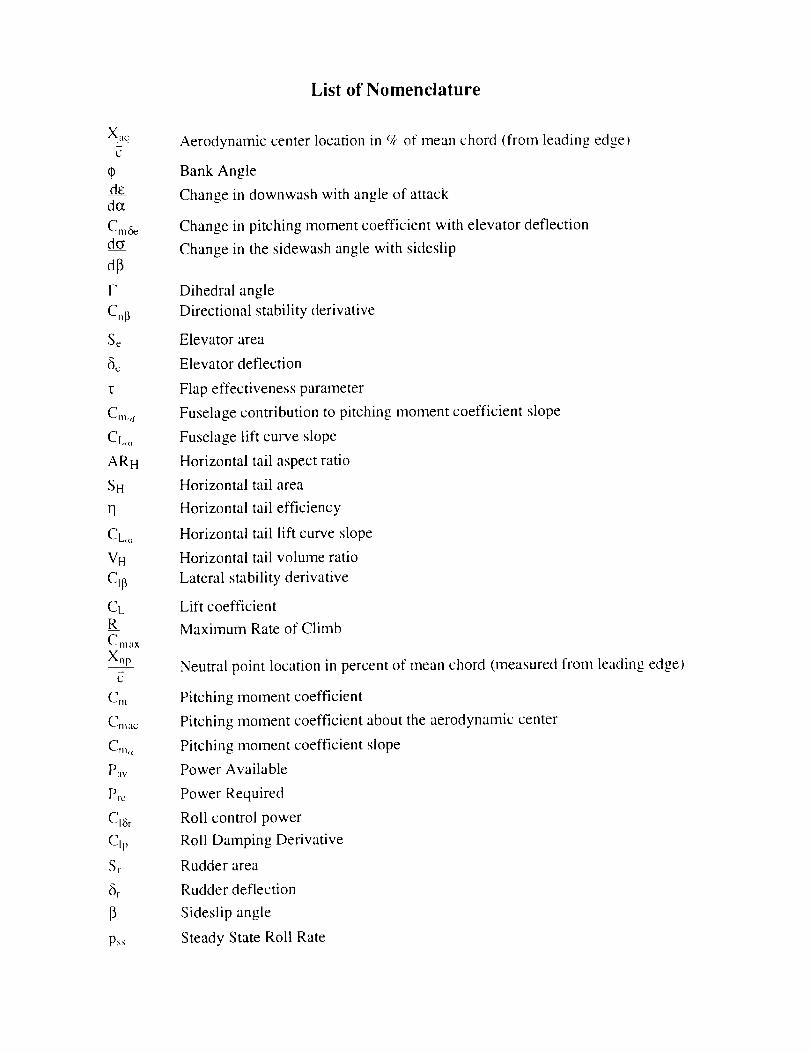
last of Nomenclature
ilC
de
Cm6_da
F
Cnl_
S_
6_
T
Clll<d
CL_,
ARH
SH
n
cL.,
VH
CLRI
Cnl _.IX
Xnp
(_tll
CIllLI¢
C111_c
P_IV
Plt_
Cl_r
CIp
Sr
6r
P_x
Aerodynamic center location in ';_ of mean chord (from leading edge t
Bank Angle
Change in downwash with angle of attack
Change in pitching moment coefficient with elevator deflection
Change in the sidewash angle with sideslip
Dihedral angle
Directional stability derivative
Elevator area
Elevator deflection
Flap effectiveness parameter
Fuselage contribution to pitching moment coefficient slope
Fuselage lift curve slope
Horizontal tail aspect ratio
Horizontal tail area
Horizontal tail efficiency
Horizontal tail lift curve slope
Horizontal tail volume ratio
Lateral stability derivative
Lift coefficient
Maximum Rate of Climb
Neutral point location in percent of mean chord (measured from leading edge)
Pitching moment coefficient
Pitching moment coefficient about the aerodynamic center
Pitching moment coefficient slope
Power Available
Power Required
Roll control power
Roll Damping Derivative
Rudder area
Rudder deflection
Sideslip angle
Steady State Roll Rate
i I -
It
Sv
"Or
CL_v
Vv
AR
Sw
CL.,_
O_slallw
A
Cn_wf
Cn6r
(z
O_L=I)
Art
0tsmll )8
0¢sUtllA/C
c.g.
CD
CDo
CDr_
Cf
cl/c
CLo08
CLo_A/C
CLo_w)8
CLctwt
CLo
CLo)6
CLowf
CLwing
CPSPK
Cr
ct
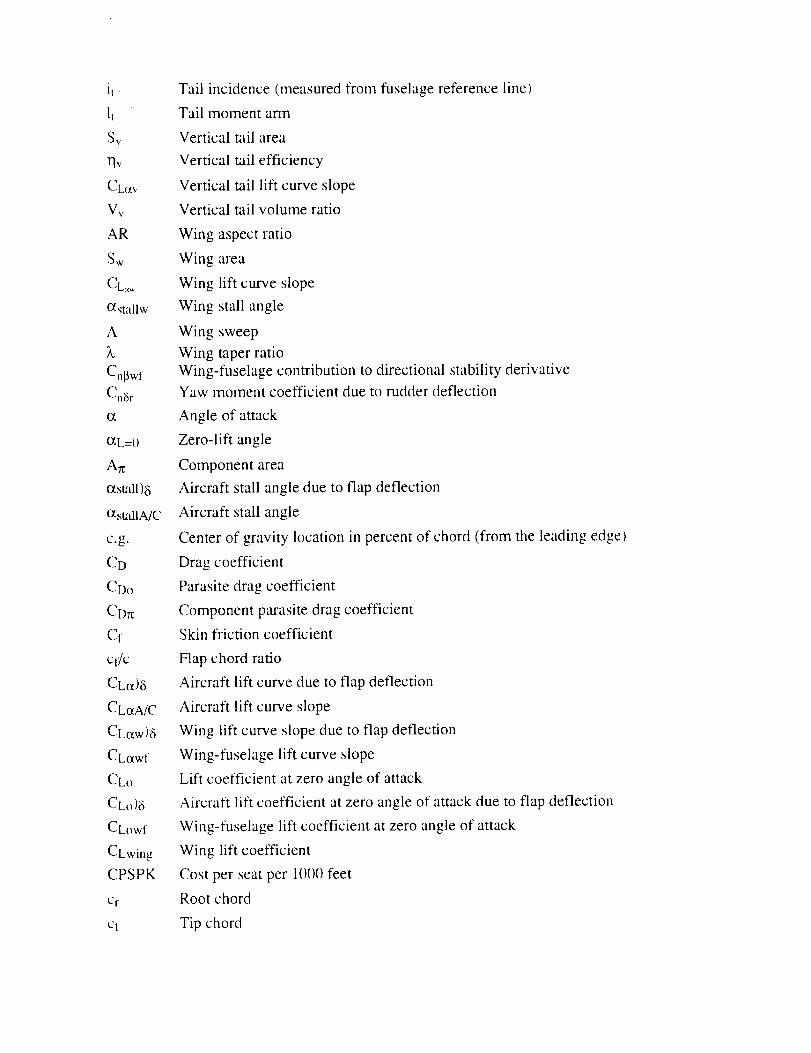
Tail incidence (measured from fuselage reference line)
Tail moment arm
Vertical tail area
Vertical tail efficiency
Vertical tail lift curve slope
Vertical tail volume ratio
Wing aspect ratio
Wing area
Wing lift curve slope
Wing stall angle
Wing sweep
Wing taper ratio
Wing-fuselage contribution to directional stability derivative
Yaw moment coefficient due to rudder deflection
Angle of attack
Zero-lift angle
Component area
Aircraft stall angle due to flap deflection
Aircraft stall angle
Center of gravity location in percent of chord (from the leading edge)
Drag coefficient
Parasite drag coefficient
Component parasite drag coefficient
Skin friction coefficient
Flap chord ratio
Aircraft lift curve due to flap deflection
Aircraft lift curve slope
Wing lift curve slope due to flap deflection
Wing-fuselage lift curve slope
Lift coefficient at zero angle of attack
Aircraft lift coefficient at zero angle of attack due to flap deflection
Wing-fuselage lift coefficient at zero angle of attack
Wing lift coefficient
Cost per seat per 1000 feet
Root chord
Tip chord

ACL
ACLw
dl
_f, df
DOC
Dp
DTO
e
efus
ewing
iw
kcw
Kwf
kwh
L/D
LD
n
PL
P
S
SH/S
SM
Sref
Swet
t
t/c
V
WL
x/c
Change in lift coefficient due to flap deflection
Change in wing lift coefficient due to flap deflection
Fuselage reference diameter
Flap deflection angle
Direct Operating Cost
Propeller diameter
Take-off distance
Oswald efficiency factor
Fuselage efficiency factor
Wing efficiency factor
Wing incident angle
Wing-canard interference factor
Wing-fuselage interference factor
Wing-horizontal tail interference factor
Lift to drag ratio
Landing Distance
Load Factor
Avionics Package Location
Freestream density
Wing planform area
Tail to wing area ratio
Static margin in percent of mean chord
Reference area
Aircraft wetted surface area
Airfoil thickness
Airfoil thickness in %, chord
Freestream velocity
Wing Location
Chordwise location in %, chord
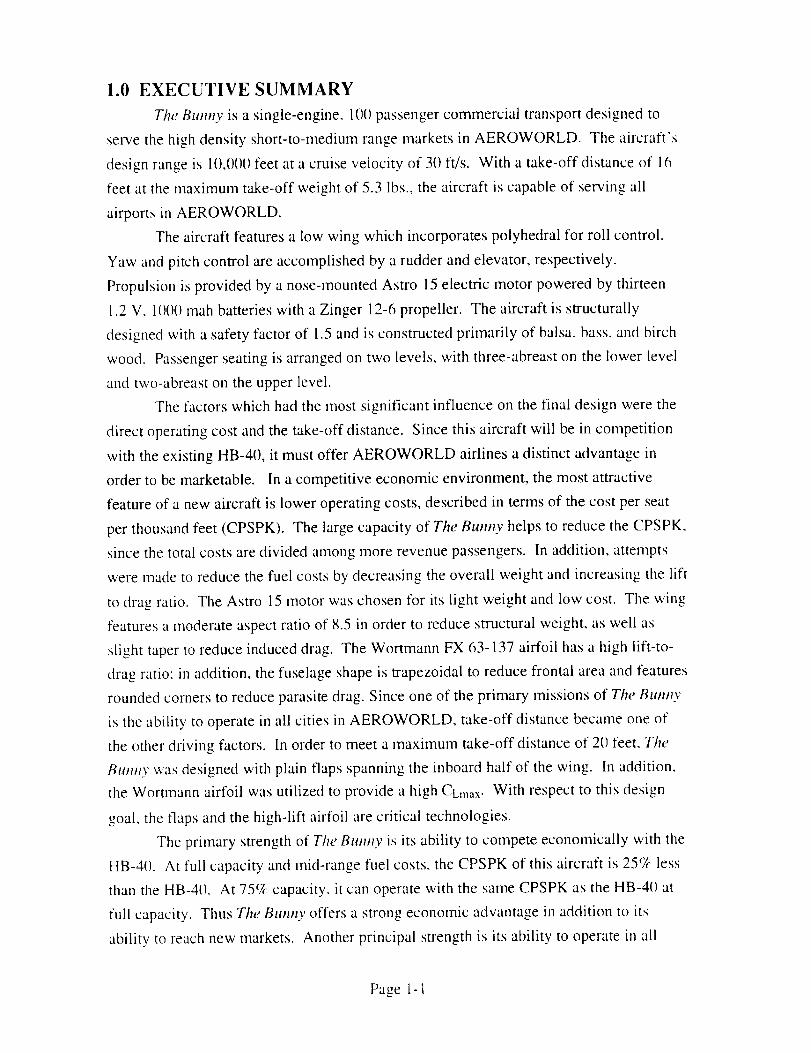
1.0 EXECUTIVE SUMMARY
The Bu#my is a single-engine, 100 passenger commercial transport designed to
serve the high density short-to-medium range markets in AEROWORLD. The aircraft's
design range is lt),0(/I) feet at a cruise velocity of 31) ft/s. With a take-off distance of 16
feet at the maximum take-off weight of 5.3 Ibs., the aircraft is capable of serving all
airports in AEROWORLD.
The aircraft features a low wing which incorporates polyhedral for roll control.
Yaw and pitch control are accomplished by a rudder and elevator, respectively.
Propulsion is provided by a nose-mounted Astro 15 electric motor powered by thirteen
1.2 V, 11)()(1mah batteries with a Zinger 12-6 propeller. The aircraft is structurally
designed with a safety factor of 1.5 and is constructed primarily of balsa, bass, and birch
wood. Passenger seating is arranged on two levels, with three-abreast on the lower level
and two-abreast on the upper level.
The factors which had the most significant influence on the final design were the
direct operating cost and the take-off distance. Since this aircraft will be in competition
with the existing HB-40, it must offer AEROWORLD airlines a distinct advantage in
order to be marketable. In a competitive economic environment, the most attractive
feature of a new aircraft is lower operating costs, described in terms of the cost per seat
per thousand feet (CPSPK). The large capacity of The Bunny helps to reduce the CPSPK,
since the total costs are divided among more revenue passengers. In addition, attempts
were made to reduce the fuel costs by decreasing the overall weight and increasing the lift
to drag ratio. The Astro 15 motor was chosen for its light weight and low cost. The wing
features a moderate aspect ratio of 8.5 in order to reduce structural weight, as well as
slight taper to reduce induced drag. The Wortmann FX 63-137 airfoil has a high lift-to-
drag ratio: in addition, the fuselage shape is trapezoidal to reduce frontal area and features
rounded corners to reduce parasite drag. Since one of the primary missions of The Bulmy
is the ability to operate in all cities in AEROWORLD, take-off distance became one of
the other driving factors. In order to ineet a maximum take-off distance of 20 feet, The
Bu#mv was designed with plain flaps spanning the inboard half of the wing. In addition,
the Wortmann airfoil was utilized to provide a high CL,nax. With respect to this design
goal, the flaps and the high-lift airfoil are critical technologies.
The primary strength of The Bu#my is its ability to compete economically with the
HB-4(). At full capacity and mid-range fuel costs, the CPSPK of this aircraft is 25_,_ less
than the HB-4(). At 75% capacity, it can operate with the same CPSPK as the HB-4(t at
full capacity. Thus The Bunny offers a strong economic advantage in addition to its
ability to reach new markets. Another principal strength is its ability to operate in all
Page 1- 1
airports in AEROWORLD. Also, The Bunny's' two-piece removable wing is an
advantage from a transportability standpoint.
However, The Bulmy also has some weaknesses which may effect its success.
The manufacturing of the wing is more complicated than the competition's due to its
high-lift airfoil and flaps. The inability to precisely manufacture the airfoil shape may
lead to a decrease in aerodynamic performance from the design values. The use of
dihedral instead of ailerons couples the roll control with the lateral/directional stability; as
a result, The Bt_nny's roll response may be slow, although it should feature good stability.
The stability and control requirements also dictated large tail surfaces: these are a
weakness since they cause increased drag.
Page 1-2
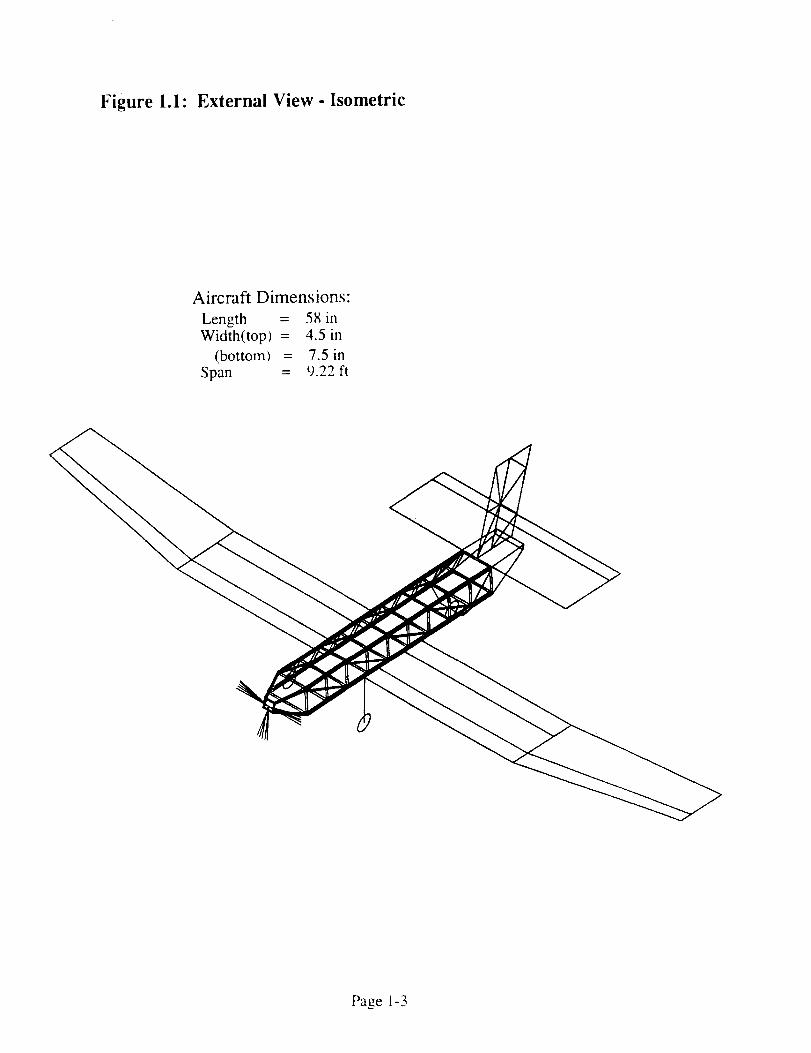
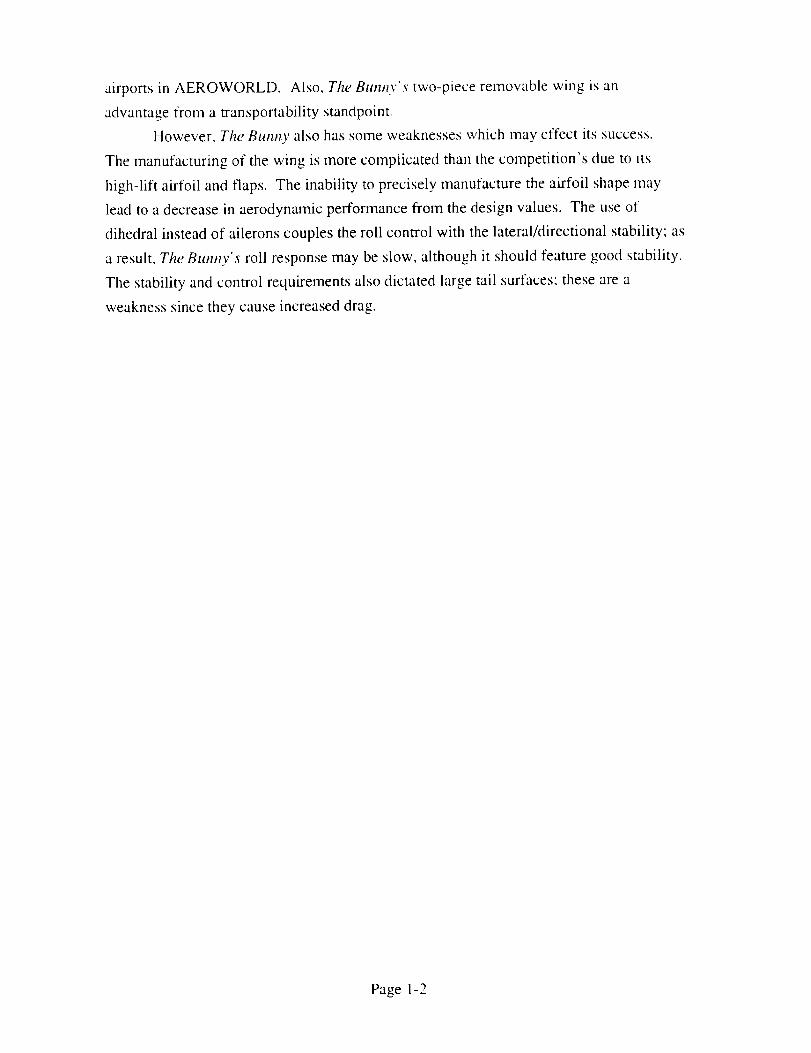
Figure 1.1: External View - Isometric
Aircraft Dimensions:
Length = 58 in
Width(top) = 4.5 in
(bottom/ = 7.5 in
Span = 9.22 ft
Page 1-3
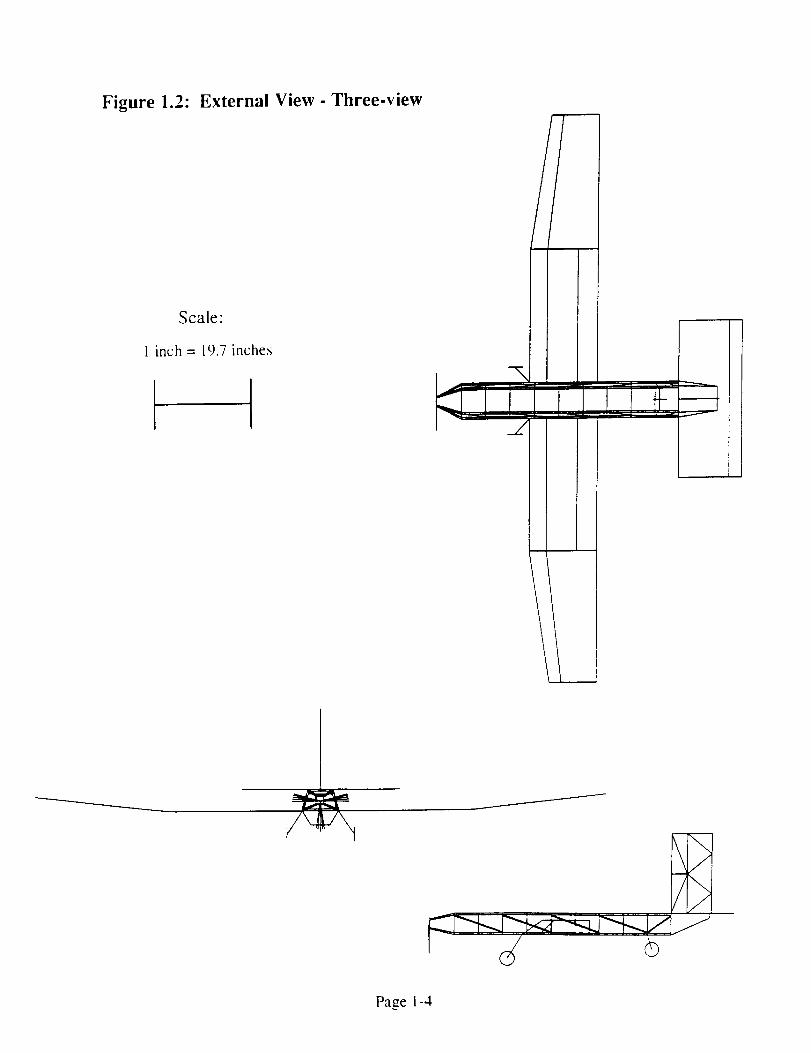
Figure 1.2: External View- Three-view
Scale:
1 inch = 19.7 inches
Page 1-4
Figure 1o3: Internal View
INTERNAL LAYOUT ........ TOP VIEW
O0000000000000000C
000000 I /
0000000000;_
Ladder to lower level Engh
Upper level Passenger CompartmentBatteries anc
,L>e and Mount
Avionics Package
Total length = 58 inchesv
INTERNAL LAYOUT ......... SIDE VIEW
O00000000000000000CZ
oc ooood300000 000000
Upper and Lower LevelPassenger Compartments
Wing carry-through
OO
Engine and Mount
Batteries and Avionics Package
Three passenger rows on the lower deck and two passenger rows on the upper deck
The cockpit and crew are situated below the battery pack and avionics and are separated from the
passengers by a main bulkhead
Page l-5
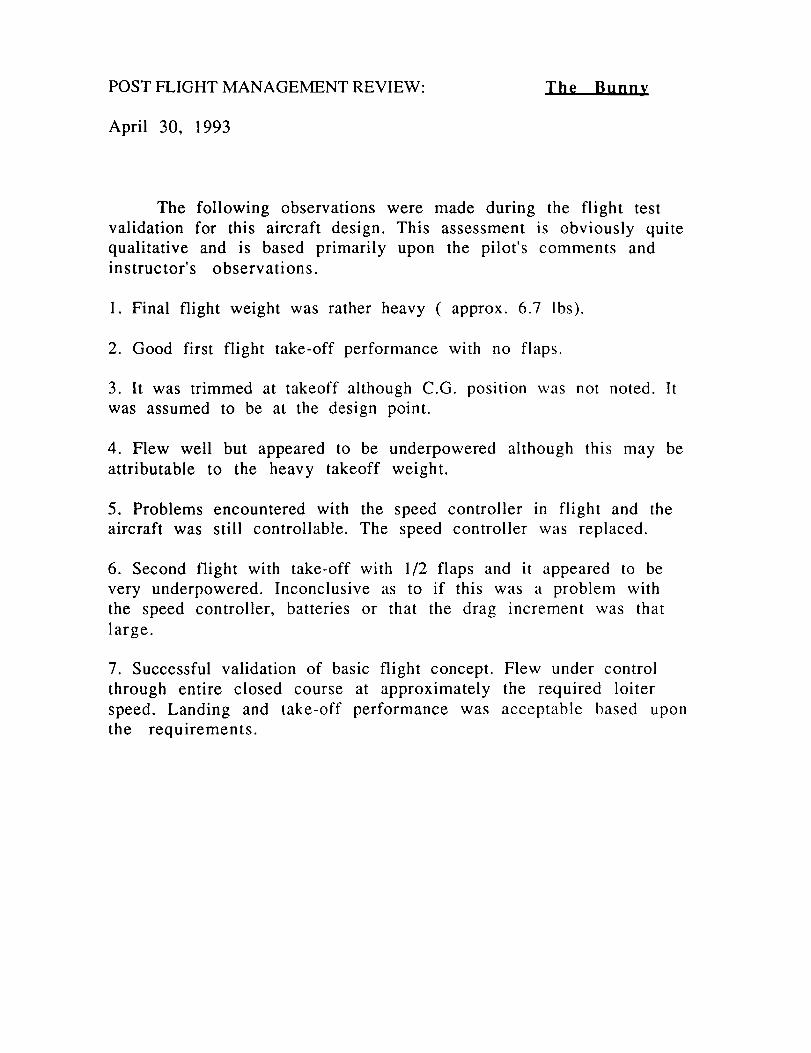
POST FLIGHT MANAGEMENT REVIEW: The Bunny
April 30, 1993
The following observations were made during the flight test
validation for this aircraft design. This assessment is obviously quite
qualitative and is based primarily upon the pilot's comments andinstructor's observations.
1. Final flight weight was rather heavy ( approx. 6.7 Ibs).
2. Good first flight take-off performance with no flaps.
3. It was trimmed at takeoff although C.G. position was not noted. It
was assumed to be at the design point.
4. Flew well but appeared to be underpowered although this may be
attributable to the heavy takeoff weight.
5. Problems encountered with the speed controller in flight and the
aircraft was still controllable. The speed controller was replaced.
6. Second flight with take-off with 1/2 flaps and it appeared to be
very underpowered. Inconclusive as to if this was a problem with
the speed controller, batteries or that the drag increment was that
large.
7. Successful validation of basic flight concept. Flew under control
through entire closed course at approximately the required loiter
speed. Landing and take-off performance was acceptable based upon
the requirements.
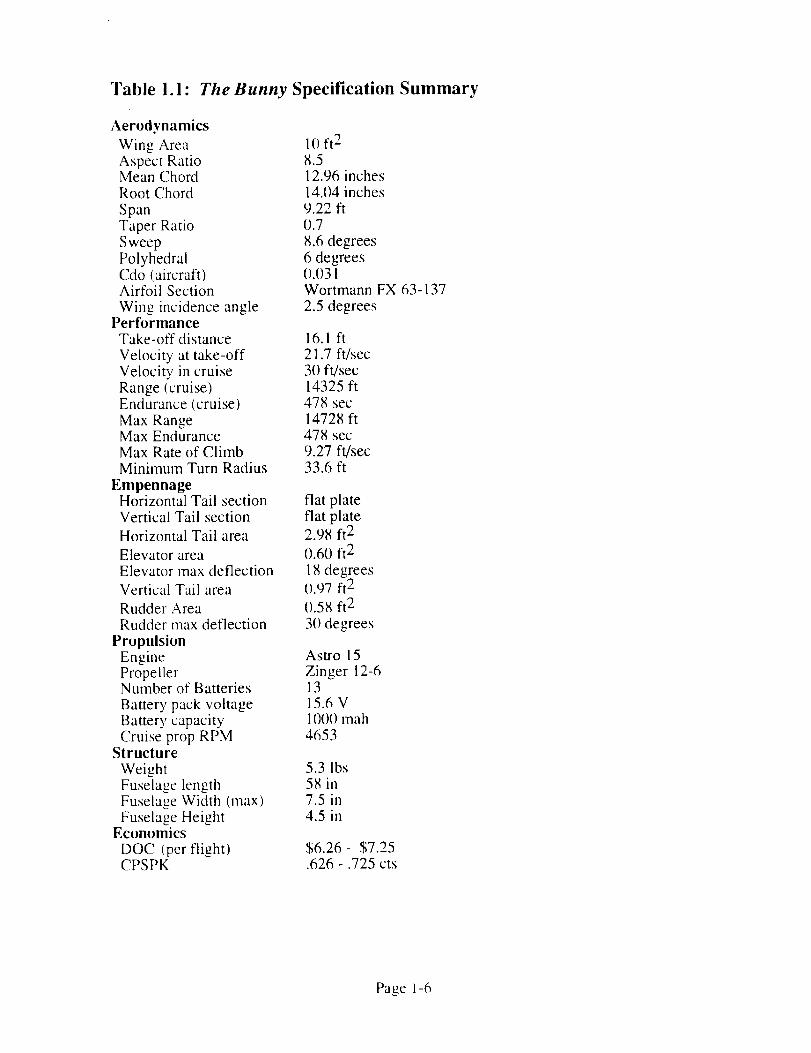
Table l.l: The Bunny Specification Summary
Aerodynamics
Wing Area 1() ft 2
Aspect Ratio X.5Mean Chord 12.96 inchesRoot Chord 14.04 inches
Span 9.22 ftTaper Ratio 1).7Sweep 8.6 degrees
Polyhedral 6 degreesCdo (aircraft) 0.031Airfoil Section Wortmann FX 63-137
Wing incidence angle 2.5 degreesPerformance
Take-off distance 16.1 ft
Velocity at take-off 21.7 ft/secVelocity in cruise 30 ft/sec
Range (cruise) 14325 ftEndurance (cruise) 478 sec
Max Range 14728 ftMax Endurance 478 secMax Rate of Climb 9.27 ft/sec
Minimum Turn Radius 33.6 ft
EmpennageHorizontal Tail section flat plateVertical Tail section flat plate
Horizontal Tail area 2.98 ft 2
Elevator area 0.60 ft 2
Elevator max deflection 18 degreesVertical Tail area I).97 ft 2
Rudder Area I).58 ft 2
Rudder max deflection 30 degrees
PropulsionEngine Astro 15Propeller Zinger 12-6Number of Batteries 13
Battery pack voltage 15.6 VBattery capacity 1()00 mahCruise prop RPM 4653
Structure
Weight 5.3 lbsFuselage length 58 illFuselage Width (max) 7.5 inFuselage Height 4.5 in
Economics
DOC (per flight) $6.26 - $7.25CPSPK .626 - .725 cts
Page 1-6
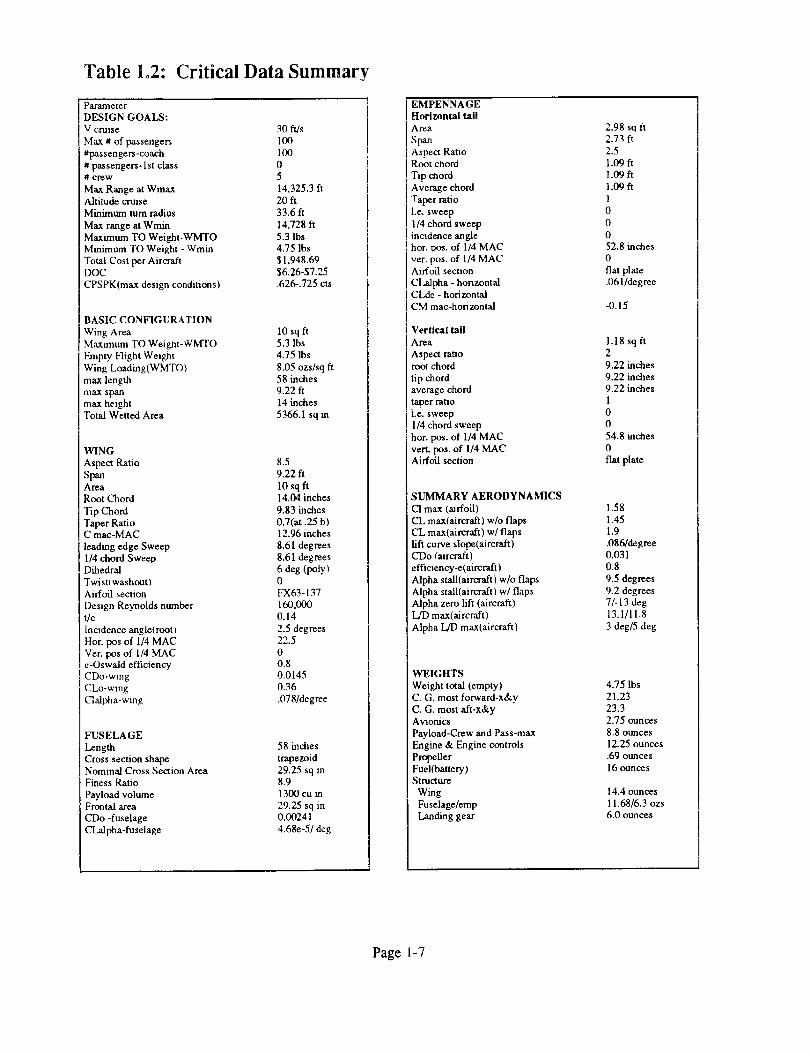
Table 1,2: Critical Data Summary
ParameterDESIGN GOALS:
V crmse 30 ft/s
Max # of passengers 100
#passengers-coach 100
# passengers-1st class 0# crew 5
Max Range at Wmax 14,325.3 ftAltitude crmse 20 ft
Minimum turn radius 33.6 ft
Max range at Wmin 14,728 ft
Maximum TO Weight-WMTO 5.3 lbsMinmaum TO Weight - Wmin 4.75 lbs
Total Cost per Aircraft $1,948.69DOC $6.26-$7.25
CPSPK(max design conditions) .626-.725 cts
BASIC CONFIGURATION
Wing Area 10 sq ft
Maxunum TO Weigl_t-WMTO 5.3 lbs
Empty Flight Weight 4.75 lbs
Wing Loading(WMTO) 8.05 ozs/sq ft
max length 58 inches
max span 9.22 ftmax height 14 inches
Total Wetted Area 5366.1 sq m
WING
Aspect Ratio 8.5
Span 9.22 ft
Area 10 sq ftRoot Chord 14.04 inches
Tip Chord 9.83 inchesTaper Ratio 0.7(at .25 b)C mac-MAC 12.96 inches
leading edge Sweep 8.61 degrees
1/4 chord Sweep 8,61 degreesDihedral 6 deg (poly)
Twist(washout) 0Airfoil section FX63-137
Design Reynolds number 160,000
t/c 0.14
inodence angle(rooU 2.5 degrees
Hor. pos of 1/4 MAC 22.5
Vet. pos of 1/4 MAC 0e-Oswald efficiency 0.8CDo-wmg 0.0145
CLo-wmg 0.36
_alpha-wing .078/degree
FUSELAGE
Length 58 inches
Cross section shape trapezoidNominal Cross Section Area 29.25 sq in
Finess Ratio 8.9
Payload volume 1300 cu inFrontal area 29.25 sq in
CDo -fuselage 0.00241
CLalpha-fuselage 4.68e-5/deg
EMPENNAGE
Horizontal tail
Area
SpanAsDect Ratio
;'.oot claord
Tip chord
Average chord
Taper rataoI.e. sweep
1/4 chord sweepincadence anglehot. oos. of 1/4 MAC
ver. pos. of 1/4 MACAirfoil section
CLalpha - horizontalCLde - horizontal
CM mac-horizontal
Vertical tall
Area
Aspect rattoroot chord
tip chordaverage chord
taper raUo
I.e. sweep
1/4 chord sweep
hor. pos. of 1/4 MAC
vert. pos. of 1/4 MACAirfoil section
SUMMARY AERODYNAMICS
CI max (anfoil)
CL max(aircraft) w/o flapsCL max(aircraft) w/flaps
lift curve slope(aircraft)
CDo (aircraft)
effi caency-e(aircraft )
Alpha stall(aircraft) w/o flaps
Alpha stall(aircraft) w/flaps
Alpha zero lift (aircraft)
L/D max(aircraft)
Alpha L/D max(aircraft)
WEIGHTS
Weight total (empty)
C. G. most forward-x&yC. G. most aft-x&y
Avionics
Payload-Crew and Pass-max
Engine & Engine controls
Propeller
Fuel(battery)Structure
Wing
Fuselage/crop
Landing gear
2.98 sq ft2.73 ft2.5
1.09 ft1.09 ft
1.09 ft1
0
0
052.8 inches
0
flat plate.061/degree
-0.15
1.18 sq ft2
9.22 inches9.22 inches
9.22 inches
1
0
0
54.8 inches
0
flat plate
1.58
1.45
1.9
.086/degree0.031
0.8
9.5 degrees
9.2 degrees
7/-13 deg13.1/11.8
3 deg/5 deg
4.75 lbs
21.23
23.3
2.75 ounces8.8 ounces
12.25 ounces
.69 ounces
16 ounces
14.4 ounces
11.68/6.3 ozs
6.0 ounces
Page 1-7
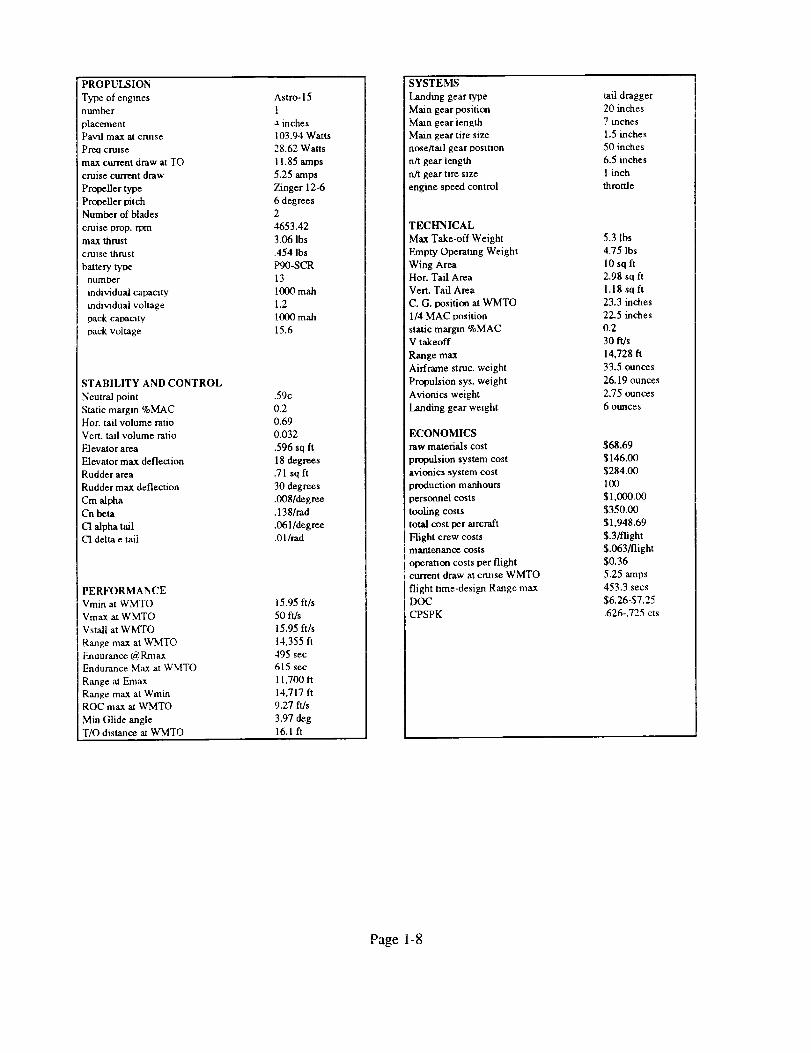
PROPULSION
Type of enginesnumber
placement
Pavil max at cm_se
Prea cruise
max current draw at TO
cruise current draw
PmpeUer type
Prooeller oitch
Number of blades
cruise prop. rl:nn
max thrust
cruise thrust
battery tyoenumber
individual capacaty
mdlvmduaJ voltage
oack caoaoty
pack voltage
STABILITY AND CONTROL
Neutral point
Static margin %MAC
Hor. tail volume ratio
Vert. tail volume ratio
Elevator area
Elevator max deflection
Rudder area
Rudder max deflection
Cm alpha
Cn beta
C1 alpha tail
C1 delta e tail
PERFORMANCE
Vmin al WMTO
Vmax at WMTO
VstaU at WMTO
Range max at WMTO
Enaumnce @RmaxEndurance Max at _,_,.'MTO
Range at Emax
Range max at WminROC max at WMTO
Min Glide angle
T/O distance at WMTO
Astro-15
1
.x inches
103.94 Watts
28.62 Watts
11.85 amps
5.25 amps
Zinger 12-6
6 degrees2
4653.42
3.06 lbs
.454 lbs
P90-SCR
13
1000 mah
1.2
1000 mah
15.6
.59c
0.2
0.69
0.032
.596 sq ft
18 degrees
.71 sq ft
30 degrees
.O08/degree
.138/rad
.061/degree
.01/tad
15.95 ft/s
50 ftls
15.95 ft/s
14,355 fl
495 sec
615 sec
11,700 fl
14,717 ft
9.27 ft/s
3.97 deg
16.1 ft
SYSTEMS
Landing gear type
Main gear position
Mmn gear length
Main gear tire size
nose/tad gear posmon
n/t gear length
n/t gear t]re size
engine speed control
TECHNICAL
Max Take-off Weight
Empty Operating Weight
Wing Area
Hor. Tail Area
Vert. Tail Area
C. G. position at WMTO
1/4 MAC oosition
static margm %MACV takeoff
Range max
Airframe stmc. weight
Propulsion sys. weight
Avionics weight
Landing gear weight
ECONOMICS
raw materials cost
propulsion system cost
avionics system cost
production manhours
personnel costs
tooling costs
total cost per aircraft
Flight crew costs
mantenance costs
operation costs per flight
current draw at cmtse WMTO
flight time-design Range max
DOC
CPSPK
tad dragger
20 inches
7 mcnes
1.5 inches
50 inches
6.5 inches
1 inch
throttle
5.3 lbs
4.75 lbs
10sq ft
2.98 sq fl
1.18 sq ft
23.3 inches
22.5 inches
0.2
30 ft/s
14,728 ft
33.5 ounces
26.19 ounces
2.75 ounces
6 ounces
$68.69
$146.00
$284.00
100
$1.000.00
$350.0O
$1,948.69
$.3,fflight
$.063/flight
$0.36
5.25 amps
453.3 secs
$6.26-$7.25
.626-.725 cts
Page 1-8
2.0 MISSION DEFINITION
In order to be competitive in the commercial aircraft industry, a new airplane
concept must offer the airlines a product which is better than what is currently on the
market. This "'edge" can be manifested through design characteristics such as greater
capacity or longer range, or economic factors such as lower operating cost. A market
study which identifies which areas of the market are not currently being served will help
identify a target market, and study of the current aircraft will help determine potential
improvements. The results of these studies can then be used to define a mission for the
aircraft and specify the design requirements and objectives.
2.1 Market Analysis
Data for the AEROWORLD market was supplied by G-Dome Enterprises
(Reference 1). The data was obtained in terms of range between cities and the number of
passengers traveling between each pair of cities. A standard model for the frequency of
flights between each city pair was employed, and this information was used to reduce the
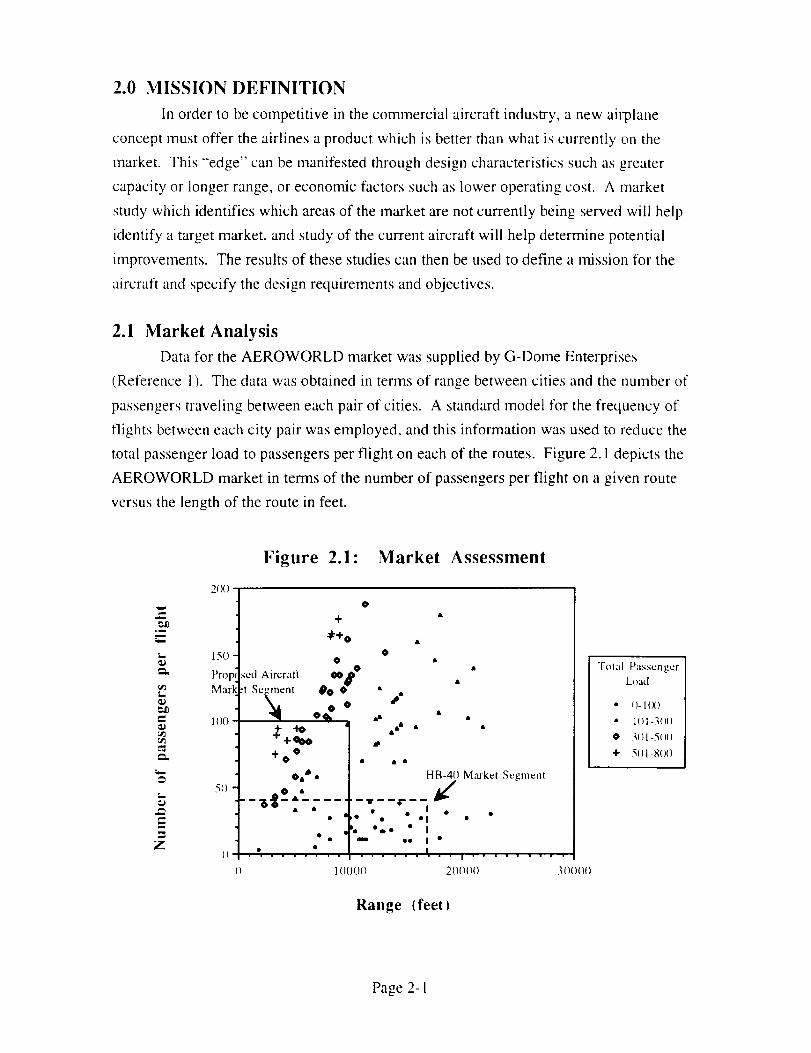
total passenger load to passengers per flight on each of the routes. Figure 2.1 depicts the
AEROWORLD market in terms of the number of passengers per flight on a given route
versus the length of the route in feet.
w
o_
¢,,,.
t_
e_
t_
_0
¢'I
_=
Z
200
150
Pro]
Mart
1( )0
511
Figure 2.1: Market Assessment
O
÷
41--I-o
o
_ed Aircraft _B °
Se_en! 00 O- • _.
÷o o
OA d' •
I) •, , , , , , , , ,
() l (l(10()
A
(°o• • I
• • J •
' ' " " ' ' J' " ' U ' • "
20()()()
HB-4(I Marke/ Segment
Range (feet)
Total Passenger
.l,0()(1(1
LI )_.ld
• I)- 1(_()
• l()1-3()()
0 gl)l-5(H)
+ 5{)1-8()()
Page 2- I
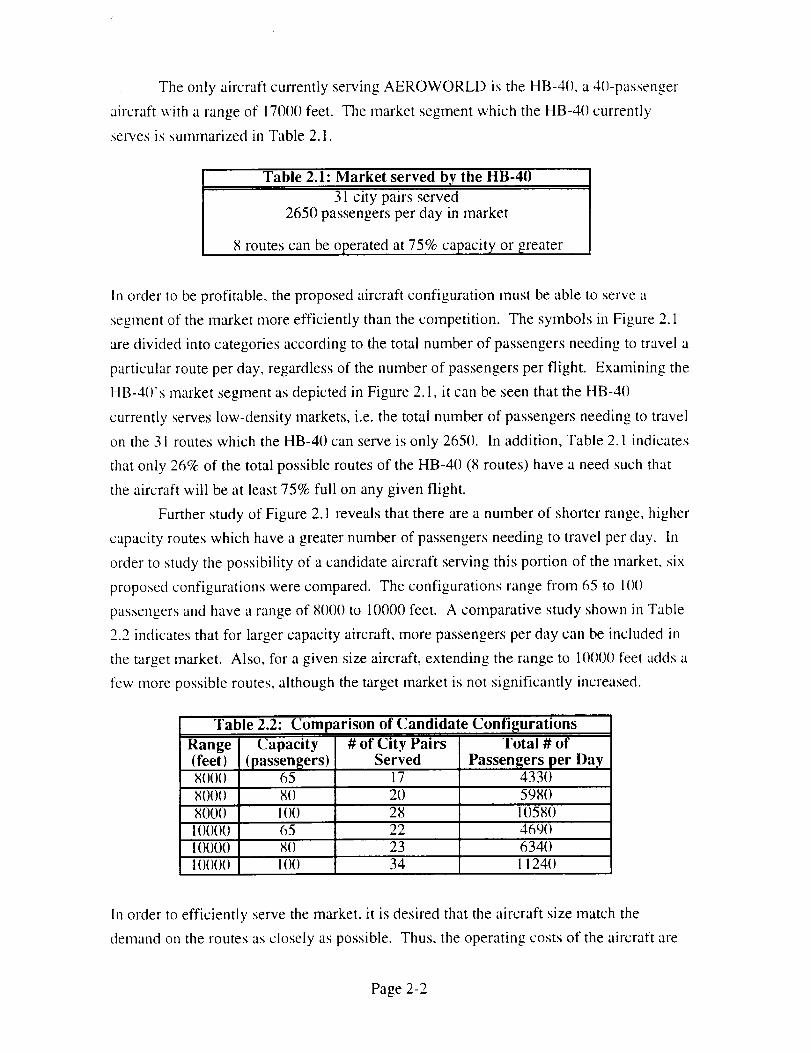
The only aircraft currently serving AEROWORLD is the HB-40, a 4()-passenger
aircraft with a range of 170()0 feet. The market segment which the HB-4() currently,
serves is summarized in Table 2.1.
Table 2.1: Market served by the HB-40
31 city pairs served
2650 passengers per day in market
8 routes can be operated at 75% capacity or greater
In order to be profitable, the proposed aircraft configuration must be able to serve a
segment of the market more efficiently than the competition. The symbols in Figure 2.1
are divided into categories according to the total number of passengers needing to travel a
particular route per day, regardless of the number of passengers per flight. Examining the
HB-4()'s market segment as depicted in Figure 2.1, it can be seen that the HB-40
currently serves low-density markets, i.e. the total number of passengers needing to travel
on the 31 routes which the HB-40 can serve is only 2650. In addition, Table 2.1 indicates
that only 26% of the total possible routes of the HB-40 (8 routes) have a need such that
the aircraft will be at least 75% full on any given flight.
Further study of Figure 2.1 reveals that there are a number of shorter range, higher
capacity routes which have a greater number of passengers needing to travel per day. 111
order to study the possibility of a candidate aircraft serving this portion of the market, six
proposed configurations were cornpared. The configurations range from 65 to 1()()
passengers and have a range of 8000 to 10000 feet. A cornparative study shown in Table
2.2 indicates that for larger capacity aircraft, more passengers per day can be included in
the target market. Also, for a given size aircraft, extending the range to 10000 feet adds a
few more possible routes, although the target market is not significantly increased.
Table 2.2: Comparison of Candidate Configurations
Range(feet)
80()()
8000
8000
100OO
10000
1000()
Capacity
(passengers)65
80
100
65
8()
I()()
# of City PairsServed
17
20
28
22
23
34
Total # of
Passengers per Day4330
5980
105804690634()1! 24()
In order to efficiently serve the market, it is desired that the aircraft size match the
demand on the routes as closely as possible. Thus, the operating costs of the aircraft are
Page 2-2
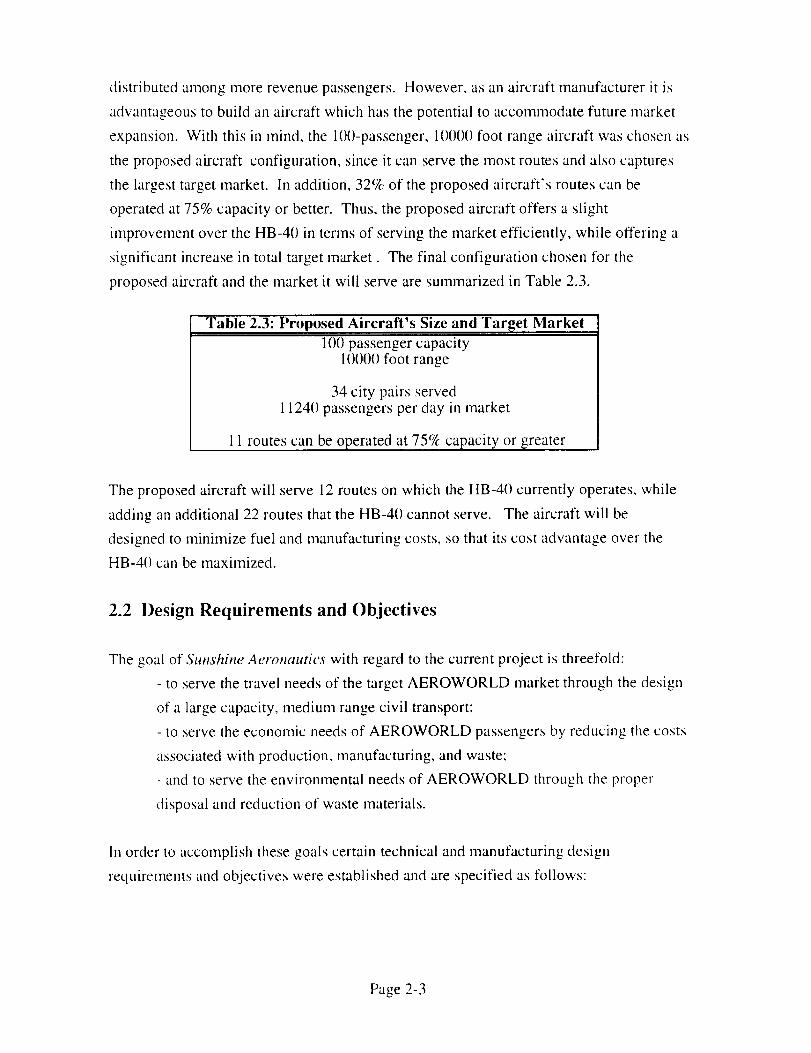
distributedamongmorerevenuepassengers.However,asanaircraftmanufacturerit is
advantageousto buildanaircraftwhich hasthepotentialto accommodatefuture market
expansion.With this in mind, the 100-passenger,10000foot rangeaircraftwaschosenas
theproposedaircraft configuration,sinceit canservethemostroutesandalsocaptures
thelargesttargetmarket. In addition,32% of theproposedaircraft's routescanbe
operatedat75%capacityor better. Thus,theproposedaircraftoffers a slight
improvementover theHB-40 in termsof servingthemarketefficiently, while offering a
significantincreasein total targetmarket. Thefinal configurationchosenfor the
proposedaircraftandthemarketit will servearesummarizedin Table2.3.
Table 2.3: Proposed Aircraft's Size and Target Market
100 passenger capacity!001)1) foot range
34 city pairs served11241) passengers per day in market
11 routes can be operated at 75% capacity or greater
The proposed aircraft will serve 12 routes on which the HB-40 currently operates, while
adding an additional 22 routes that the HB-40 cannot serve. The aircraft will be
designed to minimize fuel and manufacturing costs, so that its cost advantage over the
HB-4() can be maximized.
2.2 Design Requirements and Objectives
The goal of Sunshine Aeronautics with regard to the current project is threefold:
- to serve the travel needs of the target AEROWORLD market through the design
of a large capacity, medium range civil transport:
- to serve the economic needs of AEROWORLD passengers by reducing the costs
associated with production, manufacturing, and waste:
- and to serve the enviromnental needs of AEROWORLD through the proper
disposal and reduction of waste materials.
In order to accomplish these goals certain technical and manufacturing design
requirements and objectives were established and are specified as follows:
Page 2-3
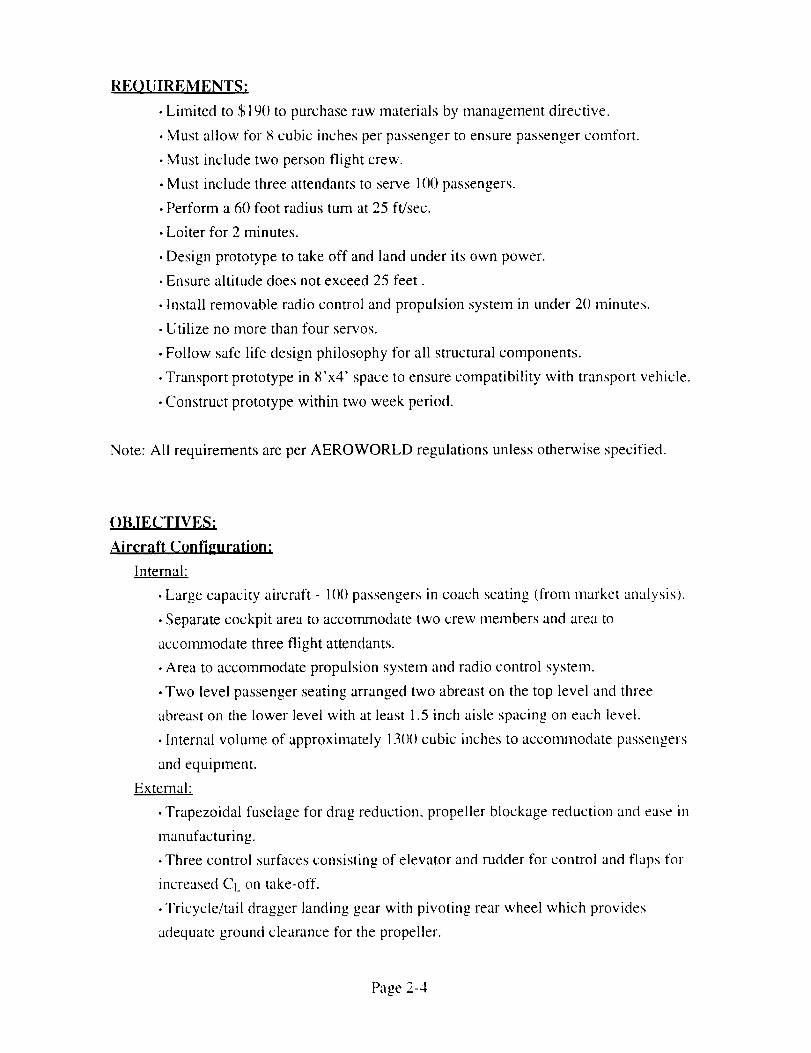
REOUIREMENTS:
• Limited to $190 to purchase raw materials by management directive.
• Must allow for 8 cubic inches per passenger to ensure passenger comfort.
• Must include two person flight crew.
• Must include three attendants to serve 100 passengers.
• Perform a 60 foot radius turn at 25 ft/sec.
• Loiter for 2 minutes.
• Design prototype to take off and land under its own power.
Ensure altitude does not exceed 25 feet.
Install removable radio control and propulsion system in under 20 minutes.
Utilize no more than four servos.
Follow safe life design philosophy for all structural components.
Transport prototype in 8'x4' space to ensure compatibility with transport vehicle.
Construct prototype within two week period.
Note: All requirements are per AEROWORLD regulations unless otherwise specified.
()B,IECTIVE$;
Aircraft Configuration:
Internal:
• Large capacity aircraft - 1()0 passengers in coach seating (from market analysis).
• Separate cockpit area to accoxTunodate two crew members and area to
accommodate three flight attendants.
• Area to accommodate propulsion system and radio control system.
• Two level passenger seating arranged two abreast on the top level and three
abreast on the lower level with at least 1.5 inch aisle spacing on each level.
• Internal volume of approximately 130(I cubic inches to accommodate passengers
and equipment.
External:
• Trapezoidal fuselage for drag reduction, propeller blockage reduction and ease in
manufacturing.
• Three control surfaces consisting of elevator and rudder for control and flaps for
increased Ct, on take-off.
• Tricycle/tail dragger landing gear with pivoting rear wheel which provides
adequate ground clearance for the propeller.
Page 2-4
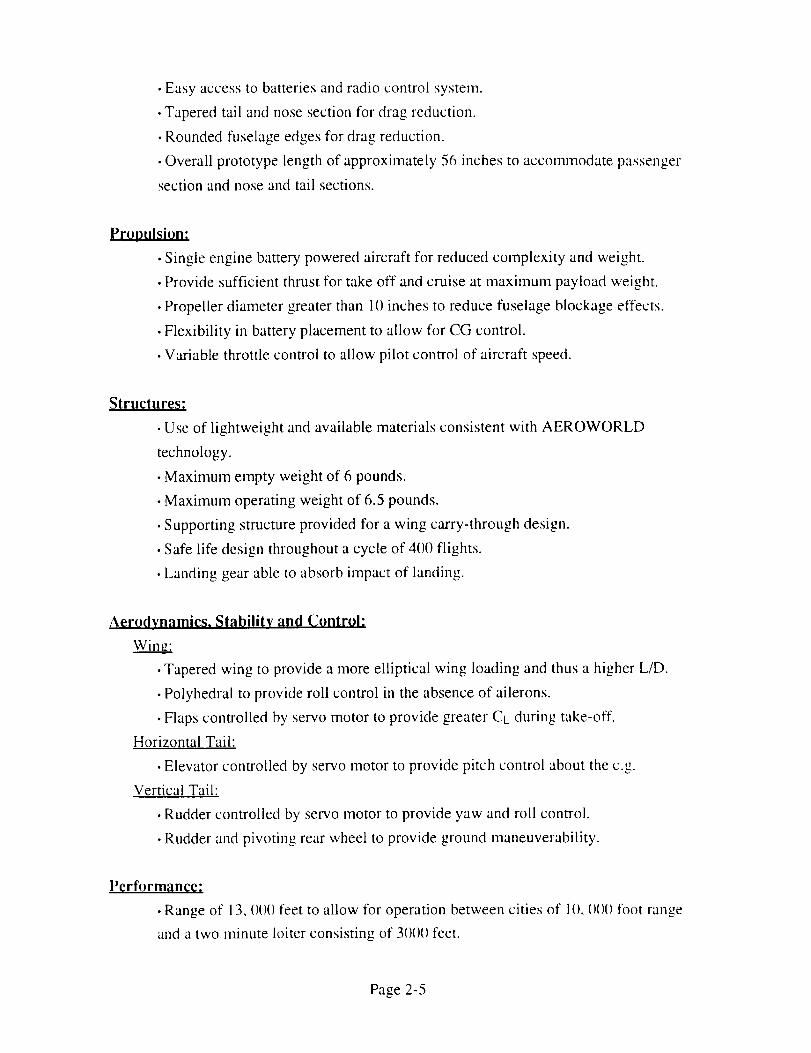
• Easy access to batteries and radio control system.
•Tapered tail and nose section for drag reduction.
• Rounded fuselage edges for drag reduction.
• Overall prototype length of approximately 56 inches to accommodate passenger
section and nose and tail sections.
Propulsion:
• Single engine battery powered aircraft for reduced complexity and weight.
• Provide sufficient thrust for take off and cruise at maximum payload weight.
• Propeller diameter greater than 10 inches to reduce fuselage blockage effects.
• Flexibility in battery placement to allow for CG control.
• Variable throttle control to allow pilot control of aircraft speed.
Structur¢_;
• Use of lightweight and available materials consistent with AEROWORLD
technology.
• Maximum empty weight of 6 pounds.
• Maximum operating weight of 6.5 pounds.
• Supporting structure provided for a wing carry-through design.
• Safe life design throughout a cycle of 400 flights.
• Landing gear able to absorb impact of landing.
Aerodynamics. Stability and Control:
Win_."
• Tapered wing to provide a more elliptical wing loading and thus a higher L/D.
• Polyhedral to provide roll control in the absence of ailerons.
• Flaps controlled by servo motor to provide greater CL during take-off.
Horizontal Tail:
• Elevator controlled by servo motor to provide pitch control about the e.g.
Vertical Tail:
• Rudder controlled by servo motor to provide yaw and roll control.
• Rudder and pivoting rear wheel to provide ground maneuverability.
Performance:
• Range of 13, ()()() feet to allow for operation between cities of 1(). ()()() foot range
and a two minute loiter consisting of 31)1)() feet.
Page 2-5
• Target cruise speed of 30 ft/s.
• Maximum take off distance of 20 feet to serve all cities in target market.
• Minimum take off speed of 15-20 ft/s.
• Maximum airfoil L/D of approximately 30 with flaps deflected.
Cost and Manufacturine:
• CPSPK 25% less than that of the HB-40.
• Projected total cost of prototype $2, 225.
• Maximum total person hours of 1()0.
The final design did not require any exceptions to the design requirements and objectives.
Page 2-6
3.0 CONCEPT SELECTION
For a given aircraft mission and specified design requirements and objectives,
there are many different concepts which are appropriate. Before preliminary design
studies can commence, each candidate concept must be evaluated in order to determine
the final concept. Strengths and weaknesses of each concept must be discussed so that
the final concept represents the best possible configuration. The final concept for The
BunJ_y is a hybrid of three different concepts which were evaluated as discussed below.
3.1 Aileron Design
One of the first designs considered was a high-wing aircraft with ailerons,
illustrated in Figure 3.1. Passenger seating was arranged three-abreast on a single level.
Dihedral was not incorporated due to the use of ailerons in combination with the high-
wing design. The wing was of rectangular planform with a moderate aspect ratio.
The primary advantage of this design was the fuselage volume efficiency offered
by its three-abreast seating configuration. For a given capacity, seating passengers three-
abreast requires less aisle space than a two-abreast design. A four-abreast configuration
would require even less aisle space, but would result in a short, wide fuselage, which
could cause stability problems. Another advantage of this concept was the use of
ailerons, which ensure proper roll control without excessive lateral stability, as can be the
case for a dihedral design. However, there were also several important disadvantages. In
order to accommodate 100 passengers as dictated by the aircraft's mission, the fuselage
was very long, necessitating a stronger fuselage structure and therefore adding weight.
In addition, the design requirement of a maximum take-off distance of 20 feet may
require the use of flaps. However, flaps were not possible on this design with the
standard 4-channel radio transmitters, since the ailerons, rudder, elevator and speed
control occupy all available cha.mels.
3.2 Tapered Wing Design
Another candidate concept was a high-wing, tapered planform design, shown in
Figure 3.2. Seating for this concept was arranged two-abreast on two levels. The
fuselage shape was trapezoidal, with a tapered lower deck. The nose and tail sections
were also tapered. A removable, one-piece wing was employed.
This concept offered several key advantages. The tapered wing offered less
induced drag for improved aerodynamic performance. Although the taper would require
airfoil sections to be of different sizes, this was not seen as a significant manufacturing
problem. The trapezoidal fuselage with its rounded edges was seen as a potential
Page 3-1
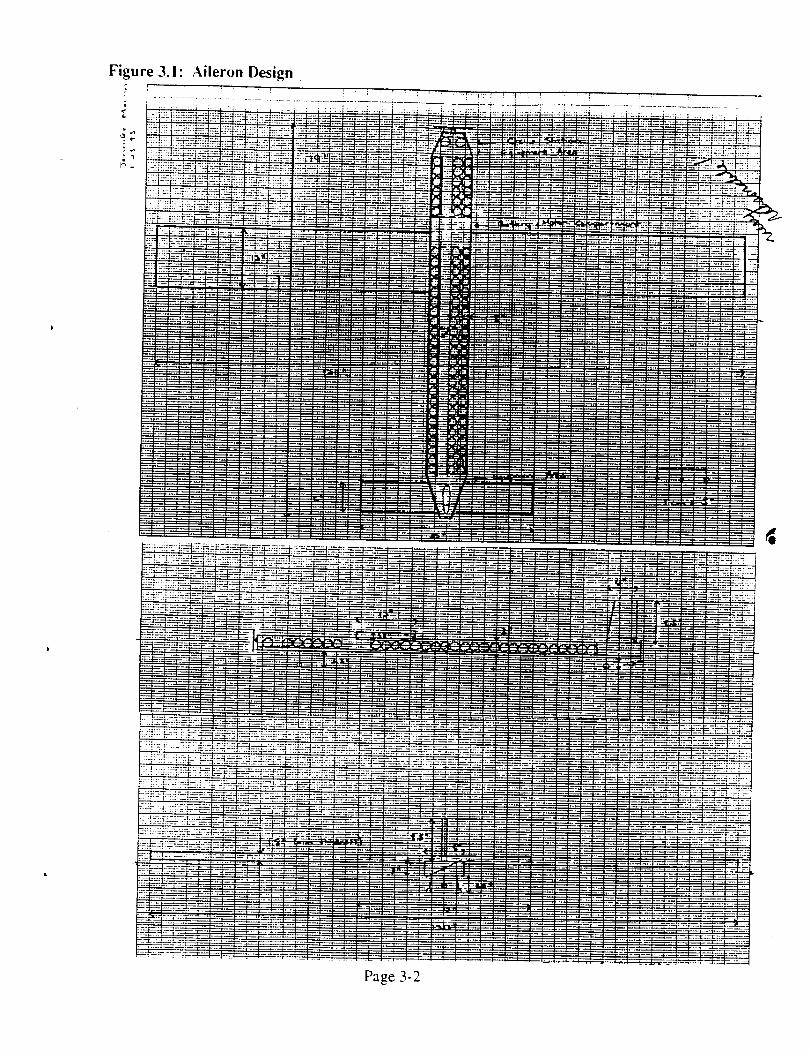
Figure 3.1: Aileron Design: i ! ....
Page 3-2
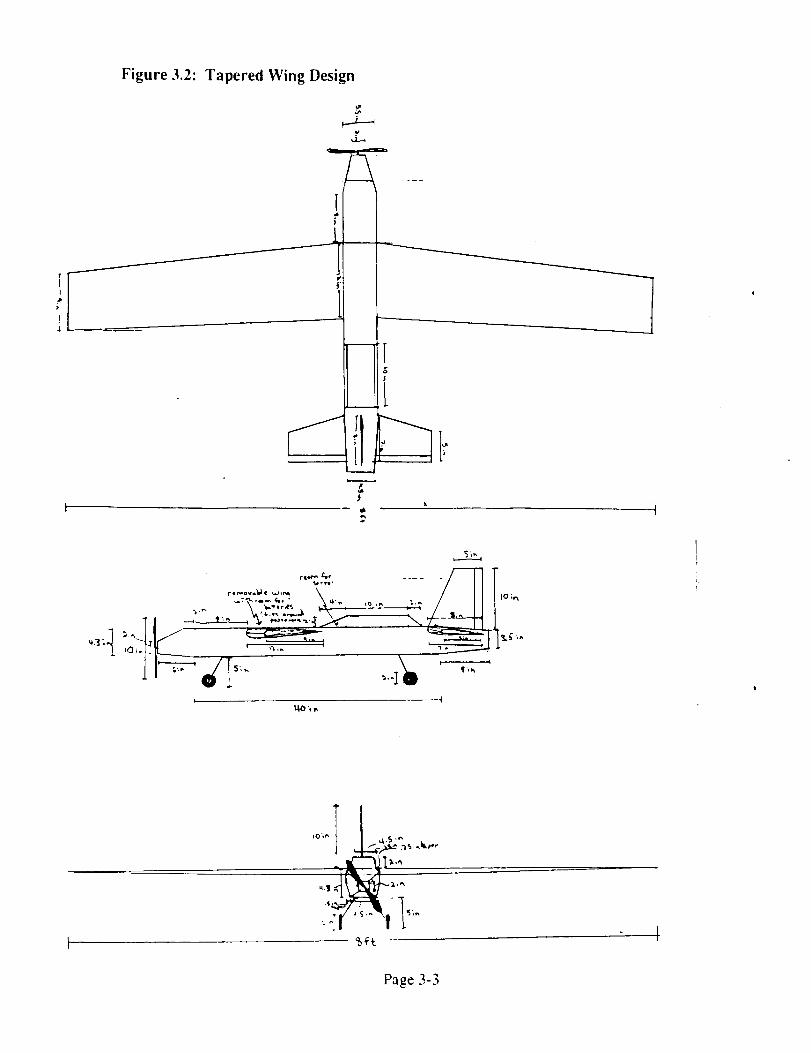
Figure 3.2: Tapered Wing Design
3
/
I
m
Page 3-3
advantage if combined with a seating arrangement of three-abreast oll one level and two-
abreast on the other level. For this type of configuration, with an odd number of
passengers per cross section, the trapezoid would have less frontal area than a rectangular
fuselage and would thus offer a drag reduction. The double-level seating provided
greater capacity with a moderate fuselage length. However, a disadvantage was seen in
the one-piece removable wing, since transportability requirements would limit the wing
span to eight feet.
3.3 Triple-deck Design
A third concept considered was the three-level, two abreast passenger seating
design depicted in Figure 3.3. This aircraft featured a square fuselage with a high wing.
Dihedral was included for roll control, with a fiat center section for ease of attachment to
the fuselage. The nose and tail sections were tapered as for the tapered wing design.
The main advantage of this design was the potential for high capacity due to the
three-level passenger seating deck. However, a disadvantage was also associated with
this design feature. Since a capacity of 100 passengers has been targeted, a three-deck
design leads to a relatively short fuselage and thus a short tail moment arm. This was a
significant concern, since the tail moment arm has a prominent effect on stability and
control. In addition, the three-level fuselage required an additional aisle and led to less
efficient use of fuselage volume.
3.4 The Bunny
The final concept chosen for The Bunny strives to incorporate the primary
strengths of the candidate configurations while eliminating the weaknesses. Table 3.1
summarizes these specific strengths and weaknesses.
"Fable 3.1: Primary Strengths and Weaknesses of Candidate Concepts
Concept
Aileron Design
Tapered-wing Design
Triple-deck Design
StrengthsThree-abreast design uses
cabin space efficiently
Tapered wing reduces induced
dragTrapezoidal fuselage with
rounded edg`es reduces drag.Three-level design allows
higher capacity
Weaknesses
Long fuselage leads to
increased structural weightInclusion of ailerons uses allavailable radio channels
One-piece wing may bedifficult to transport
Short fuselage may createinsufficient tail moment arm
Page 3-4
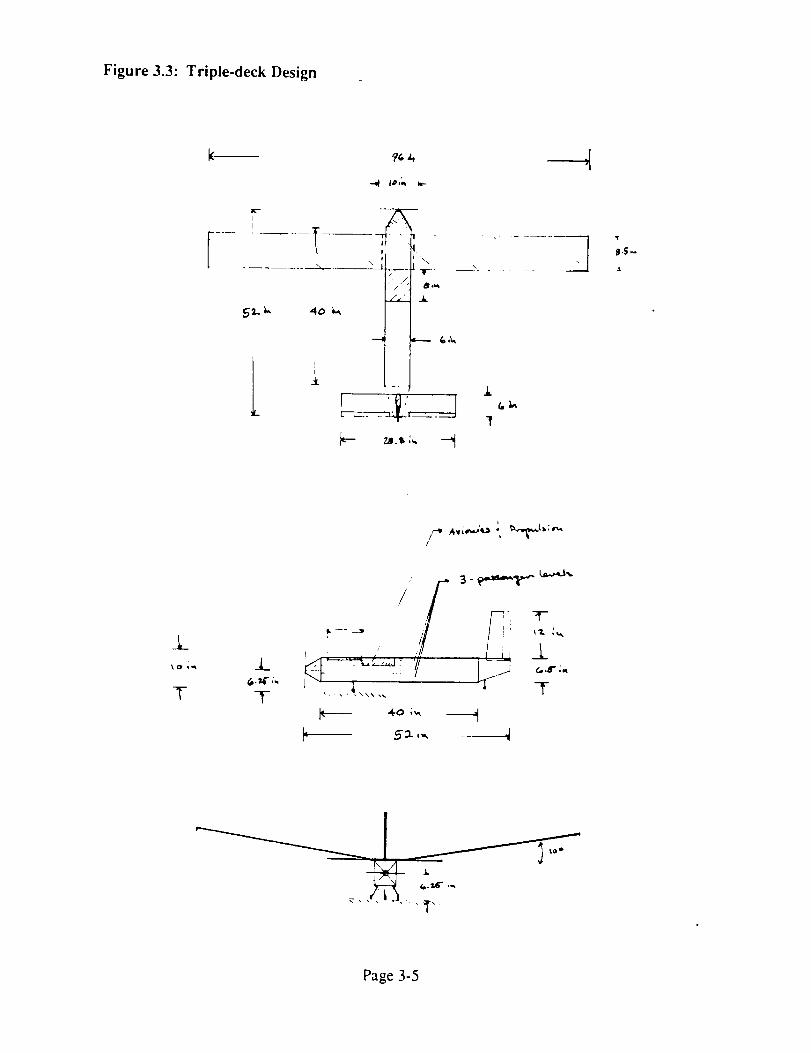
Figure 3.3: Triple-deck Design
96 A
I
40
.'/./,_ 8_
"\\
"T
"T
!1.5.-
4_
T
_L#._4" ;_
T
/
S - f_"_'_ '' _..L,,
i w-
._. 4_, ,_.... T
Page 3-5
The Bmmy features double-level seating to provide a capacity of 11)() passengers
while maintaining a moderate fuselage length. This allows a trade-off between minimum
structural weight and maximum tail moment arm. The passenger seating arrangement
incorporates the drag reduction advantage of a trapezoidal fuselage with fuselage volume
efficiency by using three-seats-abreast on the bottom level and two-abreast on the top.
This single-class arrangement represents the highest capacity seating available on The
Btomv. Future designs may feature areas of two-abreast first class seating on the lower
level, but the total capacity will be reduced. Alternate seating arrangements will be
designed according to individual airlines' needs. The nose and tail sections will be
tapered to minimize drag. In order to meet the maximum take-off distance requirement,
flaps will be utilized: therefore, dihedral rather than ailerons will be used for roll control.
Since the flaps will span the inner half of the wing, a three-panel polyhedral design will
be used, such that the flapped portion of the wing will be flat. This will maxilnize the
effect of the flaps and increase the ease of construction. The outboard portion of the wing
will be slightly tapered to improve aerodynamic performance. A two-piece removable
low wing design will be used to ensure adequate transportability. Accessibility of the
battery/servo compartment will be maintained by placing these components on the top
level. Tail-dragger landing gear will be employed such that the main gear can be attached
to the wing carry-through structure, eliminating the need for additional structural build-
up. Diagrams of The Bunny's external and internal configurations can be found in
Figures 1.1, 1.2, and 1.3.
Page 3-6
4.0 AERODYNAMIC DESIGN DETAIL
The major contributing factors in the aerodynamic design of The Bumpy include
both economic and performance requirements, in order to reduce fuel costs and meet the
take-off, range and endurance performance requirements, obtaining maximum lift became
the most significant factor behind the aerodynamic design. By providing a take-off
distance less than 20 ft., The Blolny aims to serve all passenger markets within Aeroworld.
To serve these goals, a high-lift airfoil and flaps have been incorporated into the design of
the main _ving. Minimizing drag, and hence the costs associated with the propulsion
system, was another major factor in the aerodynamic design. To serve this goal, tapered
wing tips and a low-wing attachment were incorporated in the wing design. Through this
combination of aerodynamic features, The Bumlv proves to be a viable competitor in the
low Reynolds number, high-volume passenger transport market of Aeroworld.
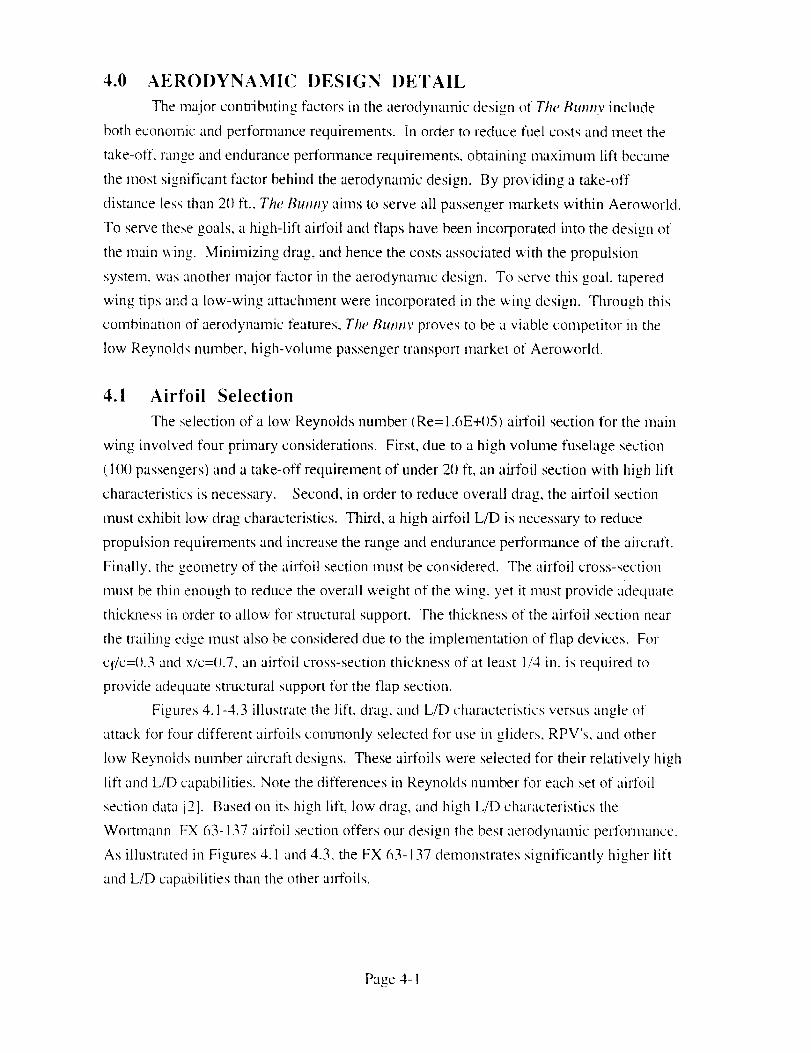
4.1 Airfoil Selection
The selection of a low Reynolds number (Re=I.6E+()5) au-foil section for the main
wing involved four primary considerations. First, due to a high volume fuselage section
(1()() passengers) and a take-off requirement of under 20 ft, an airfoil section with high lift
characteristics is necessary. Second, in order to reduce overall drag, the airfoil section
must exhibit low drag characteristics. Third, a high airfoil L/D is necessary to reduce
propulsion require,nents and increase the range and endurance performance of the aircraft.
Finally, the geometry of the airfoil section must be considered. The airfoil cross-section
must be thin enough to reduce the overall weight of the wing, yet it must provide adequate
thickness in order to allow for structural support. The thickness of the airfoil section near
the trailing edge must also be considered due to the implementation of flap devices. For
cf/c={).3 and x/c=tL7, an airfoil cross-section thickness of at least 1/4 in. is required to
provide adequate structural support for the flap section.
Figures 4.1-4.3 illustrate the lift, drag, and LID characteristics versus angle of
attack for four different airfoils colrunonly selected for use in gliders, RPV's, and other
low Reynolds number aircraft designs. These airfoils were selected for their relatively high
lift and L/D capabilities. Note the differences in Reynolds number for each set of airfoil
section data [2]. Based on its high lift, low drag, and high LID characteristics the
Wortmann FX 63- 137 airfoil section offers our design the best aerodynamic performance.
As illustrated in Figures 4.1 and 4.3, the FX 63-137 demonstrates significantly higher lift
and L/D capabilities than the other airfoils.
Page 4- I
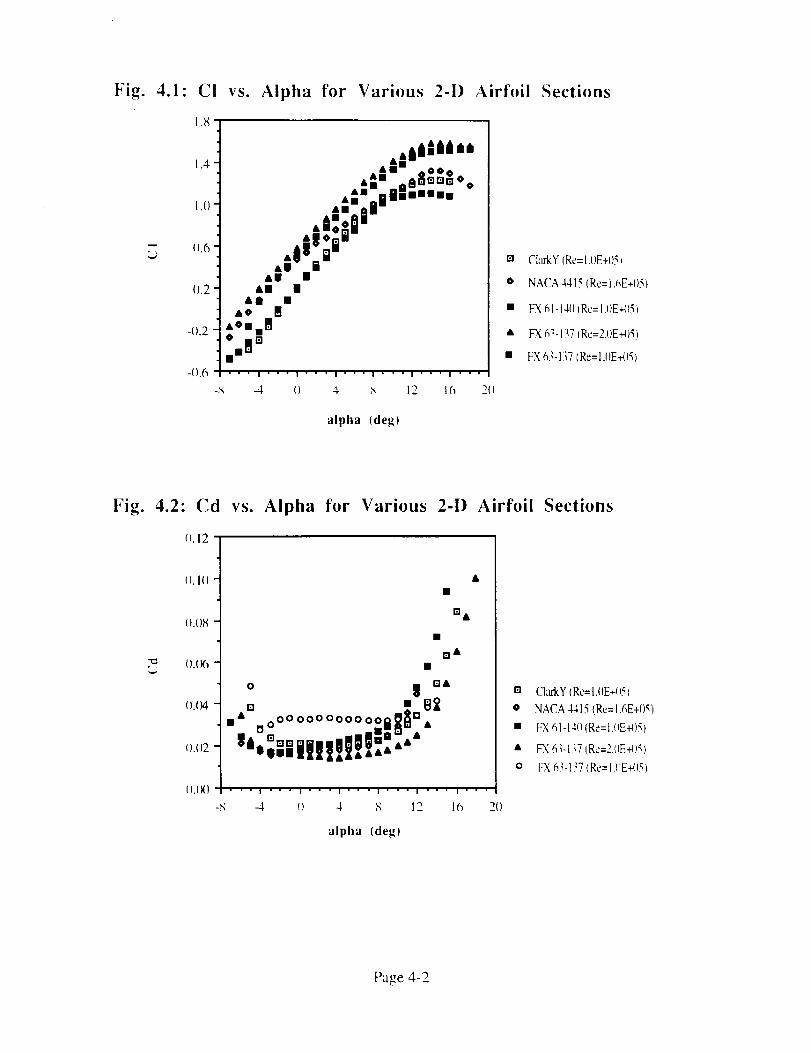
Fig. 4.1-
q
L9
C!
1.8
1.4
I.()
().6 '
-( ).6
vs. Alpha for Various 2-D Airfoil
.fill ii**• ii 0
III .tlEl[]m° o._l ngilull
ili'll".. I I'
Allli li
ii I i i
il iII#
l°,l mi i_
" " ' I " ' " I " " " I " " ' I " " " I " " ' I ' " "
-_ 4 () 4 _ 12 16 2()
alpha (deg)
Sections
El ClarkY (Re=I.I)E+()5_
o NACA4415 (Re=i.f_E+O5t
• FX 6 l- l-Ill (Re= t.4iE-q)5)
• FX63-137(Re=2.0E-_)5)
• E-X63-137(Re=I.()E_4)5)
Fig. 4.2" Cd
().i2
().I()
().()8
=_ ().()6
().()4
().()2
().(X)
vs. Alpha for Various 2-D Airfoil
El&
D &
o m| aiEl
m• ooooooooooooi_ D_OEl imila ¢•
%,IIII!t!|!!:.'"
-8
• " ' I " " " I " " " I " " ' | " ' " I ' " ' I ' " "
-4 () 4 8 12 16 2()
alpha (deg)
Sections
El ClarkY (Re= I.()E+()5)
o NACA4415 (Re=t.6E+05)
• FX 61-[4(l(Re=t.(iE-¢)5)
• PX63-I37(Rc=2.(IE+()5)
o FX 63-I 37 (Rc=I ()E+(i5)
Page 4-2

Fig. 4.3: CI/Cd vs. Alpha for Various 2-D Airfoil Sections
80
6O
4Om
."i"' 20
-2(I
&&AA& A
o• oomA_aOOoA
• oo°N N OG0 _,.,I:I°i m • o I_Ira0 A
A: o [_O _' mmo [] •
• o o_ g ""urn •A
AOoOI_ •
• 8 ° BA8 g• •
•g••11• " ' I ' ' " I ' • ' I ' ' ' I ' ' ' I • ' ' I ' " '
-8 -4 {) 4 8 12 16 2()
alpha (deg)
[] Cku'kY (Re=I.I)E+051
o NACA 441_ (Rc=I.6E*I_5
• FX61-1411(Re= I.{)E41__
• FX63-137 (Re=2.OE+_}5_
o FX 63-137 (Re=l.(IE-_15}
However, the data for the FX 63-137 also shows the effect of Reynolds number on airfoil
lift and drag performance. For the data sets given in Figures 4.1-4.3 (Re= 1.0 and
2.()E+(}5) the FX 63-137 exhibits significant changes in aerodynamic performance.
Whereas Figure 4.1 illustrates only a slight decrease in CI due to a lower Reynolds
number, Figures 4.2 and 4.3 illustrate the significant drag increases due to lower Reynolds
number. Although The Bumtv shall operate at a cruise Reynokts number in between these
data sets t Re= 1.6E+()5), design considerations nmst take into account the increased drag
with decreasing Reynolds number. Design of The Bunny must compensate for drag losses
at conditions other than cruise where low Reynolds numbers will be encountered (larger
chord to increase effective Reynolds number, high AR to reduce induced drag, etc. _, yet it
is recommended that fllrther development stages of The Bunny investigate the effect of
Reynolds number on the specific performance and propulsion requirements of The Brainy.
The aerodynamic performance of the remaining airfoils, although offering the
advantage of ease of manufacturing due to their relatively flat lower surfaces and "simple"
geometnes, are considerably lower than that of the FX 63-137. Both the NACA 4415 and
the Clark Y airfoils have fiat lower surfaces and thick trailing edges making them relatively
easier to produce and capable of supporting a flap structure, yet neither achieves the high
lift performance of the FX 63-137. Table 4.1 summarizes the aerodynamic performance
Page 4-
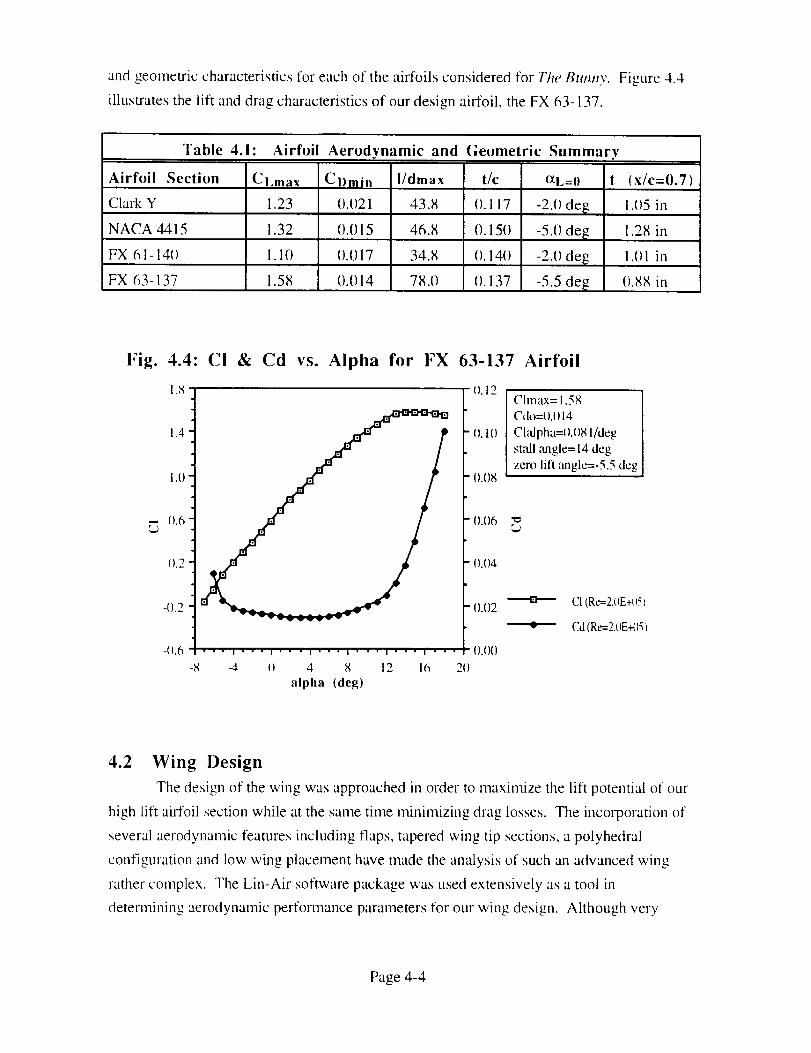
and geometric characteristics for each of the airfoils considered for The Bumtv. Figure 4.4
illustrates the lift and drag characteristics of our design airfoil, the FX 63-137.
Table 4.
Airfoil Section
1: Airfoil Aerodynamic and
El.max
Clark Y 1.23
NACA 4415 1.32
FX 61-14() 1.10
FX 63-137 1.58
Cl)min I/dmax
().021 43.8
0.015 46.8
0.017 34.8
0.014 78.0
(;eometric Summary
t/c OtL=O
(). 117 -2.0 de_
0.150 -5.0 de_
(). 140 -2.0 de_
(). 137 -5.5 deg
t (x/c=0.7)
1.05 in
1.28 in
1.01 in
(/._ in
Fig. 4.4" CI & Cd vs. Alpha for FX 63-137 Airfoil
1.8 {1.12 Chnax= 1.58
Cdo=_ ).{) 14
1.4 - I).l() Clalpha=O.()gl/deg
• st_fll _mgle= 14 deg
zero lift angle=-5.5 deg1.0 - ().()8
1).2 ] f 1).()4
-().2 I r {)-()2 _
-(),6 / ..................... / ().0()
-8 -4 l) 4 8 12 16 2(1
alpha (deg)
CI (Re=2.0E+l)5)
Cd (Re=2.(IE-¢}5 _
4.2 Wing Design
The design of the wing was approached ill order to maximize the lift potential of our
high lift airfoil section while at the same time minimizing drag losses. The incorporation of
several aerodynamic features including flaps, tapered wing tip sections, a polyhedral
configuration and low wing placement have made the analysis of such an advanced wing
rather complex. The Lin-Air software package was used extensively as a tool in
determining aerodynamic performance parameters for our wing design. Although very
Page 4-4
useful in determining the lift and lift-induced drag coefficients for our design model, Lin-
Air is unable to compute viscous effects. In general, Lin-Air was used in several trade
studies in order to determine design variables which would maximize our aerodynamic
performance. The results of these trade studies that eventually led to our final design are
outlined below. Yet, several design decisions for our wing were made without adequate
aerodynamic analysis. The rationale behind these design choices are mentioned below as
well, and it is strongly suggested that further aerodynamic analyses be performed in these
areas as development of The Bunny progresses.
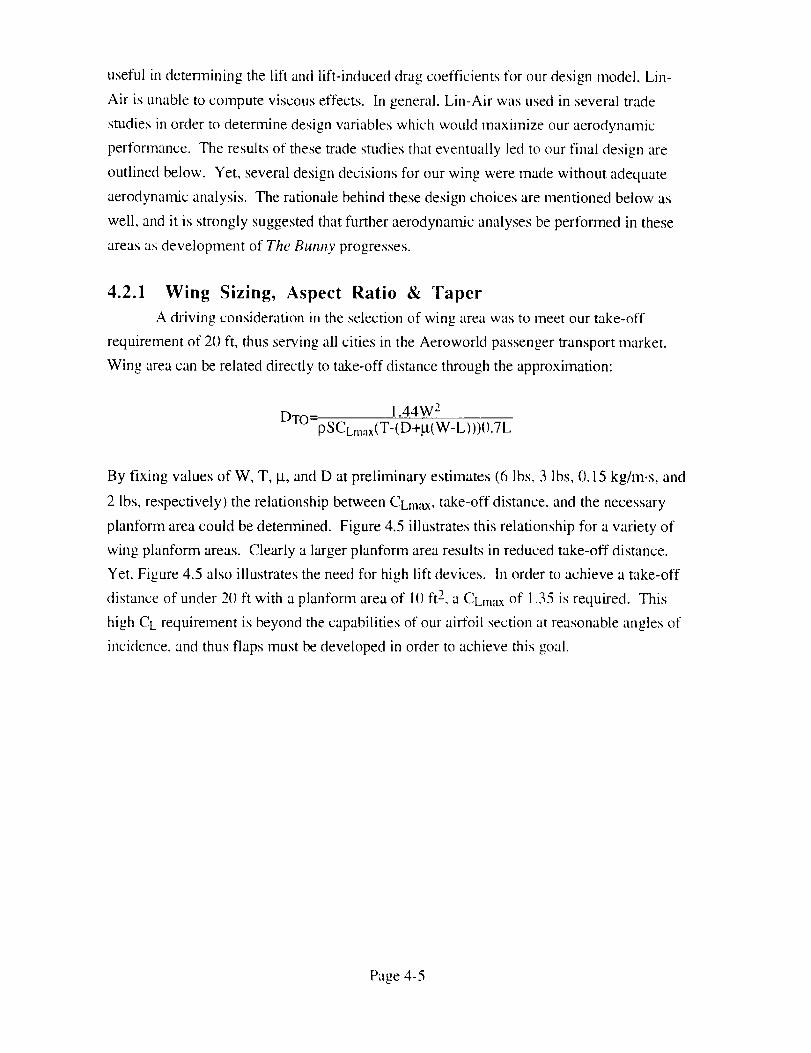
4.2.1 Wing Sizing, Aspect Ratio & Taper
A driving consideration in the selection of wing area was to meet our take-off
requirement of 20 ft, thus serving all cities in the Aeroworld passenger transport market.
Wing area can be related directly to take-off distance through the approximation:
1.44W 2DTO=pscLmax(T-(D+_t(W-L)))O.7L
By fixing values of W, T, _t, and D at preliminary estimates (6 lbs, 3 lbs, 0.15 kg/m.s, and
2 lbs, respectively) the relationship between CLmax, take-off distance, and the necessary
planform area could be determined. Figure 4.5 illustrates this relationship for a variety of
wing planform areas. Clearly a larger planform area results in reduced take-off distance.
Yet, Figure 4.5 also illustrates the need for high lift devices. In order to achieve a take-off
distance of under 20 ft with a planform area of il) ft 2, a CLmax of 1.35 is required. This
high CL requirement is beyond the capabilities of our airfoil section at reasonable angles of
incidence, and thus flaps must be developed in order to achieve this goal.
Page 4-5
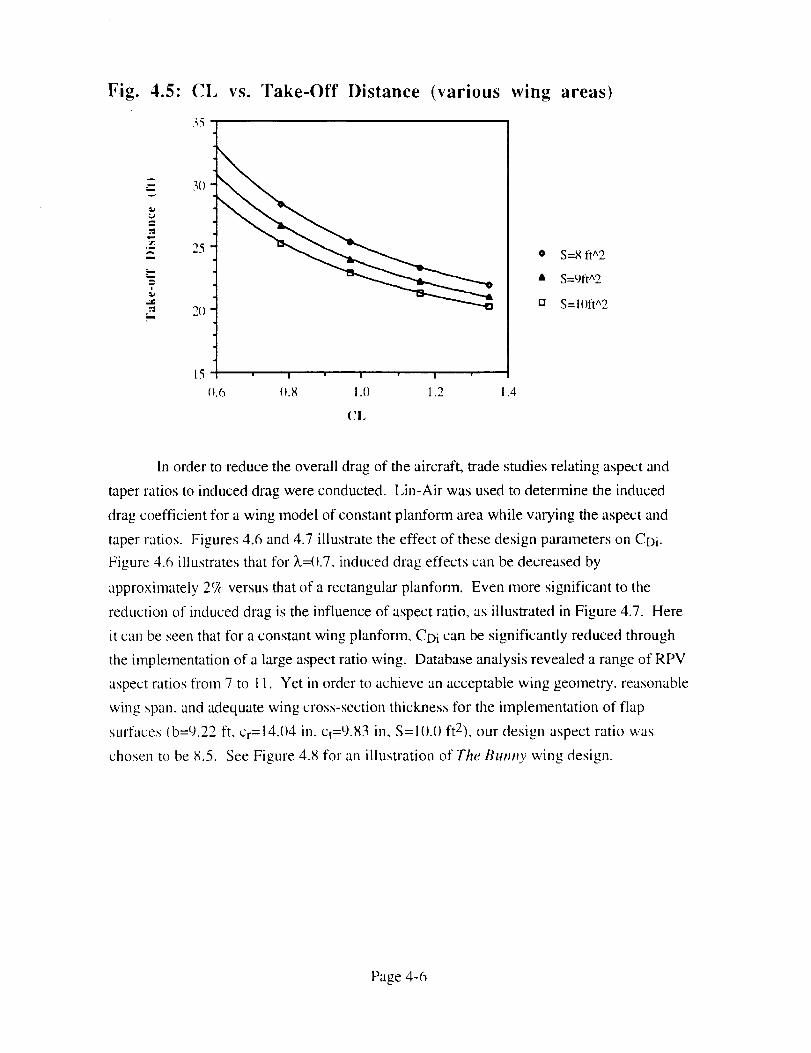
Fig. 4.5:
,m
m
CI, vs. Take-Off Distance (various wing
35
3O
25
2O
15
0.6 0.8 !.() 1.2 ! .4
areas)
CL
• S=g fl^2
A S=9fl^2
[] S=l()fl^2
In order to reduce the overall drag of the aircraft, trade studies relating aspect and
taper ratios to induced drag were conducted. Lin-Air was used to determine the induced
drag coefficient for a wing model of constant planfonn area while varying the aspect and
taper ratios. Figures 4.6 and 4.7 illustrate the effect of these design parameters on CDi.
Figure 4.6 illustrates that for k,=0.7, induced drag effects can be decreased by
approximately 2_;_ versus that of a rectangular planform. Even more significant to the
reduction of induced drag is the influence of aspect ratio, as illustrated in Figure 4.7. Here
it can be seen that for a constant wing planform, CDi can be significantly reduced through
the implementation of a large aspect ratio wing. Database analysis revealed a range of RPV
aspect ratios from 7 to 11. Yet ill order to achieve an acceptable wing geometry, reasonable
wing span, and adequate wing cross-section thickness for the implementation of flap
surfaces (b=9.22 ft, Cr=!4.()4 in, q=9.g3 in, S=ll).() ft2), our design aspect ratio was
chosen to be H.5. See Figure 4.8 for an illustratio,l of The Bunny wing design.
Page 4-6
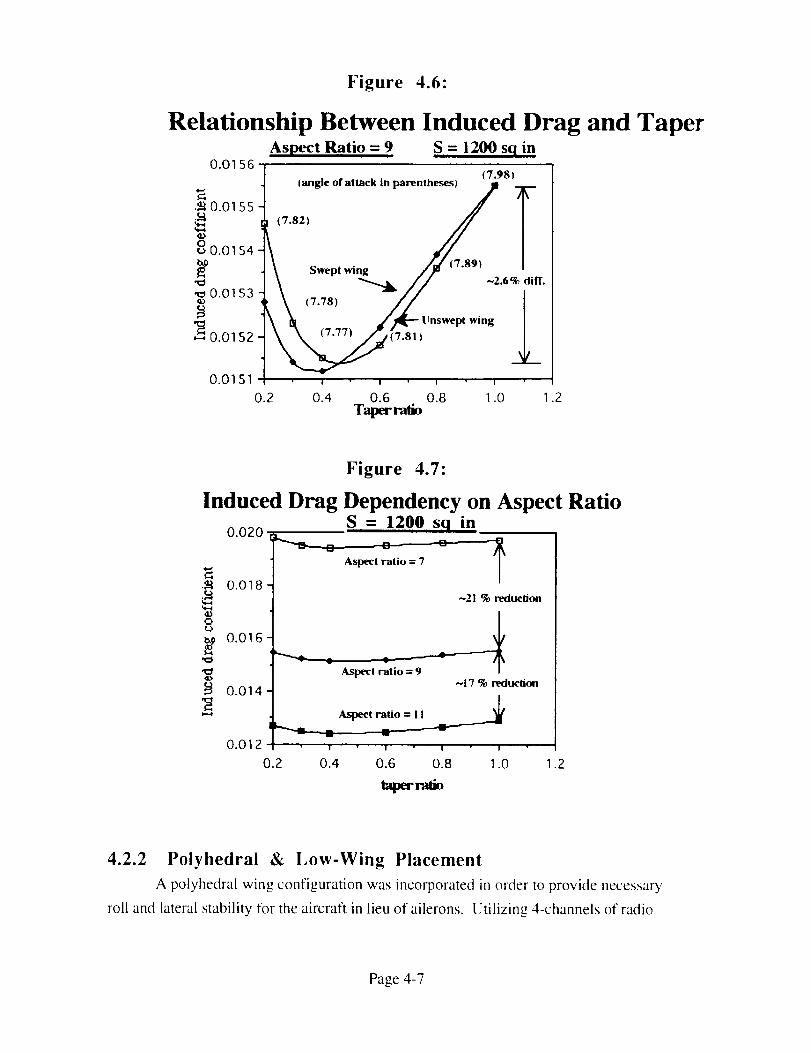
Figure 4.6:
Relationship Between Induced Drag and TaperAspect Ratio = 9 S = 1200 sq in
0.0156(7.98)
(angle of attack in parentheses) / _-
t Swept wing // (7.89) |
\ _ // -2.6% diff.
, \ -// I\ _ /_lJnswe_,,,.g I
0.01S2 __7.81) 2
I I I I
•_ 0.0155
o 0.0154
,x=l•_ 0.01 53
0.4 0.6 0.8 1.0 I .2
Taperralio
0.01 51
0.2
Figure 4.7:
Induced Drag Dependency on Aspect Ratio
0.020 _ =
0.018
0.016
0.014
0.012 _7
0.2
oL_
,v:l
S = 1200 sq in
o oAspect ratio = 7
~21% reduction
•Aspect ratio = 9
~17 % reduction
Aspect ratio
w
I " I I 1
0.4 0.6 0.8 I .0 I .2
laperralio
4.2.2 Polyhedral & Low-Wing Placement
A polyhedral wing configuration was incorporated in order to provide necessary
roll and lateral stability for the aircraft in lieu of ailerons. Utilizing 4-channels of radio
Page 4-7
operation for flaps, elevator, rudder and throttle, ailerons were neglected m order to
provide the pilot ease of operation. A combination of rudder deflection along with a
polyhedral angle of approximately 6° shall allow for adequate roll control and lateral
stability. See Section 7.3 for further discussion of the stability and control performance of
the polyhedral wing.
The placement of the wing along the length of the fuselage was governed primarily
by weight balance and stability and control considerations (see Sections 7 & 8), yet the
placement of the wing with respect to the height of the fuselage was governed by drag
considerations. Due to the trapezoidal fuselage cross-section, the angle between the wing
and the fuselage varies between the high-wing and low-wing locations, in the high-wing
configuration the angle is acute, thus producing a significantly large wing-fuselage
interference drag. In the low-wing configuration however, this angle is obtuse, thus
reducing the interference drag at the wing-fuselage connection.
Page 4-8
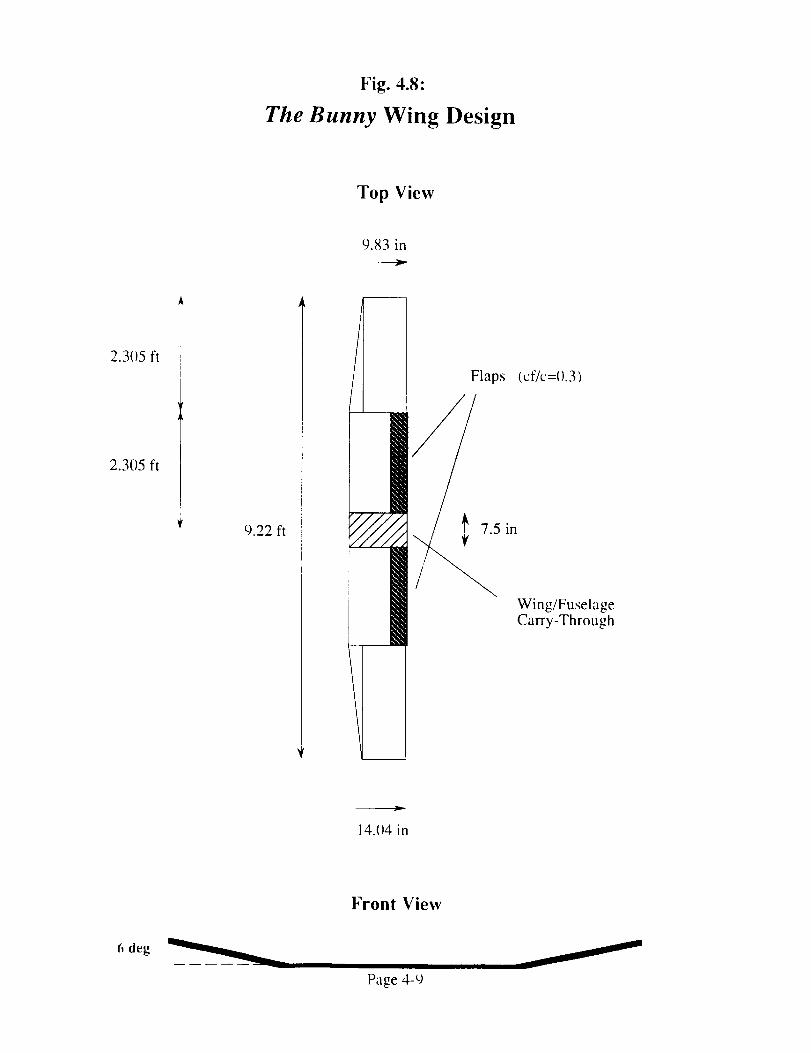
Fig. 4.8:
The Bunny Wing Design
Top View
9.83 in
2.3(15 ft
2.3(i)5 ft
9.22 ft
Flaps (cffc=0.3)
//
Wing/FuselageCarry-Through
V
14.1J4 in
Front View
6 deg
Page 4-9

4.2.3 Flaps
Flaps are valued for their ability to increase the lift characteristics of the wing, yet at
the same time can greatly increase the drag of the entire aircraft. The variance in the lift and
drag characteristics of the wing due to flaps can be achieved through several design
parameters including the type of flap surface, flap deflection angle (fit), and the flap to wing
chord ratio (eric). Lin-Air was again used to model the wing and flap surfaces, where the
lift and induced drag characteristics of the wing could be analyzed. Due to the significant
camber of the FX 63-137 airfoil, the wing model used in Lin-Air consisted of 4 elements to
approximate the mean camber line of the airfoil section. In this way, deflection of a plain
flap could be easily incorporated into the aerodynamic study of the wing simply by
deflecting the trailing edge element relative to the three other elements.
Figure 4.9 illustrates the increased lift performance with increasing flap deflection
angle. It is important to note that Lin-Air solves for the lift distribution along the span of
the wing through the linear superposition of discrete line vortices, and thus does not
account for viscous effects. Hence, stall and the loss in lift associated with stall is not
accounted for in a Lin-Air analysis. Local stall occuring at the flap section and the
associated losses in flap effectiveness would need to be analyzed in the further stages of
development, especially in the regions of large flap deflections (_f>2()o). For our design
case of maximum flap deflection (_1=20o), Lin-Air provides a much more accurate
estimation of the wing lift characteristics. Note: for the following graphs illustrating the
effects of flap deflection, 8f is symbolized by df.
Page 4-1 (I
om
_z"
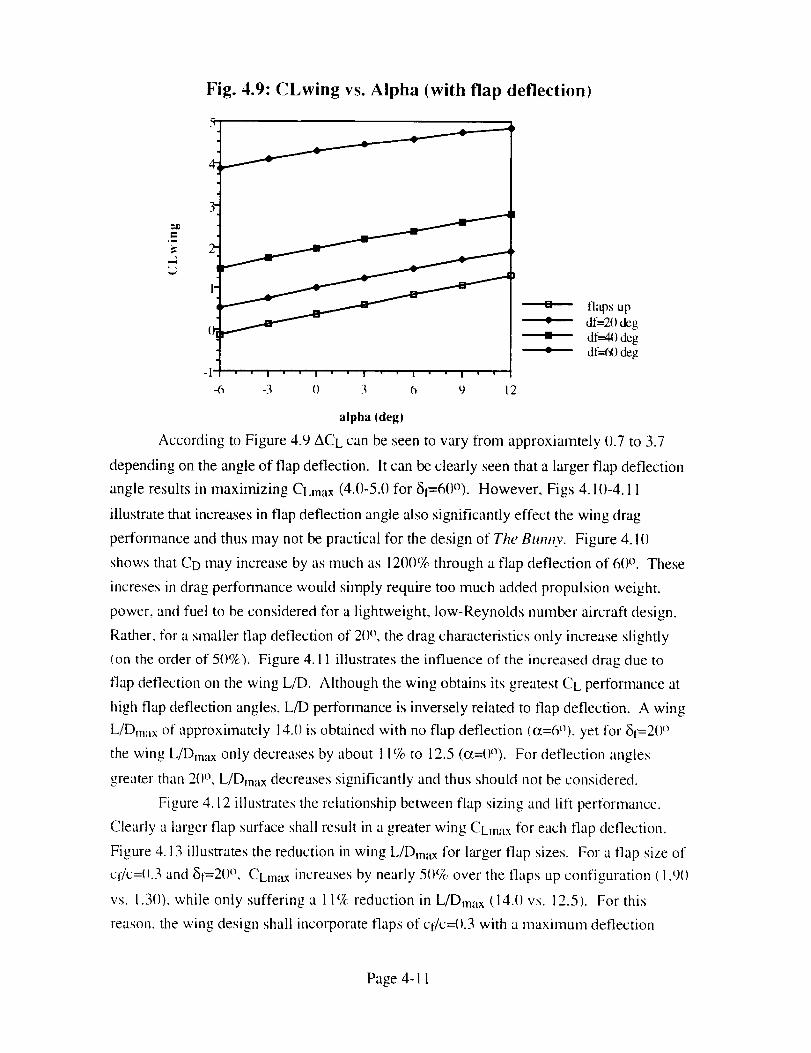
Fig. 4.9: CLwing vs. Alpha (with flap deflection)
r
[] flaps up
dr=21) deg
dt:-,_) degdl_=(g)deg
- I I I I " " I
-6 -3 {) 3 6 9 12
alpha (deg)
According to Figure 4.9 ACL can be seen to vary from approxiamtely 0.7 to 3.7
depending on the angle of flap deflection. It can be clearly seen that a larger flap deflection
angle results in maximizing CLmax (4.0-5.0 for 81-=60o). However, Figs 4.10-4.11
illustrate that increases in flap deflection angle also significantly effect the wing drag
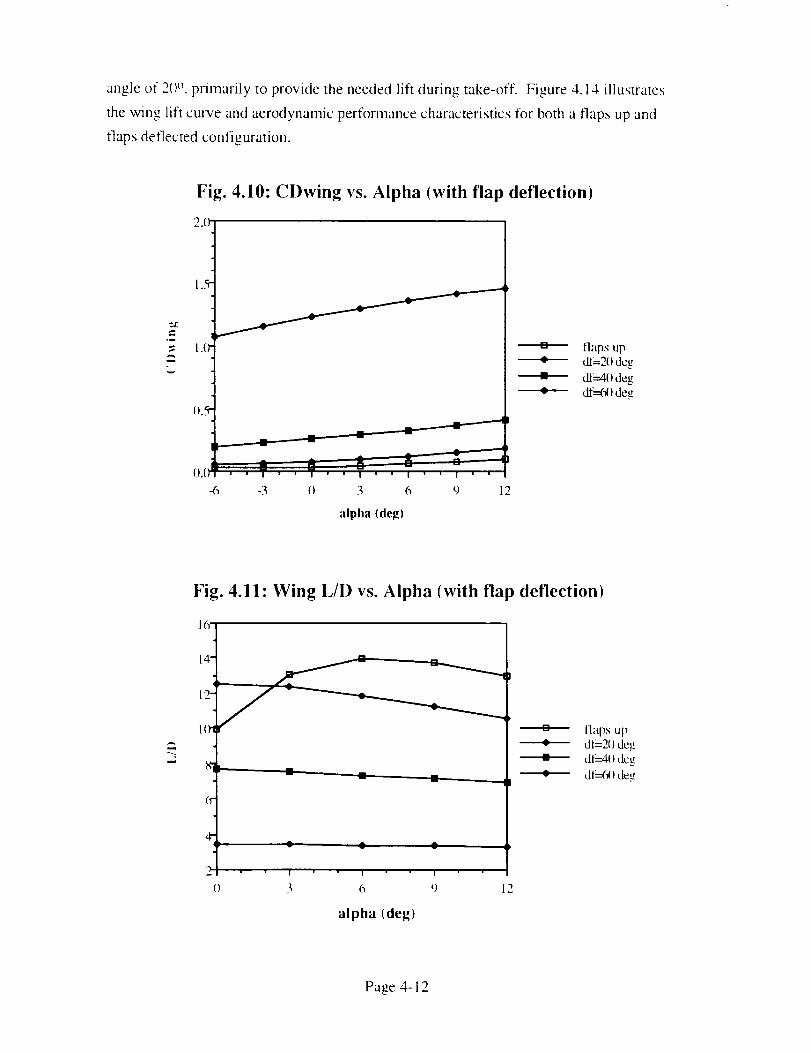
performance and thus may not be practical for the design of The Bumpy. Figure 4.1{)
shows that CD may increase by as much as 1200% through a flap deflection of 60 °. These
increses in drag performance would simply require too much added propulsion weight,
power, and fuel to be considered for a lightweight, low-Reynolds number aircraft design.
Rather, for a smaller flap deflection of 20 °, the drag characteristics only increase slightly
(on the order of 50%). Figure 4.11 illustrates the influence of the increased drag due to
flap deflection on the wing L/D. Although the wing obtains its greatest CL performance at
high flap deflection angles, L/D performance is inversely related to flap deflection. A wing
L/Dma× of approximately 14.() is obtained with no flap deflection (ct=6°), yet for 81=2()°
the wing L/Dmax only decreases by about 1 1% to 12.5 (o_=0°). For deflection angles
greater than 20 °. L/Dma× decreases significantly and thus should not be considered.
Figure 4.12 illustrates the relationship between flap sizing and lift performance.
Clearly a larger flap surface shall result in a greater wing CLm:Lx for each flap deflection.
Figure 4.13 illustrates the reduction in wing L/Dmax for larger flap sizes. For a flap size of
cf/c=(I.3 and 8l=2(J °, CLmax increases by nearly 5()% over the flaps up configuration ( 1.90
vs. 1.3(I), while only suffering a 11%: reduction in L/Dmax (14.(I vs. 12.5). For this
reason, the wing design shall incorporate flaps of ci/c=(I.3 with a maximum deflection
Page 4-11
angleof 2()°, primarily to providetheneededlift during take-off. Figure4.14 illustrates
thewin,- lift curveandaerodynamicperformancecharacteristicsfor botha flapsupandflapsdeflectedconfiguration.
.m
Fig. 4.10: CDwing vs. Alpha (with flap deflection)
2.0
l.()
().._
().(; , • i , , , , , w , i
4_ -3 () 3 6 9 12
[]
alpha (deg)
flaps up
dr-2() deg
df--4( ) deg
dr---6( ) deg
u
Fig. 4.11: Wing L/D vs. Alpha (with flap deflection)
:1t
l(
4"
2
()
I I I
3 6 9
0
i
llaps up
dl-2() deg
dl_---4() dog
dl_=CW) deg
alpha (deg)
Page 4- 12
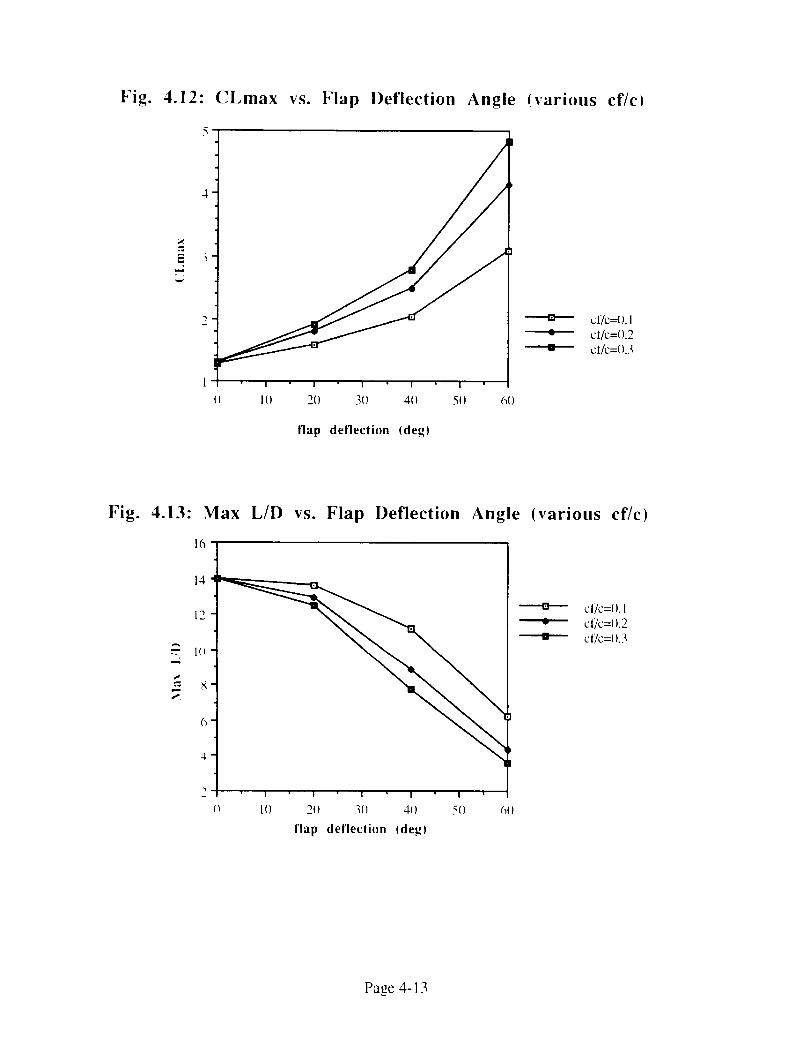
Fig. 4.12" CLmax vs. Flap Deflection Angle !various cf/c)
I I I I I
1_ 111 211 311 40 511 6(I
ct/c={ ).1¢ ut/c={).2
-- ct/c=ll.3
flap deflection (deg}
Fig. 4.13: Max L/D vs. Flap Deflection Angle (various cf/c)
.=£
16
14
12
1(_
X
6
4
2 I I I I I
I} 1{) 21} 30 41) 50
CI/C=I _.I
cl/c={L2cffc=(I.3
flap deflection tdeg)
Page 4-13
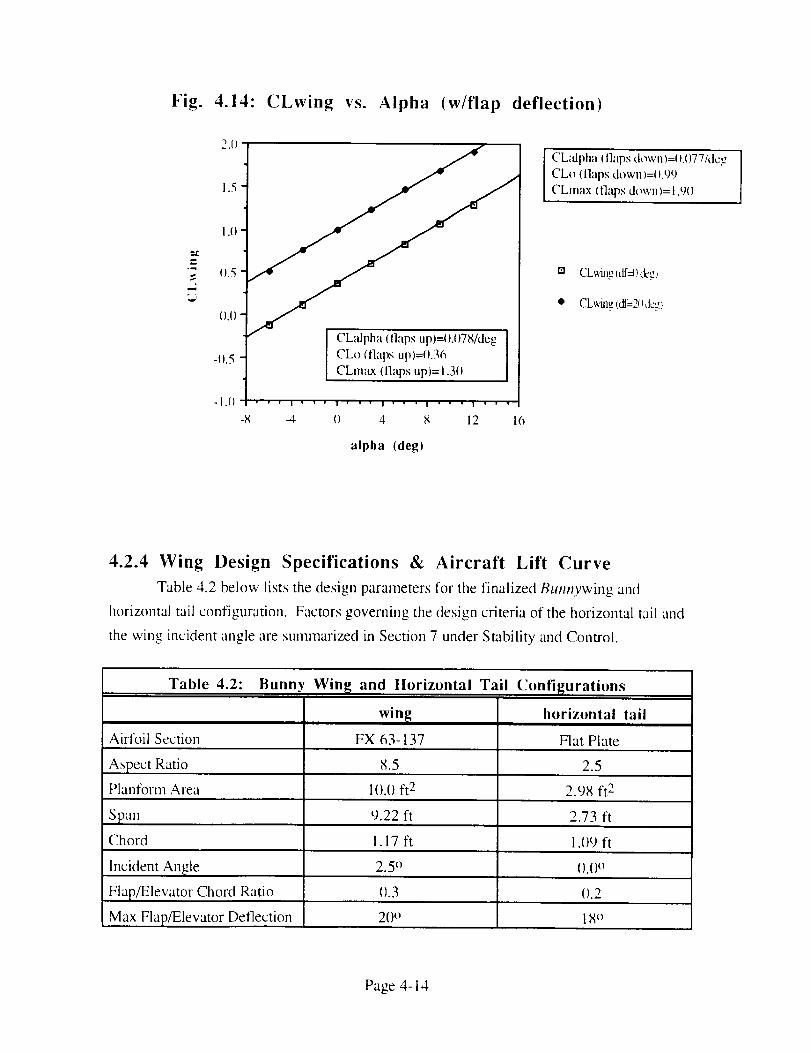
Fig. 4.14: CLwing vs. Alpha (w/flap deflection)
2.()
1.5
I.()
=,C
"i 11.5
().()
-).'_
-1.()
CLdpha fllaps up)=O.O78/deg ICLo (llaps up)=0.36
CLmax (tlaps upt=i .3ll
• ' I " ' " I ' ' ' I ' ' ' I ' " • I ' ' "
-8 -4 1) 4 8 12 16
alpha (deg)
CDdpha ( flaps down)=l I.1177/dogCLo (llaps down I=( 1.99
CLmax i tlaps down )= 1.9(1
4.2.4 Wing Design Specifications & Aircraft Lift Curve
Table 4.2 below lists the design parameters for the finalized Btomywing and
horizontal tail configuration. Factors governing the design criteria of the horizontal tail and
the wing incident angle are summarized in Section 7 under Stability and Control.
Table 4.2: Bunny Wing and Horizontal Tail Configurations
Airfoil Section
Aspect Ratio
Planform Area
Span
Chord
Incident Angle
Flap/Elevator Chord Ratio
Max Flap/Elevator Deflection
win_
FX 63-137
horizontal tail
Flat Plate
8.5 2.5
1().() ft 2 2.98 ft 2
9.22 ft 2.73 ft
1.17 ft 1.09 ft
2.5 ° ().(Io
().3 (L2
2()° 18°
Page 4-14
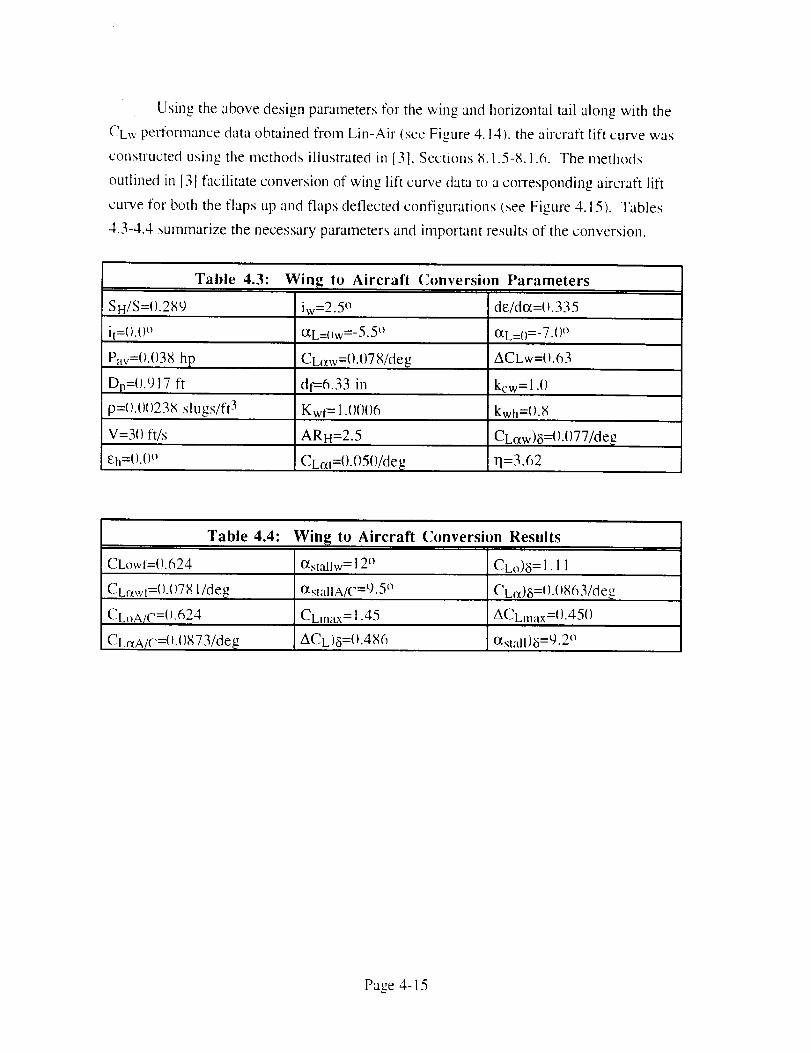
Using the above design parameters for the wing and horizontal tail along with the
CLw performance data obtained from Lin-Air (see Figure 4.14), the aircraft lift curve was
constructed using the methods illustrated ill [31, Sections 8.1.5-b_. 1.6. The methods
outlined in [3] facilitate conversion of wing lift cmwe data to a corresponding ancraft lift
curve for both the flaps up and flaps deflected configurations (see Figure 4.15). Tables
4.3-4.4 summarize the necessary parameters and ilnportant results of the conversion.
Table 4.3: Wing to Aircraft Conversion Parameters
SH/S=().289 iw=2.5 o d_/do_=().335
it=().()o OtL=()w=-5.5 ° OtL=()=-7.()°
ACLw=().63Pay=().()38 hp
Dp=().917 ft
p=().1)()238 slugs/ft 3
V=3() ft/s
Eh=().() °
CLaw=0.()78/de_
dt=6.33 in
Kwl= 1.()()()6
ARH=2.5
CLc_t=().05()/deg
kcw=l .()
kwh=().8
CLotw)8=().(177/deg
11=3.62
Table 4.4: Wing to Aircraft Conversion Results
CLowf=().624 o_stallw = 12 ° CLo)8 = I. 11
CLc_wt:().( )71_1/deg
CLoA/C=().624
CLctA/C=( ).()b;73/de_.
OtslallA/C=9.5 °
CLmax = I .45
ACL)8=().486
CLo08=().()863/def
ACLmax=().45()
Otstall)_=9.2 °
Page 4-15
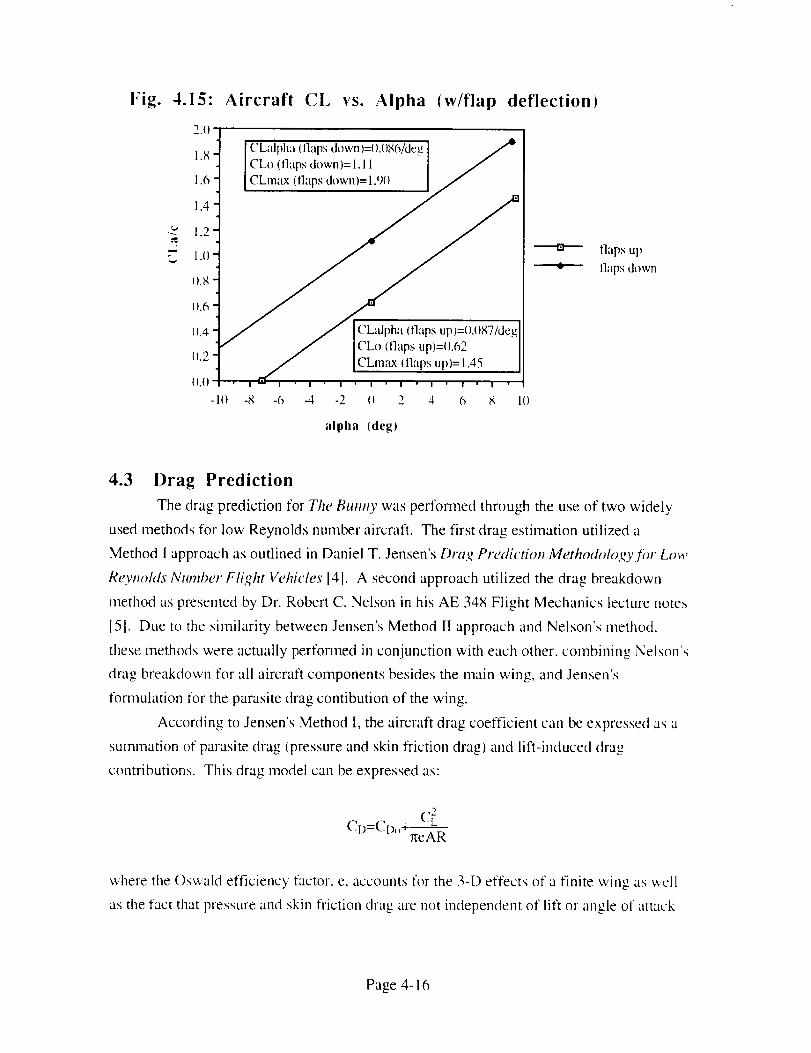
Fig. 4.15: Aircraft CL vs. Alpha (w/flap deflection_
N
2.0
1.8
1.6
1.4
1.2
1.0
eL8
IL(1
_1.4
C_.2
o.0
-I<)
I CLdpha _llaps down)=_).086/de_ ]
CLo ( flaps down)= 1.11 _ ]
/ /, .
-8 -6 -4 -2 II 2 4 6 8 Ill
---m--- flaps up
•-----4k--- flaps down
alpha (deg)
4.3 Drag Prediction
The drag prediction for The Bumty was performed through the use of two widely
used methods for low Reynolds number aircraft. The first drag estimation utilized a
Method I approach as outlined ill Daniel T. Jensen's Drag Prediction Methodolo,wfr_r Low
Revm_hls Nwnber Flight Vehicles [4]. A second approach utilized the drag breakdown
method as presented by Dr. Robert C. Nelson in his AE 348 Flight Mechanics lecture notes
[5]. Due to the similarity between Jensen's Method II approach and Nelson's method.
these methods were actually performed in conjunction with each other, combining Nelson's
drag breakdown for all aircraft components besides the main wing, and Jensen's
formulation for the parasite drag contibution of the wing.
According to Jensen's Method I, the aircraft drag coefficient can be expressed as a
summation of parasite drag (pressure and skin friction drag) and lift-induced drag
contributions. This drag model can be expressed as:
where the Oswald efficiency factor, e, accounts for the 3-D effects of a finite wing as well
as the fact that pressure and skin friction drag are not independent of lilt or angle of attack
Page 4-16
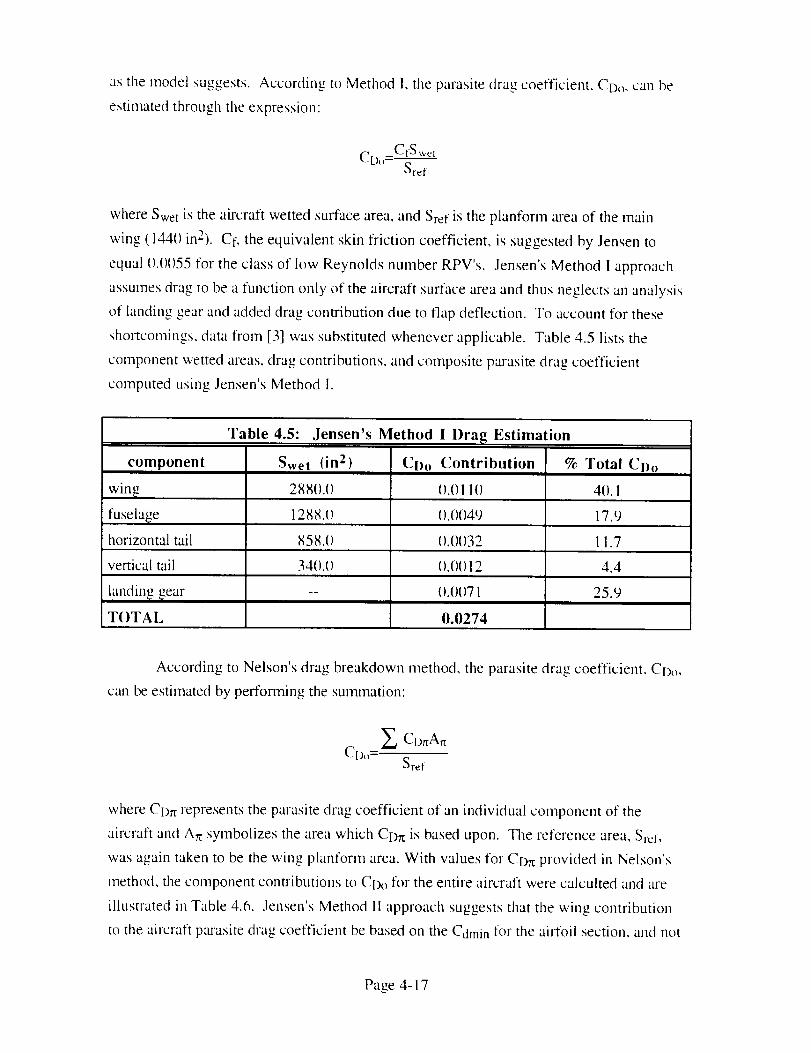
as the model suggests. According to Method I. the parasite drag coefficient. CDo. can be
estimated through the expression:
CD_,_CfS wetSref
where Swet is the aircraft wetted surface area, and Sref is the planform area of the main
wing (144(I in2). Cf, the equivalent skin friction coefficient, is suggested by Jensen to
equal ().()1)55 for the class of low Reynolds number RPV's. Jensen's Method I approach
assumes drag to be a function only of the aircrat't surface area and thus neglects an analysis
of landing gear and added drag contribution due to flap deflection. To account for these
shortcomings, data fiom [3] was substituted whenever applicable. Table 4.5 lists the
component wetted areas, drag contributions, and composite parasite drag coefficient
computed using Jensen's Method I.
Table 4.5: Jensen's Method I Drag Estimation
component Swet (in 2) CDo Contribution % Total Cl)o
win_ 2880.0 ().011() 40. I
fuselage 1288.{) ().()()49 17.9
horizontal tail 858.0 ().0()32 1 !.7
vertical tail 34(I.0 0.()() 12 4.4
landin_ fear -- I).01)71 25.9
T( YI'AL 0.0274
According to Nelson's drag breakdown method, the parasite drag coefficient. CDo,
can be estimated by performing the smrunation:
£ CDrrAr_CD,,-
Sref
where CDrt represents the parasite drag coefficient of an individual component of the
aircraft and Art symbolizes the area which CDr_ is based upon. The reference area, Srcf,
was again taken to be the wing planform area. With values for CDrt provided in Nelson's
lnethod, the component contributions to CDo for the entire aircraft were calculted and are
illustrated ill Table 4.6. Jensen's Method II approach suggests that tile wing contribution
to the aircraft pmasite drag coefficient be based on the Cdmm for the airfoil section, and not
Page 4-17
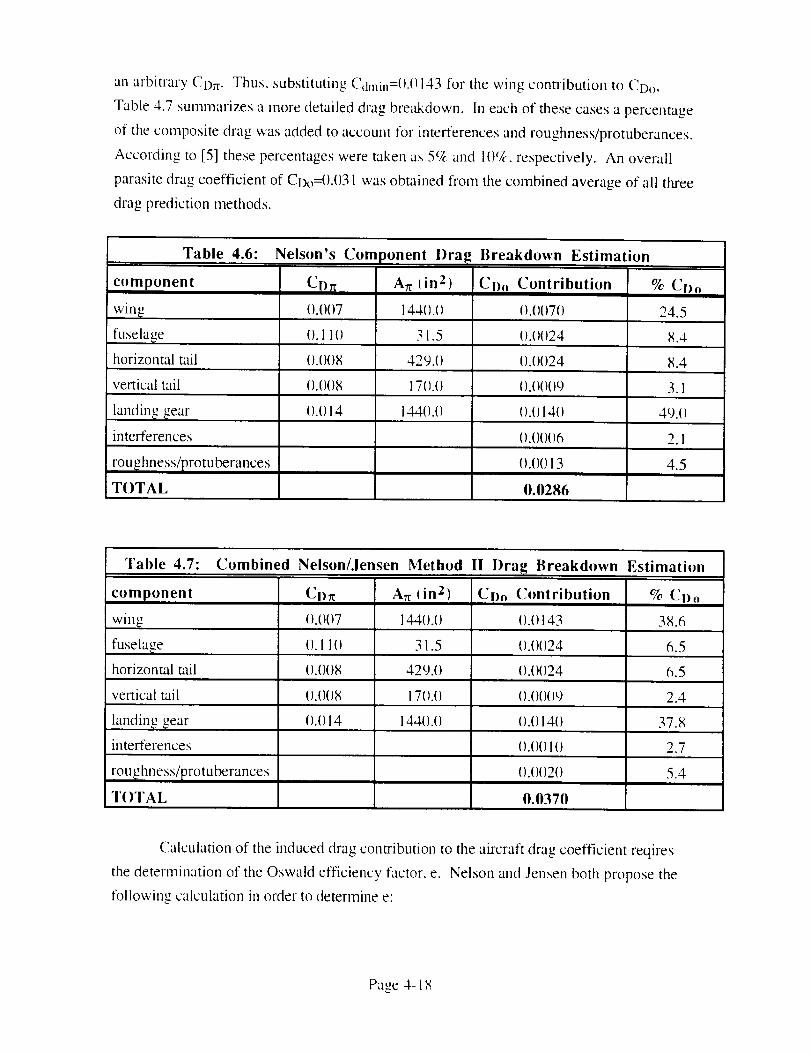
anarbitraryCDr_.Thus.substitutingCdmin=().()143for thewing contributionto CDo,
Table4.7summarizesa moredetaileddragbreakdown.In eachof thesecasesapercentage
of thecompositedragwasaddedtoaccountfor interferencesandroughness/protuberances.
Accordingto [5] thesepercentagesweretakenas5'7candl[)',k, respectively.An overall
parasitedragcoefficientof CDo=().()31wasobtainedfrom thecombinedaverageof all threedragpredictionmethods.
Table 4.6: Nelson's Component Drag Breakdown
component CI)_ Ar_ (in 2) CI). Contri
win,e ().()()7 144().() ().()()7()
fuselage (). 11(1 31.5 ().()()24
horizontal tail ().()()H 429.0 ().()()24
vertical tail ().()08 17().0 1).(1()()9
landin_ year
interferences
roughness/protuberances
T()TAL
().()14 144().() ().()14()
().()()()6
().()013
0.0286
Estimation
bution % CD o
24.5
8.4
8.4
3.1
491)
2.1
4.5
"Fable 4.7: Combined Nelson/Jensen Method lI Drag Breakdown Estimation
Ar_ (in 2) Cm)o Contributioncomponent
wing
fuselage
horizontal tail
C I)
().()()7 144().() ().()143
().II() 31.5 ().()()24 6.5
().()()8 429.() ().()()24 6.5
vertical tail ().()()8 170.0 ().()()()9 2.4
landing gear ().1) 14 144(I.II 1).1)141) 37.8
interferences ().()() 1( ) 2.7
roughness/protuberances
T()TAL
().()()2()
0.0370
5.4
Calculation of the induced drag contribution to the aircraft drag coefficient reqh-es
the determination of the Oswald efficiency factor, e. Nelson and Jensen both propose the
following calculation in order to determine e:
Pa,,e 4- 18
1_ 1 + I___L__+ Ie etus e,,vm_ ec_lher
where ef,s and e,ther have been obtained from data presented in Nelson:s method. For our
particular design these values have been calculated to be 33.5 and 2{I.{), respectively. In
order to determine ewing, Lin-Air was used to solve for the induced drag effects for our
wing design. Solving for CLw and CDi over a range of angles of attack, Lin-Air was used
to solve for ewing through the expression:
Although ewing was found to vary slightly with angle of attack, an average value of
ewing={}.85 was obtained. Combining these component Oswald efficiency factors, an
overall value of e=l).SI) was obtained for The BuJmy. Along with the value for CDo
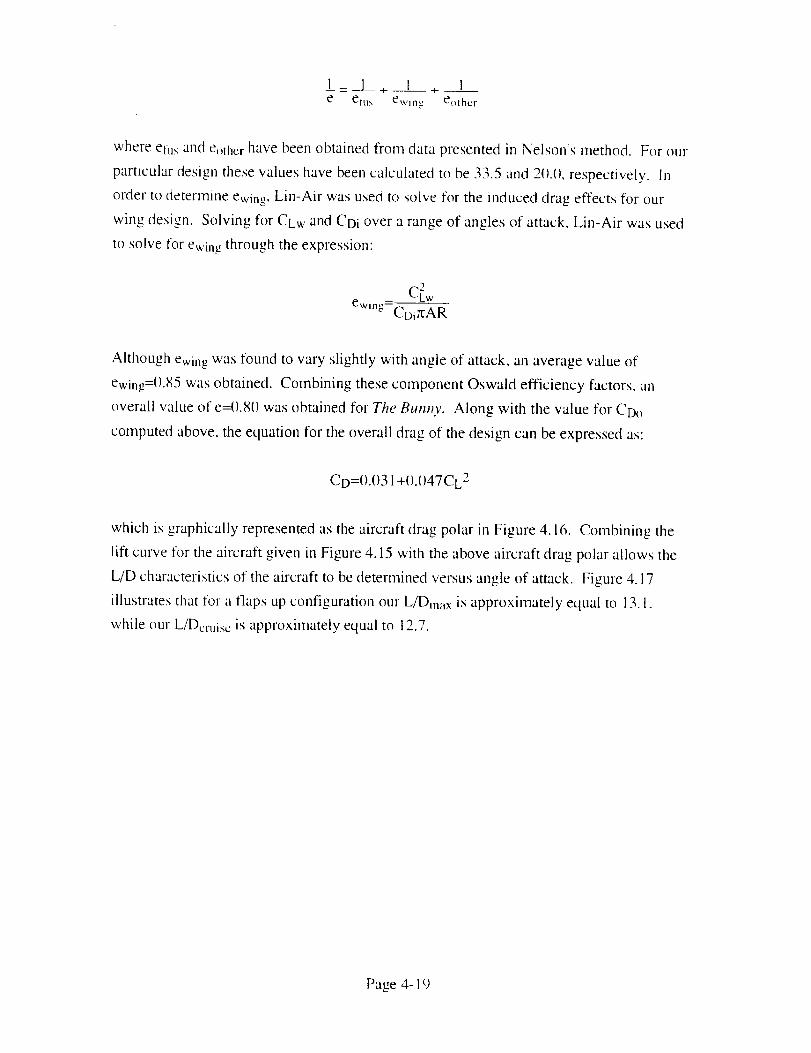
computed above, the equation for the overall drag of the design can be expressed as:
CD=().()31 +().()47CL 2
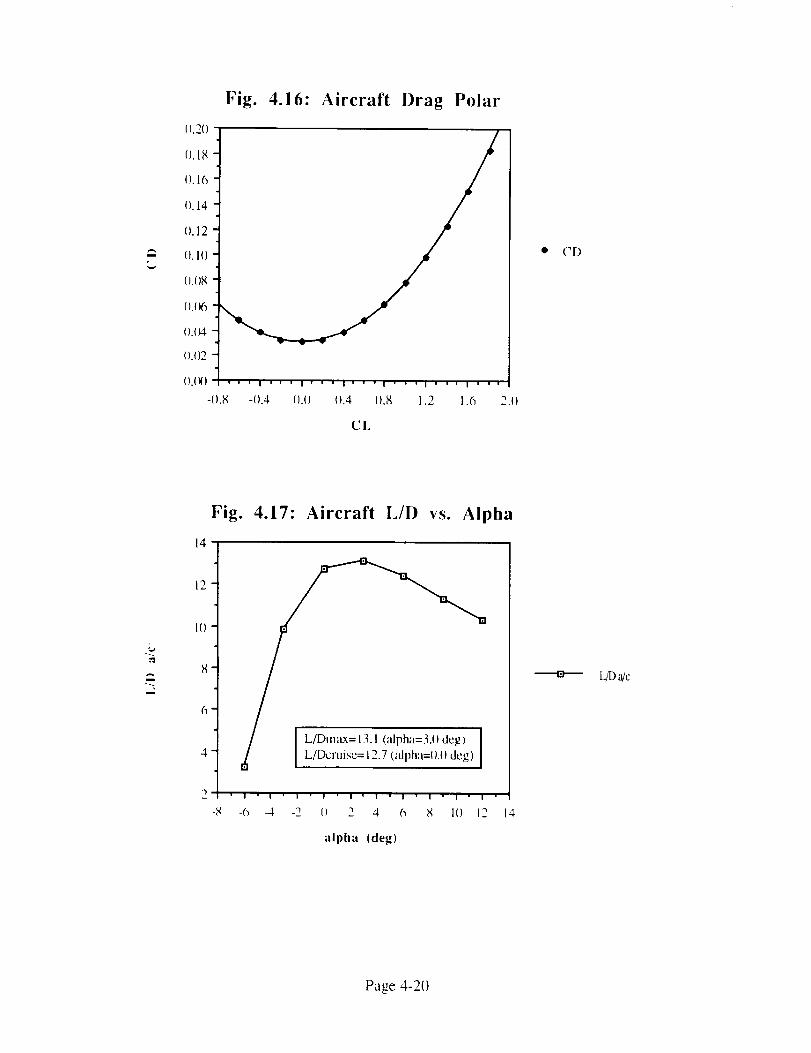
which is graphically represented as the aircraft drag polar in Figure 4.16. Combining the
lift curve for the aircraft given in Figure 4.15 with the above aircraft drag polar allows the
L/D characteristics of the aircraft to be determined versus angle of attack. Figure 4. 17
illustrates that for a flaps up configuration our L/Dmax is approximately equal to 13.1,
while our L/Dcruise is approximately equal to 12.7.
Page 4- 19
i
o.2O
0.18
(). 16
I). 14
().12
(I. 1(I
(I.{)g
[).IX_
I).o4
ILO2
IL(_)
-{).X -0.4
Fig. 4.16: Aircraft Drag Polar
• i i i i i I i i i i • , • i i , i i i •I I I I I I
(I.() 11.4 I).8 1.2 1.6 2.1)
CL
• CD
i
i
14
12
1()
4. "
Fig. 4.17: Aircraft L/D vs. Alpha
-g -6 -4 -_3 I) _3 4 fi
_,_o.{) deg)
' I ' I ' I ' I ' I ' I " I ' I " I " I '
g 1() 12 14
alpha (deg)
L_ a/c
Page 4-20
5.0 PROPUI_SION SYSTEM
5.1 Requirements and
Design Requirements:
Objectives
1.
2.
3.
4.
5.
6.
Environmentally safe.
Take off and land under own power.
Maximum take-off distance of 40 feet.
Loiter for 2 minutes.
Maximum altitude of 25 feet.
Installation performed in under 20 minutes.
Design Objectives:
5.2 System Selection
1. Maxilnum take-off distance of 20 feet.
2. Vtake_of f greater than 1.3 Vst:d I for safety.
3. Reduce fuselage blockage effects.
4. Flexible battery placement for CG connol.
5. Variable throttle control.
The mission requirements dictate that the propulsion system for the technology
demonstrator be environmentally safe. This effectively limits the selection to a small number of
propulsion options. The two considered by Su,shine Aeronautics are electrical power and stored
mechanical energy such as rubber band propulsion. Given the relatively short period of time
allotted to prepare this proposal, ease of analysis necessarily played a major role in the propulsion
systems studied. Electric propulsion was chosen because of the large data base accumulated from
past years" projects and the extensive experience of the program advisors with the colrunon electric
propulsion systems.
One motor, mounted in the front of the fuselage, is being employed to meet the power
needs of the aircraft. This is a reasonable decision since several of the motor choices suggested
provide the necessmy power for takeoff and cruise with maximum payload. The structural
difficulty in mounting two motors, either on the sides of the fuselage or by suspending them from
the wings, also discouraged the idea of a plane with more than one motor. Questions have been
raised about the difficulty of synchronizing more than one motor at identical RPM settings in order
to produce even, parallel thrust vectors to keep the aircraft in straight and level flight. The
necessity of minimizing weight in order to minimize take-off distance also recommends a single-
motor design.
Three two-blade propellers were considered in conjunction with the available motors, and
were chosen based on availability and projected thrust requirements. Only two-blade propellers
were considered because of weight considerations and the availability of an extensive data base.
Page 5- 1
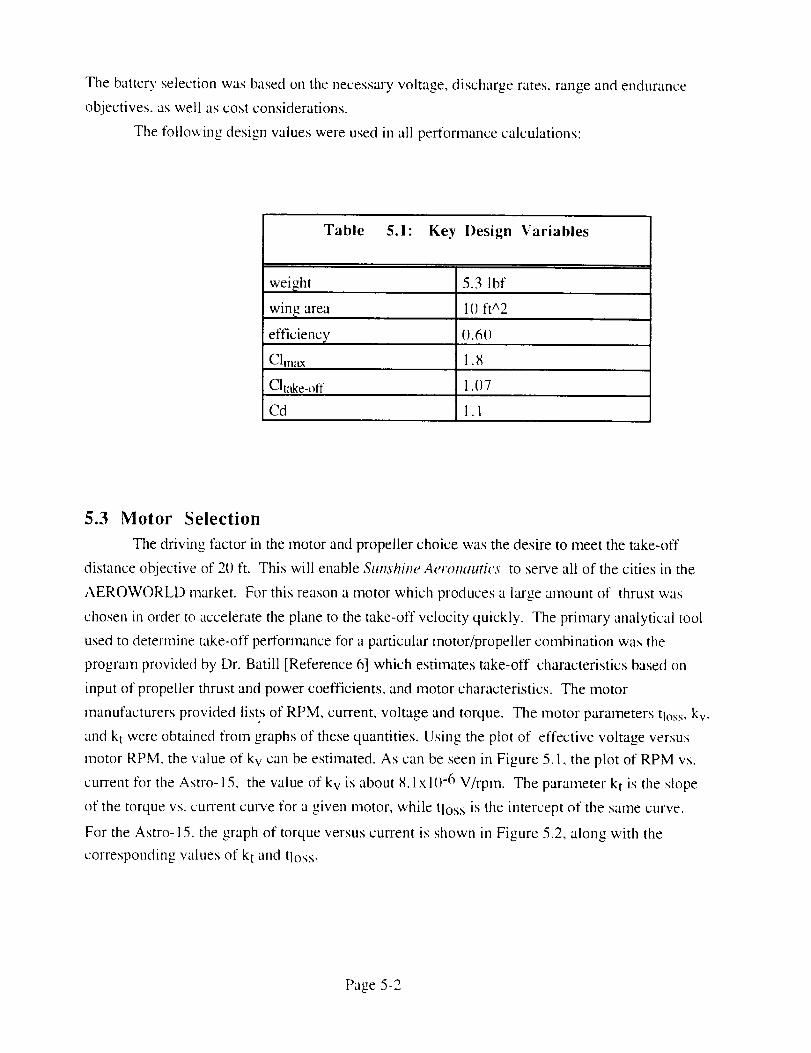
Thebatteryselectionwasbasedon thenecessaryvoltage,dischargerates,rangeandenduranceobjectives,aswell ascostconsiderations.
Thefollowingdesignvalueswereusedin all performancecalculations:
Table 5.1: Key Design Variables
weight
win_ area
efficiency
Clmax
5.3 lbf
1() ft^2
0.60
1.8
Clmke-off 1.()7
Cd 1.1
5.3 Motor Selection
The driving factor in the motor and propeller choice was the desire to meet the take-off
distance objective of 20 ft. This will enable SunshiJw Aeronautics to serve all of the cities in the
AEROWORLD market. For this reason a motor which produces a large amount of thrust was
chosen ill order to accelerate the plane to the take-off velocity quickly. The primary analytical tool
used to determine take-off performance for a particular motor/propeller combination was the
program provided by Dr. Batill [Reference 6] which estimates take-off characteristics based on
input of propeller thrust and power coefficients, and motor characteristics. The motor
manufacturers provided lists of RPM, current, voltage and torque. The motor parameters tloss, kv,
and kt were obtained from graphs of these quantities. Using the plot of effective voltage versus
motor RPM, the value of kv can be estimated. As can be seen in Figure 5.1, the plot of RPM vs.
current for the Astro-15, the value of kv is about 8. l x 10-6 V/rpm. The parameter kt is the slope
of the torque vs. current curve for a given motor, while tloss is the intercept of the same curve.
For the Astro- 15. the graph of torque versus current is shown in Figure 5.2, along with the
corresponding values of kt and tloss.
Page 5-2
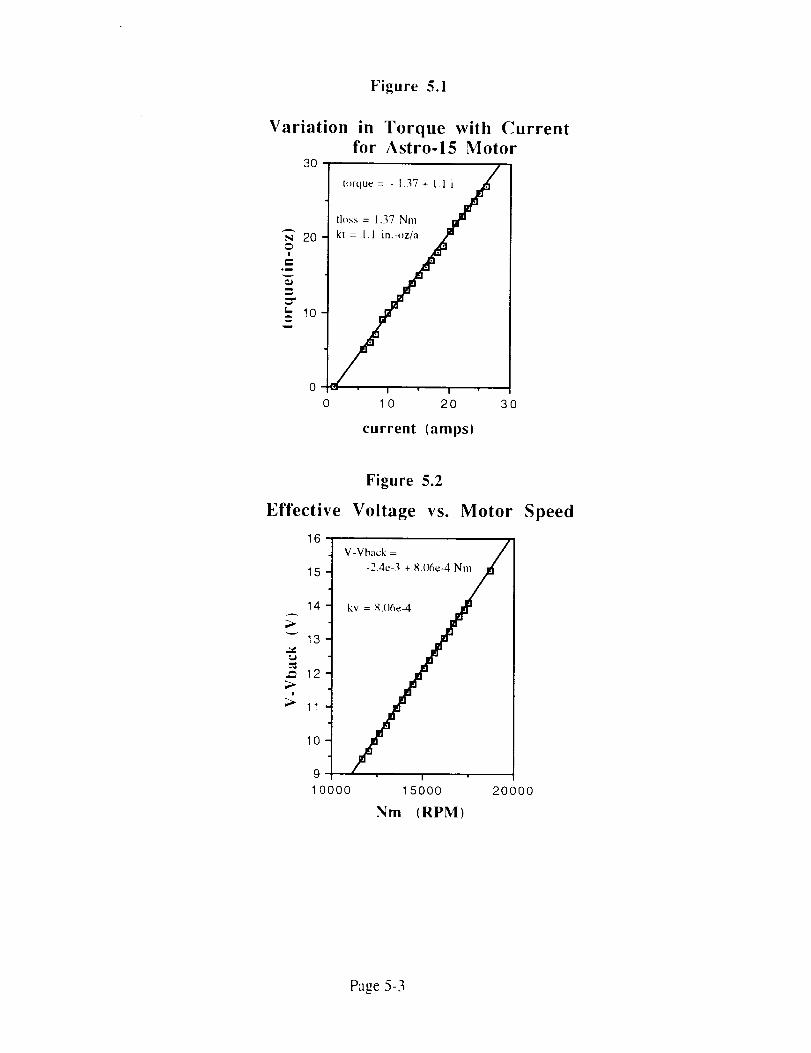
Figure 5.1
Variation in Torque with Currentfor Astro-15 Motor
30
tt)rque= - 1.37+ l.l ij
.it"th_ss = 1.37 Nm
_r-
._ 20 kt = 1.1 in.-oz/a
!
._=
'- 10
0 t t
0 10 20 30
current (amps)
Figure 5.2
Effective Voltage vs. Motor Speed
16
V-Vhack = /
15 -2.4e-3 + _.(}6e-4 Nm/
./14 , = . _
13
-" 12
;;11
10
9
10000 15000 20000
Nm (RPM)
Page 5-3

A wide range of motors were considered including the Astro ()5, ()5 FAI, 15.25, and 4(L
The large weight of the Astro 4(1 series motor system (45 oz.) indicated that using this motor
would entail sacrificing the take-off distance goal based oll the sensitivity of take-off performance
to weight. A comprehensive study was done of tile remaining motors. First a take-off analysis
was done, which indicated that the Astro 05 and tl5 FAI would have to be operated at an excessive
RPM in order to take-off, with a current draw larger than the fuse setting of 20 amps. Both the
Astro 15 and Astro 25 motors produced sufficient thrust to ensure a take-off distance of 2() feet.
The Astro 25 drew less current than the 15, but the 4.1) oz. weight increase made it a less
attractive choice. The flaps which The Bunny will employ at take-off provide a high liR
coefficient so that the Astro- 15 can provide the power necessary to meet our take-off objecnve.
For these reasons Suns'hiJw Aerollautics has chosen the Astro Cobalt 15 as the motor for the
technology demonstrator.
Analysis of the cruise and take-off performance of The Butmy indicates that there is a
strong dependency on gear ratio. For instance, it was found that lower gear ratios yielded shorter
take-off distances. Manufacturer's information lists three possible gear ratios for the Astro- 15:
1.84, 2.21 and 2.38. Although the 1.84 would be preferred, the motor we have been provided
with has a gear ratio of 2.21. For optimum take-off performance it is recommended that in the
future The Bunny be outfitted with the Astro-15 with a gear ratio of 1.84.
The following are the motor characteristics for the Astro- 15 motor which will be installed
in The Btcnp_v based on a fuse-amperage of 20 amps and a maximum voltage of 15.6 V.
Table 5.2: Motor Characteristics
type
name
max power 185 watts
internal resistance (). 12 f_
gear ratio 31 : 14
weight 7.5 oz.
electric powered
Astro Cobalt ! 5
Page 5-4
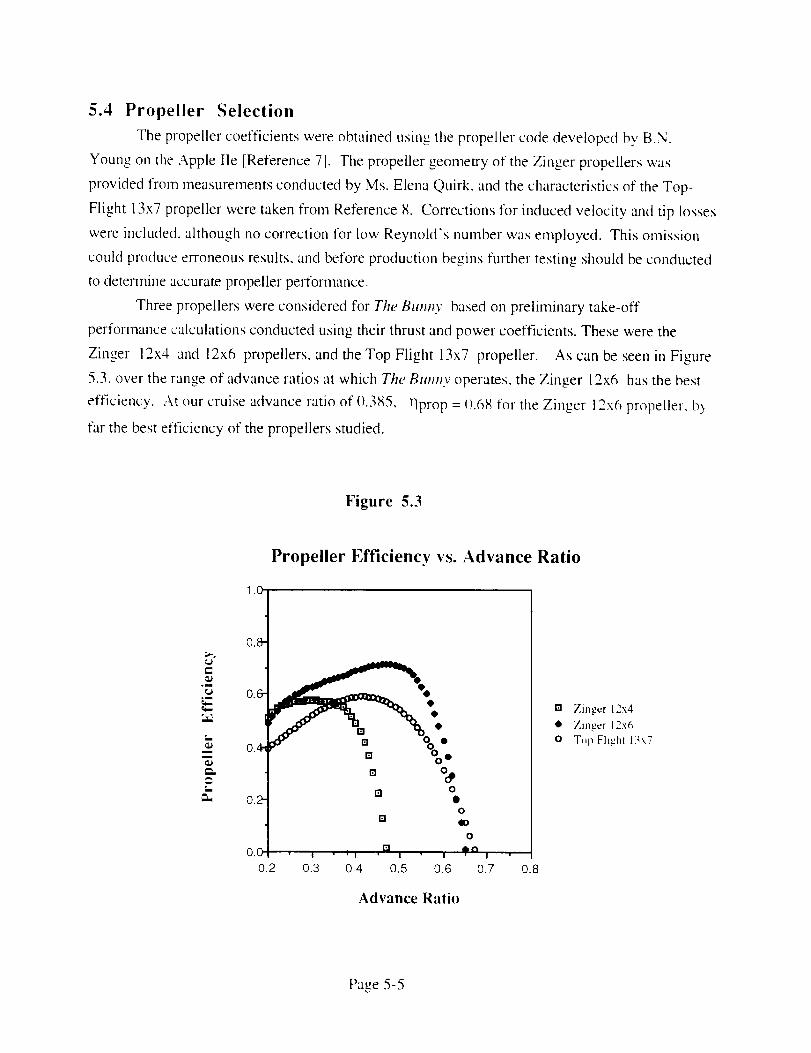
5.4 Propeller Selection
The propeller coefficients were obtained using the propeller code developed by B.N.
Young oil the Apple Ile [Reference 71. The propeller geometry of the Zinger propellers was
provided from measurements conducted by Ms. Elena Quirk, and the characteristics of the Top-
Flight 13x7 propeller were taken from Reference 8. Corrections for induced velocity and tip losses
were included, although no correction for low Reynold's number was employed. This omission
could produce erroneous results, and before production begins further testing should be conducted
to determine accurate propeller performance.
Three propellers were considered for The Bunny based on preliminary take-off
performance calculations conducted using their thrust and power coefficients. These were the
Zinger 12x4 and 12x6 propellers, and the Top Flight 13x7 propeller. As can be seen in Figure
5.3, over the range of advance ratios at which The Bmmv operates, the Zinger 12x6 has the best
efficiency. At our cruise advance ratio of(L385, qprop = (L68 for the Zinger 12x6 propeller, b,,
far the best efficiency of the propellers studied.
Figure 5.3
¢.d
<aJ
o_
t
mm
<D
A
t_
Propeller Efficiency vs. Advance Ratio
0.2[] o
o
[]
o
[] Io| " II ' I ' I ' I
0.3 0.4 0.5 0.6 0.7 0.8
[] Zinger 12x4
• Zinger 12x6
0 T.I', Flight 13x7
Advance Ratio
Page 5-5
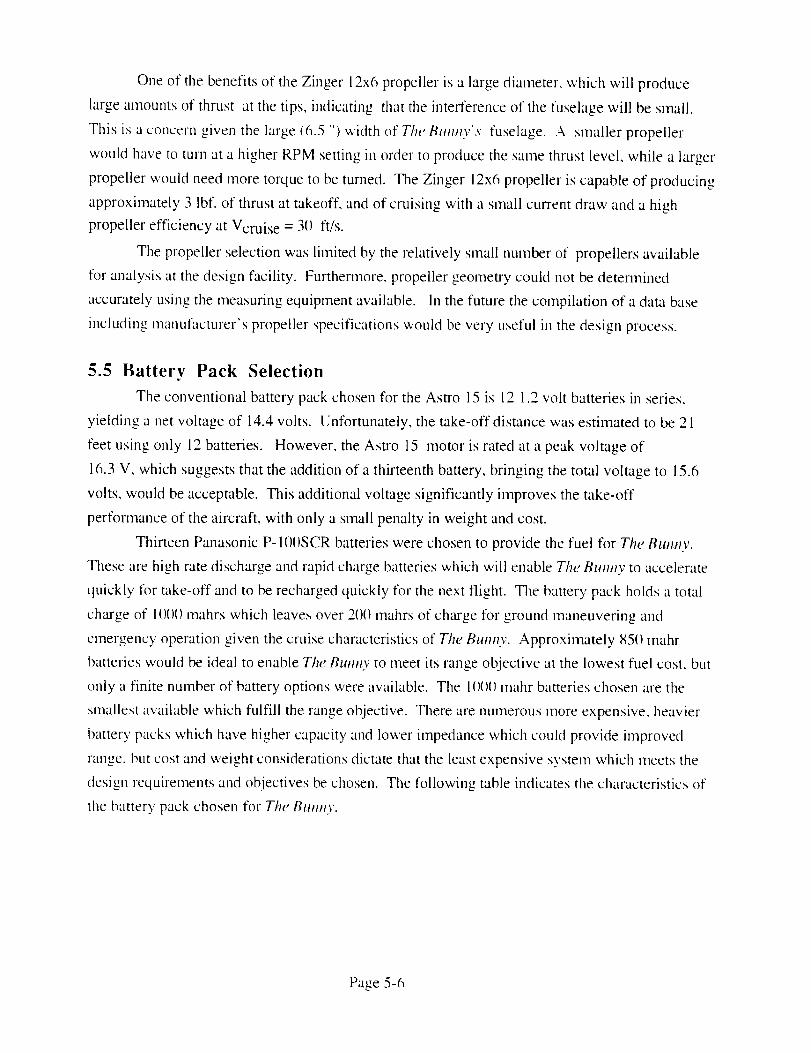
One of the benefits of the Zinger 12x6 propeller is a large diameter, which will produce
large amounts of thrust at the tips, indicating that the interference of the fuselage will be small.
This is a concern given the large (6.5 ") width of The Bmmv's fuselage. A smaller propeller
would have to turn at a higher RPM setting in order to produce the same thrust level, while a larger
propeller would need more torque to be turned. The Zinger 12x6 propeller is capable of producing
approximately 3 Ibf. of thrust at takeoff, and of cruising with a small current draw and a high
propeller efficiency at Vcruise = 30 ft/s.
The propeller selection was limited by the relatively small number of propellers available
for analysis at the design facility. Furthennore, propeller geometry could not be determined
accurately using the measuring equipment available. In the future the compilation of a data base
including manufacturer's propeller specifications would be very useful in the design process.
5.5 Battery Pack Selection
The conventional battery pack chosen for the Astro 15 is 12 1.2 volt batteries in series,
yielding a net voltage of 14.4 volts. Unfortunately, the take-off distance was estimated to be 21
feet using only 12 batteries. However, the Astro 15 motor is rated at a peak voltage of
16.3 V, which suggests that the addition of a thirteenth battery, bringing the total voltage to 15.6
volts, would be acceptable. This additional voltage significantly improves the take-off
performance of the aircraft, with only a small penalty in weight and cost.
Thirteen Panasonic P-I()()SCR batteries were chosen to provide the fuel for The Bunny.
These are high rate discharge and rapid charge batteries which will enable The Bunny to accelerate
quickly for take-off and to be recharged quickly for the next flight. The battery pack holds a total
charge of l()()()mahrs which leaves over 2()1)mahrs of charge for ground maneuvering and
emergency operation given the cruise characteristics of The Bunny. Approximately 850 mahr
batteries would be ideal to enable The Bunny to meet its range objective at the lowest fuel cost, but
only a finite number of battery options were available. The I1)1)1)mahr batteries chosen are the
smallest available which fulfill the range objective. There are numerous more expensive, heavier
battery packs which have higher capacity and lower impedance which could provide improved
range, but cost and weight considerations dictate that the least expensive system which meets the
design requirements and objectives be chosen. The following table indicates the characteristics of
the battery pack chosen for The Bunny.
Page 5-6
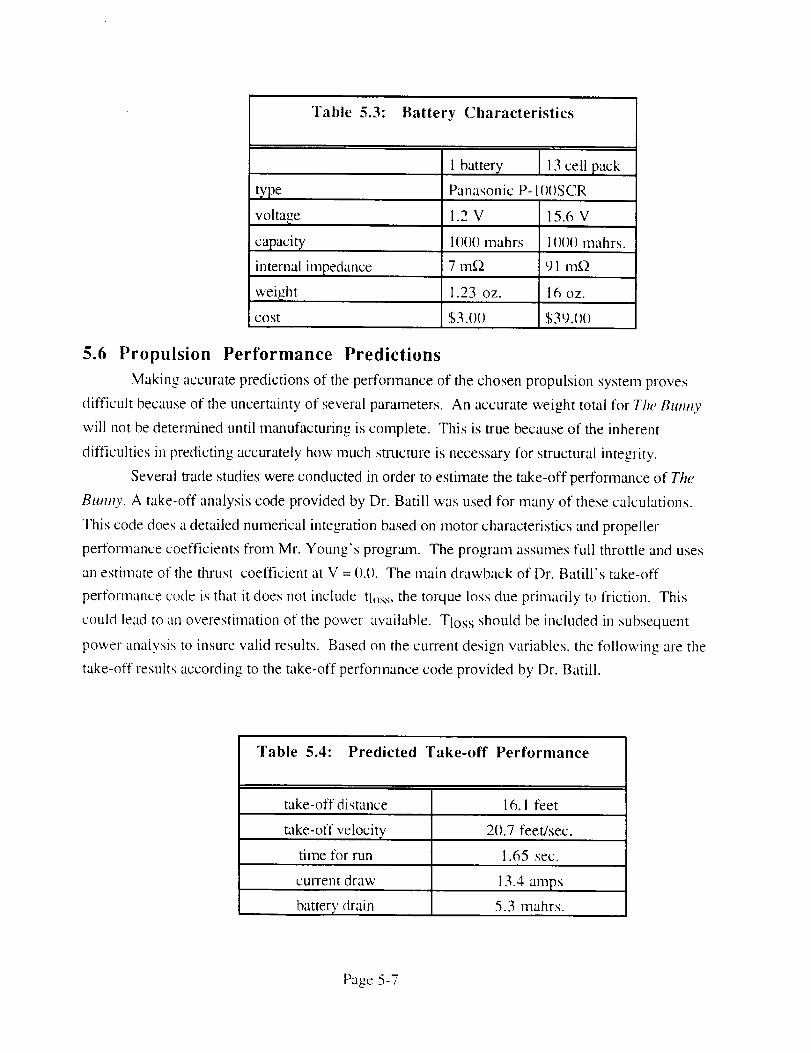
"Fable 5.3: Battery Characteristics
type
voltage
capacity
internal impedance
weight
cost
1 batter}' 13 cell pack
Panasonic P-I )I)SCR
!.2 V 15.6 V
1()()() mahrs l()()l) mahrs.
7 tn_ 91 tn_)
1.23 oz. 16 oz.
$3.()() $39.()()
5.6 Propulsion Performance Predictions
Making accurate predictions of the performance of the chosen propulsion system proves
difficult because of the uncertainty of several parameters. An accurate weight total for The Bunny
will not be determined until manufacturing is complete. This is true because of the inherent
difficulties in predicting accurately how much structure is necessary for structural integrity.
Several trade studies were conducted in order to estimate the t_e-off performance of The
Bunny. A take-off analysis code provided by Dr. Batill was used for many of these calculations.
This code does a detailed numerical integration based on motor characteristics and propeller
performance coefficients from Mr. Young's program. The program assumes full throttle and uses
an estimate of the thrust coefficient at V = {).(). The main drawback of Dr. Batill's take-off
performance code is that it does not include tloss, the torque loss due primarily to friction. This
could lead to an overestimation of the power available. Tloss should be included in subsequent
power analvsis to insure valid results. Based on the current design variables, the following are the
take-off results according to the take-off performance code provided by Dr. Batill.
Table 5.4: Predicted Take-off Performance
take-off distance 16. I feet
20.7 feet/see.take-off velocity'
time for run
current draw
batter}, drain
1.65 sec.
13.4 amps
5.3 mahrs.
Page 5-7
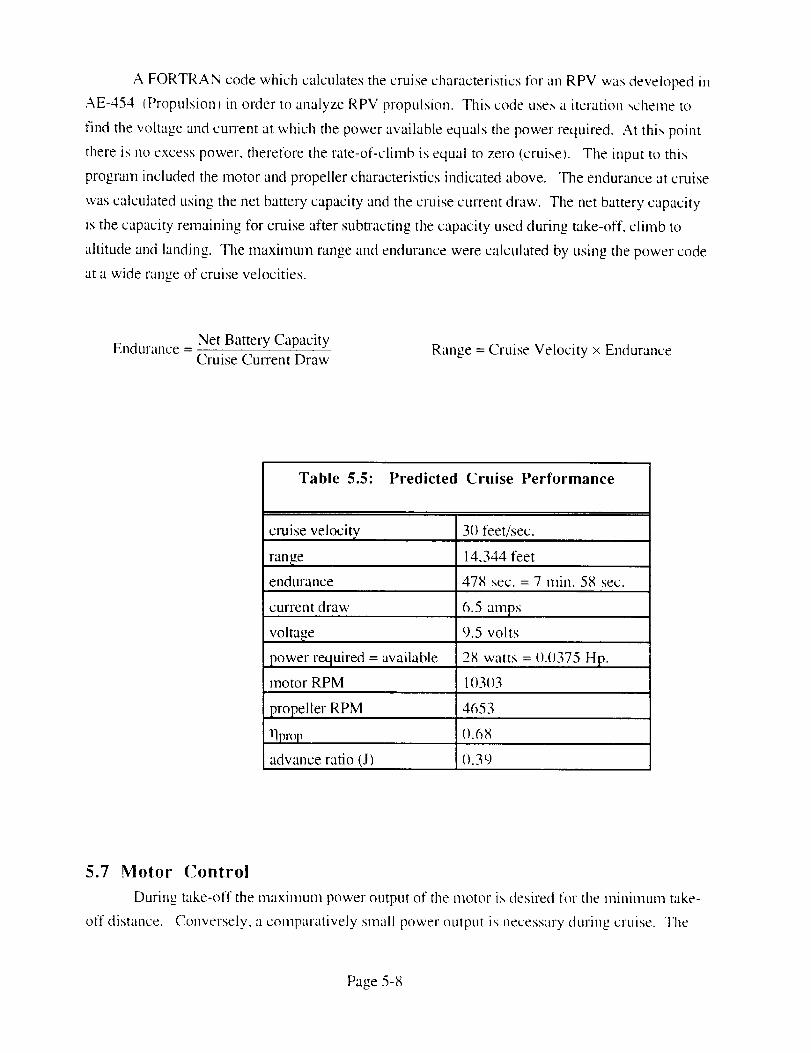
A FORTRANcodewhichcalculatesthecruisecharacteristicsfor all RPVwasdevelopedin
AE-454 (Propulsionl ill order to analyze RPV propulsion. This code uses a iteration ,,theme to
find the voltage and current at which the power available equals the power required. At this point
there is no excess power, therefore the rate-of-climb is equal to zero (cruise). The input to this
program included the motor and propeller characteristics indicated above. The endurance at cruise
was calculated using the net battery capacity and the cruise current draw. The net battery capacity
is the capacity remaining for cruise after subtracting the capacity used during take-off, climb to
altitude and landing. The maximum range and endurance were calculated by using the power code
at a wide range of cruise velocities.
Endurance =Net Battery Capacity
Cruise Current DrawRange = Cruise Velocity x Endurance
Table 5.5: Predicted Cruise Performance
cruise velocity 30 feet/see.
range 14,344 feet
endurance 478 sec.= 7 rain. 58 sec.
current draw
voltage
power required = available
6.5 amps
9.5 volts
28 watts = {).0375 Hp.
motor RPM 10303
propeller RPM 4653
tiptop 0.68
advance ratio (J) 0.39
5.7 Motor Control
During take-off the maximum power output of the motor is desired for the minimum take-
off distance. Conversely, a comparatively small power output is necessary during cruise. The
Page 5-8
necessitvof differentvelocityandpowersettingsmeansthataspeedcontrollermustbeusedin
conjunctionwith theradio-controlsystem.This throttlecontrol will beon theFutaba radio control.
For take-off the pilot will hold the throttle all of the way open until the plane lifts off of the ground
and achieves a safe altitude. The pilot will then try to nim the aircraft with the elevator while
reducing the power to that necessary for cruise at 3{) ft/s. This corresponds to a throttle setting of
approximately (I.6 based on the maximum velocity ot 51) ft/s.
These propulsion characteristics were calculated using the latest design values for The
Bunny. It is imperative that the calculations be reevaluated if estimates of weight, drag or other
design variables change during subsequent design iterations.
Page 5-_)
6.0o WEIGHT ANALYSIS
6.1 Preliminary Estimation
An estimation of the weight of The Bunny was very important in the initial stages of
the design as it is of considerable concern with regard to aerodynamics and propulsion.
However, basing an estimation merely on a concept is a very difficult task. Therefore,
based on the size of the aircraft and the goal range for which The Bunny was being
designed, rough component weight estimations were made by referring to the compiled
database of previous RPV designs of similar sizes and ranges listed in Appendix C. For
example, an RPV with a similar range and payload would most likely require a similar size
motor and number of batteries. Also, wing and fuselage weights were plotted against
fuselage volume as a means of obtaining a range for their individual weights. It was
decided that high weight estimates would be more beneficial in the early stages of the
design since lower actual weights would improve the performance in most cases. Also,
observing the weight percentages, it was noted that the areas for the greatest improvement
(reduction) in weight were in the fuselage and wing structures (considering the propulsion
system variation to be rather limited due to the design goal range). The initial estimates
resulted in an overall prototype weight of 94.8 ounces (5.95 lbs) when fully loaded. (See
Table 6.1).
6.2 Final Values and Estimates
As the design evolved, actual weights of certain components were obtained with a
propulsion system selection and structural analysis and the overall prototype weight was
refined. Commitment to the Astro 15 engine and 13 P-90SCR batteries to achieve the
necessary takeoff voltage set those weights at 7.5 ounces and 18 ounces respectively, and
the Zinger 12-6 propeller selected weighs _69 ounces. The use of flaps in our design
required an extra servo adding 0.6 ounces. Finally, the structural analysis discussed in
Section 9 provided more dependable values for wing (14.4 ounces), empenage (6.3
ounces), and fuselage weights (11.68 ounces), although these values are still estimates. As
was expected, the updated value of the prototype weight was much (15%) lower than the
original estimated value, at 80.49 ounces (5.03 lbs) fully loaded. (Note: An estimation of
Monokote skin weight (4.3 ounces) was made post-analysis, resulting in an overall weight
estimation of 84.8 ounces (5.3 Ibs)). Although the possibility exists for an increase in this
weight through manufacturing considerations (glue, screws, added structural supports,
etc.), Here is plenty of room for added weight as 6 lbs was consistently used throughout all
preliminary performance and aerodynamic calculations. (See Table 6.1).
Page 6-1
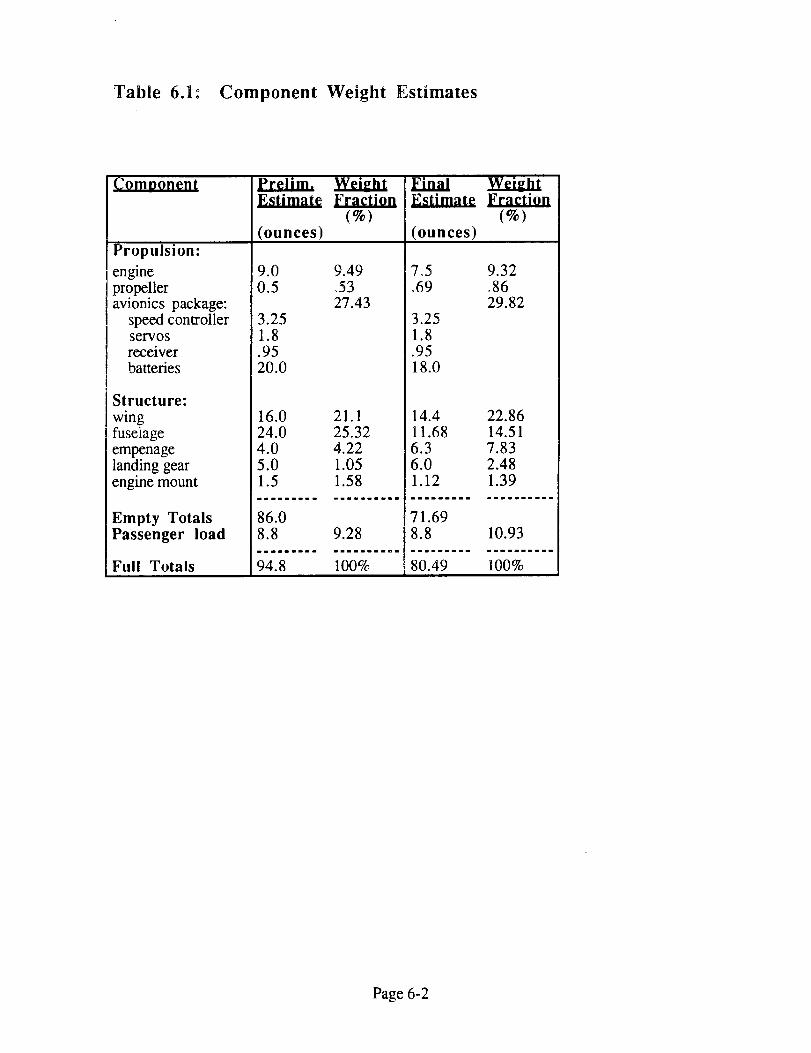
Table 6.1 ° Component Weight Estimates
Comnonent
Propulsion:
enginepropelleravionics package:
speed controllerservosreceiverbatteries
Structure:
wingfuselage
empenagelanding gear
engine mount
Empty TotalsPassenger load
Full Totals
Prelim.Estimate Fraction
(%)(ounces)
9.0 9.49
0.5 .5327.43
3.251.8.9520.0
16.0 21.124.0 25.324.0 4.225.0 1.05
1.5 1.58
Final
(ounces)
7°5.69
3.25
1.8.9518.0
Fraction
(%)
9.32°8629.82
14.4 22.86
11.68 14.516.3 7.836.0 2.481.12 1.39
86.0 71.698.8 9.28 8.8 10.93
94.8 100% 80.49 100%
Page 6-2
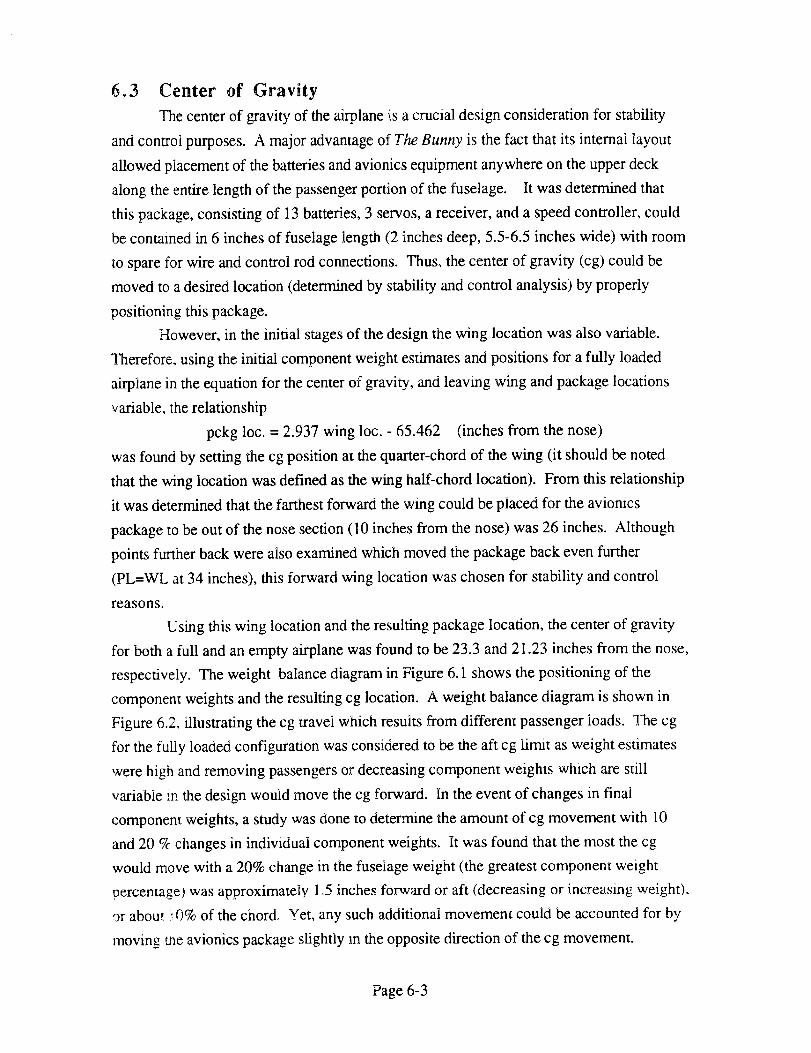
6.3 Center of Gravity
The center of gravity of the airplane is a crucial design consideration for stability
and control purposes. A major advantage of The Bunny is the fact that its internal layout
allowed placement of the batteries and avionics equipment anywhere on the upper deck
along the entire length of the passenger portion of the fuselage. It was determined that
this package, consisting of 13 batteries, 3 servos, a receiver, and a speed controller, could
be contained in 6 inches of fuselage length (2 inches deep, 5.5-6.5 inches wide) with room
to spare for wire and control rod connections. Thus, the center of gravity (cg) could be
moved to a desired location (determined by stability and control analysis) by properly
positioning this package.
However, in the initial stages of the design the wing location was also variable.
Therefore, using the initial component weight estimates and positions for a fully loaded
airplane in the equation for the center of gravity, and leaving wing and package locations
variable, the relationship
pckg loc.= 2.937 wing loc. - 65.462 (inches from the nose)
was found by setting the cg position at the quarter-chord of the wing (it should be noted
that the wing location was defined as the wing half-chord location). From this relationship
it was determined that the farthest forward the wing could be placed for the avionics
package to be out of the nose section (10 inches from the nose) was 26 inches. Although
points further back were also examined which moved the package back even further
(PL=WL at 34 inches), this forward wing location was chosen for stability and control
reasons.
Using this wing location and the resulting package location, the center of gravity
for both a full and an empty airplane was found to be 23.3 and 21.23 inches from the nose,
respectively. The weight balance diagram in Figure 6.1 shows the positioning of the
component weights and the resulting cg location. A weight balance diagram is shown in
Figure 6.2, illustrating the cg travel which resuits from different passenger loads. The cg
for the fully loaded configurauon was considered to be the aft cg limit as weight estimates
were high and removing passengers or decreasing component weights which are still
variable in the design would move the cg forward. In the event of changes in final
componem weights, a study was done to determine the amount of cg movement with 10
and 20 cA changes in individual component weights. It was found that the most the cg
would move with a 20% change in the fuselage weight (the greatest component weight
percentage) was approximately 1.5 inches forward or aft (decreasing or increasing weight),
or about i!0% of the chord. Yet, any such additional movement could be accounted for by
moving me avionics package slightly in the opposite direction of the cg movement.
Page 6-3
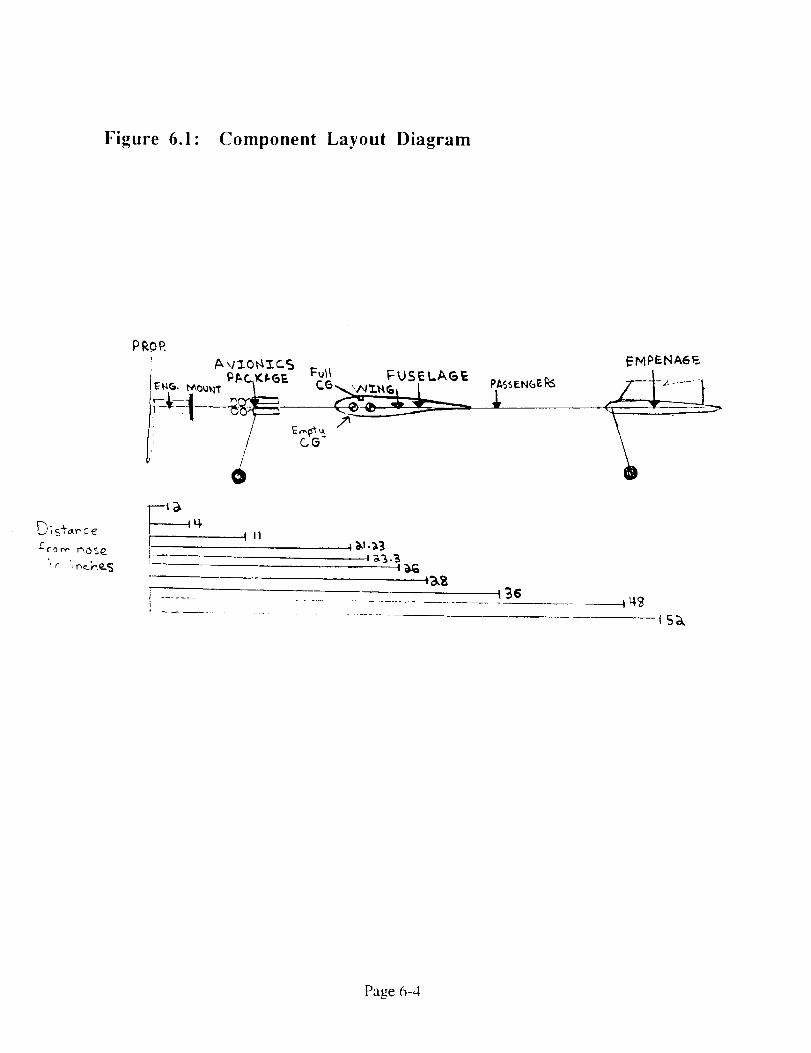
Figure 6.1" Component Layout Diagram
f-
'_r '_r_c].,__S
PROP,
i A \l_o_Ic.S Fu_l FUSELAGE
GG
PASsEN(_E
EMPENA6_-
______u,II1
_36
Page 6-4
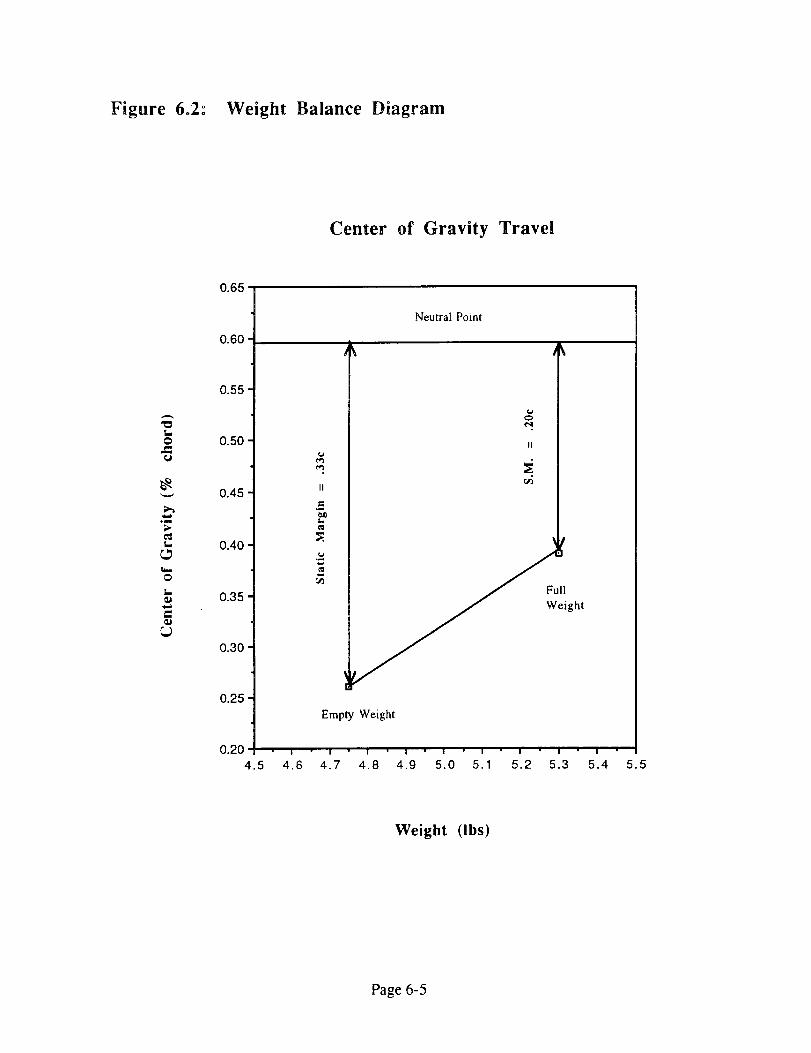
Figure 6°2: Weight Balance Diagram
Center of Gravity Travel
"oL.
.m
t.
t_
0.65
0.60
0.55
0.50
0.45
0.40
0.35
0.30
0.25
Neutral Point
._=t_
eq
II
_A
eight
Empty Weight
0.20
4.5 4.6 4.7 4.8 4.9 5.0 5.1 5.2 5.3 5.4 5.5
Weight (Ibs)
Page 6-5
7.0 STABILITY AND CONTROL
The Bz_nny must exhibit the following characteristics:
1) longitudinal stability through the horizontal tail
2) longitudinal control for maneuvering and trim through the elevator
3) lateral stability through dihedral
4) directional stability through the vertical tail
5) lateral/directional control through rudder-dihedral interaction
At this stage, primary design consideration will be given to static stability. The design
issues and trade-offs necessary to meet these requirements are described below. The
analysis methods used for the design can be found in Appendix B.
7.1 l.ongitudinai Stability
Longitudinal stability is critical for the airplane's flying qualities. Without
sufficient longitudinal stability, the aircraft will be extremely difficult to handle.
Desirable longitudinal stability corresponds to a negative slope of the pitching moment
coefficient versus alpha curve: for a nose up change in angle of attack, the moment
developed is negative and thus rotates the nose downward. Since the proposed aircraft
concept is remotely piloted, stability is especially important since a remote pilot's
response time is relatively long.
Static margin is a typical measure of the amount of longitudinal stability of an
aircraft. Static margin (SM) is defined as the distance between the center of gravity and
the neutral point in percent of chord. A typical aircraft needs a static margin of 5-l()')f to
be sufficiently stable: for an RPV, it is recommended that the SM be increased to 2(}5f.
The method indicated in Appendix B was used to obtain the horizontal tail sizing.
The design point was taken to be the aftmost e.g. location, which corresponds to the
maximum capacity configuration. The design SM was set at .2 and the horizontal tail
was sized to produce a neutral point which corresponded to this SM. The tail moment
arm was set by the fuselage length and a fiat plate design was chosen for ease of
construction. A high aspect ratio was desired i.l order to increase the lift curve slope of
the tail: however, increasing the aspect ratio leads to increased structural weight for tile
tail. Therefore a moderate aspect ratio of 2.5 was chosen. With these parameters fixed,
the necessary horizontal tail area was calculated. The resulting horizontal tail
configuration is given in Table 7.1.
Page 7-I
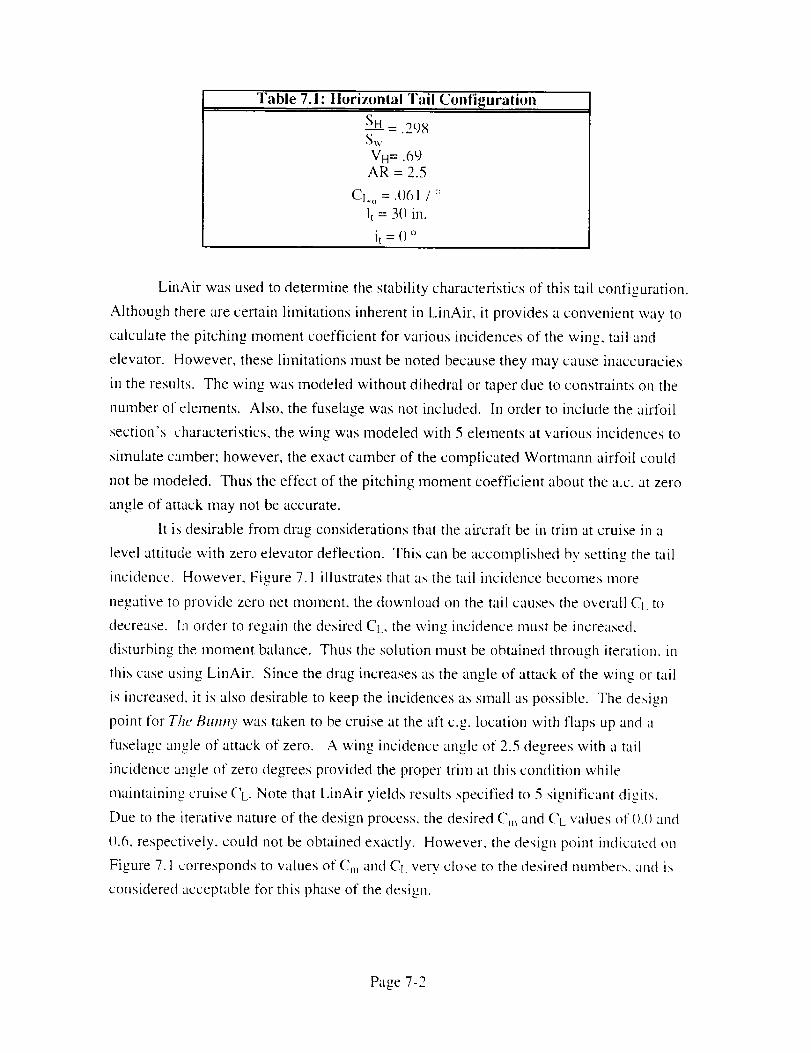
Table 7.1: Horizontal Tail Configuration
SI-I = .298Sw
VH= .69AR = 2.5
CL, , = .1_61 / _'
It = 30 ill.
it=(I °
LinAir was used to determine the stability characteristics of this tail configuration.
Although there are certain limitations inherent in LinAir, it provides a convenient way to
calculate the pitching inoment coefficient for various incidences of the wing, tail and
elevator. However, these limitations must be noted because they may cause inaccuracies
in the results. The wing was modeled without dihedral or taper due to constraints on the
number of elements. Also, the fuselage was not included. In order to include the airfoil
section's characteristics, the wing was modeled with 5 elements at various incidences to
simulate camber: however, the exact camber of the complicated Wortmalm airfoil could
not be modeled. Thus the effect of the pitching inoment coefficient about the a.c. at zero
angle of attack may not be accurate.
It is desirable from drag considerations that the aircraft be in trim at cruise in a
level attitude with zero elevator deflection. This can be accomplished by setting the tail
incidence. However, Figure 7.1 illustrates that as the tail incidence becomes nlole
negative to provide zero net molnent, the download on the tail causes the overall CL, to
decrease. In order to regain the desired Ct,, the wing incidence must be increased,
disturbing the molnent balance. Thus the solution must be obtained through iteration, m
this case using LinAir. Since the drag increases as the angle of attack of the wing or tail
is increased, it is also desirable to keep the incidences as small as possible. The design
point for The Bunny was taken to be cruise at the aft e.g. location with flaps up and a
fuselage angle of attack of zero. A wing incidence angle of 2.5 degrees with a tail
incidence angle of zero degrees provided the propel trim at this condition while
maintaining cruise CL. Note that LinAir yields results specified to 5 significant digits.
Due to the iterative nature of the design process, the desired C,n and CL values of ().() and
(I.6, respectively, could not be obtained exactly. However, the design point indicated on
Figure 7.1 corresponds to values of C,n and Ct_ very close to the desired numbers, and is
considered acceptable for this phase of the design.
Page 7-2
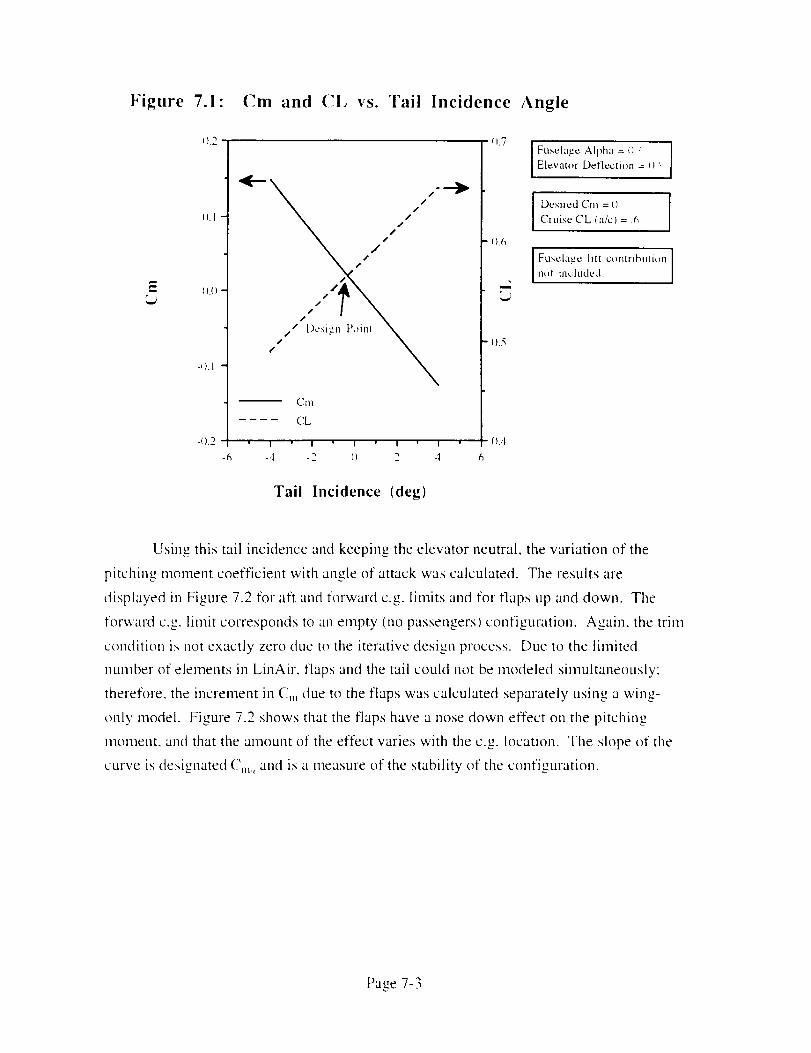
Figure 7.1- Cm and CL vs. Tail Incidence Angle
().2
(}.1
4).1
-(I.2
(i.7
,, It ,, '''''t/tit" "_
/// [)¢_ign [>_m_l
rill
CL
I I I I I
-6 -4 -2 () 2 4 6
Tail Incidence (deg)
0.6
i
().5
0.4
I Fuselage Alpha = i l " ]Elevator Deflectmn {) "
I Desired Cm = IICruise CL (a/c)= 6
I Fuselage lilt omtrlbtltiL,n Illtl[ 111,,.; ]tl de d.
Using this tail incidence and keeping the elevator neutral, the variation of the
pitching moment coefficient with angle of attack was calculated. The results are
displayed in Figure 7.2 for aft and forward e.g. lin-fits and fox flaps up and down. The
forward e.g. limit corresponds to an empty (no passengers) configuration. Again. the trim
condition is not exactly zero due to the iterative design process. Due to the limited
number of elements in LinAir. flaps and the tail could not be modeled simultaneously:
therefore, the increment in C,, due to the flaps was calculated separately using a wing-
only model. Figure 7.2 shows that the flaps have a nose down effect on the pitching
moment, and that the amount of the effect varies with the e.g. location. The slope of the
curve is designated (?,,,, and is a measure of the stability of the configuration.
Page 7-3
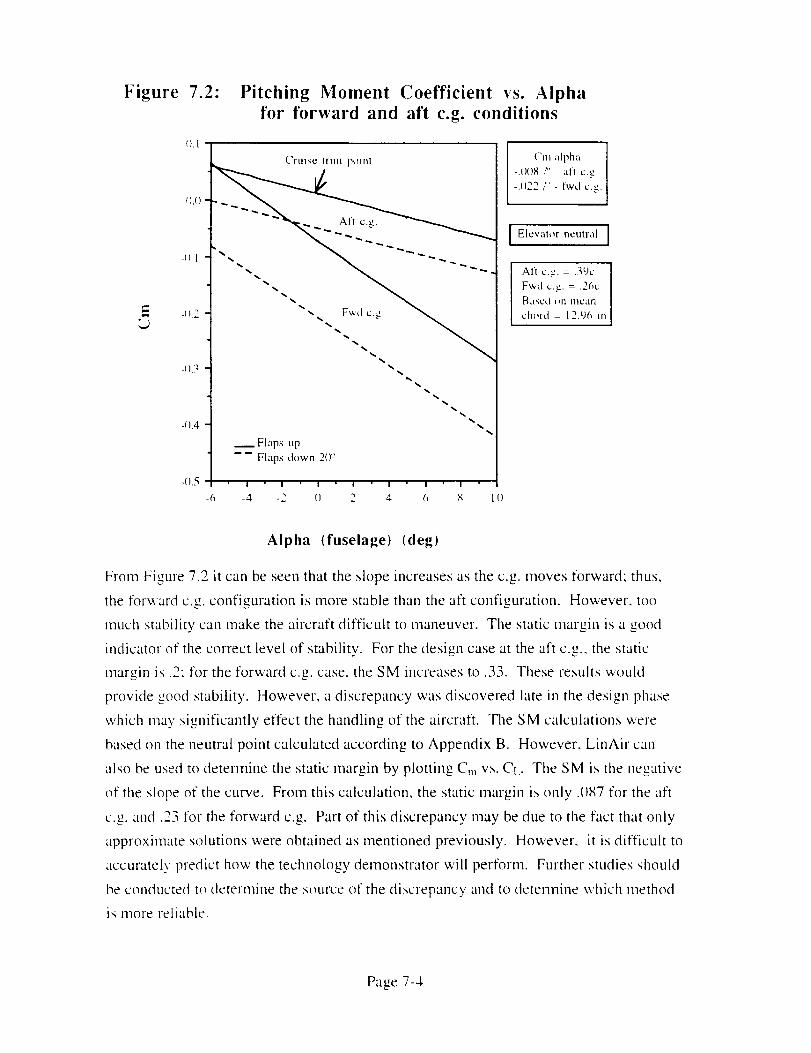
Figure 7.2:
tLl
Pitching Moment Coefficient vs. Alpha
for forward and aft c.g. conditions
-t)l
-0.3
-o.4
-{I.5
_ ptullt
"_ %' %. %,
%.%
%%,
'%.%+
%
%,
__ Flaps up
-- Flaps down 2() e
I I I I I I I
-6 -4 -__ {1 _'_ 4 6 M
Cm alpha
-.{)()R P' - afl e.g.
-,(122/'> - lwd e.g.
I Elevat,,r neutral I
Aft e.g. = .39c
Fwd e.g. = .26c
F_{tsct.t till illC;.til
chi>rd = 12.96 il'l
Alpha (fuselage) (deg)
From Figure 7.2 it can be seen that the slope increases as the e.g. moves forward: thus+
the for,+vard e.g. configuration is more stable than the aft configuration. However. too
much stability can make the aircraft difficult to maneuver. Tim static margin is a good
indicator of the correct level of stability. For the design case at the aft e.g.. the static
lnargin is .2: for the forward e.g. case. the SM increases to .33. These results would
provide good stability. However, a discrepancy was discovered late in the design phase
which mav significantly effect the handling of the aircraft. The SM calculations were
based on the neutral point calculated according to Appendix B. However, LinAir can
also be used to determine the static margin by plotting C,n vs. CL. The SM is the negative
of the slope of the curve. From this calculation, the static margin is only .1187 for the aft
c._, and "_"+. .,+_ for the forward e.g. Part of this discrepancy may be due to the fact that only
approximate solutions were obtained as mentioned previously. However, it is difficult to
accurately predict how the technology demonstrator will perform. Further studies should
be conducted to determine the source of the discrepancy and to deterlnine which method
is more reliable.
Page 7-4
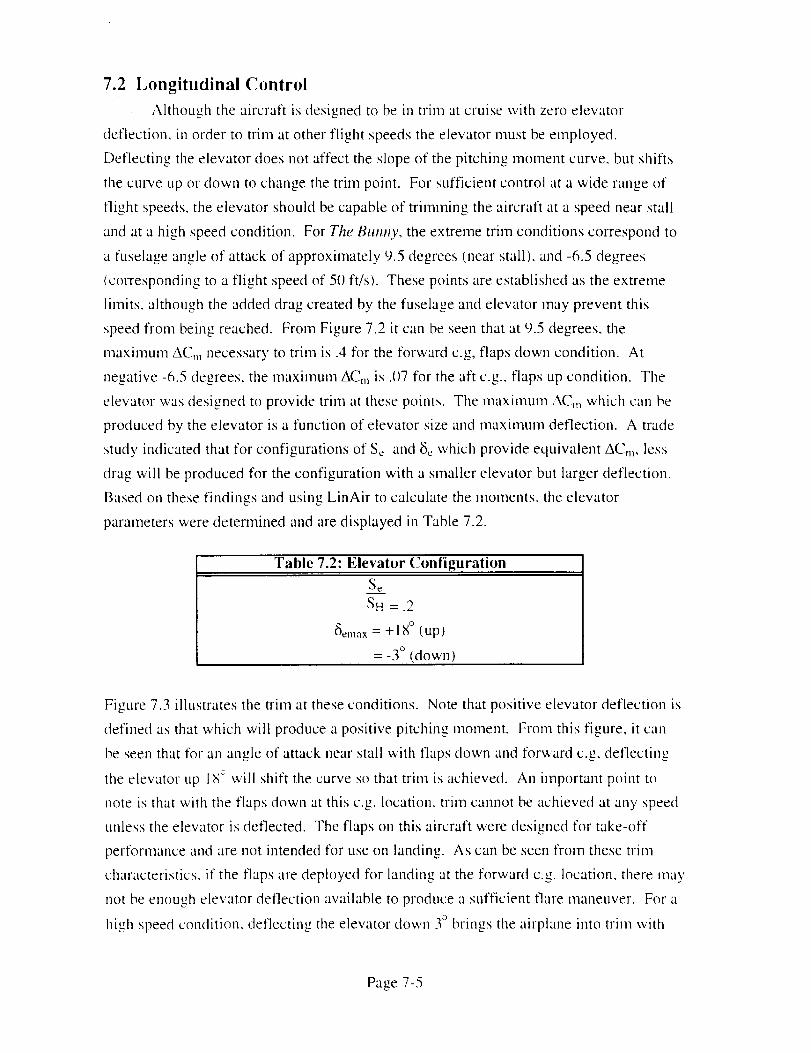
7.2 l,ongitudinal Control
Although the aircraft is designed to be in tlim at cruise with zero elevator
deflection, in order to trim at other flight speeds the elevator must be employed.
Deflecting the elevator does not affect the slope of the pitching monaent curve, but shifts
tile cmwe up or down to change the trim point. For sufficient control at a wide range of
flight speeds, the elevator should be capable of trimming the aircraft at a speed near stall
and at a high speed condition. For The Bumly, the extreme trim conditions correspond to
a fuselage angle of attack of approximately 9.5 degrees (near stall), and -6.5 degrees
(corresponding to a flight speed of 50 ft/s). These points are established as the extreme
limits, although the added drag created by the fuselage and elevator may prevent this
speed from being reached. From Figure 7.2 it can be seen that at 9.5 degrees, the
maximum ACre necessary to trim is .4 for the forward c.g, flaps down condition. At
negative -(_.5 degrees, the maximum ACre is .07 for the aft e.g., flaps up condition. The
elevator was designed to provide trim at these points. The maximum ACre which can be
produced by the elevator is a function of elevator size and maximum deflection. A trade
study indicated that for configurations of S,_ and t3_ which provide equivalent ACre, less
drag will be produced for the configuration with a smaller elevator but larger deflection.
Based on these findings and using LinAir to calculate the moments, the elevator
parameters were determined and are displayed in Table 7.2.
Table 7.2: Elevator Configuration
Se
SH = .2
15_,nax= +18 ° (up)
= -3 ° (down)
Figure 7.3 illustrates the trim at these conditions. Note that positive elevator deflection is
defined as that which will produce a positive pitching moment. From this figure, it can
be seen that for an angle of attack near stall with flaps down and forward c.g, deflecting
the elevator up 1_ will shift the curve so that trim is achieved. An important point to
note is that with the flaps down at this e.g. location, trim cannot be achieved at any speed
unless the elevator is deflected. The flaps on this aircraft were designed for take-off
performance and are not intended for use on landing. As can be seen from these trim
characteristics, if the flaps are deployed for landing at the forward e.g. location, there may
not be enough elevator deflection available to produce a sufficient flare maneuver. For a
high speed condition, deflecting the elevator down 3° brings the airplane into trim with
Page 7-5
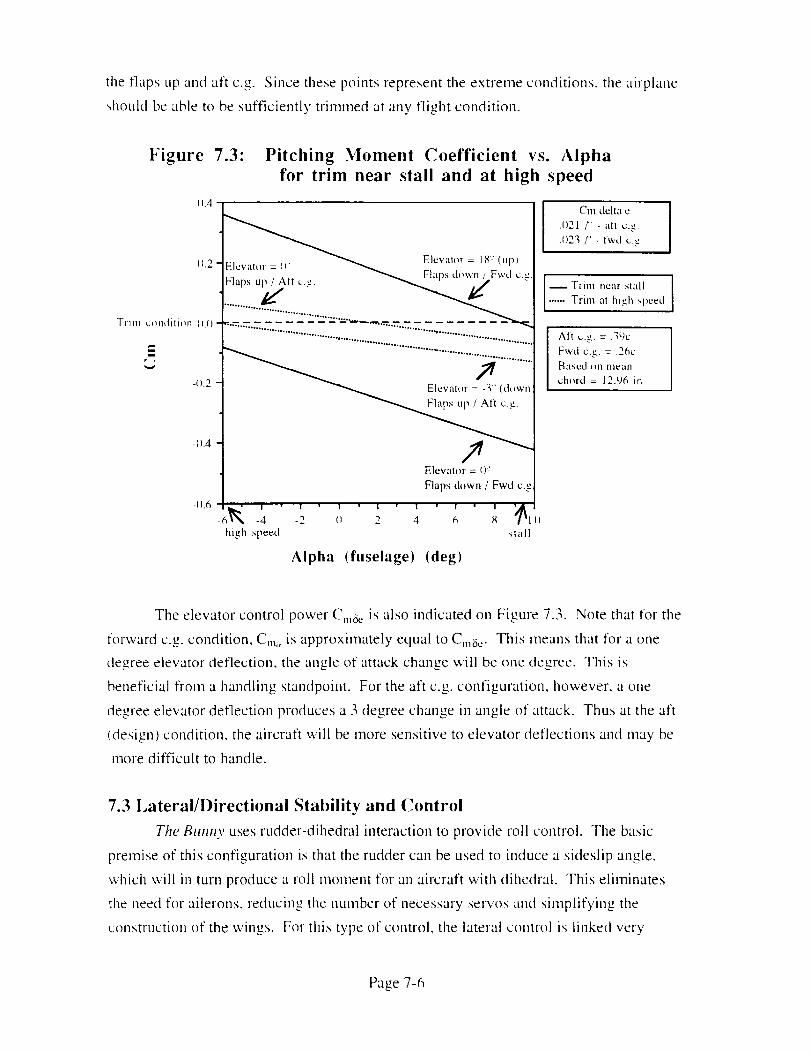
theflapsupandaft e.g. Sincethesepointsrepresenttheextrenmconditions,theairplane
shouldbeableto besufficiently trimmedat anyflight condition.
Figure 7.3- Pitching Moment Coefficient vs. Alpha
for trim near stall and at high speed
11.4
11.2 -
Trim c_mdithm (I.()-
.=
-11.2
-IL4
-11.6 I ' I '
_6_,_ -4
high speed
E cvalnr = 18': (t p
Elevalm- = II" _ ' "...... "_ Flaps th_wn / Fwd _.._'
......Elevat_lr = -_i" (down:
.g.
Elevator = ()"
Flaps down / Fwd c.g
I ' I ' I ' I ' I " I 'Jl_
-2 II 2 4 6 g -it ll)
sla[l
I Cm delta ¢
.1121 /': - all e.g.
.I)2?, ?'- fwd e.g.
-- Trim near stall...... Trim at high speed
All e.g. = 39c I
Fwd e.g. = .261: I_,:t:.ied t_ll lllearl
chnrd = 12.96 m
Alpha {fuselage) (deg)
The elevator control power C,,& is also indicated on Figure 7.3. Note that for the
forward e.g. condition, Cm, is approximately equal to C.n/5_. This means that for a one
degree elevator deflection, the angle of attack change will be one degree. This is
beneficial from a handliug standpoint. For the aft e.g. configuration, however, a one
degree elevator deflection produces a 3 degree change in angle of attack. Thus at the aft
(design) condition, the aircraft will be more sensitive to elevator deflections and may be
more difficult to handle.
7.3 l,aterai/Directional Slability and Control
The Bumpy uses rudder-dihedral interaction to provide roll control. The basic
premise of this configuration is that the rudder can be used to induce a sideslip angle,
which will in turn produce a roll moment for an aircraft with dihedral. This eliminates
the need for ailerons, reducing the number of necessary servos and simplifying the
construction of the wings. For this type of control, the lateral control is linked very
Page 7-6
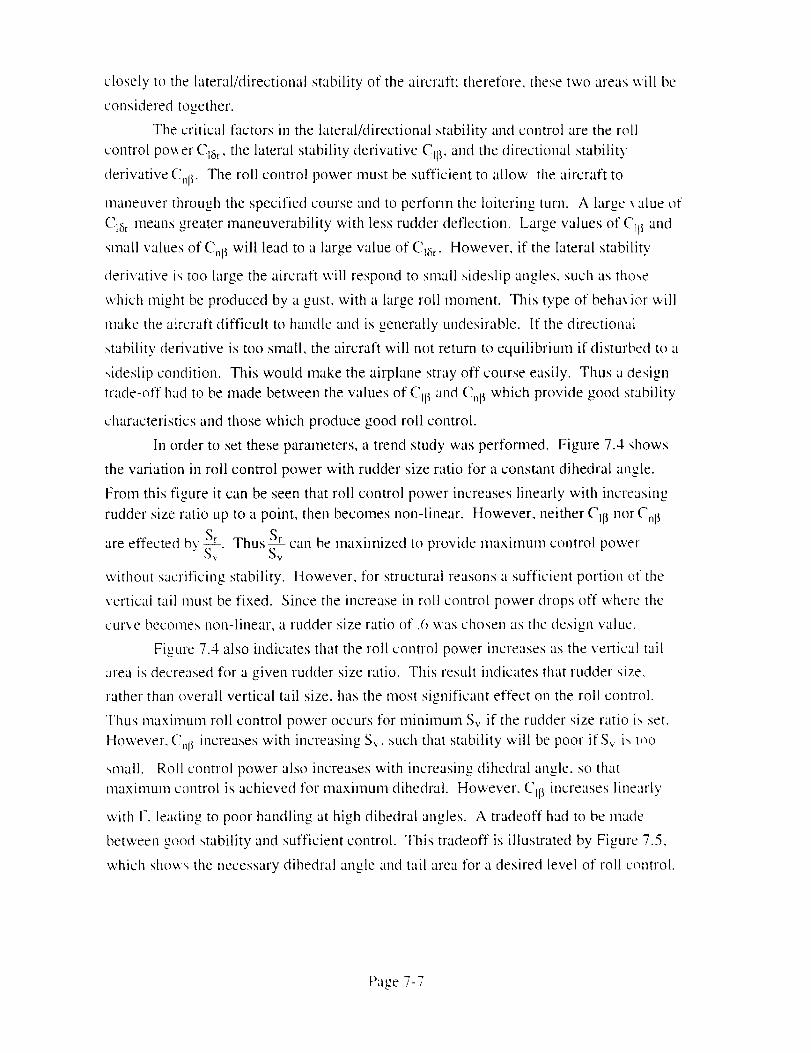
_.loselyto the lateral/directionalstabilityof theaircraft:therefore,thesetwo areaswill be
consideredtogether.
Thecritical factorsin the lateral/directionalstability andcontrol aretherollcontrolpo_verClar, the lateralstabilityderivativeClf_,andthedirectionalstability
derivativeC,q_.Theroll controlpowermustbesufficient to allow tileaircraft to
maneuverthroughthespecifiedcourseandto performtheloitering turn. A large\alue ofC18r meansgreatermaneuverabilitywith lessrudderdeflection. Largevaluesof CI_and
smallvaluesof Cn6will leadto alargevalueof CI&. However,if the lateralstability
derivativeis too largetheaircraft will respondto small sideslipangles,suchasthose
whichmight beproducedby agust,with a large roll moment. This type of behax ior will
make the aircraft difficult to handle and is generally undesirable. If the directional
stability derivative is too small, the aircraft will not return to equilibrium if disturbed to a
sideslip condition. This would make the airplane stray oft" course easily. Thus a design
trade-off had to be made between the values of Cll _ and Cnl_ which provide good stability
characteristics and those which produce good roll control.
In order to set these parameters, a trend study was performed. Figure 7.4 shows
the variation in roll control power with rudder size ratio for a constant dihedral angle.
From this figure it can be seen that roll control power increases linearly with increasing
rudder size ratio up to a point, then becomes non-linear. However, neither CI(_ nor Cnl_
S, S_are effected by _ST-v"Thus_- can be maximized to provide maximum control power
without sacrificing stability. However, for structural reasons a sufficient portion of the
vertical tail must be fixed. Since the increase in roll control power drops oft" where the
curve becomes non-linear, a rudder size ratio of .6 was chosen as the design value.
Figure 7.d. also indicates that the roll control power increases as the vertical tail
area is decreased for a given rudder size ratio. This result indicates that rudder size,
rather than overall vertical tail size, has the most significant effect on the roll control.
Thus maximum roll control power occurs for minimum S,, if the rudder size ratio is set.
However, C,_I_increases with increasing Sv, such that stability will be poor ifS,r is toO
small. Roll control power also increases with increasing dihedral angle, so that
maximum control is achieved for maximum dihedral. However, CI[_ increases linearly
with F, leading to poor handling at high dihedral angles. A tradeoff had to be made
between good stability and sufficient control. This tradeoff is illustrated by Figure 7.5.
which sho_'_ the necessary dihedral angle and tail area for a desired level of roll control.
Page 7-7
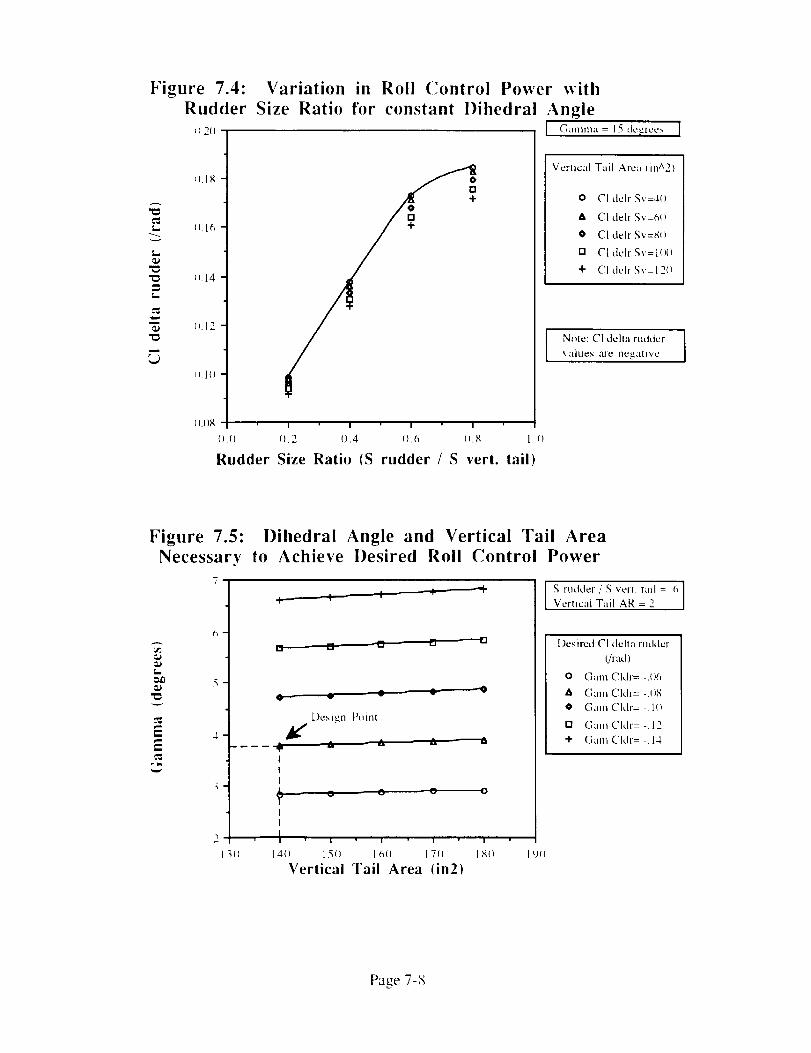
Figure 7.4: Variation in Roll (7ontrol Power with
Rudder Size Ratio for constant Dihedral Angle1},2{) I (-3_Hlllll;.t = 15 tlt2_l"dC>, ]
L
L
L
¢D
m
14
I. L2
0
(1.2 ().4 o.6 (I.g l .()
Rudder Size Ratio (S rudder / S vert. tail)
Verhcal Tail Area Iina2)
0 CI delr gv=4l)
A C1 deLr Sv=6(!
• CI delr Sv=X()
[] CI dch Sv=l()(}
+ CI dch Sv=12(I
I Nixie: CI della rudder', alues ;tre ncgatp,,c
Figure 7.5:
L
EE
rN
Dihedral Angle and Vertical Tail Area
Necessary to Achieve Desired Roll Control Power
@.__ + 4 4 '
III
_(i
[] .-.Ii.i i.i
Design t'thnt
v
2. ,",
II
' l " I ' I " I
14(1 15() 16() l 7(1 l X(t
Vertical Tail Area (in2)
I .S rudder ,i ,_ veri. tail : (_ IIVertical Tail AR = 2
Desired CI delta rudder
{/rad)
o Ganl CldI= -.1)6
A Gain Cldr= -.I)N
0 Gain Cldr: l()
[] Gam CMr= -.12
+ Gam Cldr= -.14
I c)(I
Page 7-X
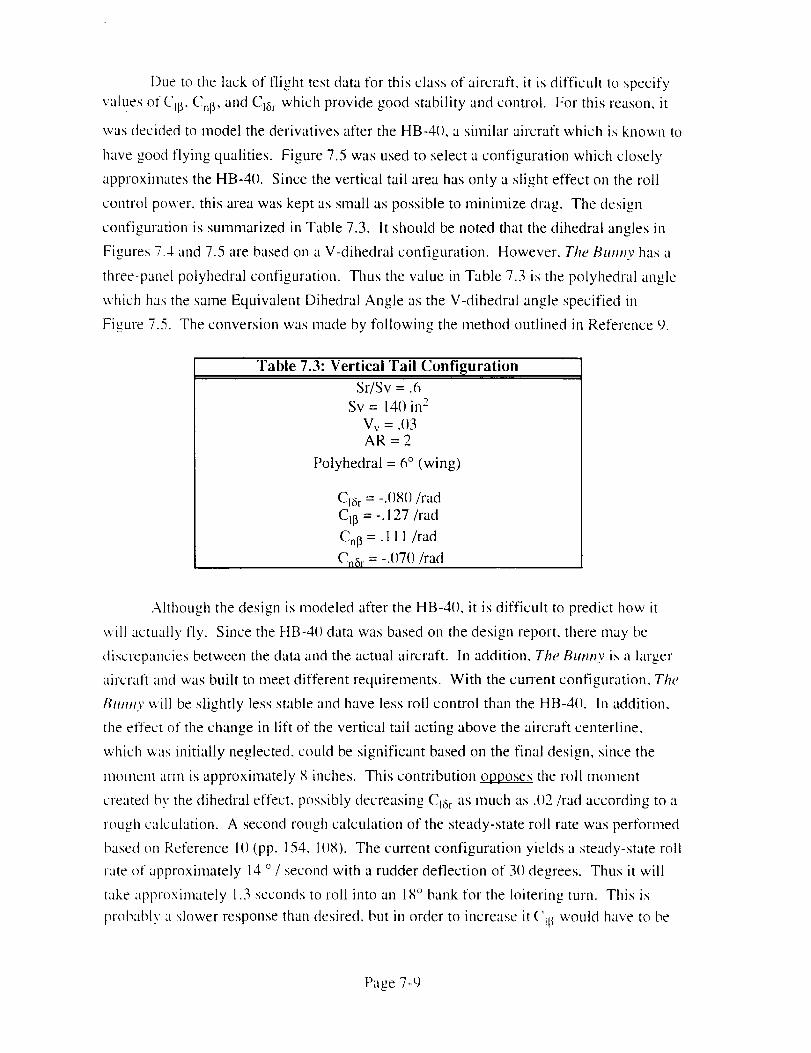
Dueto the lackof flight testdatafor thisclassof aircraft, it is difficult to specifyvaluesof CII_,Cnt> andCI& whichprovidegoodstability andcontrol. For thisreason,it
wasdecidedto model thederivativesafterthe HB-4(),asimilar aircraftwhich is knownto
havegoodflying qualities. Figure7.5wasusedto selecta configurationwhichcloselyapproximatestheHB-40. Sincetheverticaltail areahasonly a slight effecton theroll
controlpower,this areawaskeptassmallaspossibleto minilnize drag. Thedesign
configurationis summarizedin Table7.3. It shouldbenotedthatthedihedralanglesm
Figures7.4and7.5 arebasedonaV-dihedralconfiguration. However,The [:llt#t#lV has a
three-panel polyhedral configuration. Thus the value in Table 7.3 is the polyhedral angle
which has the same Equivalent Dihedral Angle as the V-dihedral angle specified in
Figure 7.5. The conversion was made by following the method outlined in Reference 9.
"Fable 7.3: Vertical "Fail Configuration
Sr/Sv = .6
Sv = 140 in 2
Vv = .03AR = 2
Polyhedral = 6 ° (wing)
CI6 r = -.()g{) /tad
CIIt = -. ! 27/rad
Cnl_ =. 111/rad
Cn_ r = -.070/rad
Although the design is modeled after the HB-4(L it is difficult to predict how it
will actually fly. Since the HB-4(I data was based on the design report, there may be
discrepancies between the data and the actual aircraft. In addition, The Bunny is a larger
aircraft and was built to meet different requirements. With the current configuration, The
Btmnv will be slightly less stable and have less roll control than the HB-4(I. In addition,
the effect of the change in lift of the vertical tail acting above the aircraft centerline,
which was initially neglected, could be significant based on the final design, since the
moment arm is approximately 8 inches. This contribution opposes the roll moment
created by the dihedral effect, possibly decreasing Cia r as much as .()2/rad according to a
rough calculation. A second rough calculation of the steady-state roll rate was performed
based on Reference ll) (pp. 154, 11)8). The current configuration yields a steady-state roll
rate of approximately 14 ° / second with a rudder deflection of 3(1 degrees. Thus it will
take approximately 1.3 seconds to roll into an 18° bank for the loitering turn. This is
probably a slower response than desired, but in order to increase it ('ill would have to be
Page 7-9
increased,makingthe aircraftveryroll-sensitiveto sideslipdisturbances.At thisstageof
thedesign,it is felt thattheIoll ratecanbesacrificedslightly for thesakeof goodlateral
stability. It is recommendedthatthenextstageof designincorporatetheseroll rate
equationsinto theearlyphasesin orderto adjusttheconfigurationfor betterroll control.
7.4 Control Mechanisms
The control surfaces employed by Tile Bumpy are the rudder, elevator and flaps.
Three servos are used to drive these control surfaces: one for the rudder, one for the
elevator, and one servo with a connection to each of the flaps, which are located on either
side of the fuselage. The wires will be attached to the control surfaces by small
protruding horns extending from the surface. The servos will be driven on three separate
remote control channels. The pilot will provide input to the radio transmitter, which will
then activate the servos on board. The rudder and elevator controls on the radio
transmitter return to the zero position when released, with a separate trim control to adjust
the zero position if necessary. This configuration allows small step inputs to the rudder
or elevator to be made easily. The flap control is also of this type, meaning that on take-
off the pilot will have to hold the flap control in the flaps down position. While this will
require a somewhat higher degree of pilot coordination, it will not affect the propulsion
control and should not create a significant pilot workload problem.
Page 7- 10
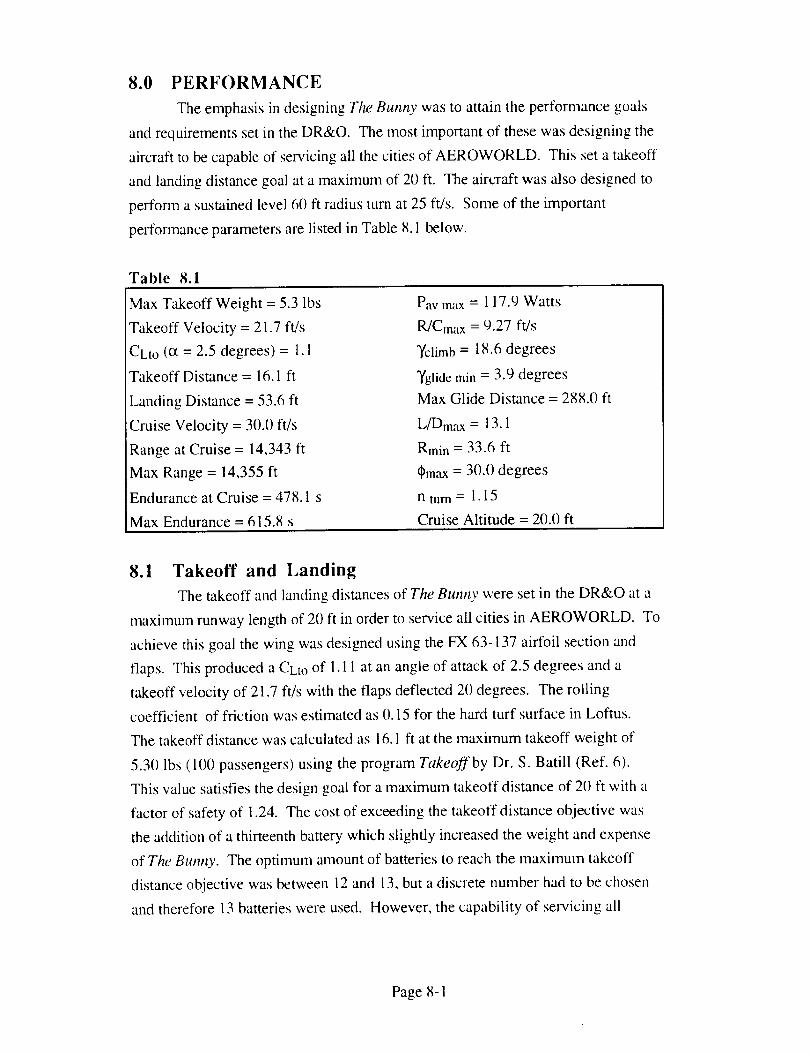
8.0 PERFORMANCE
The emphasis in designing The Bunny was to attain the performance goals
and requirements set in the DR&O. The most important of these was designing the
aircraft to be capable of servicing all the cities of AEROWORLD. This set a takeoff
and landing distance goal at a maximum of 20 ft. The aircraft was 'also designed to
perform a sustained level 60 ft radius turn at 25 ft/s. Some of the important
perfonnance parameters are listed in Table 8.1 below.
Table 8.1
Max Takeoff Weight = 5.3 lbs
Takeoff Velocity = 21.7 ft/s
CLto (o_ = 2.5 degrees) = 1.1
Takeoff Distance = 16.1 ft
Landing Distance = 53.6 ft
Cruise Velocity = 30.0 ft/s
Range at Cruise = 14,343 ft
Max Range = 14,355 ft
Endurance at Cruise = 478.1 s
Max Endurance = 615.8 s
Pav max = 117.9 Watts
R/Cmax = 9.27 ft/s
_tclim b = 18.6 degrees
_tglide rain = 3.9 degrees
Max Glide Distance = 288.0 ft
L/Dmax = 13.1
Rmin = 33.6 ft
_max = 30.0 degrees
n turn = 1.15
Cruise Altitude = 20.0 ft
8.1 Takeoff and Landing
The takeoff and landing distances of The Bunny were set in the DR&O at a
maximum runway length of 20 ft in order to service all cities in AEROWORLD. To
achieve this goal the wing was designed using the FX 63-137 airfoil section and
flaps. This produced a CLto of 1.11 at an angle of attack of 2.5 degrees and a
takeoff velocity of 21.7 ft/s with the flaps deflected 20 degrees. The rolling
coefficient of friction was estimated as (). 15 for the hard turf surface in Loftus.
The takeoff distance was calculated as 16.1 ft at the rnaxirnum takeoff weight of
5.30 lbs (100 passengers) using the program Takeoffby Dr. S. Batill (Ref. 6).
This value satisfies the design goal for a maxirnum takeoff distance of 20 ft with a
factor of safety of 1.24. The cost of exceeding the t_eoff distance objective was
the addition of a thirteenth battery which slightly increased the weight and expense
of The Bunny. The optimum amount of batteries to reach the maximum takeoff
distance objective was between 12 and 13, but a discrete number had to be chosen
and therefore 13 batteries were used. However, the capability of servicing all
Page 8-1
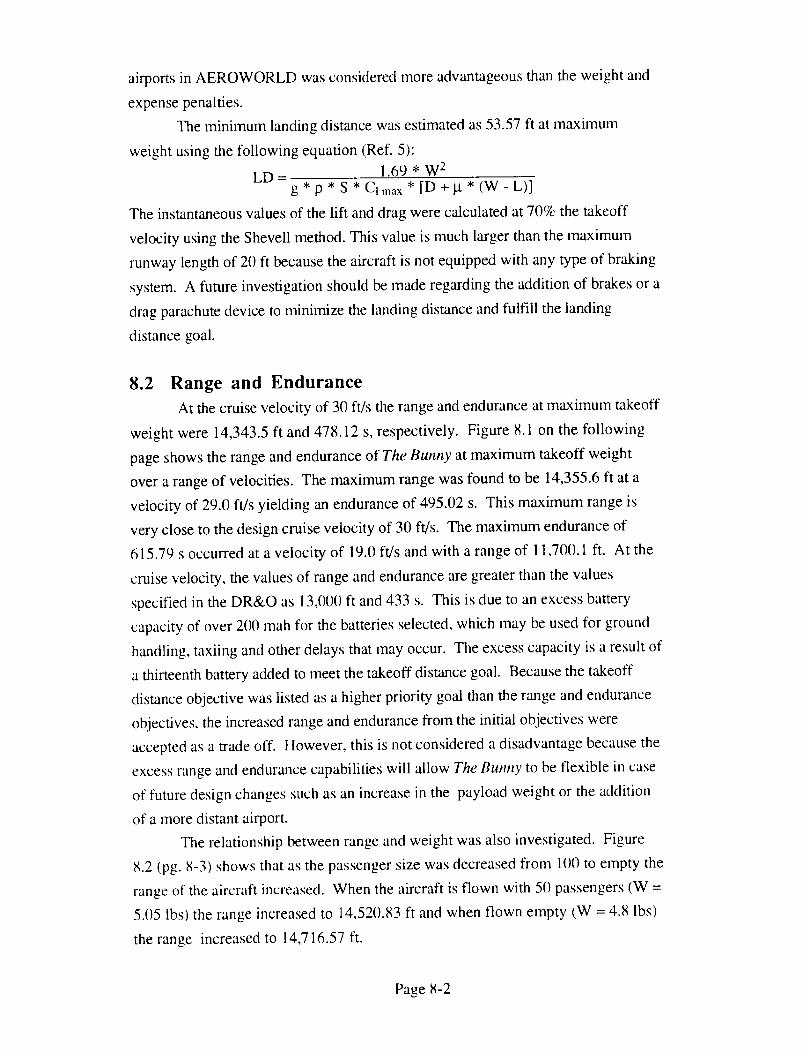
airportsin AEROWORLDwasconsideredmoreadvantageousthantheweightand
expensepenalties.Theminimumlandingdistancewasestimatedas53.57ft atmaximum
weightusingthefollowing equation(Ref.5):LD- 1.69* W2
g * p * S * Clmax* [D + g * (W - L)]
Theinstantaneousvaluesof thelift anddragwerecalculatedat70%thetakeoff
velocityusingtheShevellmethod.Thisvalueismuchlargerthanthemaximum
runwaylengthof 20ft becausetheaircraftis notequippedwith anytypeof braking
system.A future investigationshouldbemaderegardingtheadditionof brakesora
dragparachutedeviceto minimizethelandingdistanceandfulfill thelanding
distancegoal.
8.2 Range and Endurance
At the cruise velocity of 30 ft/s the range and endurance at maximum takeoff
weight were 14,343.5 ft and 478.12 s, respectively. Figure 8.1 on the following
page shows the range and endurance of The Bunny at maximum takeoff weight
over a range of velocities. The maximum range was found to be 14,355.6 ft at a
velocity of 29.0 ft/s yielding an endurance of 495.02 s. This maximum range is
very close to the design cruise velocity of 30 ft/s. The maximum endurance of
615.79 s occurred at a velocity of 19.0 ft/s and with a range of 11,700.1 ft. At the
cruise velocity, the values of range and endurance are greater than the values
specified in the DR&O as 13,000 ft and 433 s. This is due to an excess battery
capacity of over 200 mah for the batteries selected, which may be used for ground
handling, taxiing and other delays that may occur. The excess capacity is a result of
a thirteenth battery added to meet the takeoff distance goal. Because the takeoff
distance objective was listed as a higher priority goal than the range and endurance
objectives, the increased range and endurance from the initial objectives were
accepted as a trade off. However, this is not considered a disadvantage because the
excess range and endurance capabilities will allow The Bunny to be flexible in case
of future design changes such as an increase in the payload weight or the addition
of a more distant airport.
The relationship between range and weight was also investigated. Figure
8.2 (pg. 8-3) shows that as the passenger size was decreased from 100 to empty the
range of the aircraft increased. When the aircraft is flown with 50 passengers (W =
5.05 lbs) the range increased to 14,520.83 ft and when flown empty (W = 4.8 lbs)
the range increased to 14,716.57 ft.
Page 8-2
Figure 8.1 Range and Endurance Versus Velocity
15OOO
Maximum Range
14000
13000
1200(I
e_
11000
10000
9OOO
----I1--- Range
Endurance
10
Design Cruise Velocity
\
20 30 40
Velocity (ills)
50
7O0
Maximum Endurance
6O0
aa
lla
50O =L
400
3O0
Figure 8.2
u
u
5.4
5.3
5.2
5.1
5,0
4.9
4.g
4.7
143OO
Payload Versus Range
100 Passengers
50 Passengers
() Passengers
14400 1450(1 146()0 14700 14800
Range (ft)
Page 8-3
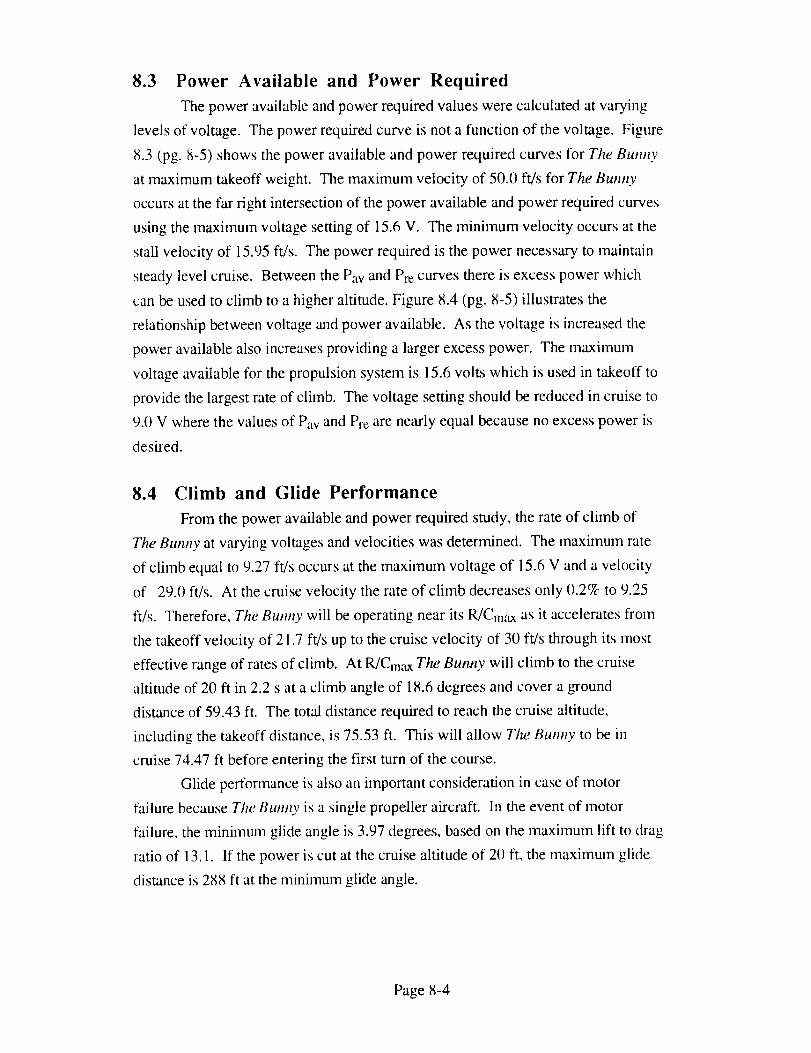
8.3 Power Available and Power Required
The power available and power required values were calculated at varying
levels of voltage. The power required curve is not a function of the voltage. Figure
8.3 (pg. 8-5) shows the power available and power required curves for The Bupmv
at maximum takeoff weight. The maximum velocity of 50.0 ft/s for The Bunny
occurs at the far fight intersection of the power available and power required curves
using the maximum voltage setting of 15.6 V. The minimum velocity occurs at the
stall velocity of 15.95 ft/s. The power required is the power necessary to maintain
steady level cruise. Between the Pay and Pre curves there is excess power which
can be used to climb to a higher altitude. Figure 8.4 (pg. 8-5) illustrates the
relationship between voltage and power available. As the voltage is increased the
power available also increases providing a larger excess power. The maximum
voltage available for the propulsion system is 15.6 volts which is used in takeoff to
provide the largest rate of climb. The voltage setting should be reduced in cruise to
9.0 V where the values of Pay and Pre are nearly equal because no excess power is
desired.
8.4 Climb and Glide Performance
From the power available and power required study, the rate of climb of
The Bunny at varying voltages and velocities was determined. The maximum rate
of climb equal to 9.27 ft/s occurs at the maximum voltage of 15.6 V and a velocity
of 29.0 ft/s. At the cruise velocity the rate of climb decreases only 0.2% to 9.25
ft/s. Therefore, The Bunny will be operating near its R/Cmax as it accelerates from
the takeoff velocity of 21.7 ft/s up to the cruise velocity of 30 ft/s through its most
effective range of rates of climb. At R/Cmax The Bunny will climb to the cruise
altitude of 20 ft in 2.2 s at a climb angle of 18.6 degrees and cover a ground
distance of 59.43 ft. The total distance required to reach the cruise altitude,
including the takeoff distance, is 75.53 ft. This will allow The Bunny to be in
cruise 74.47 ft before entering the first turn of the course.
Glide performance is also an important consideration in case of motor
failure because The Bunny is a single propeller aircraft. In the event of motor
failure, the minimum glide angle is 3.97 degrees, based on the maximum lift to drag
ratio of 13.1. If the power is cut at the cruise altitude of 20 ft, the maximum glide
distance is 288 ft at the minimum glide angle.
Page 8-4

Figure 8.3
I..
Power Required and Power AvailableVersus Cruise Velocity
2001 --[ Maximunl Velocity •
1 \-
| ' I 'l I I I I ' I
0 10 I 20 30 40 50 60
Minimum Velocity
Cruise Velocity fit/s)
• Power Required
A Power Available
7O
Figure 8.4
¢3
t..<D
Power Required and Power AvailableVersus Velocity
150
125
I(X)
75
Design Cruise Velocity
5O
• Power Required
• Pay at9 volts
ILl Pay at 11 volts
A Pav at 15.6 wdts
25
()
5 15 25 35 45 55
Velocity (ft/s)
Page 8-5
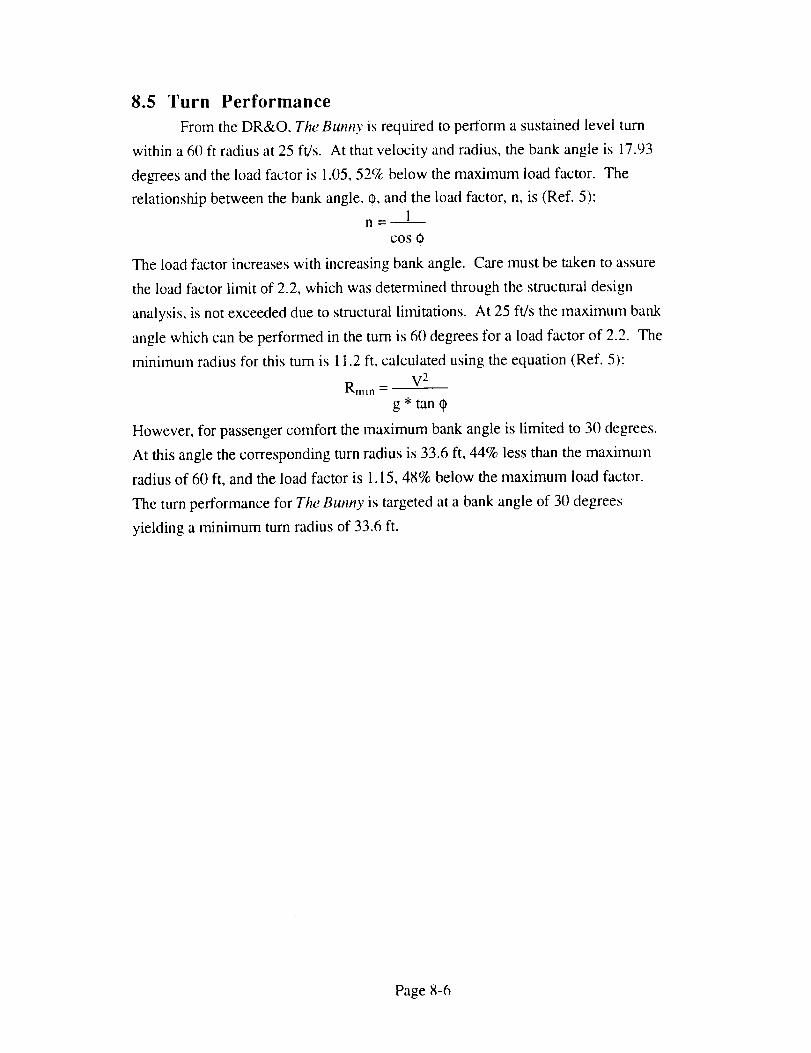
8.5 Turn Performance
From the DR&O, The Bunny is required to perform a sustained level turn
within a 60 ft radius at 25 ft/s. At that velocity and radius, the bank angle is 17.93
degrees and the load factor is !.05, 52% below the maximum load factor. The
relationship between the bank angle, 0, and the load factor, n, is (Ref. 5):1
COS (_
The load factor increases with increasing bank angle. Care must be taken to assure
the load factor limit of 2.2, which was determined through the structural design
analysis, is not exceeded due to structural limitations. At 25 ft/s the maximum bank
angle which can be performed in the turn is 60 degrees for a load factor of 2.2. The
minimum radius for this turn is 11.2 ft, calculated using the equation (Ref. 5):
Rmm - V2
g* tan ¢
However, for passenger comfort the maximum bank angle is limited to 30 degrees.
At this angle the corresponding turn radius is 33.6 ft, 44% less than the maximum
radius of 60 ft, and the load factor is 1.15, 48% below the maximum load factor.
The turn performance for The Bunny is targeted at a bank angle of 30 degrees
yielding a minimum turn radius of 33.6 ft.
Page 8-6
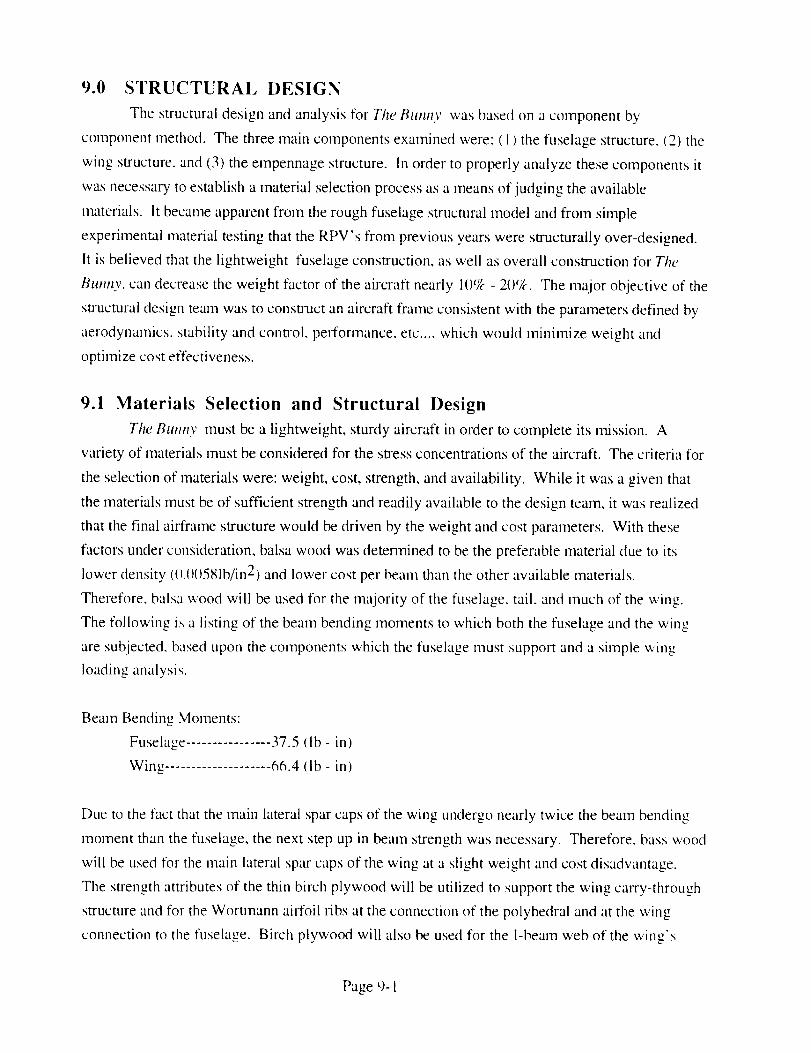
9.0 STRUCTURAl, DESIGN
The structuraldesignandanalysisfor The Bumzv was based on a component by
component method. The three main components examined were: (1) the fuselage structure, (2) the
wing structure, and (3) the empennage structure. In order to properly analyze these components it
was necessary to establish a material selection process as a means of judging the available
materials. It became apparent from the rough fuselage structural model and from simple
experimental material testing that the RPV's from previous years were structurally over-designed.
It is believed that the lightweight fuselage construction, as well as overall construction for The
Barely, can decrease the weight factor of the aircraft nearly 10% - 20%. The major objective of the
structural design team was to construct an aircraft frame consistent with the parameters defined by
aerodynamics, stability and control, performance, etc .... which would minimize weight and
optimize cost effectiveness.
9.1 Materials Selection and Structural Design
The Btomv must be a lightweight, sturdy aircraft in order to complete its ,nission. A
variety of materials must be considered for the stress concentrations of the aircraft. The criteria for
the selection of materi',ds were: weight, cost, strength, and availability. While it was a given that
the materials must be of sufficient strength and readily available to the design team, it was realized
that the final airframe structure would be driven by the weight and cost parameters. With these
factors under consideration, balsa wood was determined to be the preferable material due to its
lower density (I).l l(t581b/in 2) and lower cost per beam than the other available materials.
Therefore, balsa wood will be used for the majority of the fuselage, tail, and much of the wing.
The following is a listing of the beam bending moments to which both the fuselage and the wing
are subjected, based upon the components which the fuselage must support and a simple wing
loading analysis.
Beam Bending Moments:
Fuselage ................ 37.5 (lb - in)
Wing .................... 66.4 fib - in)
Due to the fact that the main lateral spar caps of the wing undergo nearly twice the beam bending
moment than the fuselage, the next step up in beam strength was necessary. Therefore. bass wood
will be used for the main lateral spar caps of the wing at a slight weight and cost disadvantage.
The strength attributes of the thin birch plywood will be utilized to support the wing carry-through
structure and for the Womnann airfoil ribs at the connection of the polyhedral and at the wing
connection to the fllselage. Birch plywood will also be used for the i-beam web of the wing's
Page 9- I
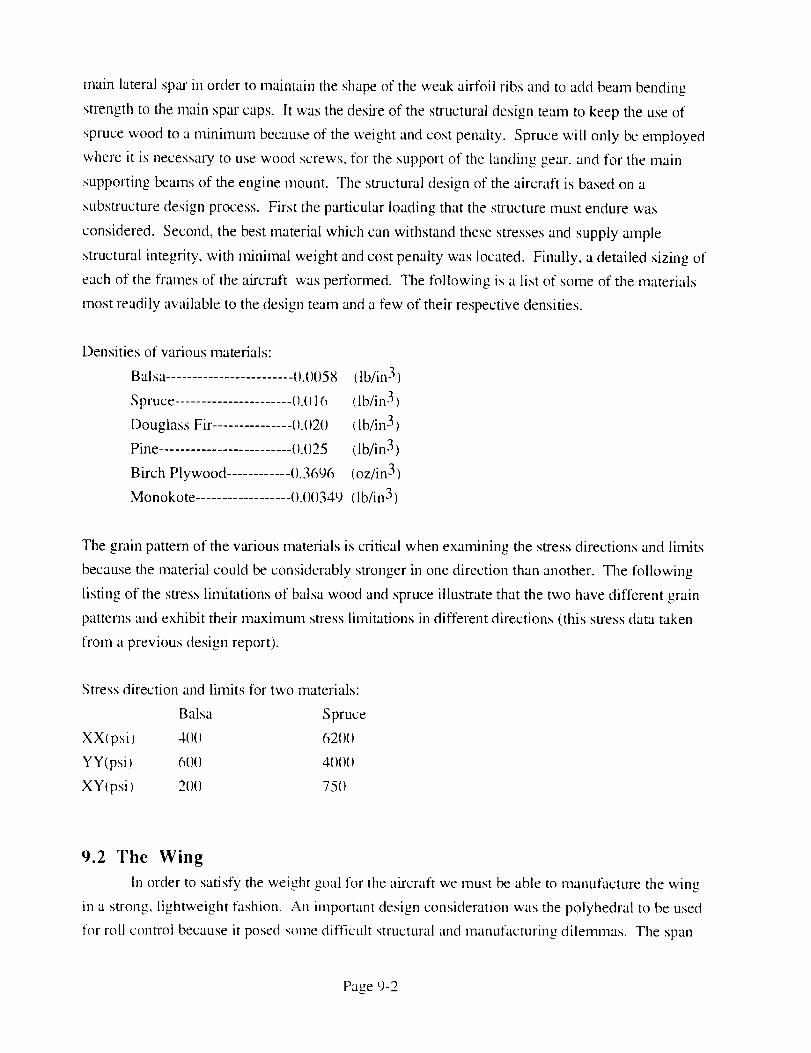
mainlateralsparin orderto maintaintheshapeof theweakairfoil ribsandto addbeambending
strengthto themainsparcaps. It wasthedesu'eof thestructuraldesignteamto keeptheuseof
sprucewoodto aminimumbecauseof theweightandcostpenalty. Sprucewill only beemployed
whereit is necessaryto usewoodscrews,for tile supportof the landinggear.andfor themain
supportingbeamsof theenginemount. Thestructuraldesignof theaircraftis basedona
substructuredesignprocess.Firsttheparticularloadingthatthestructuremustendurewas
considered.Second,the bestmaterialwhichcanwithstandthesestressesandsupplyample
structuralintegrity,with minimalweightandcostpenaltywaslocated.Finally, adetailedsizingofeachof theframesof theaircraft wasperformed.Thefollowing is a list of someof thematerials
mostreadilyavailableto thedesignteamandafew of theirrespectivedensities.
Densitiesof variousmaterials:
Balsa ........................ 0.0058
Spruce ...................... ¢).016
Douglass Fir ............... ().()2()
Pine ......................... {).025
Birch Plywood ............ 0.3696
(lb/in 3 )
/lb/in 3)
t lb/in 3)
(lb/in 3 )
(oz/in 3)
Monokote .................. 0.00349 (lb/in 3)
The grain pattern of the various materials is critical when examining the stress directions and limits
because the material could be considerably stronger in one direction than another. The following
listing of the stress limitations of balsa wood and spruce illustrate that the two have different grain
patterns and exhibit their maximum stress limitations in different directions (this stress data taken
from a previous design report).
Stress direction and limits for two materials:
Balsa Spruce
XX(psi) 41)0 6200
YY(psi) 61)0 4()()(I
XY{psi) 200 750
9.2 The Wing
in order to satisfy the weight goal for the aircraft we must be able to manufacture the wing
in a strong, lightweight fashion. An important design consideration was the polyhedral to be used
for roll control because it posed some difficult structural and manufacturing dilemmas. The span
Page 9-2
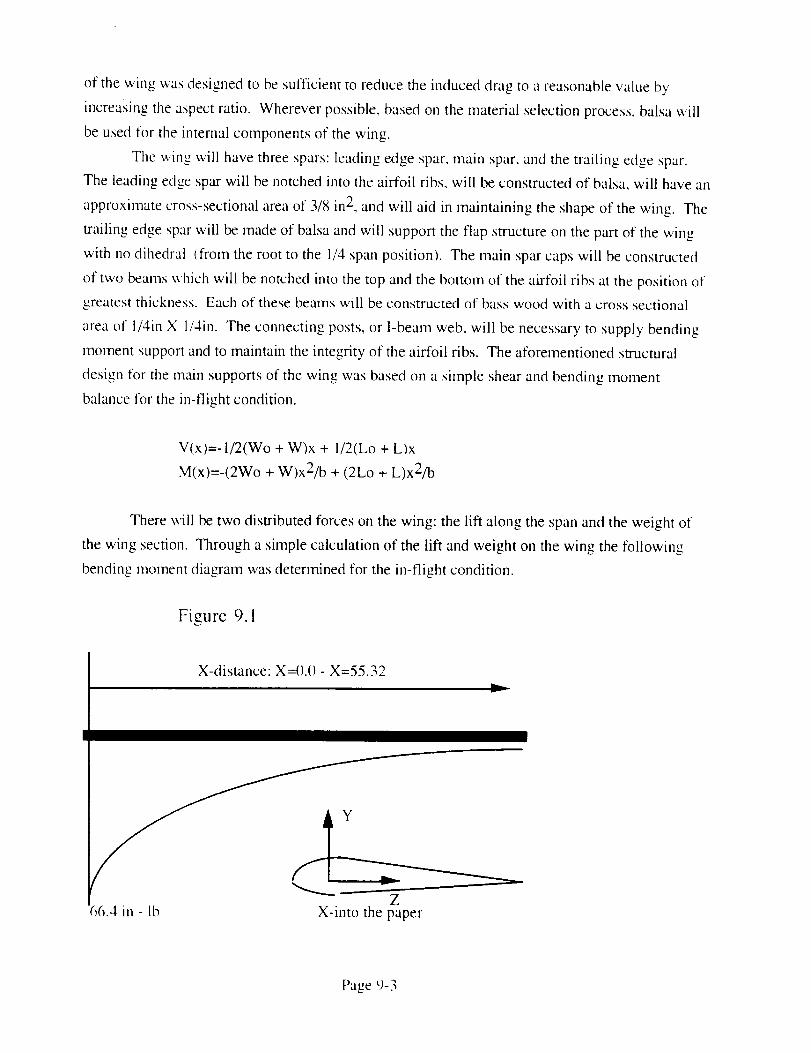
of thewingwasdesignedto besufficientto reducethe induced drag to a reasonable value by
increasing the aspect ratio. Wherever possible, based on the material selection process, balsa will
be used for the internal components of the wing.
The wing will have three spars: leading edge spar, main spar. and the trailing edge spar.
The leading edge spar will be notched into the airfoil ribs, will be constructed of balsa, will have an
approximate cross-sectional area of 3/8 in 2, and will aid in maintaining the shape of the wing. The
trailing edge spar will be made of balsa and will support the flap structure oil the part of the wing
with no dihedral (from the root to the 1/4 span position). The main spar caps will be constructed
of two beams which will be notched into the top and the bottom of the ahfoil ribs at the position of
greatest thickness. Each of these beams will be constructed of bass wood with a cross sectional
area of l/4m X 1/4in. The connecting posts, or I-beam web, will be necessary to supply bending
moment support and to maintain the integrity of the airfoil ribs. The aforementioned structural
design for the main supports of the wing was based on a simple shear and bending moment
balance for the in-flight condition.
V(x)=-l/2(Wo + W)x + l/2(Lo + L)x
M(x)=-(2Wo + W)x2/b + (2Lo + L)x2/b
There will be two distributed forces on the wing: the lift along the span and the weight of
the wing section. Through a simple calculation of the lift and weight on the wing the following
bending moment diagram was determined for the in-flight condition.
Figure 9.1
X-distance: X=().O- X=55.32
v
Z66.4 in - lb X-into the paper
Page 9-3
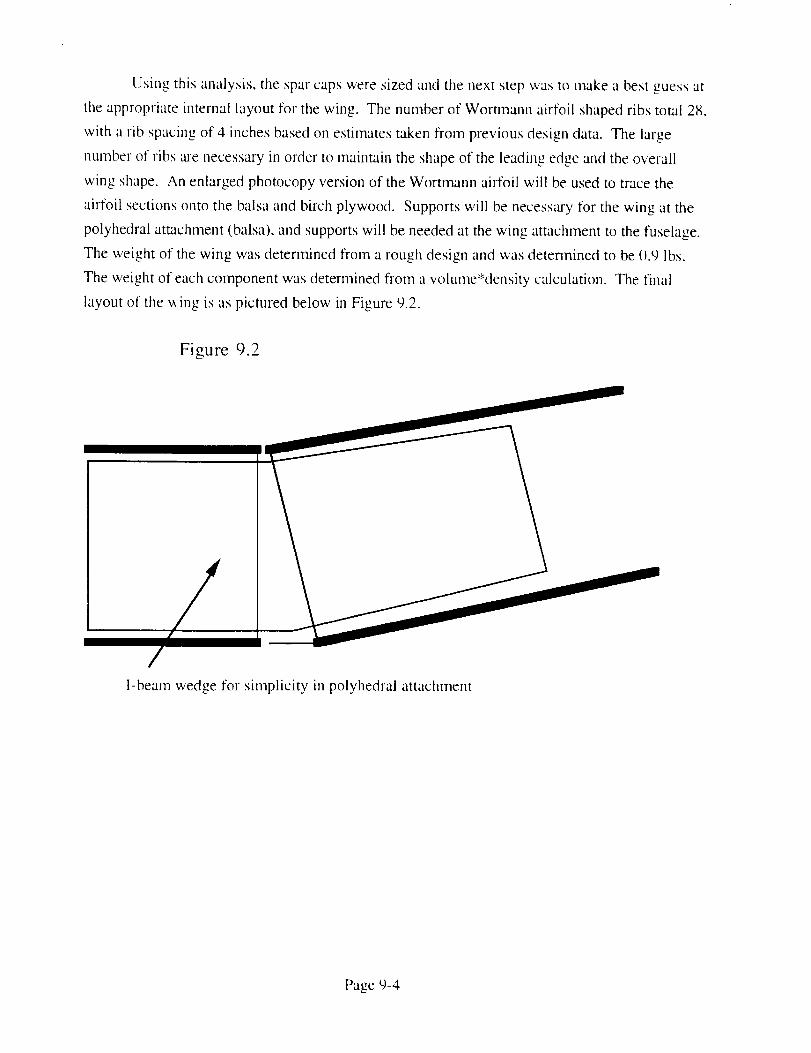
Usingthisanalysis,thesparcapsweresizedandthenextstepwasto makeabestguessattheappropriateinternallayoutfor thewing. Thenumberof Wortmannairfoil shapedribs total28,
with arib spacingof 4 inchesbasedonestimatestakenfrom previousdesigndata. Thelarge
numberof ribsaJenecessaryin orderto maintaintheshapeof the leadingedgeandtheoverall
wing shape.An enlargedphotocopyversionof theWortmannairfoil will beusedto tracethe
airfoil sectionsontothebalsaandbirchplywood. Supportswill benecessaryfor thewing at the
polyhedralattachment(balsa),andsupportswill beneededat thewing attachmentto thefuselage.
Theweightof thewing wasdeterminedfrom aroughdesignandwasdeterminedto be().9lbs.
Theweightof eachcomponentwasdeterminedfrom a volume*densitycalculation.Thefinal
layoutof thew,ingis aspicturedbelowin Figure9.2.
Figure 9.2
l-beamwedgefor simplicity inpolyhedralattachment
Page9-4
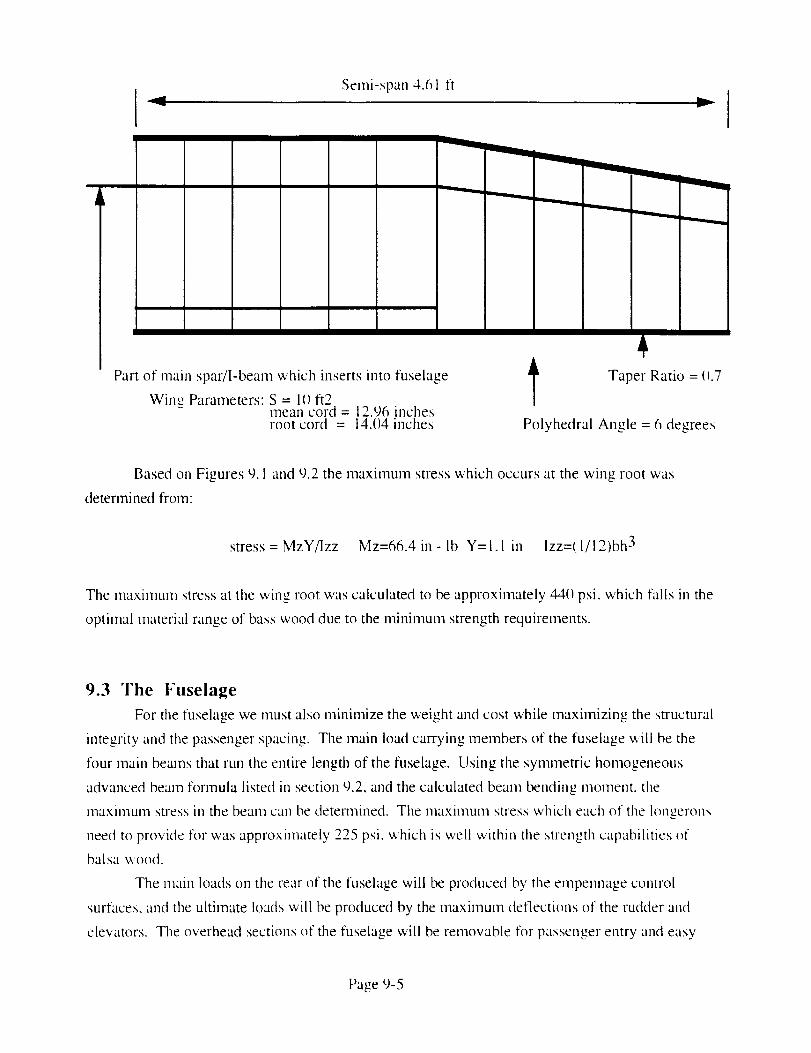
Semi-span4.61ftv
I/
I I
I
/
Part of main spar/I-beam which inserts into fuselage
Wing Parameters: S = 1() ft2mean cord = 12.96 inchesroot cord = 14.04 inches
I
l!
i
l Taper Ratio = ().7
Polyhedral Angle = 6 degrees
Based on Figures 9.1 and 9.2 the maximum stress which occurs at the wing root was
determined from:
stress = MzY/lzz Mz=66.4 in - lb Y=I.1 in Izz=(I/12)bh 3
The maximum stress at the wing root was calculated to be approximately 44{) psi. which falls in the
optimal material range of bass wood due to the minimum strength requirements.
9.3 The Fuselage
For the fuselage we must also minimize the weight and cost while maximizing the structural
integrity and the passenger spacing. The main load carrying members of the fuselage will be the
four main beams that run the entire length of the fuselage. Using the symmetric homogeneous
advanced beam formula listed in section 9.2, and the calculated beam bending moment, the
nlaximunl stress in the beam can be determined. The maximum stress which each of the longerons
need to provide for was approximately 225 psi, which is well within the strength capabilities of
balsa wood.
The roam loads on the rear of the fuselage will be produced by the empennage control
surfaces, and the ultimate loads will be produced by the maximum deflections of the rudder and
elevators. The overhead sections of the fuselage will be removable for passenger entry and easy
Page 9-5
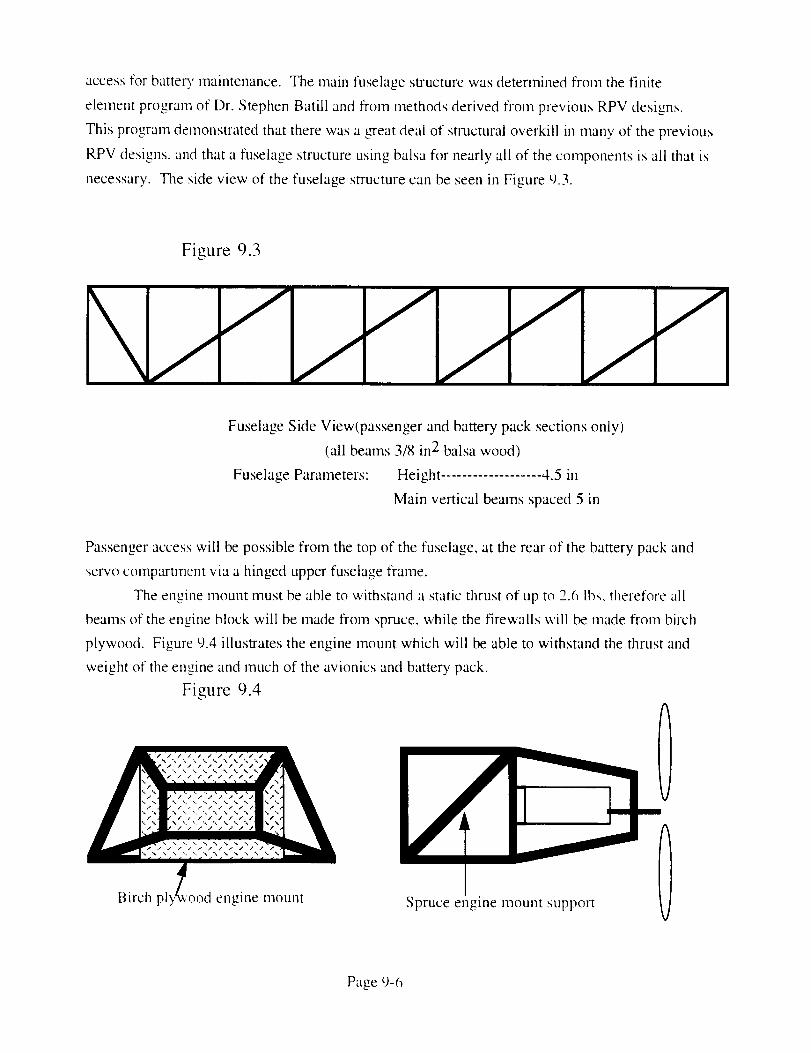
accessfor batterymaintenance.Themainfuselagesn'ucturewasdeterminedfrom thefinite
elementprogramof Dr. StephenBatill andfrom methodsderivedfrom previousRPVdesigns.
Thisprogramdemonsu'atedthattherewasagreatdealof structuraloverkill in manyof theprevious
RPVdesigns,andthata fuselagestructureusingbalsafor nearlyall of thecomponentsisall thatis
necessary.Thesideview of thefuselagestructurecanbeseenin Figure9.3.
Figure 9.3
Fuselage Side View(passenger and battery pack sections only)
(all beams 3/8 in 2 balsa wood)
Fuselage Parameters: Height ................... 4.5 in
Main vertical beams spaced 5 in
Passenger access will be possible from the top of the fuselage, at the rear of the battery pack and
_ervo compartment via a hinged upper fuselage frame.
The engine mount must be able to withstand a static thrust of up to 2.6 [bs, therefore all
beams of the engine block will be made from spruce, while the firewalls will be made from birch
plywood. Figure 9.4 illustrates the engine mount which will be able to withstand the thrust and
weight of the engine and much of the avionics and battery pack.
Figure 9.4
0Birch engine mount Spruce engine mount support
Page 9-6
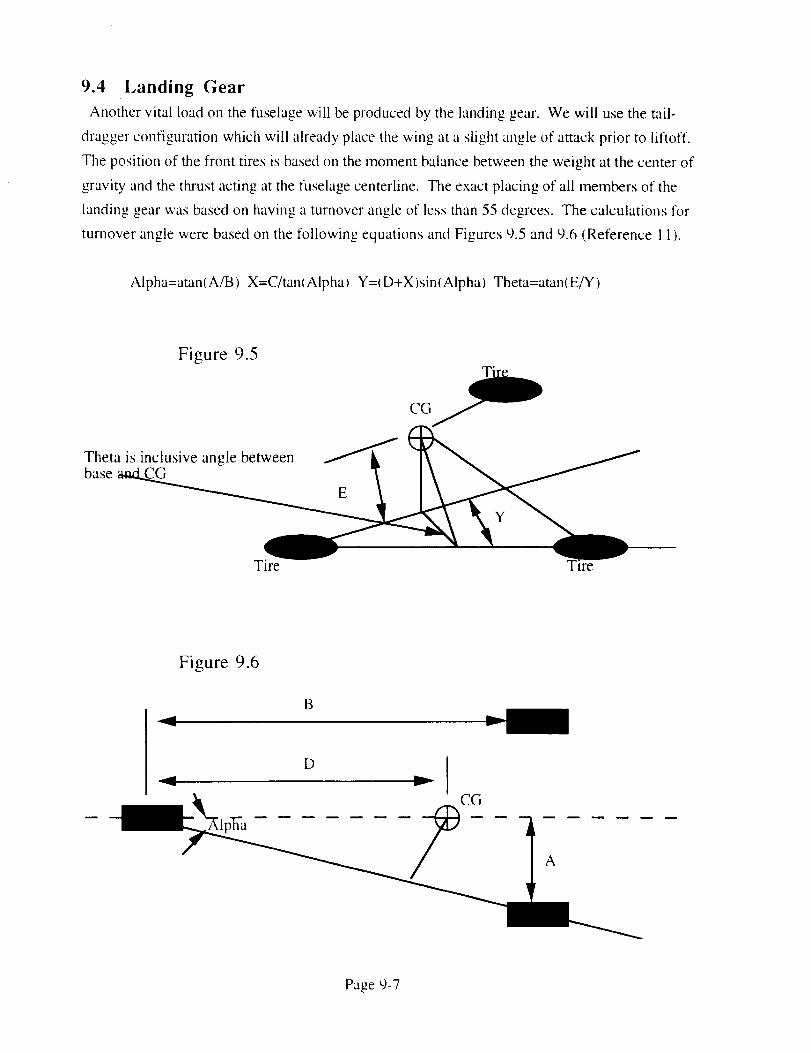
9.4 Landing Gear
Another vital load on the fuselage will be produced by the landing gear. We will use the tail-
dragger configuration which will already place tile wing at a slight angle of attack prior to [iftoff.
The position of the front tires is based on the moment balance between the weight at the center of
gravity and the thrust acting at the fuselage centerline. The exact placing of all members of the
landing gear was based on having a turnover angle of less than 55 degrees. The calculations for
turnover angle were based on the following equations and Figures 9.5 and 9.6 (Reference I I ).
Alpha=atan(A/B) X=C/tan/Alpha I Y=I D+X)sin(Alpha) Theta=atan(E/Y)
Figure 9.5
CG
Theta is inclusive angle betweenbase
E
Y
Tire 1 ire
Figure 9.6
B
D
_lpha
CG
A
Page 9-7
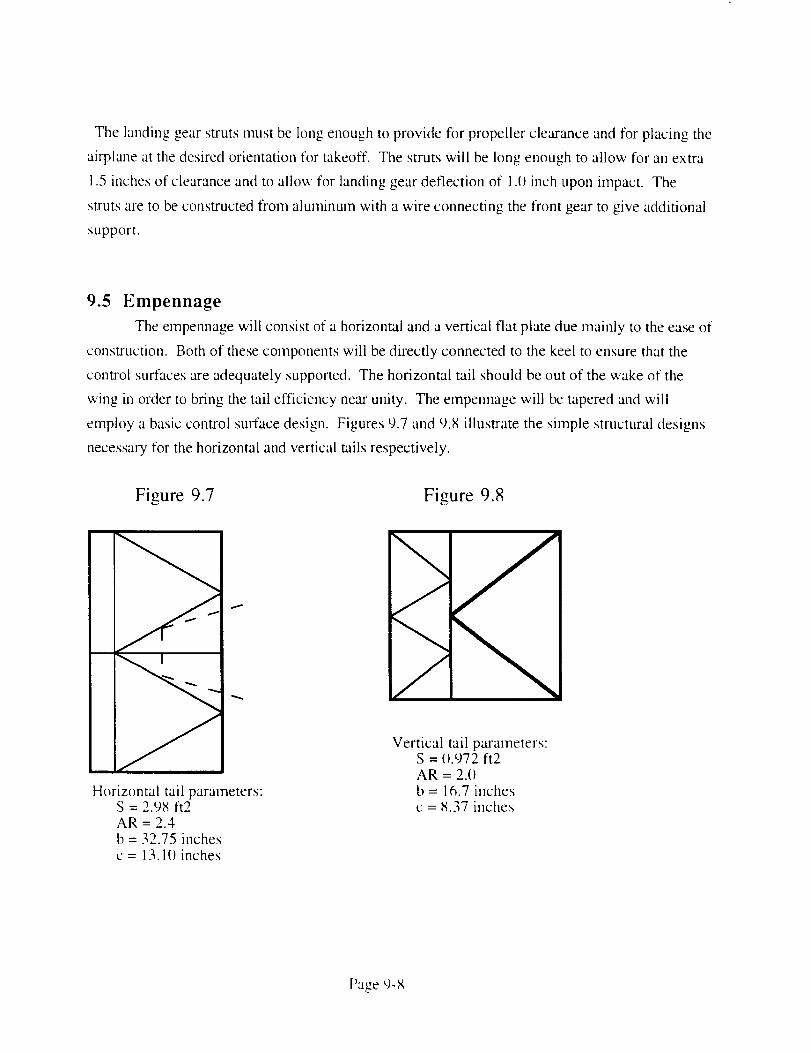
The landing gear struts must be long enough to provide for propeller clearance and for placing the
airplane at the desired orientation for takeoff. The struts will be long enough to allow for an extra
1.5 inches of clearance and to allow for landing gear deflection of 1.1) inch upon impact. The
struts are to be constructed from aluminum with a wire connecting the front gear to give additional
support.
9.5 Empennage
The empennage will consist of a horizontal and a vertical fiat plate due mainly to the ease of
construction. Both of these components will be dfl'ectly connected to the keel to ensure that the
control surfaces are adequately supported. The horizontal tail should be out of the wake of the
wing in order to bring the tail efficiency near unity. The e,npennage will be tapered and will
employ a basic control surface design. Figures 9.7 and 9.8 illustrate the simple structural designs
necessary for the horizontal and vertical tails respectively.
Figure 9.7 Figure 9.8
Horizontal tail parameters:S = 2.9_ f12AR = 2.4
b = 32.75 inchesc = 13.1(} inches
Vertical tail ptuametels:S = I).972 ft2AR = 2.(Ib = 16.7 inchesc = 8.37 inches
Page 9-_
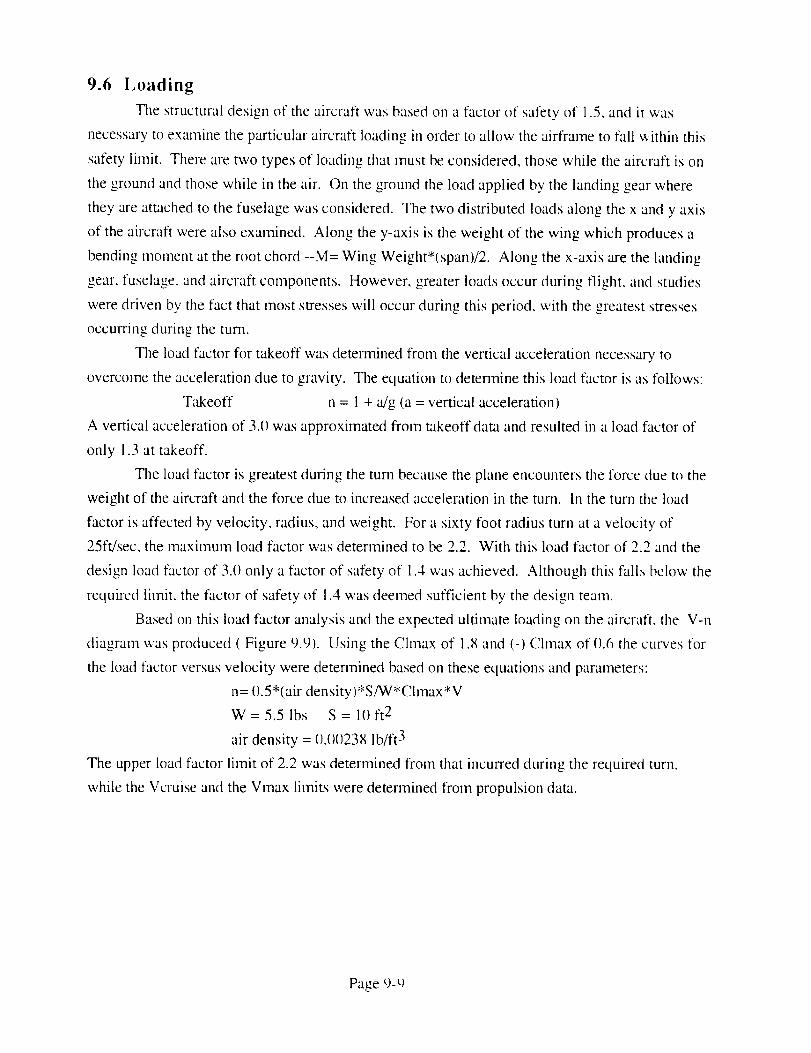
9.6 Loading
The structural design of the aircraft was based on a factor of safety of 1.5, and it was
necessary to examine the particular aircraft loading in order to allow the airframe to fall within this
safety limit. There are two types of loading that must be considered, those while the aircraft is on
the ground and those while in the air. On the ground the load applied bv the landing gear where
they are attached to the fuselage was considered. The two distributed loads along the x and y axis
of the aircraft were also examined. Along the y-axis is the weight of the wing which produces a
bending moment at the root chord --M= Wing Weight*(span)/2. Along the x-axis are the landing
gear, fuselage, and aircraft components. However, greater loads occur during flight, and studies
were driven by the fact that most stresses will occur during this period, with the greatest stresses
occuning during the turn.
The load factor for takeoff was determined from the vertical acceleration necessary to
overcome the acceleration due to gravity. The equation to determine this load factor is as follows:
Takeoff n = 1 + a/g (a = vertical acceleration)
A vertical acceleration of 3.0 was approximated from takeoff data and resulted in a load factor of
only 1.3 at takeoff.
The load factor is greatest during the turn because the plane encounters the force due to the
weight of the aircraft and the force due to increased acceleration in the turn. In the turn the load
factor is affected by velocity, radius, and weight. For a sixty foot radius turn at a velocity of
25ft/sec, the maximum load factor was determined to be 2.2. With this load factor of 2.2 and the
design load factor of 3.0 only a factor of safety of 1.4 was achieved. Although this falls below the
required limit, the factor of safety of 1.4 was deemed sufficient by the design team.
Based on this load factor analysis and the expected ultimate loading on the aircraft, the V-n
diagram was produced ( Figure 9.9). Using the Chnax of 1.8 and (-) Chnax of 0.6 the curves for
the load factor versus velocity were determined based on these equations and parameters:
n= 1).5*(air density)*S/W*Chnax*V
W=5.51bs S= 10ft 2
air density = 1}.()0238 Ib/ft 3
The upper load factor limit of 2.2 was determined from that incurred during the required turn,
while the Vcruise and the Vmax limits were determined from propulsion data.
Page 9-t,I
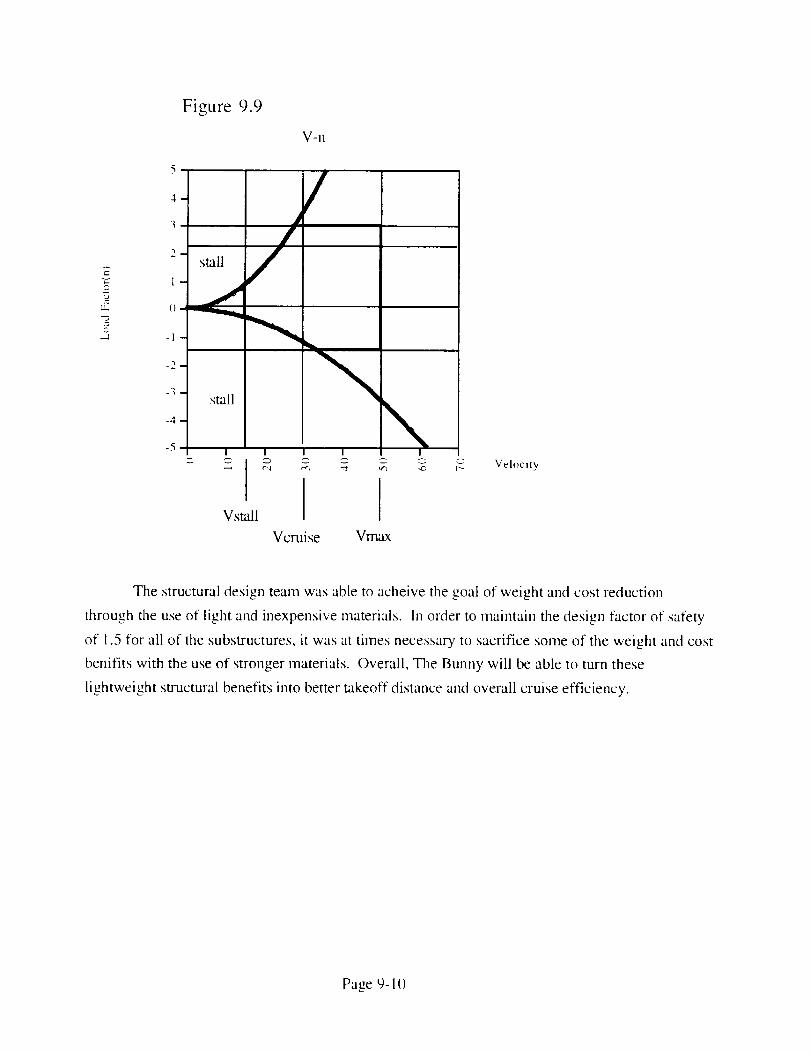
2_
.-2
Figure 9.9
V-n
5 o
4-
2-stall
l-
I) -
-1-
-5-
stall
I !
/
Vstall
Vcruise
/
\I
3 3 _
I IVmax
Velocity
The structural design team was able to acheive the goal of weight and cost reduction
through the use of light and inexpensive materials. In order to maintain the design factor of safety
of 1.5 for all of the substructures, it was at times necessary to sacrifice some of the weight and cost
benifits with the use of stronger materials. Overall. The Bunny will be able to turn these
lightweight structural benefits into better takeoff distance and overall cruise efficiency.
Page %10
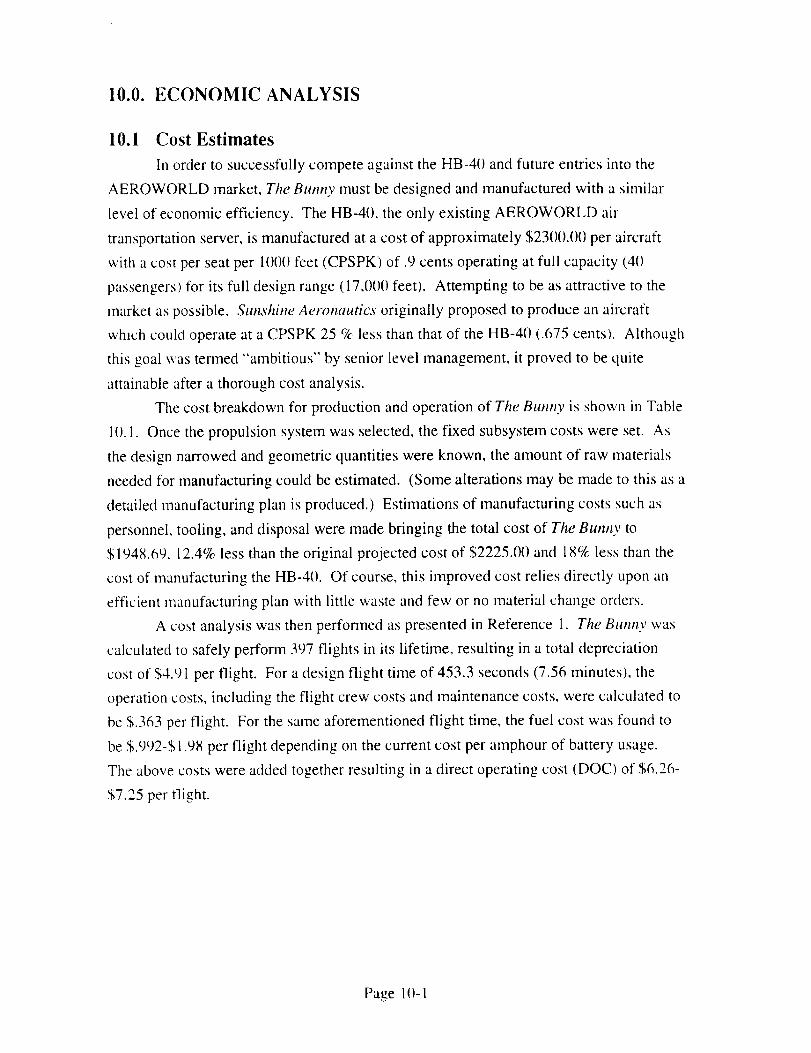
10.0. ECONOMIC ANALYSIS
10.1 Cost Estimates
In order to successfully compete against the HB-40 and future entries into the
AEROWORLD market, The Bunny must be designed and manufactured with a similar
level of economic efficiency. The HB-4(I, the only existing AEROWORLD air
transportation server, is manufactured at a cost of approximately $2300.(){) per aircraft
with a cost per seat per 1000 feet (CPSPK) of .9 cents operating at full capacity (40
passengers) for its full design range (17,0()() feet). Attempting to be as attractive to the
market as possible, Sunshine Aeronautics originally proposed to produce an aircraft
which could operate at a CPSPK 25 % less than that of the HB-40 (.675 cents). Although
this goal was termed "ambitious" by senior level management, it proved to be quite
attainable after a thorough cost analysis.
The cost breakdown for production and operation of The Bunny is shown in Table
1(). 1. Once the propulsion system was selected, the fixed subsystem costs were set. As
the design narrowed and geometric quantities were known, the amount of raw materials
needed for manufacturing could be estimated. (Some alterations may be made to this as a
detailed manufacturing plan is produced.) Estimations of manufacturing costs such as
personnel, tooling, and disposal were made bringing the total cost of The Bunny to
$1948.69. 12.4% less than the original projected cost of $2225.00 and 18% less than the
cost of manufacturing the HB-4(I. Of course, this improved cost relies directly upon an
efficient manufacturing plan with little waste and few or no material change orders.
A cost analysis was then performed as presented in Reference 1. The Bunny was
calculated to safely perform 397 flights in its lifetime, resulting in a total depreciation
cost of $4.91 per flight. For a design flight time of 453.3 seconds (7.56 minutes), the
operation costs, including the flight crew costs and maintenance costs, were calculated to
be $.363 per flight. For the same aforernentioned flight time, the fuel cost was found to
be $.992-$1.98 per flight depending on the current cost per amphour of battery usage.
The above costs were added together resulting in a direct operating cost (DOC) of $6.26-
$7.25 per flight.
Page 1()-1
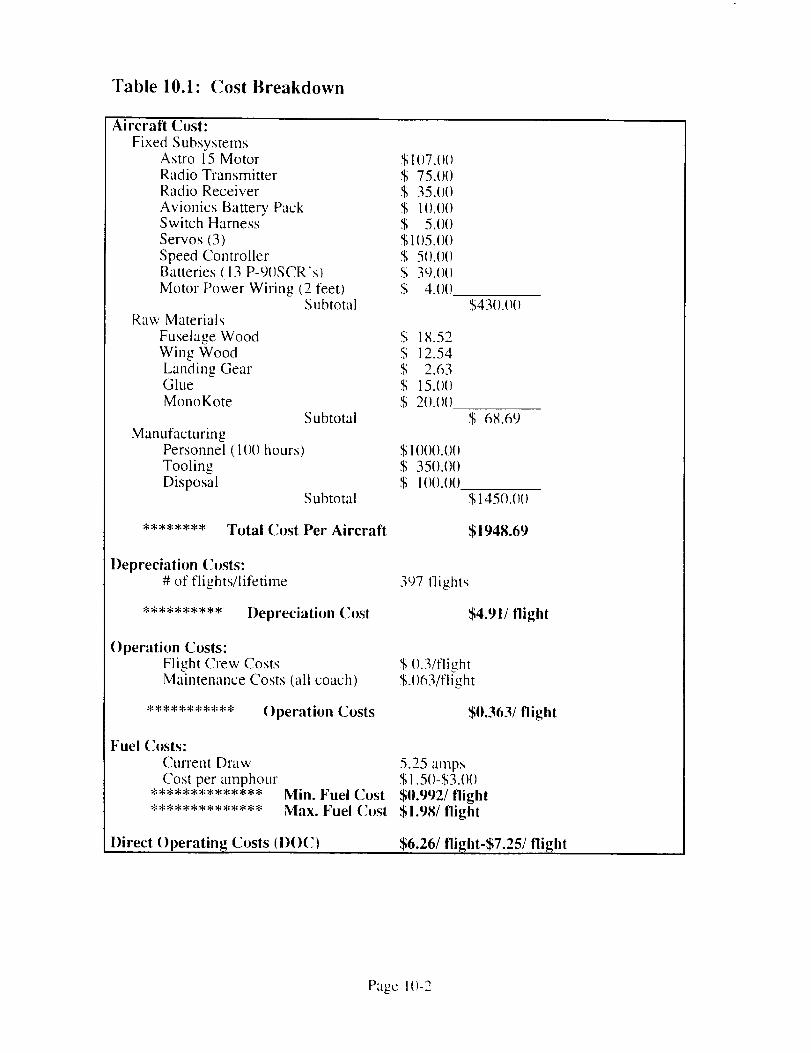
Table 10.1: Cost Breakdown
Aircraft Cost:
Fixed SubsystemsAstro 15 MotorRadio TransmitterRadio Receiver
Avionics Battery PackSwitch HarnessServos (3)
Speed ControllerBatteries (13 P-9()SCR's)
Motor Power Wiring (2 feet)Subtotal
Raw Materials
Fuselage WoodWing Wood
Landing GearGlueMonoKote
Subtotal
ManufacturingPersonnel (ll)() hours)
ToolingDisposal
Subtotal
******** Total Cost Per Aircraft
Depreciation Costs:# of flights/lifetime
********** Depreciation Cost
() peration Costs:Flight Crew CostsMaintenance Costs (all coach)
*********** ()peration Costs
Fuel Costs:Cunent Draw
Cost per amphourMin. Fuel CostMax. Fuel Cost
Direct ()perating Costs (i){)C)
$1()7.0()$ 75.OO$ 35.0()
$ l().l)()$ 5.OO$1()5.()0
$ 5().()()$ 3l).()(_$ 4.OO
$ 18.52$ 12.54$ 2.63$ 15.00$ 2().()()
$ I()()().()()$ 350.()()$ I()().()()
$43().o()
$ 68.69
$1450.0()
$1948.69
397 flights
$4.91/flight
$ ().3/flight$.()63/flight
$0.363/flight
5.25 amps$1.5(1-$3.0()
$tt.992/flight$1.98/flight
$6.26/flight-S7.25/flight
Page 1()-2
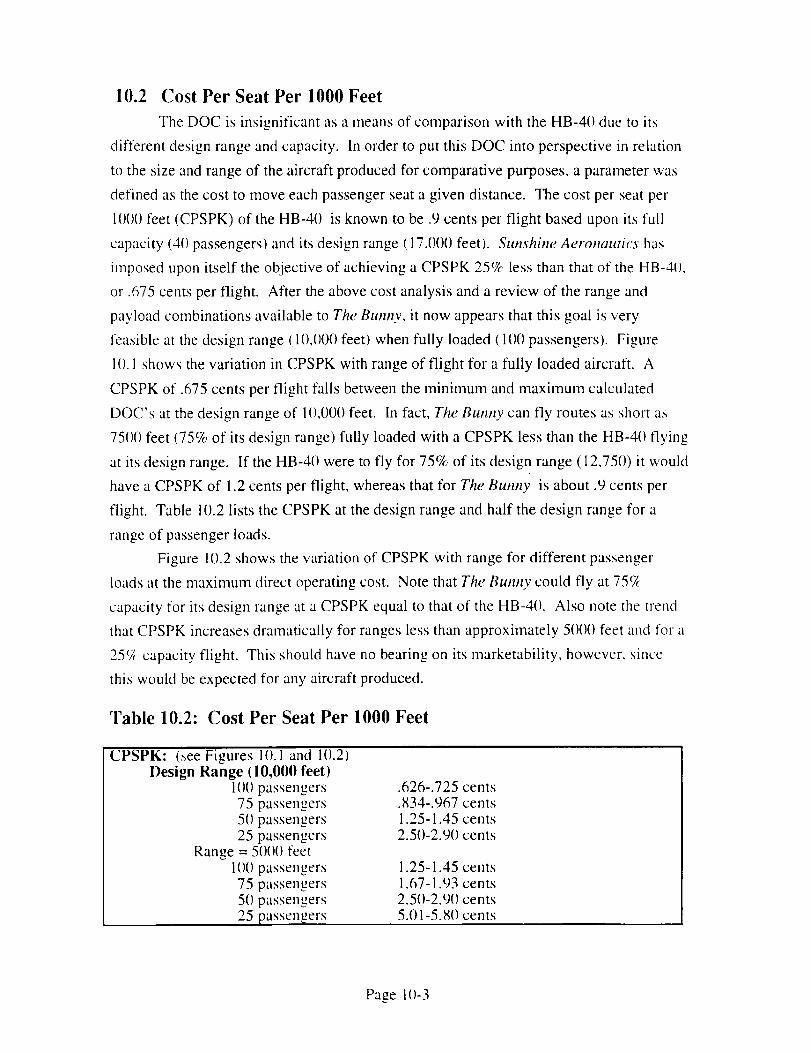
10.2 Cost Per Seat Per 1000 Feet
The DOC is insignificant as a means of comparison with the HB-40 due to its
different design range and capacity. In order to put this DOC into perspective in relation
to the size and range of the aircraft produced for comparative purposes, a parameter was
defined as the cost to move each passenger seat a given distance. The cost per seat per
1()00 feet (CPSPK) of the HB-40 is known to be .9 cents per flight based upon its full
capacity (4() passengers) and its design range (17,000 feet). Sunshine Aeronautics has
imposed upon itself the objective of achieving a CPSPK 25% less than that of the HB-4(),
or .675 cents per flight. After the above cost analysis and a review of the range and
payload combinations available to The Bunny, it now appears that this goal is very
feasible at the design range (10,1)00 feet) when fully loaded (100 passengers). Figure
1(). 1 shows the variation in CPSPK with range of flight for a fully loaded aircraft. A
CPSPK of .675 cents per flight falls between the minimum and maximum calculated
DOC's at the design range of ll),000 feet. In fact, The Bunny can fly routes as short as
75()1) feet (75% of its design range) fully loaded with a CPSPK less than the HB-4() flying
at its design range. If the HB-4() were to fly for 75% of its design range (12,750) it would
have a CPSPK of 1.2 cents per flight, whereas that for The Bunny is about .9 cents per
flight. Table 10.2 lists the CPSPK at the design range and half the design range for a
range of passenger loads.
Figure 10.2 shows the variation of CPSPK with range for different passenger
loads at the maximum direct operating cost. Note that The Bunny could fly at 75c_
capacity for its design range at a CPSPK equal to that of the HB-4(). Also note the trend
that CPSPK increases dramatically for ranges less than approximately 50()(J feet and for a
25_,_ capacity flight. This should have no bearing on its marketability, however, since
this would be expected for any aircraft produced.
Table 10.2: Cost Per Seat Per 1000 Feet
CPSPK: (see Figures 1().1 and 10.2)Design Range (10,000 feet)
100 passengers .626-.725 cents75 passengers .834-.967 cents
50 passengers 1.25-1.45 cents25 passengers 2.50-2.90 cents
Range = 5()()() feet10() passengers 1.25-1.45 cents
75 passengers 1.67-1.93 cents50 passengers 2.5{)-2.90 cents
25 passengers 5.01-5.80 cents
Page 1()-3
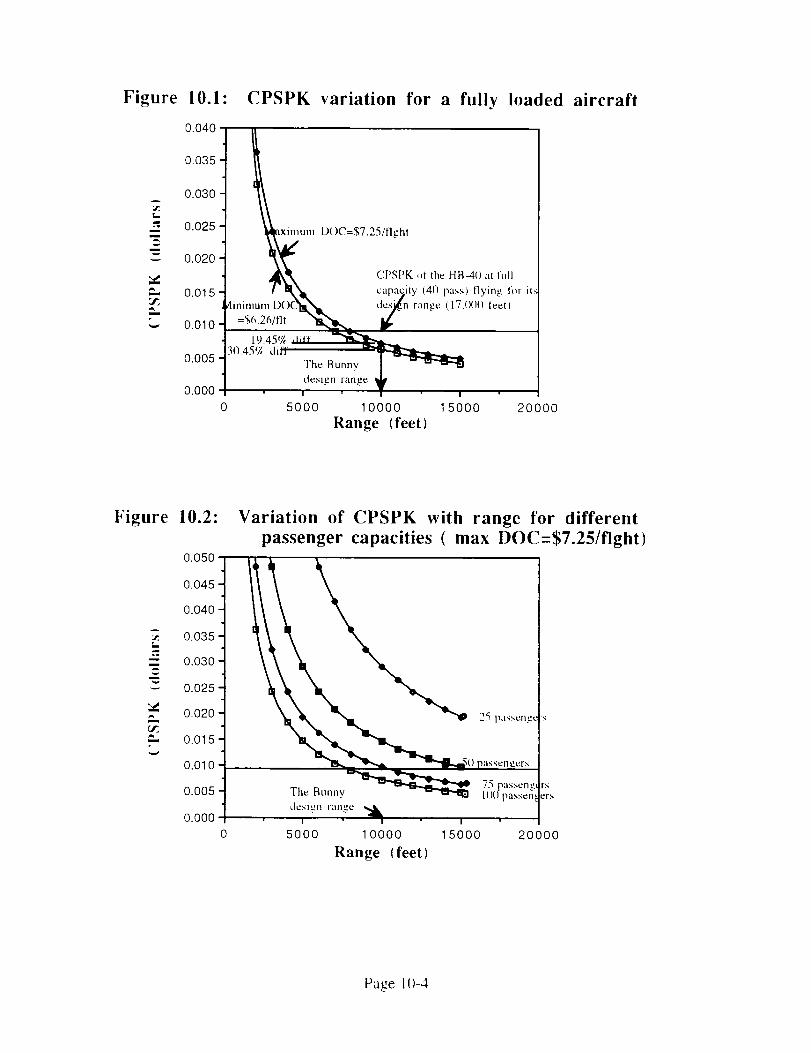
Figure 10.1:
0.040
CPSPK variation for a fully loaded aircraft
7.
u
_e2.
=.
0.035
0.030
0.025
0.020
0.015'
0.010 -
0.005
0.000
um D()C=$7.25/flgh!
_t,,_ CPSPK _,l the HB-4() at lull
f "N'_ capaqily (4() pass) flying for ib
4inimum D()C_'N_ d_.g/n range (17.()(1{)leet)
=$6.26/tlt
30A5 q,, dii'f
The Bunny ] -
d _ibm range
0 5000 10000 15000 20000
Range (feet)
Figure 10.2:
0.050
0.045
0.O4O
0.035L
0.030
0.025
0.020Am
0.015
0.010
0.005 t0.000
0
Variation of CPSPK with range for different
passenger capacities ( max DOC=$7.25/flght)
25 passengt's
0 passen,,zers
75 passene rsThe Bunny ll)() passen I ers
design ]ange ,_I I
5OOO 200001 0000 1 5000
Range (feet)
Page 11)-4
Appendix A: List of References
1. "Request for Proposals", Department of Aerospace and Mechanical Engineering,
University of Notre Dame, Notre Dame, IN, 1993.
2. Miley, S.J., A Catalog of Low Reynolds Number Airfoil Data for Wind Turbine
Applications, Texas A&M University, College Station, TX, 1982.
3. Roskam, Jan, Airplane Design: Part VI, Roskam Aviation and EngineeringCorporation, Kansas, 1985.
4. Jensen, D.T., A Drag Prediction Methodology for Low Reynolds Number FlightVehicles, A Master's Thesis, University of Notre Dame, 1990.
5. Nelson. Robert C., "Notes from AE 348: Flight Mechanics", Department of Aerospaceand Mechanical Engineering, University of Notre Dame, IN, 1991.
6. Batill, Stephen M., "Takeoff Performance", Computer Code, Department of
Aerospace and Mechanical Engineering, University of Notre Dame, IN, 1993.
7. Young, B.N., "Propeller Performance Analysis for Small Computers,", Master'sThesis, Department of Aerospace and Mechanical Engineering, University of NotreDame, 1984.
8. Dunn, Patrick F., "Notes from AE 454: Propulsion", Department of Aerospace and
Mechanical Engineering, University of Notre Dame, IN, 1992.
9. Beron-Rawdon, Blaine, "Dihedral", Model Aviation, August-November 1988.
10. Nelson, Robert C., Flight Stability and Automatic Control, McGraw-Hill, Inc., NewYork, 1989.
11. Currey, Norman S., Landing Gear Design Handbook, Lockheed-Georgia Company,Marietta, GA, 1982.
12. McCormick, Barnes V., Aerodynamics, Aeronautics, and Flight Mechanics, JohnWiley & Sons, Inc., New York, 1979.
Page A- 1
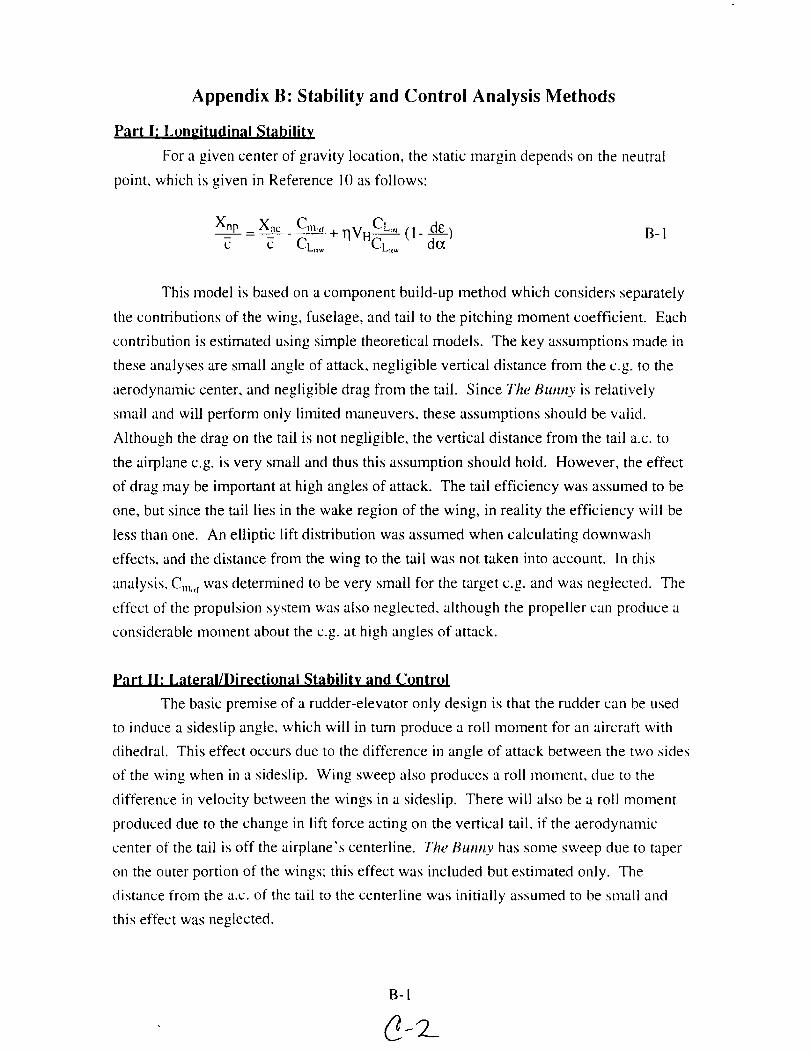
Appendix B: Stability and Control Analysis Methods
Part I: Lonuitudinal Stability
For a given center of gravity location, the static margin depends on the neutral
point, which is given in Reference 10 as follows:
CL,o d_ )Xnp _ Mac Cm.f + qVHc___ ( 1- B- 1
This model is based on a component build-up method which considers separately
the contributions of the wing, fuselage, and tail to the pitching moment coefficient. Each
contribution is estimated using simple theoretical models. The key assumptions made in
these analyses are small angle of attack, negligible vertical distance from the e.g. to the
aerodynamic center, and negligible drag from the tail. Since The Bunny is relatively
small and will perform only limited maneuvers, these assumptions should be valid.
Although the drag on the tail is not negligible, the vertical distance from the tail a.c. to
the airplane c.g. is very small and thus this assumption should hold. However, the effect
of drag may be important at high angles of attack. The tail efficiency was assumed to be
one, but since the tail lies in the wake region of the wing, in reality the efficiency will be
less than one. An elliptic lift distribution was assumed when calculating downwash
effects, and the distance from the wing to the tail was not taken into account. In this
analysis, C,n,, was determined to be very small for the target e.g. and was neglected. The
effect of the propulsion system was also neglected, although the propeller can produce a
considerable moment about the e.g. at high angles of attack.
P_lr_ II, L_lteral/Directional Stability and Control
The basic premise of a rudder-elevator only design is that the rudder can be used
to induce a sideslip angle, which will in turn produce a roll moment for an aircraft with
dihedral. This effect occurs due to the difference in angle of attack between the two sides
of the wing when in a sideslip. Wing sweep also produces a roll moment, due to the
difference in velocity between the wings in a sideslip. There will also be a roll moment
produced due to the change in lift force acting on the vertical tail, if the aerodynamic
center of the tail is off the airplane's centerline. The Bunny has some sweep due to taper
on the outer portion of the wings; this effect was included but estimated only. The
distance from the a.c. of the tail to the centerline was initially assumed to be small and
this effect was neglected.
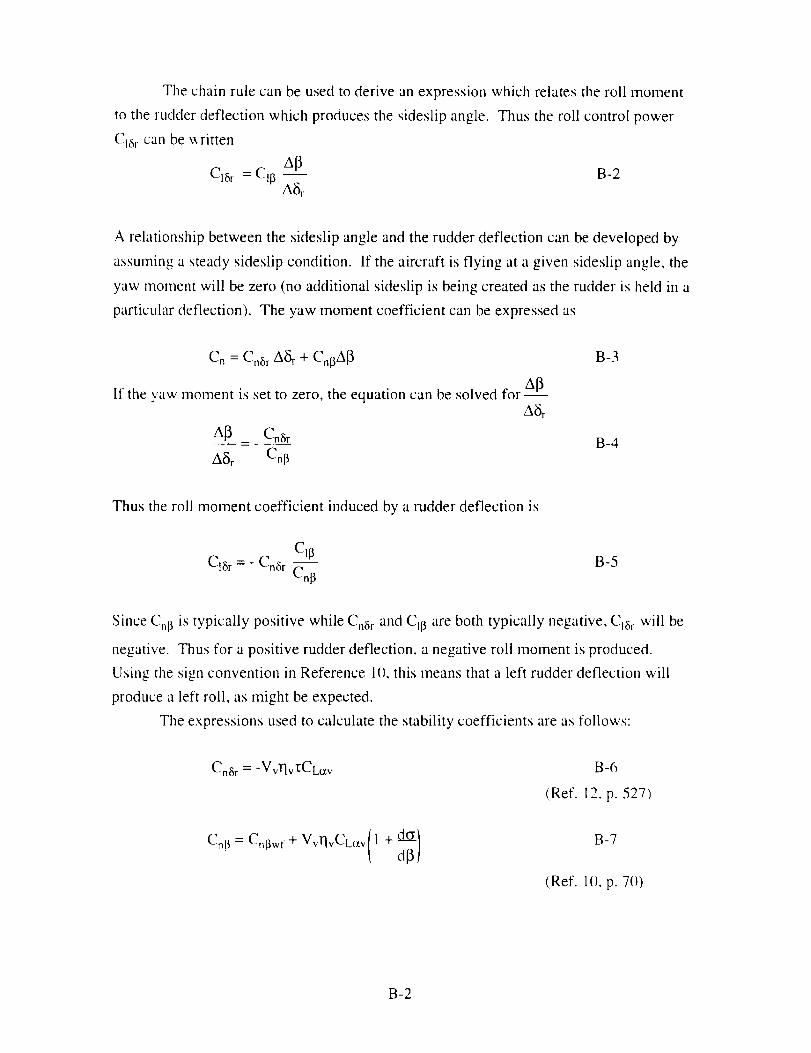
Thechainrule canbeusedto deriveanexpressionwhichrelatestheroll moment
to therudderdeflectionwhich producesthesideslipangle. Thustheroll control power
CI8r canbewrittena[3
Cl8 r = Cl[_ -- B-2
A relationship between the sideslip angle and the rudder deflection can be developed by
assuming a steady sideslip condition. If the aircraft is flying at a given sideslip angle, the
yaw moment will be zero (no additional sideslip is being created as the rudder is held in a
particular deflection). The yaw moment coefficient can be expressed as
C n = Cn6 r A_3 r + Cn_A _ B-3
If the yaw moment is set to zero, the equation can be solved for A[3
zXl3 Cn_r-- B-4
Afr Cn_
Thus the roll moment coefficient induced by a rudder deflection is
C18 r=- Cn8 r C1]3
Cn_
B-5
Since Cn_ is typically positive while Cn_Sr and C1_ are both typically negative, Ci;5r will be
negative. Thus for a positive rudder deflection, a negative roll moment is produced.
Using the sign convention in Reference 1(), this means that a left rudder deflection will
produce a left roll, as might be expected.
The expressions used to calculate the stability coefficients are as follows:
Cn8 r = -Vvl]v'_CLtzv B-6
(Ref. 12. p. 527)
Cn_ = C,q_wt + VvrlvCLav 1 + B-7
(Ref. I(L p. 70)
B-2
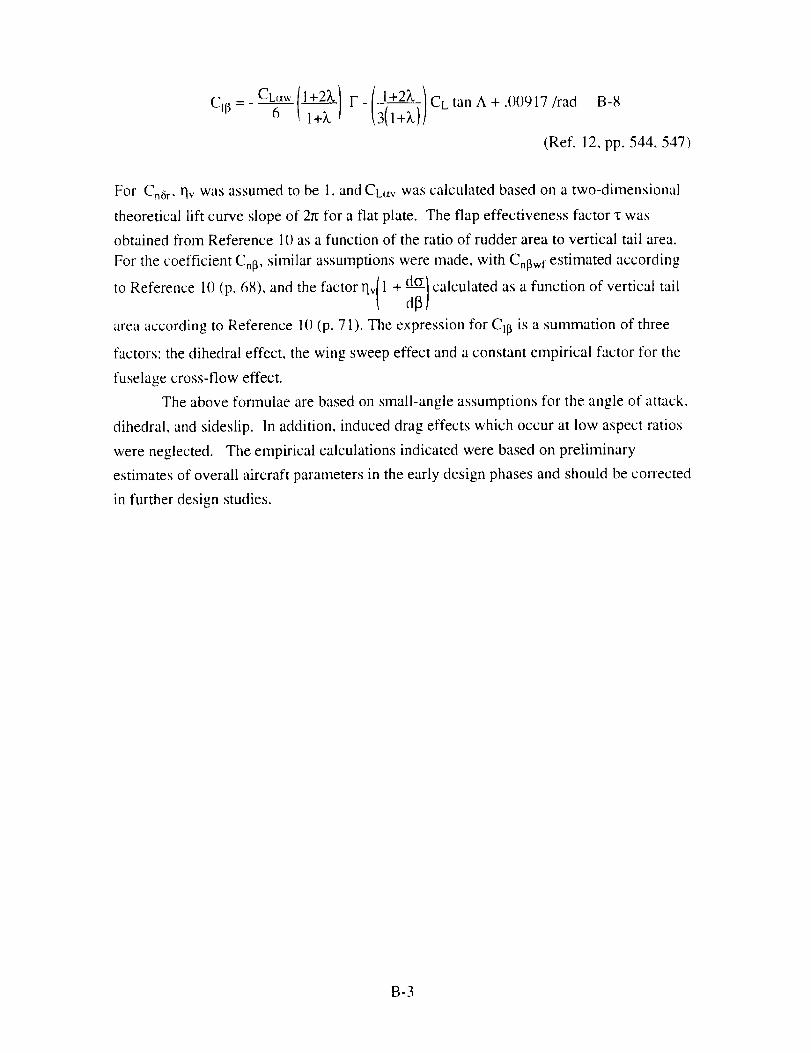
CLmv(I+2ZI F_Clff- 6 _ I+X,P
( 1+2_, 1 CL
3(1+_,}] tan A + .00917/rad B-8
(Ref. 12, pp. 544, 547)
For Cn&, Fly was assumed to be 1, and CLav was calculated based on a two-dimensional
theoretical lift curve slope of 2_ for a flat plate. The flap effectiveness factor z was
obtained from Reference 10 as a function of the ratio of rudder area to vertical tail area.
For the coefficient Cn[3, similar assumptions were made, with Cnl3w_ estimated according
to Reference 1()(p. 68), and the factor rlv{l + d___}calculated as a function of vertical tail/ _-Fr
area according to Reference 10 (p. 71). The expression for Cll3 is a summation of three
factors: the dihedral effect, the wing sweep effect and a constant empirical factor for the
fuselage cross-flow effect.
The above formulae are based on small-angle assumptions for the angle of attack,
dihedral, and sideslip. In addition, induced drag effects which occur at low aspect ratios
were neglected. The empirical calculations indicated were based on preliminary
estimates of overall aircraft parameters in the early design phases and should be corrected
in further design studies.
B-3
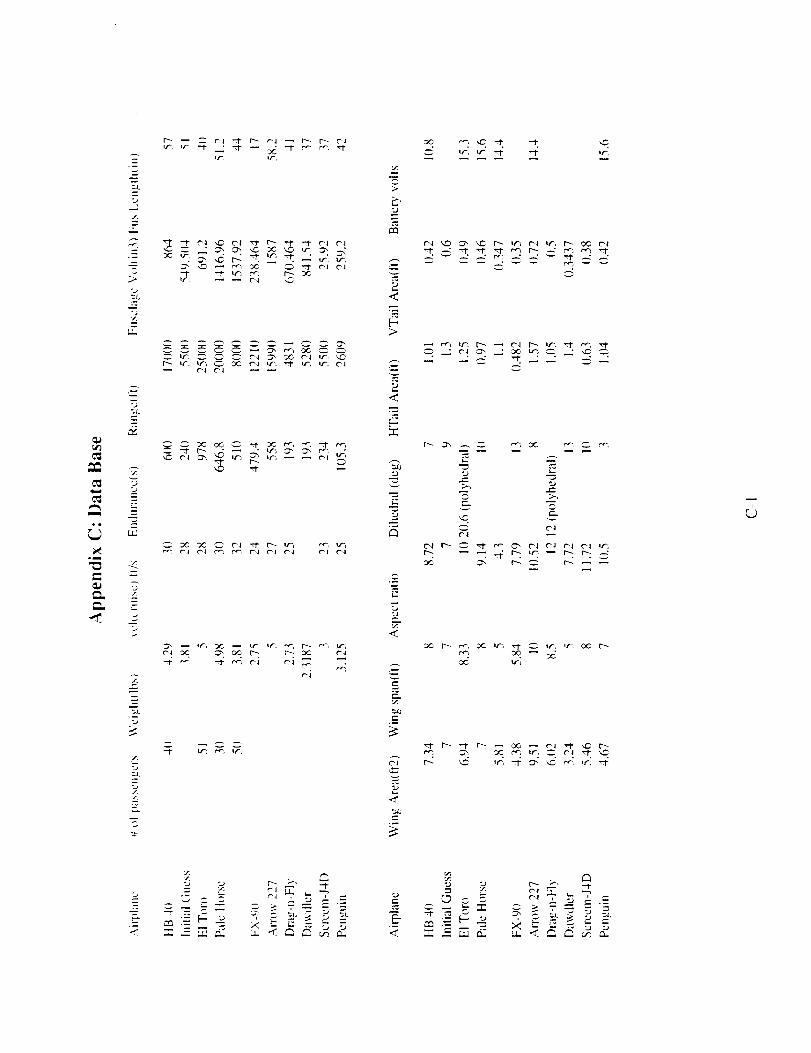
m
of
_L
'E.
.f.
:E
-- _ ¢"1 ---I" _ _"J -- _ _ C"J
--_- _ _'_ r_. _-
_ _ _ _ _ _ _ _, _, _ _
_J _C 0_, _ _ I_ _C _J
r_
_J
,_. _'_ _ _1_ _r.
_d_m__
-- --_ _ _--
%>¢-
I"_ --1" _- -- _ -- _J --1" _
_9"_ c _ _ - --'_ .-_
:_: _-_ _ _- .
i
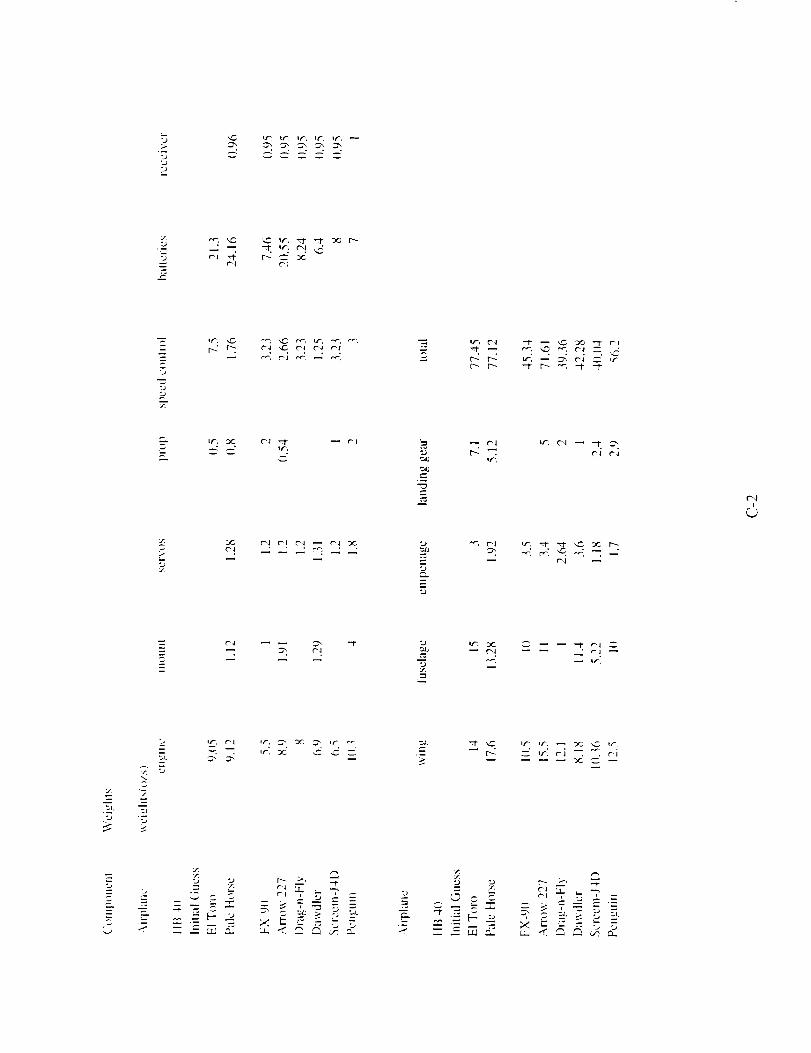
t/"3J tt'-_ tf"_ it-, if,
.--: .,--.: • ° ,
m
r,-: r__'-, t" j e_ m e..% _r..:
r-.. _": .._r -, r
m
L.'_, _C m _"1
¸'.,9
N O'J
r-:--h", C".I _ -1"
_C C",l C".l _'.1 _ C".I _._Jj
Ut'.J
--t"
e.,%
m
m
.5
:..J_ if.. 11", _ _ _. ,r.
_,_._ _ :_ [- _
"-t"
= _.',,_-=
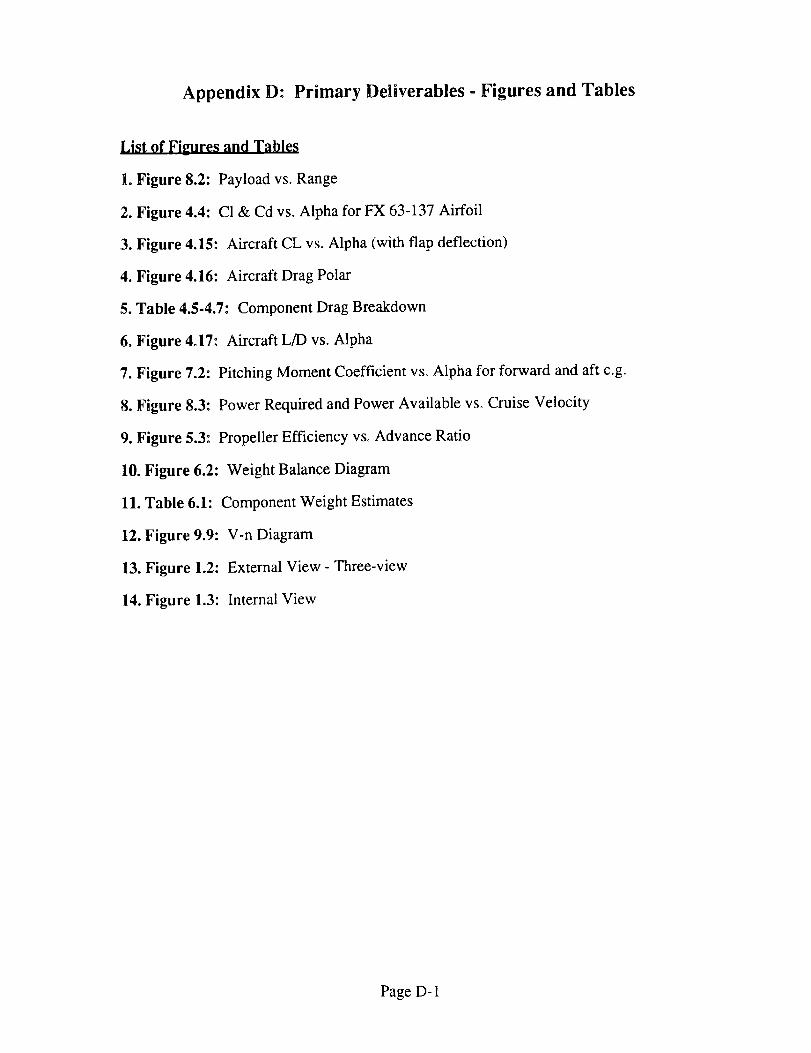
Appendix D: Primary Deliverables - Figures and Tables
List of Figures and Tables
1. Figure 8.2: Payload vs. Range
2. Figure 4.4:C1 & Cd vs. Alpha for FX 63-137 Airfoil
3. Figure 4.15: Aircraft CL vs. Alpha (with flap deflection)
4. Figure 4.16: Aircraft Drag Polar
5. Table 4.5.4.7: Component Drag Breakdown
6. Figure 4o17: Aircraft L/D vs. Alpha
7. Figure 7.2: Pitching Moment Coefficient vs. Alpha for forward and aft c.g.
8. Figure 8.3: Power Required and Power Available vs. Cruise Velocity
9. Figure 5.3: Propeller Efficiency vs. Advance Ratio
10. Figure 6.2: Weight Balance Diagram
11. Table 6.1: Component Weight Estimates
12. Figure 9.9: V-n Diagram
13. Figure 1.2: External View - Three-view
14. Figure 1.3: Internal View
Page D- 1
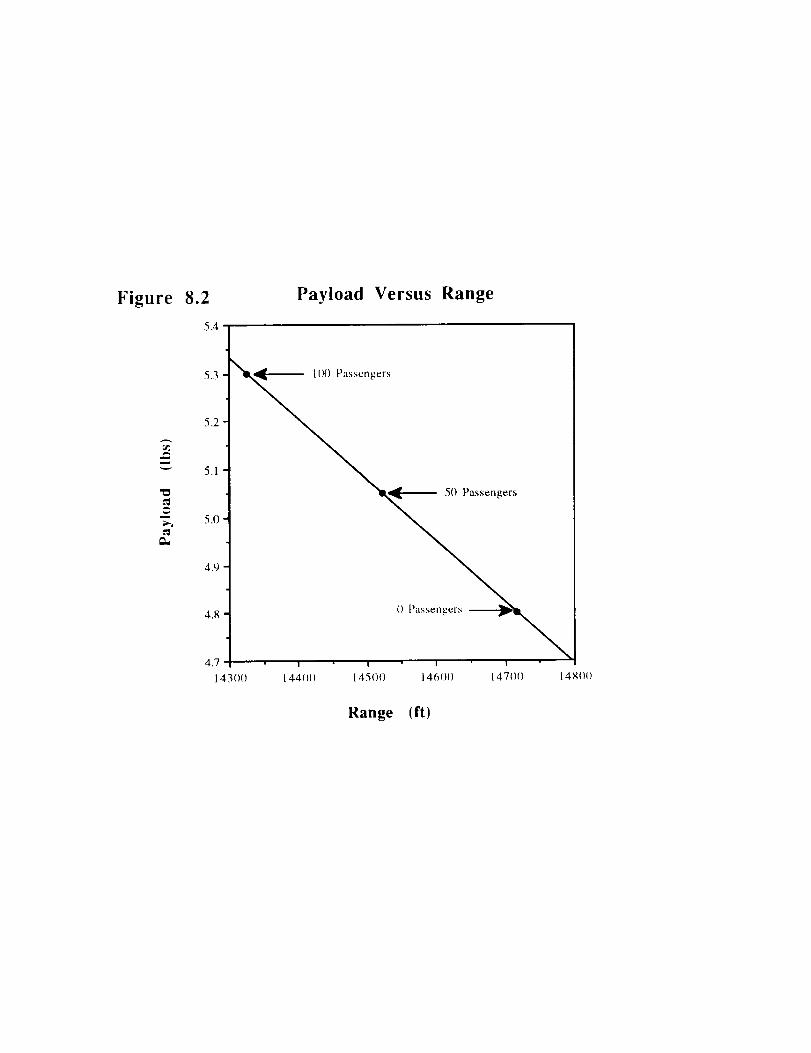
Figure 8.2
5.4
5.3
5.2
m
5.1
"_, 5.0
4.9
4.8
4.7
1430O
Payload Versus Range
100 Passengers
50 Passengers
() Passengers
144(1(1 145(3(/ 14600 147110 148111)
Range fit)
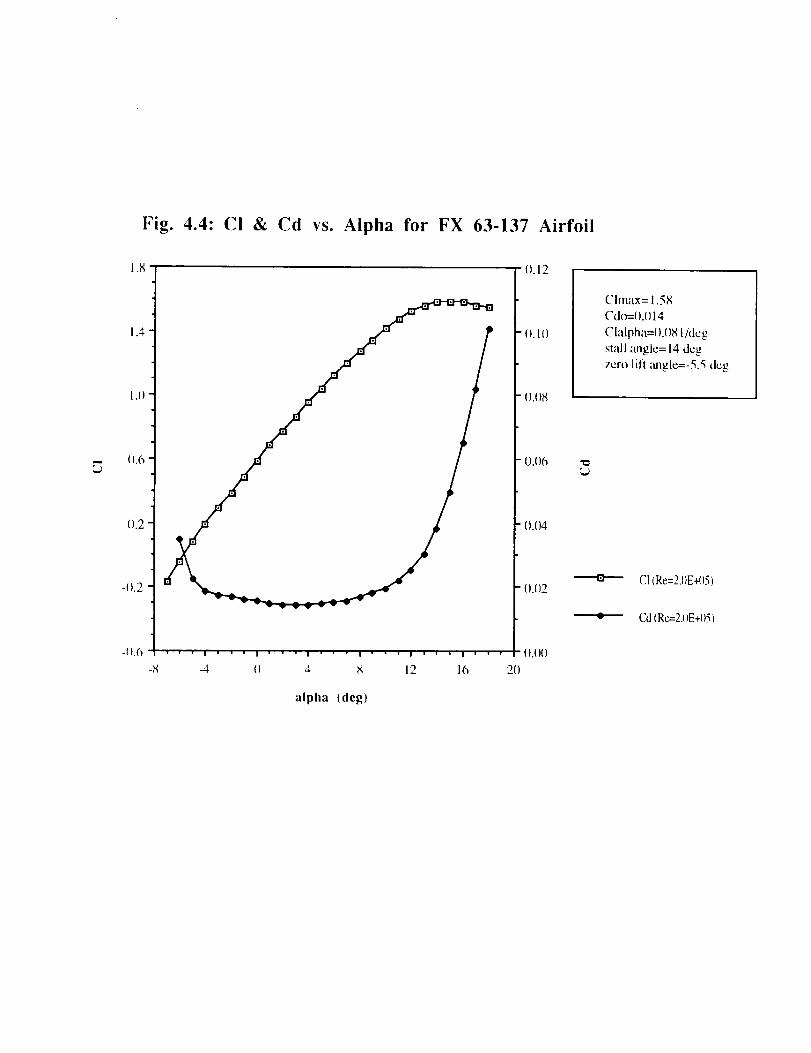
1.8
1.4
| .[)
).6
0.2
Fig. 4.4: CI & Cd vs. Alpha for FX 63-137 Airfoil
-().2
-{L6
-8 -4 12 16
o.I{)
().()4
().()2
().()()
2O
Chnax= 1.58
Cdo=_ ).() 14
Clalpha=O.()8 l/deg
slall angle= 14 deg
zero lift _mgle=-5.5 deg
£1 (Re=2.I)E4)5)
• Cd (Re=2.(IE+()S)
alpha (deg)
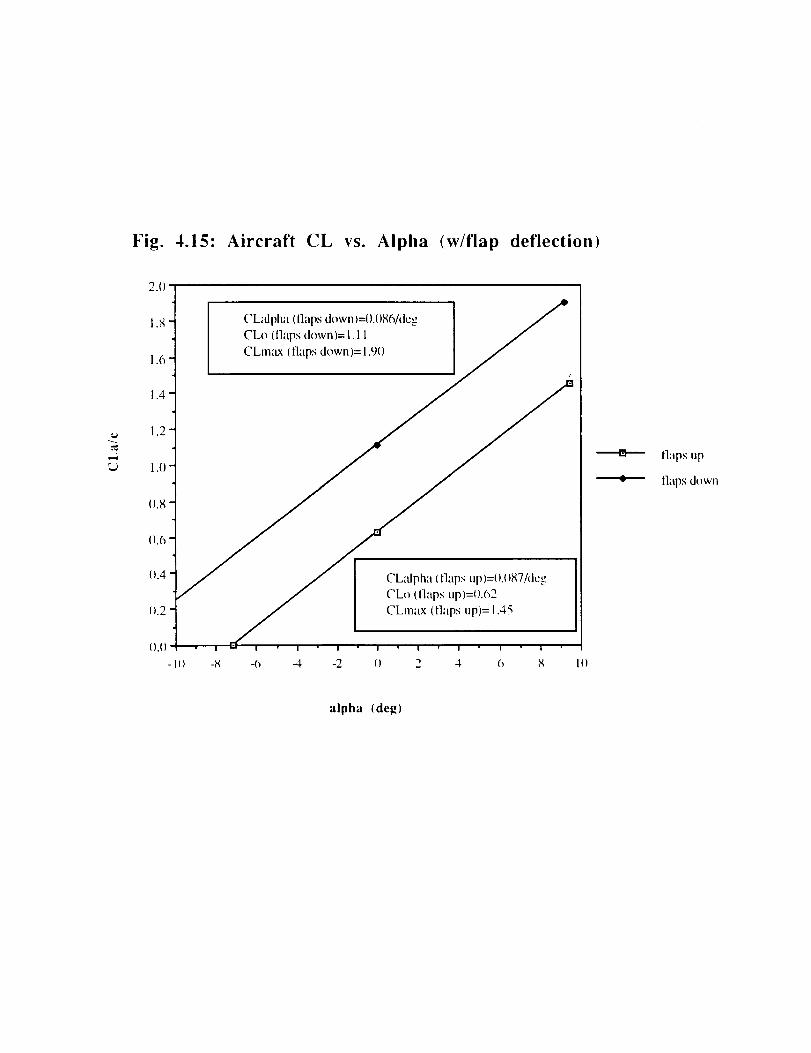
Fig. 4.15: Aircraft CL vs. Alpha (w/flap deflectiont
CLdpha (llaps down)=!).{)g6/deg
CLo (flaps down)= 1.1 1
CLmax (llaps down)= 1.91_
CLadpha ( llaps up)={).{)X7/deg
CL¢_ (llaps up)=_).62
CLmax (flaps up)= 1.45
flaps up
llaps down
alpha (deg)
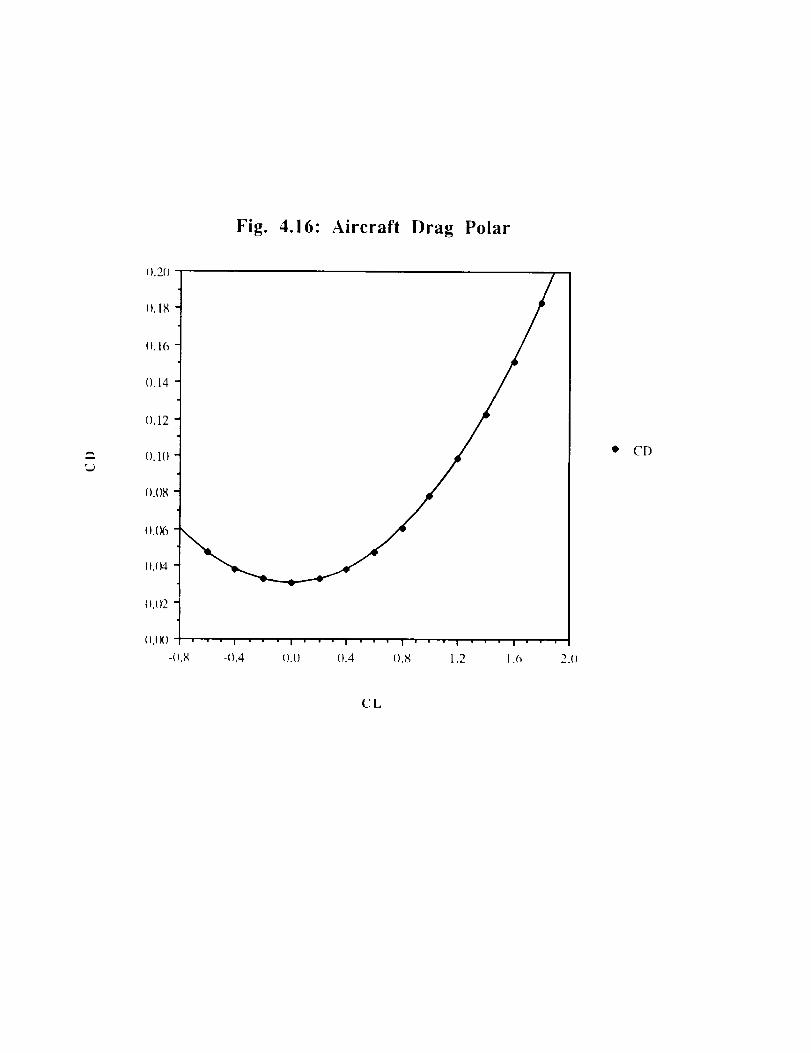
Fig. 4.16: Aircraft Drag Polar
-{).4 ().() (}.4 {)._ 1.2 1.6 2.()
e, CD
CL
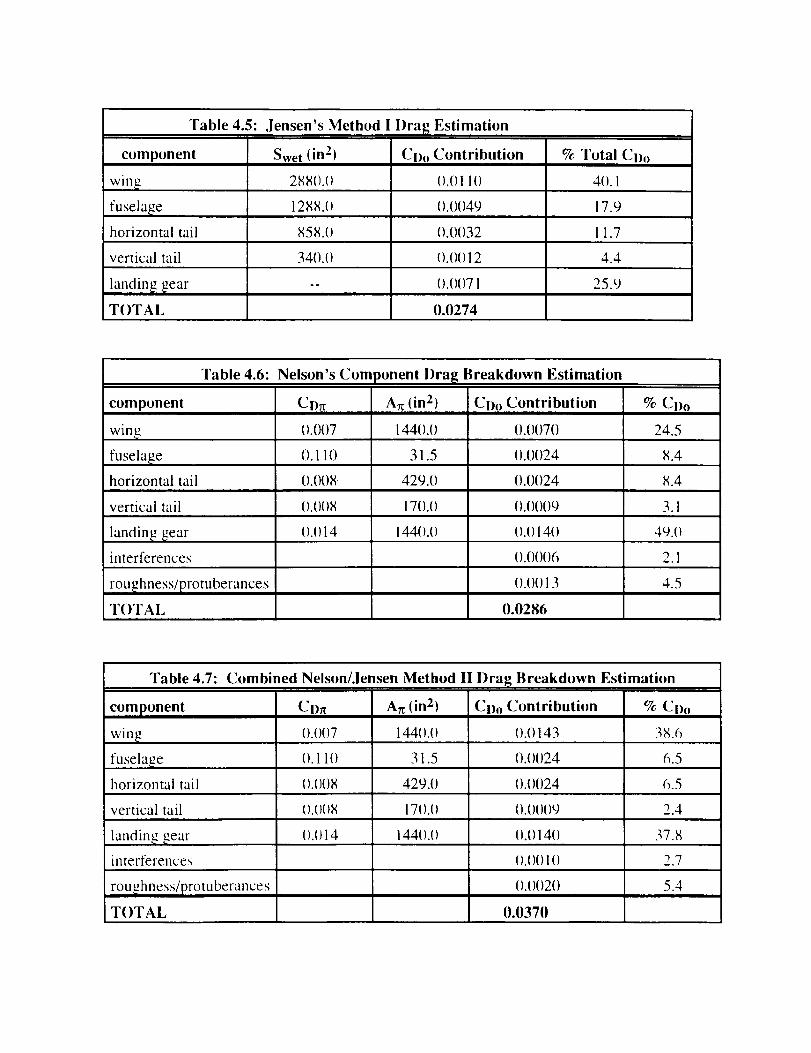
Table 4.5: Jensen's Method l I)ra_ Estimation
component Swet (in2) Coo Contribution % Total CI)o
win_ 288().() ().011() 40.1
fuselage 1288.0 0.0049 17.9
horizontal tail 858.0 0.1)1)32 11.7
vertical tail 34{).(1 ().()() 12 4.4
landin_ tear -- 0.01)71 25.9
T()TAL {I.0274
Table 4.6: Nelson's Component l)ral_ Breakdown Estimation
component Cl)rc Art (in 2) Cl)o Contribution % CDo
w in_ ().0()7 1440.() ().0070 24.5
fuselage (). 110 31.5 0.0024 8.4
horizontal tail 0.008 429.(i) ().0024 8.4
vertical tail ().()()8 170.0 ().()()()9 3.1
landin_ _ear ().1)14 144().() ().() 14() 49.()
interferences ().00()6 2.1
().()()13 4.5roughness/protuberances
T()TAL 0.0286
Table 4.7: Combined Nelson/Jensen Method II Drag Breakdown Estimation
component CI)_ Art (in 2') CI). Contribution % Cl)o
win_. 1).()()7 144().() ().()143 38.6
(). 11() 31.5 ().()()24 6.5fuselage
horizontal tail ().()()8 429.() ().()()24
vertical tail ().()()8 17().() ().()()()9
landin_ _ear ().() 14 144().() ().() 140
interferences ().()()1()
roughness/protuberances ().()()20
T()TAL 1t.03711
6.5
2.4
37.8
2.7
5.4
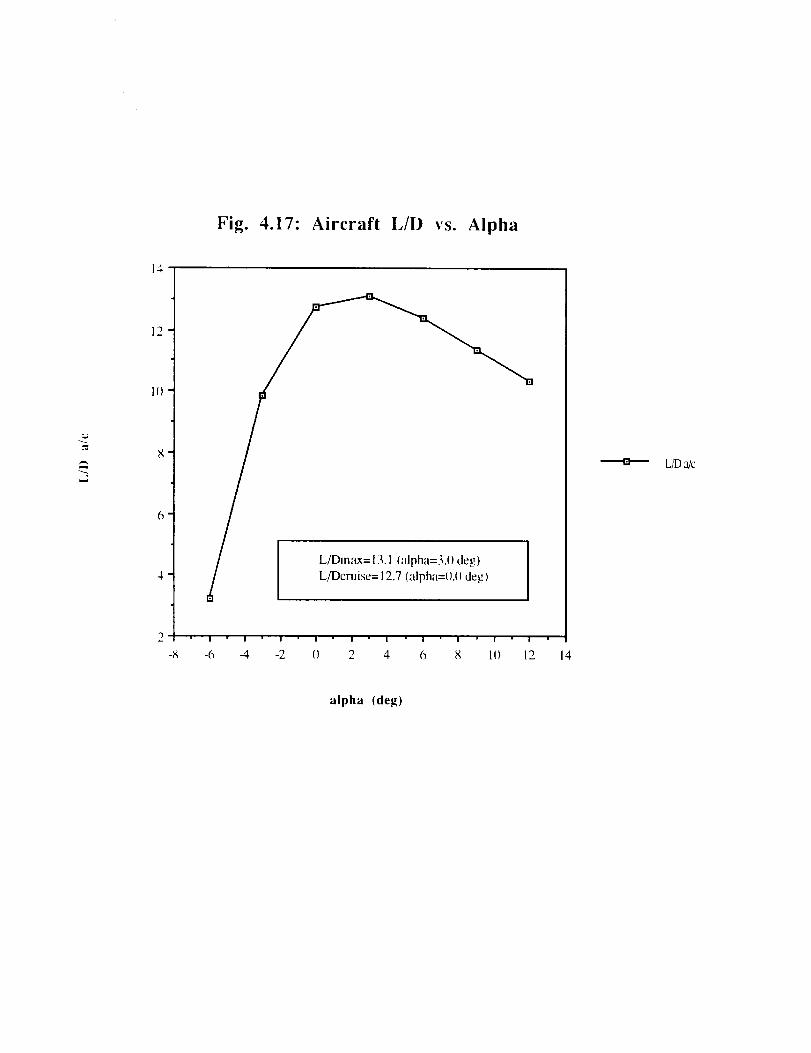
Fig. 4.17: Aircraft L/l) vs. Alpha
m
14
12
It)
=
L/Dcruise= 12.7 (_dpha=O.(I de_)
' I
-6
I ' I ' I ' I " I " I I I ' i "
-4 -2 11 2 4 6 8 I0 12 i4
LD a/c
alpha (deg)
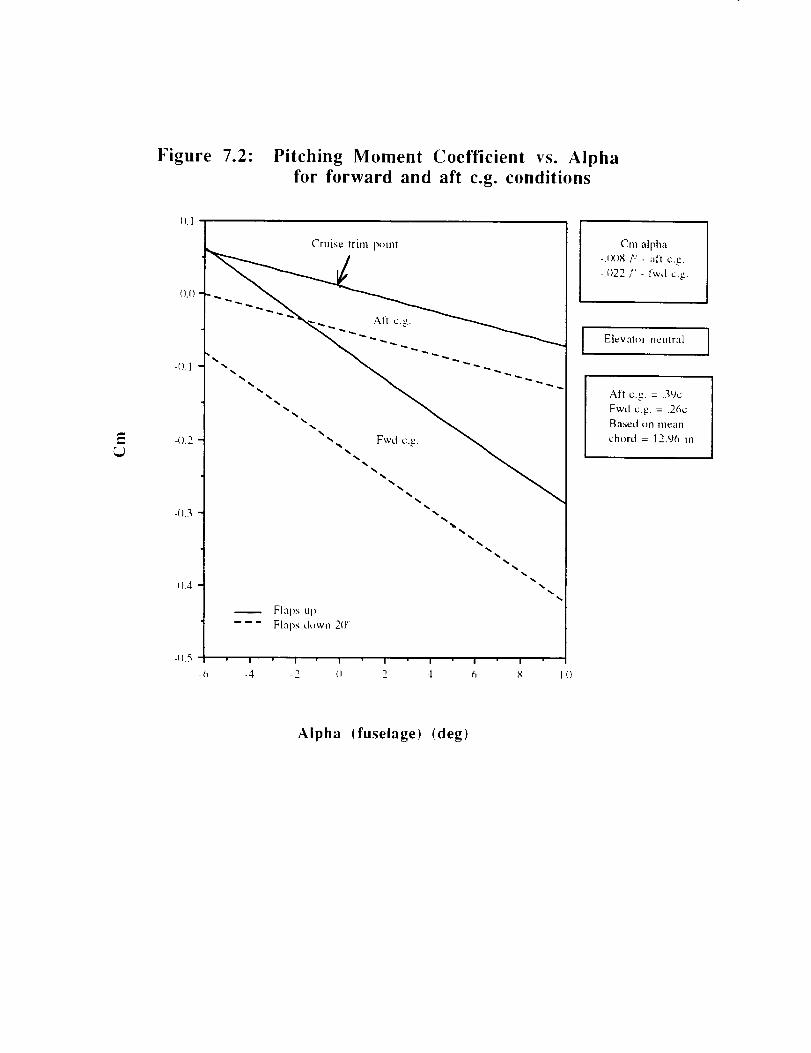
Figure 7.2: Pitching Moment Coefficient vs. Alpha
for forward and aft c.g. conditions
EL)
ILl
t),(),
-().1
-o.2
-O.3
-_).4
-_.5
Cruise trim pmnl
%%%
%%%%%
%%%%%%%%%
%%
%
%%
%%
%%
%%
n
%
-6
I I " I I I I I
-4 -2 I_ 2 4 6 x
Cm alpha
-.l){)g /'_ - a|t e.g.
-.1122 ?' - fwd e.g.
Elev al_r neutral I
Aft c.g .... a,gc
Fwd e.g. = .26c
Baxed _m mean
chL_rd = 12.96 in
Alpha (fuselage) {deg)
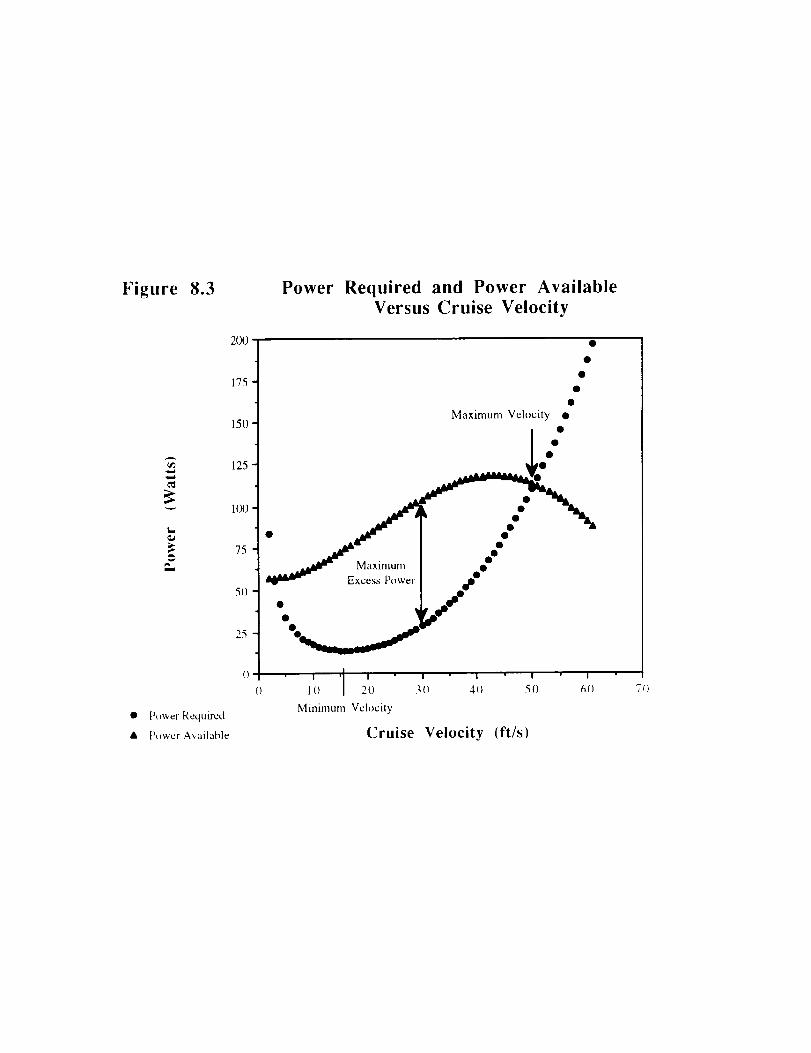
Figure 8.3 Power Required and Power Available
Versus Cruise Velocity
2O0
175
150
125
100
t_
._ 75
SO
25
• Power Required
• [h_wer Available
Ma×imum Velocity •
_j Maximum •
Excess Power
.
I 'l I I I I10 20 _0 40 50
Minimunl Velocity
Cruise Velocity (ft/s)
I
611 7()

Figure 5.3" Propeller Efficiency vs. Advance Ratio
1.0
,n
t_
m
Ot_
0.8
0.2
0.0 I , I 1
0.2 0.3 0.4
[] 00
D 0
m
[]
rnI I
0.5 0.6
oo0
0
0
eo
o
tg' ,
0.7 0.8
m Zinger 12x4
• Zinger 12x6
o Top Flight IBx7
Advance Ratio
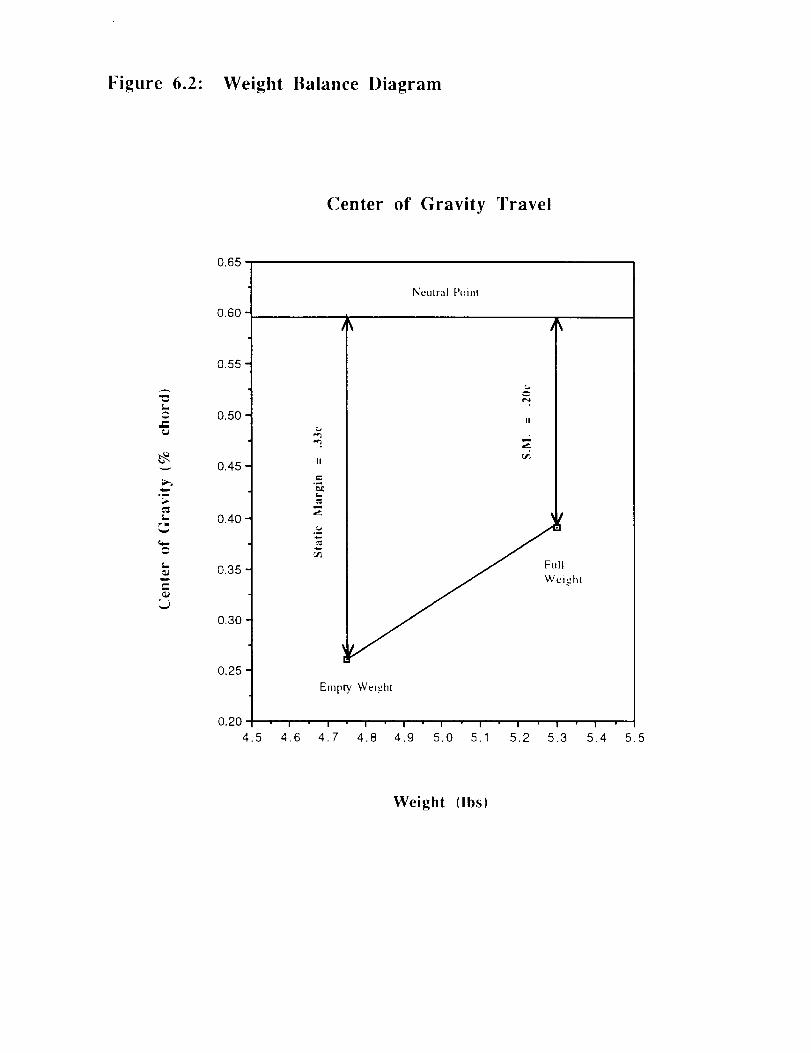
Figure 6.2: Weight Balance Diagram
Center of Gravity Travel
t_
Iirim
Ii
0.65
0.60
0.55
0.50
0.45
0.40
0.35
0.30
0.25
Neutral Puint
e-
.-4
.P.
Empty Weight
II
Full
Weight
0.20
4.5 4.6 4.7 4.8 4.9 5.0 5.1 5.2 5.3 5,4 5.5
Weight (Ibs)

Table 6.1: Component Weight Estimates
Component
Propulsion:
enginepropeller
Prelim,Estimate Fraction
(ounces) (%)
9.0 9.49{).5 .53
Final Wei_,htEstimate Fraction
(ounces) (%)
7.5 9.32
.69 .8629.82
3.251.8.9518.0
14.4 22.8611.68 14.516.3 7.83
6.1) 2.481.12 1.39
avionics package:speed controllerservosreceiverbatteries
Structure:
wing
fuselage
empenagelanding gearengine mount
Empty TotalsPassenger load
Full Totals
3.25l.N.95
20.O
27.43
16.0 21.1
24.{) 25.324.() 4.225.0 1.O51.5 1.58
.... _muom_ .... _m ..... Q ..... inm_lDn ......... _lm
86.0 71.69
8.8 9.28 g.8 1(i).93
94.8 100% 80.49 1{){1%
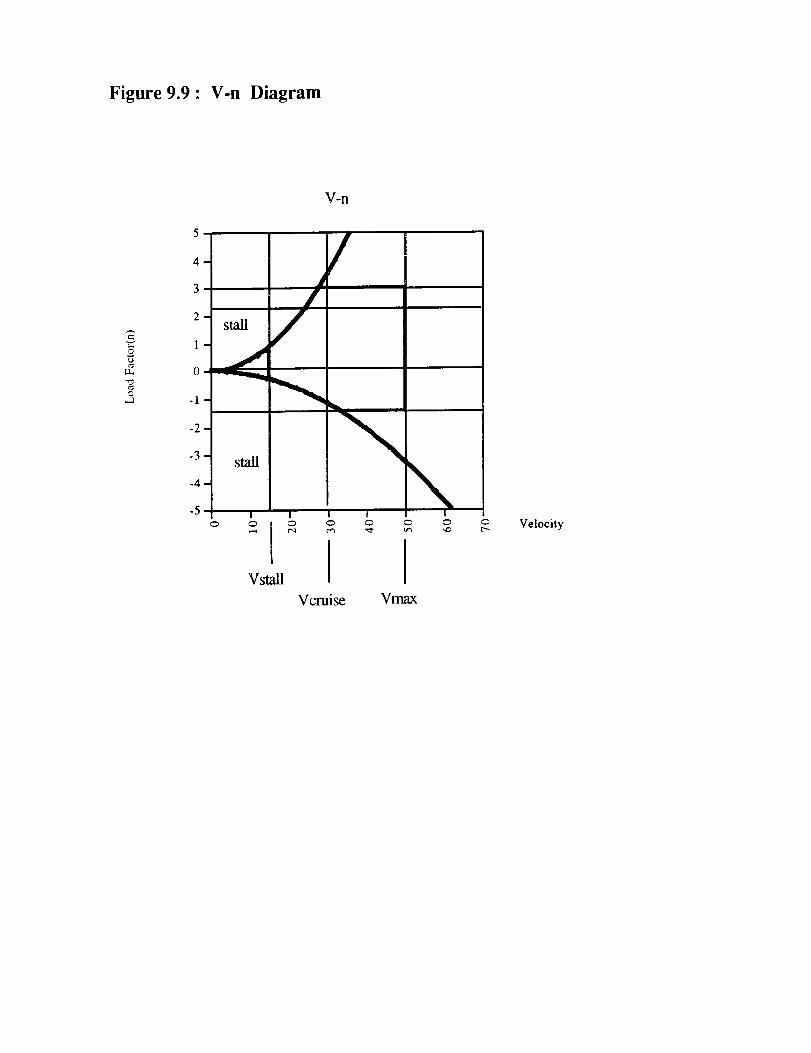
Figure 9.9 • V-n Diagram
0.A -1
stall
V-n
//
/
stall
O O o
vst_ IVcruise
\0 0 _ 0
_'% _ t_
Vmax
Velocity
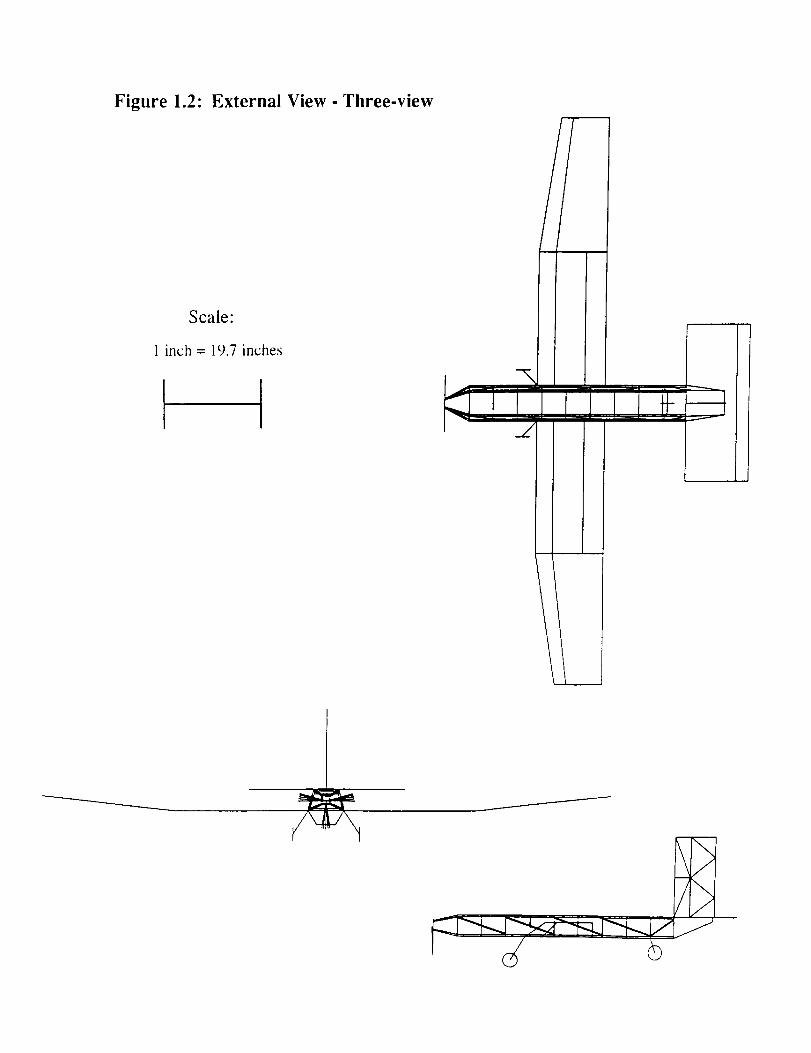
Figure 1.2: External View- Three-view
Scale:
1 inch = 19.7 inches
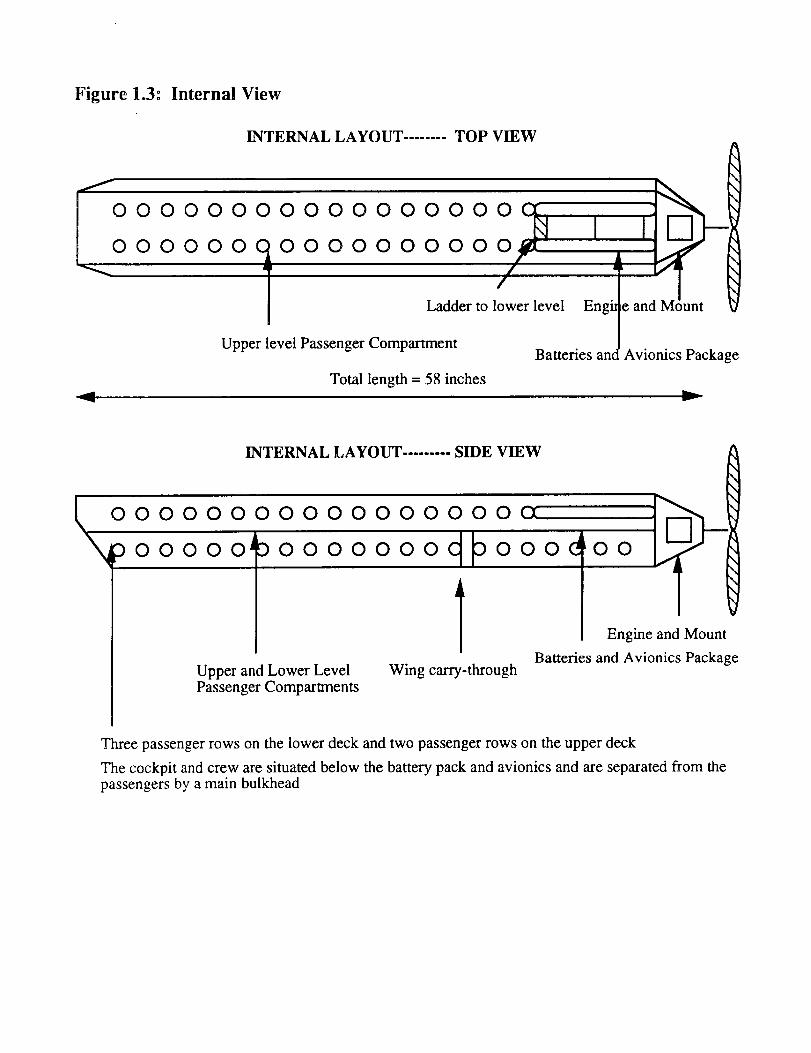
Figure 1.3: Internal View
INTERNAL LAYOUT ........ TOP VIEW
l
_e and Miunt
O0000000000000000C_00000
o]oooooooooo /Ladder to lower level Engh
Upper level Passenger CompartmentBatteries and
Total length = 58 inches
Avionics Package
INTERNAL LAYOUT ......... SIDE VIEW
00000000000000000_300000
Upper and Lower LevelPassenger Compartments
DOOOOOOOC_OOOe
1Wing carry-through
O0
Engine and Mount
Batteries and Avionics Package
Three passenger rows on the lower deck and two passenger rows on the upper deck
The cockpit and crew are situated below the battery pack and avionics and are separated from thepassengers by a main bulkhead
Appendix E: Fabrication of the Technology Demonstrator
The fabrication of the technology demonstrator took place over a two-week span following
the Manufacturing Plan Review. General phases of the construction process included the
allocation of raw materials and supplies, subsystem/component fabrication, structural component
integration, control/propulsion system integration, Monokoting, and systems testing. Several
problems and inconsistencies with the proposed design have arisen, however, and necessary
adjustments have been made and are listed as follows.
E.1 Weight
Upon completion of fabrication the technology demonstrator weighed approximately 6.7
lbs, 1.4 lbs greater than our final proposed design weight of 5.3 lbs. This weight increase was
due primarily to the addition of extra structural support members for the interior avionics
compartment and landing gear supports for The Bunny. Our initial Monokote estimate was also
considerably lower than that used in the fabrication process. These added material weights
comprise the majority of the weight increase for The Bunny. This higher weight may not allow
The Bunny to achieve some of its projected performance objectives. However, our original target
weight was 6.0 lbs, and many of our initial sizing and performance calculations were made using
this weight. In addition, our propulsion analysis indicates that operation of The Bunny will be
possible for weights under 7.5 lbs. For these reasons, we feel that in spite of the increased
weight, The Bunny will still perform to acceptable levels. Due to the added weight, the center of
gravity was carefully monitored throughout the construction and assembly phases. Through
simple balance analyses the center of gravity was found to be located at approximately 0.3 of the
mean aerodynamic chord. Center of gravity placement at this location shall provide adequate
maintainable stability and control.
E.2 Flaps
The implementation of the flap surfaces and corresponding control systems provided the
singlemost time consuming obstacle in the manufacturing of The Bunny. Construction of the flap
surfaces proceeded according to our Manufacturing Plan Review, yet several alterations had to be
made. Extra Monokote had to be added to the flap/wing joint in order to strengthen the connection
and allow for adequate flap rotation without translation. Our original design of bending the
flexible-type pushrods from the lower level to the flap servo on the upper level proved inadequate.
The outer sheath was too stiff to bend, yet the inner rod was too flexible to transmit the necessary
force without the sheath. With this arrangement, the movement of the servo resulted mainly in the
bending of the pushrod, rather than the deflection of the flaps as desired. In order to correct this
problem, the flap servo was moved to the lower level and a four-arm connection was used. The
pushrods were connected perpendicularly to opposite arms of the servo. This allowed the rods to
remain straight, and maximized the effect of the servo deflection. With this arrangement, the
desired twenty degree flap deflection was able to be achieved. One other condition which added to
this problem was the modification of our remote control transmitter to accommodate the flaps. The
spring was removed from the flap control so that the pilot would not have to hold the flaps in the
deflected position during take-off. However, this modification reduced the degree of rotation of
the servo. One further recommendation for future productions of The Bunny is to run the
pushrods straight out to the desired spanwise location, and use some type of lever device to join
the pushrods to the flap control horns at a perpendicular angle. This would allow for greater
deflection of the flaps, since there would be less room for bending of the rods.
E.3 Materials and Manufacturing Costs
The manufacturing costs of The Bunny exceeded projected totals by approximately 18.3%,
amounting in a total increase in aircraft cost of approximately 14.3 % (see Table E.1 below). This
increase in the projected cost of The Bunny can be accounted for in two major areas, materials and
personnel costs. Costs projections in personnel hours were based on crude estimations from
previous design reports. A detailed record of actual personhours worked on the construction of
The Bunny proved that these projected estimates may have been inconsistent or inaccurate.
Increases in the materials costs, however, were due primarily to errors in calculating the actual size
and amount of materials needed. Whereas the proper size of each structural component was
adequately determined, the amount of material needed to to accomplish the task of building each
element was underestimated and did not take into account the size availability from the raw
materials subcontractor. Subsequently, manufacturing change orders were required for the
purchase of added balsa and aluminum rods for the landing gear, consisting of nearly 25% of the
entire raw materials cost.
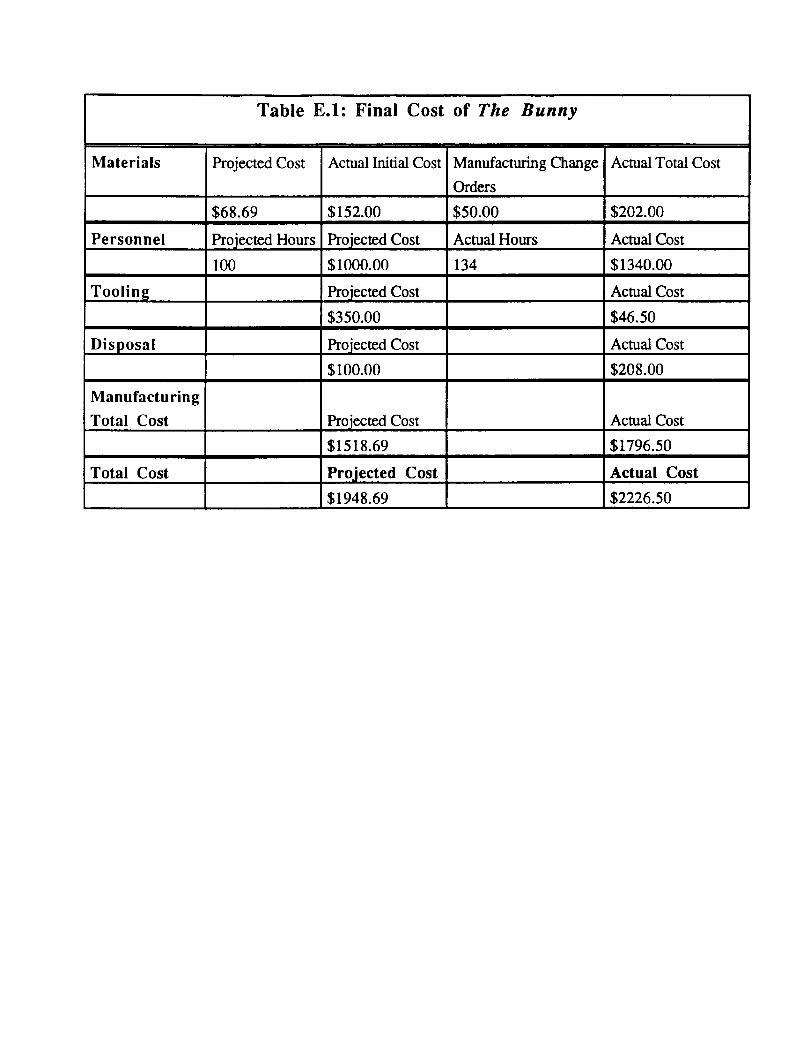
Table E.I: Final Cost of The Bunny
Materials
Personnel
Tooling
Disposal
Manufacturing
Total Cost
Total Cost
Projected Cost
$68.69
Projected Hours
100
Actual Initial Cost
$152.00
Projected Cost
$1000.00
Projected Cost
$350.00
Projected Cost
$100.00
ProjectedCost
$1518.69
Projected Cost
$1948.69
Manufacturing Change
Orders
$50.00
A_ualHours
134
Actual Total Cost
$202.00
Actual Cost
$1340.00
Actual Cost
$46.50
Actual Cost
$208.00
Actual Cost
$1796.50
Actual Cost
$2226.50
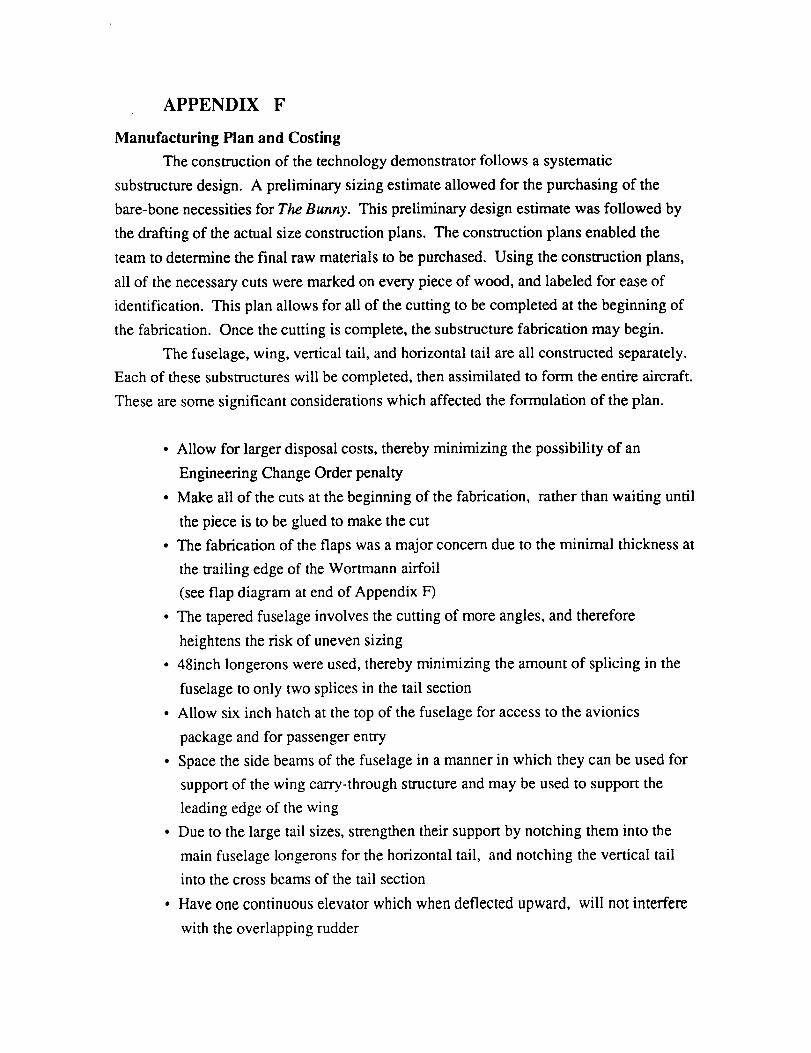
APPENDIX F
Manufacturing Plan and Costing
The construction of the technology demonstrator follows a systematic
substructure design. A preliminary sizing estimate allowed for the purchasing of the
bare-bone necessities for The Bunny. This preliminary design estimate was followed by
the drafting of the actual size construction plans. The construction plans enabled the
team to determine the final raw materials to be purchased. Using the construction plans,
all of the necessary cuts were marked on every piece of wood, and labeled for ease of
identification. This plan allows for all of the cutting to be completed at the beginning of
the fabrication. Once the cutting is complete, the substructure fabrication may begin.
The fuselage, wing, vertical tail, and horizontal tail are all constructed separately.
Each of these substructures will be completed, then assimilated to form the entire aircraft.
These are some significant considerations which affected the formulation of the plan.
• Allow for larger disposal costs, thereby minimizing the possibility of an
Engineering Change Order penalty
• Make all of the cuts at the beginning of the fabrication, rather than waiting until
the piece is to be glued to make the cut
• The fabrication of the flaps was a major concern due to the minimal thickness at
the trailing edge of the Wortmann airfoil
(see flap diagram at end of Appendix F)
• The tapered fuselage involves the cutting of more angles, and therefore
heightens the risk of uneven sizing
• 48inch longerons were used, thereby minimizing the amount of splicing in the
fuselage to only two splices in the tail section
• Allow six inch hatch at the top of the fuselage for access to the avionics
package and for passenger entry
• Space the side beams of the fuselage in a manner in which they can be used for
support of the wing carry-through structure and may be used to support the
leading edge of the wing
• Due to the large tail sizes, strengthen their support by notching them into the
main fuselage longerons for the horizontal tail, and notching the vertical tail
into the cross beams of the tail section
• Have one continuous elevator which when deflected upward, will not interfere
with the overlapping rudder
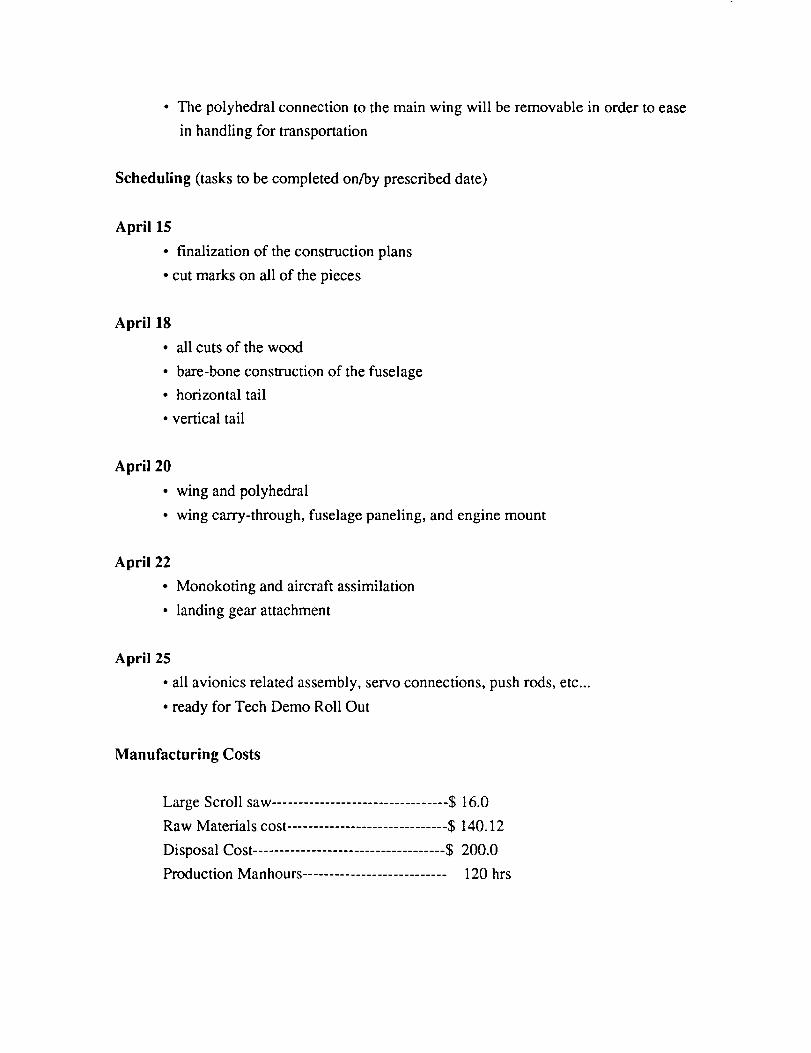
• Thepolyhedralconnectionto themainwing will beremovablein orderto ease
in handlingfor transportation
Scheduling(tasksto becompletedon/byprescribeddate)
April 15
• finalizationof theconstructionplans• cutmarksonall of thepieces
April 18
all cuts of the wood
bare-bone construction of the fuselage
horizontal tail
• vertical tail
April 20
wing and polyhedral
wing carry-through, fuselage paneling, and engine mount
April 22
Monokoting and aircraft assimilation
landing gear attachment
April 25
• all avionics related assembly, servo connections, push rods, etc...
• ready for Tech Demo Roll Out
Manufacturing Costs
Large Scroll saw ................................. $16.0
Raw Materials cost .............................. $140.12
Disposal Cost .................................... $ 200.0
Production Manhours ........................... 120 hrs

Detailed Raw Materials Breakdown
MATERIAL
Balsa
5 3/32 x 6 x 36 inches
4 1/2 x 3/8 leading edge
4 3/8 x 3/8 x 48 inches
3 1/8 x 3/8 x 36 inches
10 1/4 x 3/8 x 36 inches
Birch
Bass
1 1/16 x 12 x 48 inches plywood
4 3/16 x 36 inch dowels
3 1/8 x 1/4 x 36 inches
8 1/4 x 3/8 x 36 inches
Monokote
4 rolls
Miscellaneous
COST(dollars)
17.00
3.60
5.12
0.96
6.40
16.19
2.56
1.64
8.78
35.16
42.71
140.12
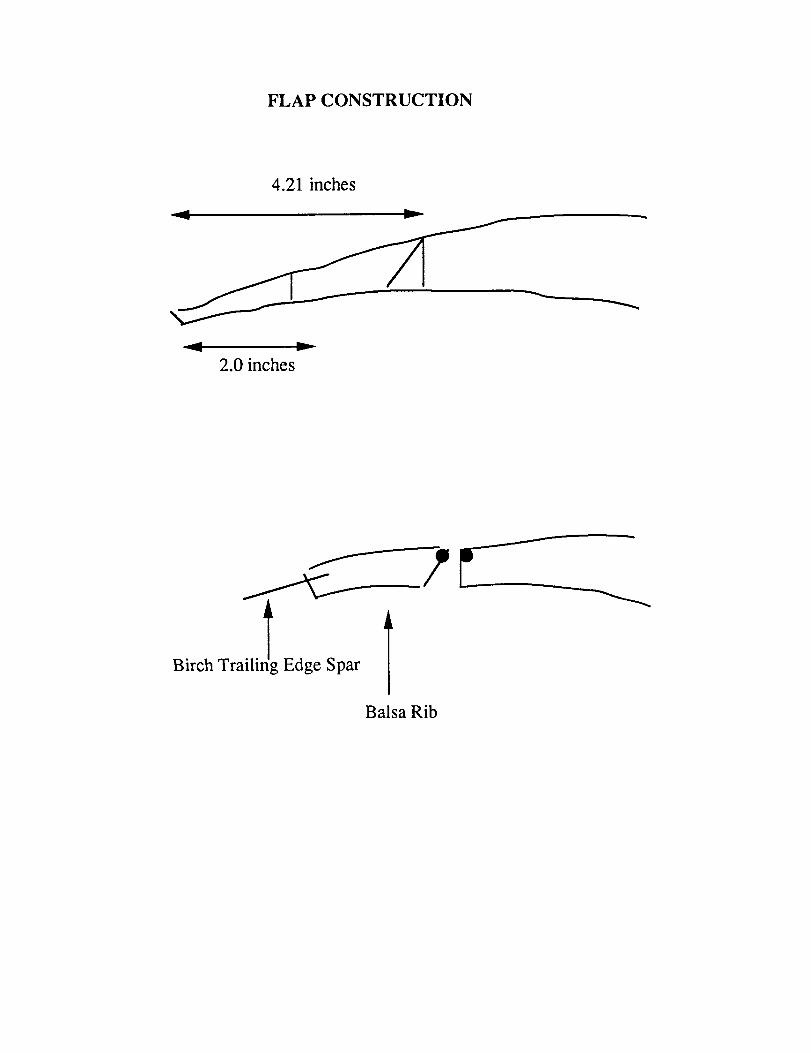
FLAP CONSTRUCTION
4.21 inches
2.0 inches
Balsa Rib