tsunami design in asce 7-16: an overview of the new provisions
TRANSCRIPT

Tsunami Design in ASCE 7-16: An Overview of the New Provisions
Seth Thomas, P.E.October 6, 2016NCSEA Webinar
Introduction
Seth Thomas, [email protected] Consulting Engineers Portland OR
ASCE 7 Flood Load SubcommitteeASCE 7 Tsunami Load Subcommittee

Agenda
• Learning Objectives• Tsunami 101: Mechanics Basics• Tsunami Code History• Recent/Current Research• ASCE 7-16 Tsunami Provisions Overview• Summary/Code Status• Questions

Learning Objectives
• Build a foundation of understanding of tsunami basics & principles
• Gain an understanding of the new tsunami load requirements in ASCE 7– Highlights of key provisions– Understanding of scope of chapter– Get an idea of what it takes to design for tsunamis

Tsunami 101: Mechanics Basics
Image: NOAA
Tsunami 101: Terminology
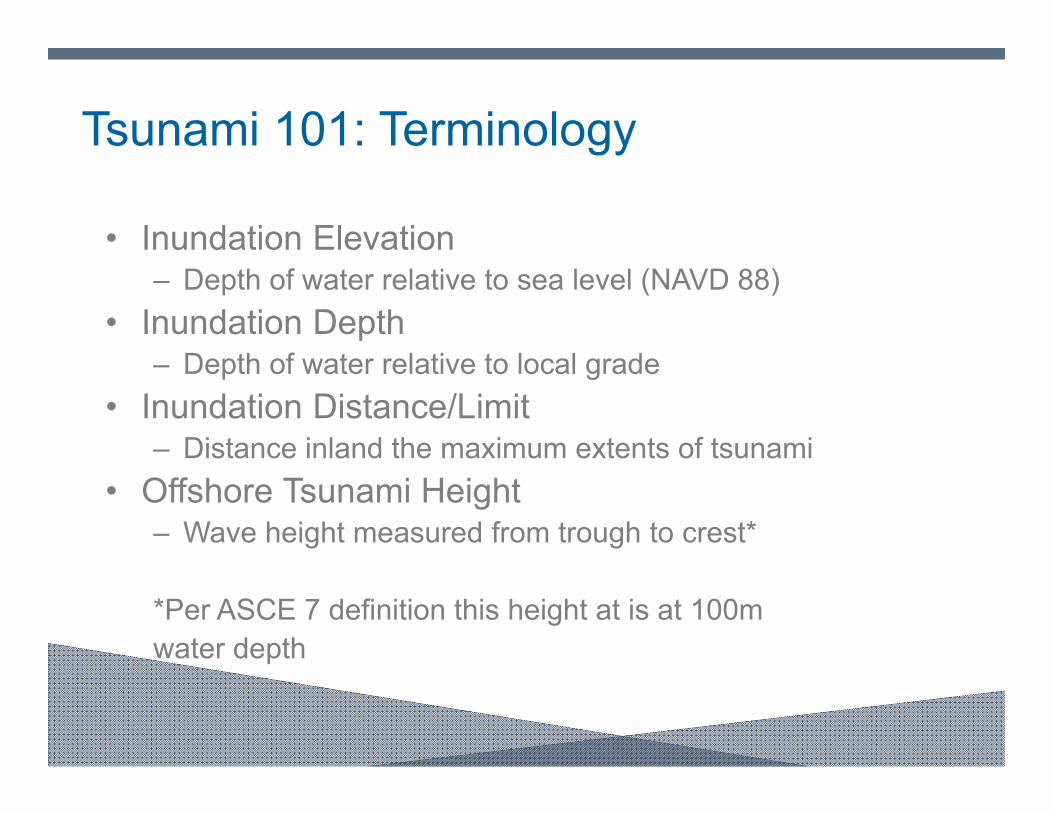
• Inundation Elevation– Depth of water relative to sea level (NAVD 88)
• Inundation Depth– Depth of water relative to local grade
• Inundation Distance/Limit– Distance inland the maximum extents of tsunami
• Offshore Tsunami Height– Wave height measured from trough to crest*
*Per ASCE 7 definition this height at is at 100m water depth
Tsunami 101: Terminology
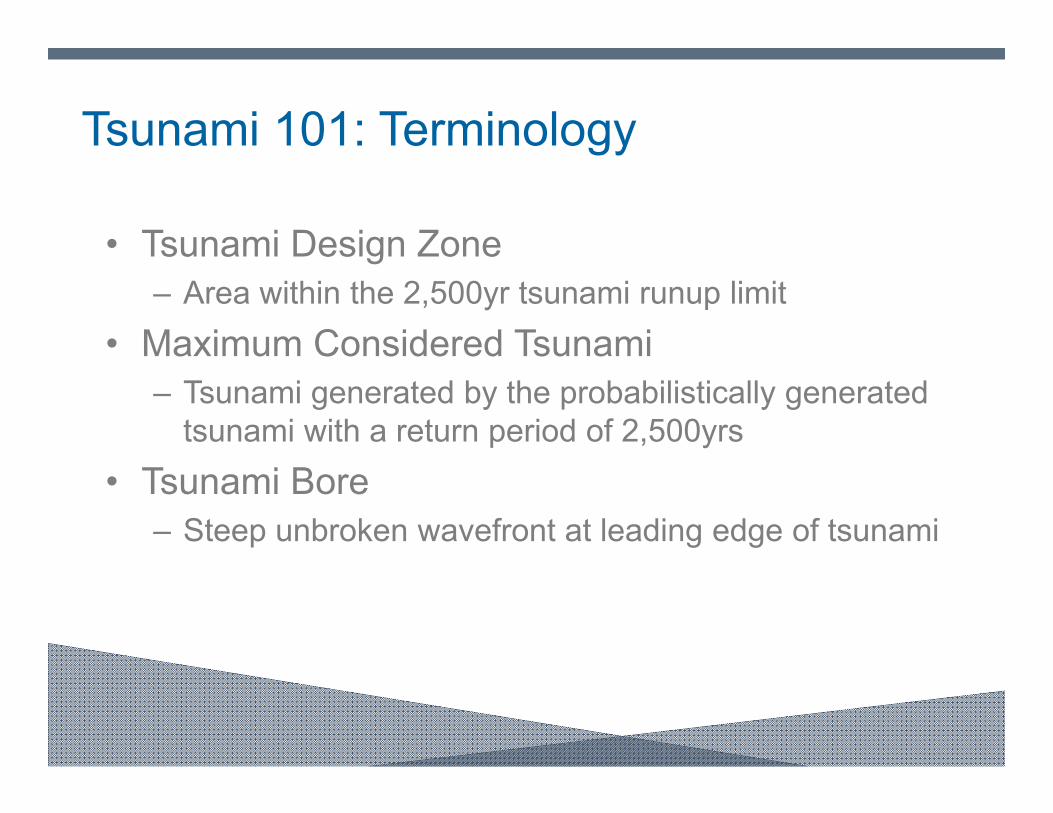
• Tsunami Design Zone– Area within the 2,500yr tsunami runup limit
• Maximum Considered Tsunami– Tsunami generated by the probabilistically generated
tsunami with a return period of 2,500yrs• Tsunami Bore
– Steep unbroken wavefront at leading edge of tsunami

Tsunami 101: Mechanics Basics
Generation Propagation Inundation
How are tsunamiscreated?
How do they movethrough the ocean?
What happens whenthey hit land?

Tsunami 101: Mechanics Basics (Generation)
• Tsunami Generation– Submarine Earthquakes (reverse faults only)– Landslides
• Only a handful of faults are capable of generating tsunamis – typically referred to as Subduction Zones

Tsunami 101: Mechanics Basics (Generation)
Subduction ZonesImage: www.wired.com

Tsunami 101: Mechanics Basics
Tsunami generation by earthquakehttp://geophile.net/Lessons/tsunami/tsunami_01.html
1) Plates converge over hundreds of years2) Stress builds up until plates slip (earthquake)3) When plates slip the crust flattens out causing uplift of the sea floor4) Upward motion of sea floor causes a outward wave in both directions

Tsunami 101: Mechanics Basics
• Open sea travel – Once generated tsunami moves very fast across
ocean– Speed inverse function of depth
• Typical tsunami wave in open ocean– Speed: ~500-600mph– Wave height: 1-4ft– Wave length: 40-60 miles

Tsunami 101: Mechanics Basics
• As tsunami approaches land – slows down and wave lengths compress – causing the wave height to grow
http://geophile.net/Lessons/tsunami/tsunami_01.html

Tsunami 101: Mechanics Basics• Once tsunami comes on land
– On land speeds typically 10-20mph– Water will flow inland for 5-15min and then recede – Depth of surge at shore can build to 30-50ft
• Inundation is very topography dependent and can inundate miles under certain conditions
Tsunami Inundation | 2011 Tohoku Tsunami
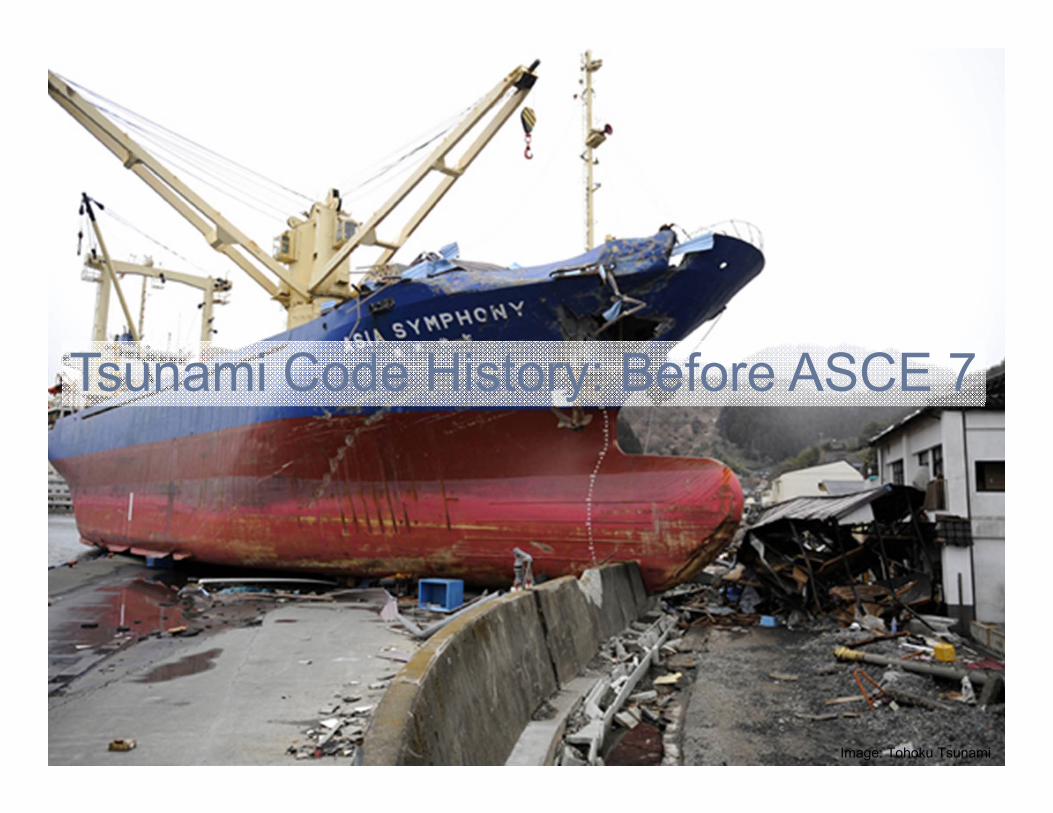
Tsunami Code History: Before ASCE 7
Image: Tohoku Tsunami

History of Tsunami Engineering Development – Before ASCE
• City of Honolulu Building Code of 1980.
• FEMA P646 Guidelines for Vertical Tsunami Evacuation Refuge structures has existed since 2004– not a consensus-based document– Very conservative – leads to economically unfeasible designs
• IBC Appendix M that references FEMA P646 has already existed for two cycles of code, but it has become obsolete.

History of Tsunami Engineering Development –Before ASCE
• Major events over last 10+ years– 2004 Sumatra Tsunami– 2009 American Samoa– 2010 Chile Tsunami– 2011 Tohoku Tsunami
• Chile & Japan Tsunamis showed well built buildings can withstand loads

Recent Tsunami Research

Recent Research Efforts• 2004 upgrade of OSU wave basin numerous
tsunami research projects have occurred.– Full scale inundations studies (OSU)– Flow amplification/dispersion studies (OSU)– Debris impact studies (U. Hawaii)– Tsunami countermeasure (seawall) studies (OSU)– Wall impact and hydrodynamic load studies (U. Hawaii)– Dynamic uplift loads on slabs (U. Hawaii)– Numerical model calibration (USC)– Ground roughness studies (Texas A&M)

Recent Research Efforts
• Research has increased tsunami knowledge by– verification and improvement of numerical models – Development of empirical equations for tsunami
loading

Recent Research Efforts
• In addition to laboratory research Sumatra, Samoa, Chile, & Japan post tsunami investigations have lead to valuable insight – Flow velocities– Inundation model validations– Scour and erosion investigation– Highlighting new design considerations
• Calibration of NOAA (and other) tsunami models from buoy data from major events

ASCE 7 Code Development

ASCE 7 Code Development
• ASCE Tasked a new subcommittee in spring of 2011 to develop a new chapter for ASCE 7 for minimum loads from tsunami generated waves/flows
• Committee made up of design and research professionals from the tsunami and structural engineering fields

ASCE 7 Tsunami Subcommittee
– Gary Chock (HI) – Chair– Mike Briggs (VA)– Yong Wei (WA)– Dan Cox (OR)– Matt Francis (UT)– John Hooper (WA)– Chris Jones (NC)– Dave Kriebel (MD)– Pat Lynett (CA)– Ian Nistor (Ottawa)– Ron Riggs (HI)– Ian Robertson (HI)
– Hong-Kie Thio (CA)– Susan Tonkin (WA)– Solomon Yim (OR)– Kent Yu (OR)– Robert Bachman (CA)– Mike Mahoney (DC)– Seth Thomas (OR)– Dan Palermo (Ottawa) – Catherine Petroff (WA)– Rick Wilson (CA)– Long Phan (DC)– Clay Natio (PA)
ASCE 7 Tsunami Subcommittee members:
Worked from 2011-2015 to develop, write and get new code language approved
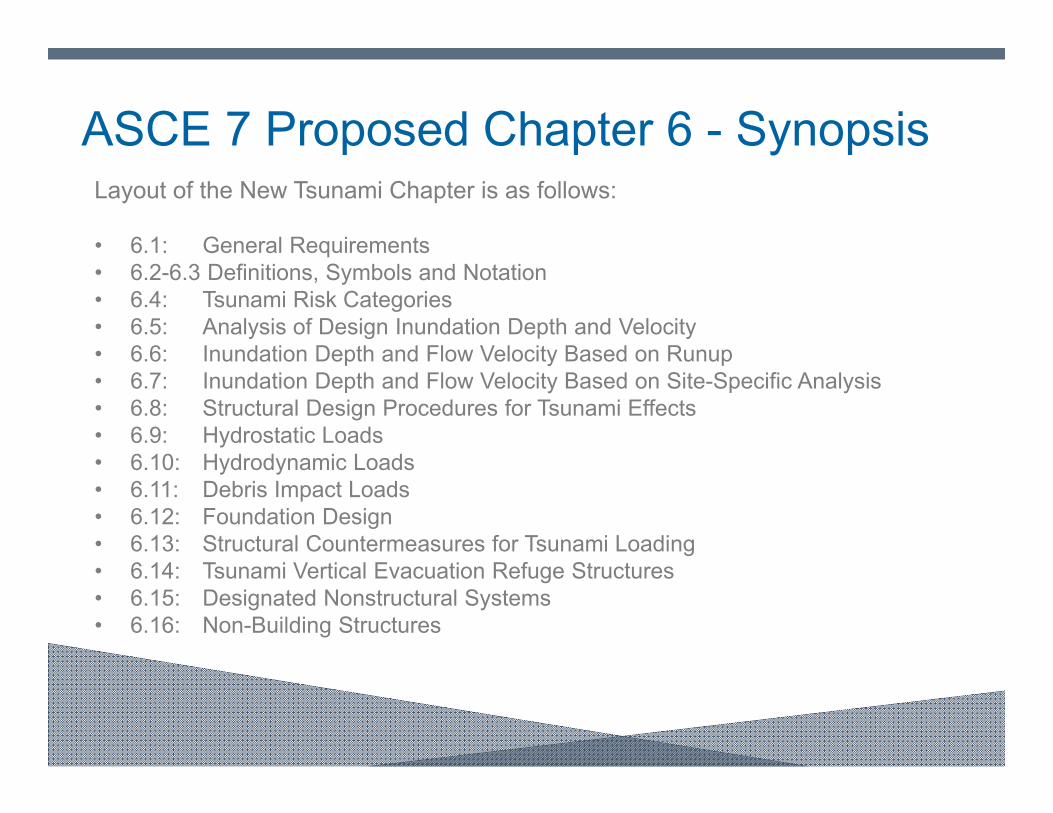
ASCE 7 Proposed Chapter 6 - SynopsisLayout of the New Tsunami Chapter is as follows:
• 6.1: General Requirements • 6.2-6.3 Definitions, Symbols and Notation• 6.4: Tsunami Risk Categories• 6.5: Analysis of Design Inundation Depth and Velocity• 6.6: Inundation Depth and Flow Velocity Based on Runup• 6.7: Inundation Depth and Flow Velocity Based on Site-Specific Analysis• 6.8: Structural Design Procedures for Tsunami Effects• 6.9: Hydrostatic Loads• 6.10: Hydrodynamic Loads• 6.11: Debris Impact Loads• 6.12: Foundation Design• 6.13: Structural Countermeasures for Tsunami Loading• 6.14: Tsunami Vertical Evacuation Refuge Structures• 6.15: Designated Nonstructural Systems• 6.16: Non-Building Structures
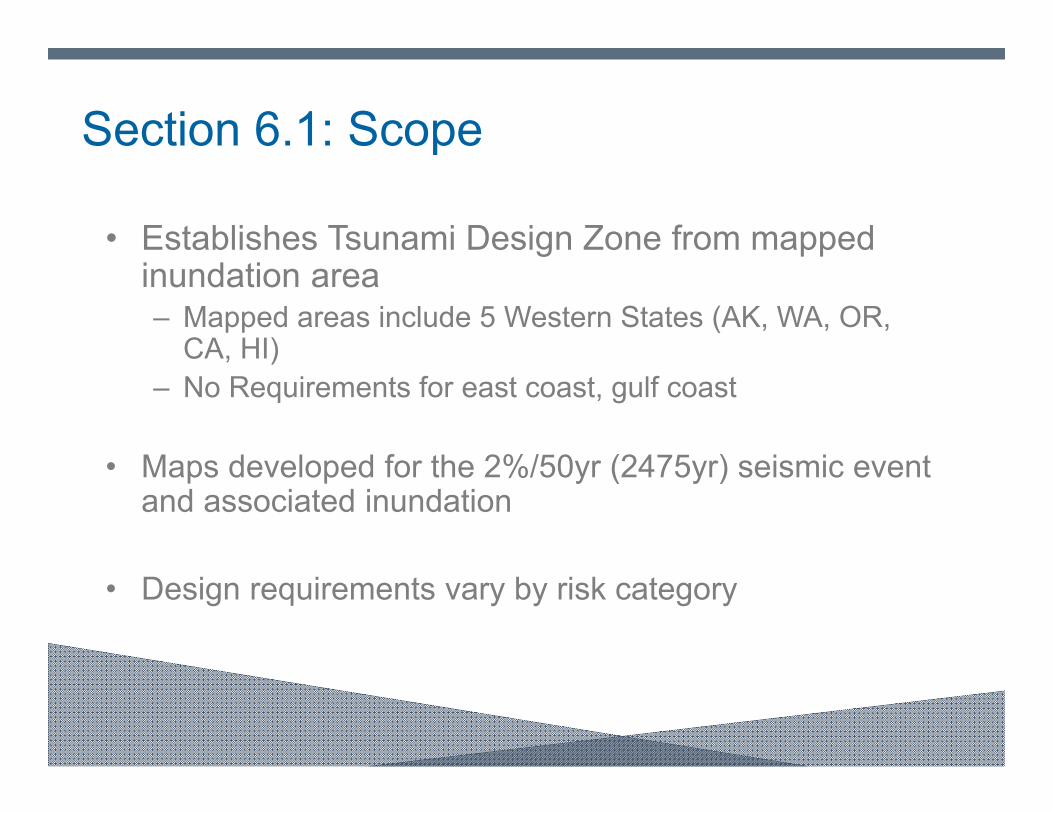
Section 6.1: Scope
• Establishes Tsunami Design Zone from mapped inundation area– Mapped areas include 5 Western States (AK, WA, OR,
CA, HI)– No Requirements for east coast, gulf coast
• Maps developed for the 2%/50yr (2475yr) seismic event and associated inundation
• Design requirements vary by risk category
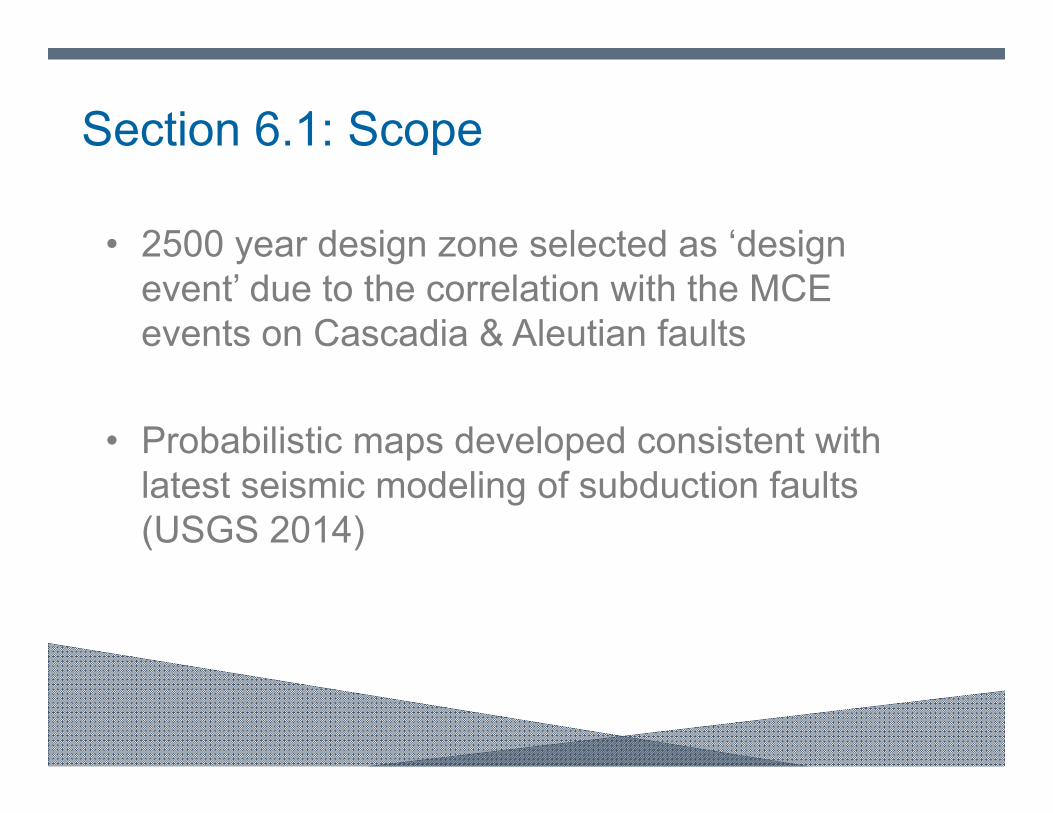
Section 6.1: Scope
• 2500 year design zone selected as ‘design event’ due to the correlation with the MCE events on Cascadia & Aleutian faults
• Probabilistic maps developed consistent with latest seismic modeling of subduction faults (USGS 2014)

Section 6.1: Scope
• Sets requirements for which buildings are affected– RC II buildings above threshold height*
– Collapse prevention – RC III Critical Facilities
– Life Safety– RC IV buildings
– Damage Control– RC IV Evacuation Structure
– Immediate Occupancy
*threshold height to be set by Local Jurisdiction (i.e. State of Oregon)

Section 6.1: Scope
• Designer needs inundation depth and velocity– Maps do not directly provide this (too many site possibilities)
• Maps provide user– offshore wave height – inundation limit
• From this user gets site specific study (Section 6.7) or develops inundations/velocities from empirical equations (section 6.6)

Section 6.1: Scope
• Maps will be available via ASCE website – maps in multiple forms– Partial information available in printed maps (TDZ only)– Google Earth KML– .csv data files
• Google earth best interface for most users

Section 6.1: Scope
• Maps: Part 1 – Offshore wave height
Example of offshore wave height in GE interface

Section 6.1: Scope
• Maps: Part 2 – Tsunami Design Zone
Example of tsunami design zone in GE interface

Section 6.1: Scope
• Maps: Part 2 – Tsunami Design Zone
Example of tsunami design zone in GE interface
Run‐up limit

Section 6.1: Scope
• Maps: Part 2 – Tsunami Design Zone
Example of tsunami design zone in GE interface

Section 6.1: Scope
• Maps: Part 2 – Tsunami Design Zone
Example of tsunami design zone in GE interface

Section 6.2/6.3: Key Definitions/Symbols
• Key terminology for tsunami design

Section 6.4: Tsunami Risk Categories
• Takes basic risk category definitions from chapter 1 and modifies them with the following – The following structures need not be included in
Tsunami Risk Category IV and state, local, or tribal governments shall be permitted to designate them as Tsunami Risk Category II or III:
• Fire stations and ambulance facilities, emergency vehicle garages
• Earthquake or hurricane shelters • Emergency aircraft hangars

Section 6.5 - Tsunami Flow Characteristics
• Depending on risk category the design tsunami flow can be determined by the following methods– Energy Grade Line (Sec. 6.6) – Site specific analysis (Sec 6.7)
Can be ignored in 99% of cases
Always required
Always allowed, only required in specific cases

Section 6.5 - Tsunami Flow Characteristics• Section also addresses sea level change (+/-)
– Note: not sea level rise– Not allowed to take reduction but some areas are seeing relative drop due
to plate tectonics– 50yr minimum life cycle
• Analysis to be adjusted by design sea level change prior to tsunami inundation
• http://tidesandcurrents.noaa.gov/sltrends/sltrends.html
NOAA sea level data – South Beach, OR

Section 6.6: Flow Parameters by EGL
• Energy Grade Line – Empirical method to take the map values and determine flow parameters at site.
• Need– Topography from waterline to site*– Offshore wave height (from maps)– Inundation limit (from maps)
• Analysis done by spreadsheet

Section 6.6: Flow Parameters by EGL
• EGL methods based on fluid mechanics and conservation of energy. – At shore energy is mix of incident & velocity– At maximum inundation point energy is all incident
• Calibrated with numerical models and field data

Section 6.6: Flow Parameters by EGL
• Uses the run-up point and works back to the ocean – Total energy is combined hydrostatic and velocity
components

Section 6.6: Flow Parameters by EGL
Topography Data
Inundation Data from Maps

Section 6.6: Flow Parameters by EGL• Output Graphs
Xsite = 610ft
Zsite = 13.5ft
hsite = 11.7ft
usite = 15ft/s

Section 6.7: Site-Specific Analysis
• Site specific analysis can be used to produce tsunami flow parameters at site
• Site specific analysis required in certain conditions – RC IV buildings with hi > 12ft – Designated vertical evacuation buildings
• Site specific analysis likely done by a specialist using a benchmarked model

Section 6.7: Site-Specific Analysis
• Site specific analysis will give time-step by time-step data for all points of interest

Section 6.7: Site-Specific Analysis
Inundation analysis for Tohoku tsunami (2011) [NOAA]
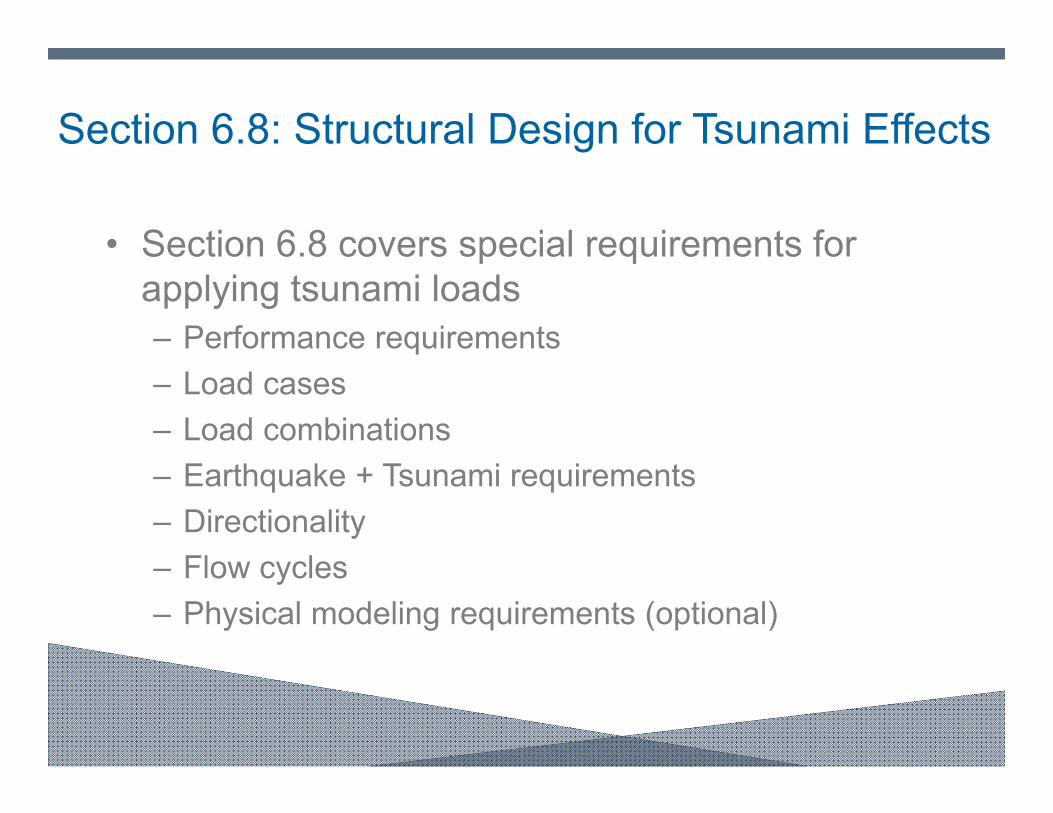
Section 6.8: Structural Design for Tsunami Effects
• Section 6.8 covers special requirements for applying tsunami loads – Performance requirements– Load cases– Load combinations– Earthquake + Tsunami requirements– Directionality – Flow cycles– Physical modeling requirements (optional)
Section 6.8: Structural Design for Tsunami Effects
• EGL provides maximum depth and velocity values for site.
• Maximum depth and velocity do not occur simultaneously
• Three load cases are specified for the designer to check – Load Case 1: Base flow depth* with corresponding
flow velocity(buoyancy and global overturning check)

Section 6.8: Structural Design for Tsunami Effects
• Load cases developed from normalized flow time-histories
Normalized Depth
Normalized Velocity
LC #2: h = 0.66*hmaxv = 1.00*vmax
LC #3: h = 1.00*hmaxv = 0.33*vmax
• Reliability analysis was performed based on ASCE 7 target reliabilities discussed in chapter 2
• From this importance factors were calibrated. – RC II = 1.0– RC III = 1.25– RC IV = 1.25
Section 6.8: Structural Design for Tsunami Effects

Section 6.8: Structural Design for Tsunami Effects
• Load combinations (6.8.3.3)– 0.9D + FTSU + HTSU
– 1.2D + 0.5L + 0.2S + FTSU + HTSU
– FTSU = Tsunami loads & effect for incoming & outgoing flow
– HTSU = load due to tsunami induced lateral foundation pressures in submerged conditions

Section 6.8: Structural Design for Tsunami Effects
• Per 6.8.1 & 6.8.2– RC II & III buildings
• designed to meet collapse prevention under tsunami loads
– RC III (Critical) & RC IV buildings • Designed to meet…. IO above water line, LS below water line• Required operational components above the water line
• LFS acceptance criteria (6.8.3.4)– Simplified performance base design by using 75% of
earthquake base shear capacity

• Tsunami-Specific Condition Requirements
– Minimum Fluid Density –10% density increase accounting for debris-laden seawater
– Flow Amplification – velocity amplification from flow funneling between structures
• Accounted for in EGL analysis
Section 6.8: Structural Design for Tsunami Effects

Section 6.8: Structural Design for Tsunami Effects
• Tsunami-Specific Condition Requirements
– Directionality of Flow – variation of flow shall be considered +/-22.5 degrees
– Minimum Closure Ratio – accounts for the “piling-on” effect of copious tsunami debris

Section 6.8: Structural Design for Tsunami Effects
• Multiple cycles 6.8.8– Engineer required to consider min of 2 flow cycles on
building
• First cycle 80% of MCT• Scour/foundation effects are primary check

Section 6.9: Hydrostatic Loads
• Buoyancy – Accounted for in load case 1 – consider minimum of
• Maximum flow depth• 10ft • Top of 1st story windows (non-blast/impact windows)
• Residual Water trapped on Floors– Bathtub effect on floor slabs
• Unbalanced hydrostatic loads– For large buildings flow takes time to reach backside –
account for unbalanced global force

Section 6.10: Hydrodynamic Loads
• Drag Forces– Overall structure (6.10.2.1)
– Columns (6.10.2.2)
– Walls (6.10.2.3)
12
12
12

Section 6.10: Hydrodynamic Loads
• Drag Forces– Provisions for perforated walls (6.10.2.4)
• Provisions allow for reduced water pressure due to holes• Minimum 60% accounts for damming and increased drag
factors (based on field observations)
– Elements not perpendicular to flow (6.10.2.5)• Reduced loading demands for angled elements
Section 6.10: Hydrodynamic Loads
• Impulsive forces (bores)– 50% increase on drag forces in areas of bore
formation (Fr >1.0)
• Flow stagnation on walls and slabs (6.10.3)– Localized high pressure spots where perpendicular
walls and slabs trap water

Section 6.11 - Debris Impact Loads• Considered Waterborne Debris Loads
– Utility poles/logs– Passenger vehicles– Tumbling boulders and concrete masses– Shipping containers
• Only near ports and harbors
– Large vessels • Risk Category IV • Only near ports & harbors
Section 6.11 - Debris Impact Loads
• Overview of impact load procedures– Determine revenant impacting vessels (6.11)– Alternative simplified impact load (6.11.1)
• Fi = 330*Co*ITSU (kips) [where shipping containers present]• Fi = 165*Co*ITSU (kips) [otherwise]
– Static impact analysis by logs & shipping containers (6.11.2 & 6.11.6)
• Using elastic equation, debris stiffness/mass and flow velocity • Capped at crushing strength of material

Section 6.11 - Debris Impact Loads
• Overview of impact load procedures (cont’d)– Static (prescriptive) impact analysis by boulders and
vehicles (6.11.3/4)– Where required - check extraordinary debris impacts
by vessels (6.11.7)• Accounts for impact of large vessels by requiring progressive
collapse analysis

Section 6.11 - Debris Impact Loads
• Alternative methods (6.11.8)• Dynamic analysis or work-energy approach allowed to
account for inelastic response of structure to reduce loads• Can reduce loads from 20-80% depending on structure
Figure C6.11‐1

Section 6.11 - Debris Impact Loads
• Point source of debris– Shipping container yards– Ports with barges/ships
• Based on Tohoku field reconnaissance
• Approximate probabilistic site assessment procedure based on proximity and quantity of potential floating objects (6.11.5)– Determine if large debris types can reach your site

Section 6.12 - Foundations• Foundation forces considered
– Uplift and under seepage forces (6.12.2.1)– Loss of soil strength (6.12.2.2)– Site erosion (6.12.2.3)– Local Scour (6.12.2.4)– Horizontal slab loads (6.12.2.5)
Section 6.12 - Foundations
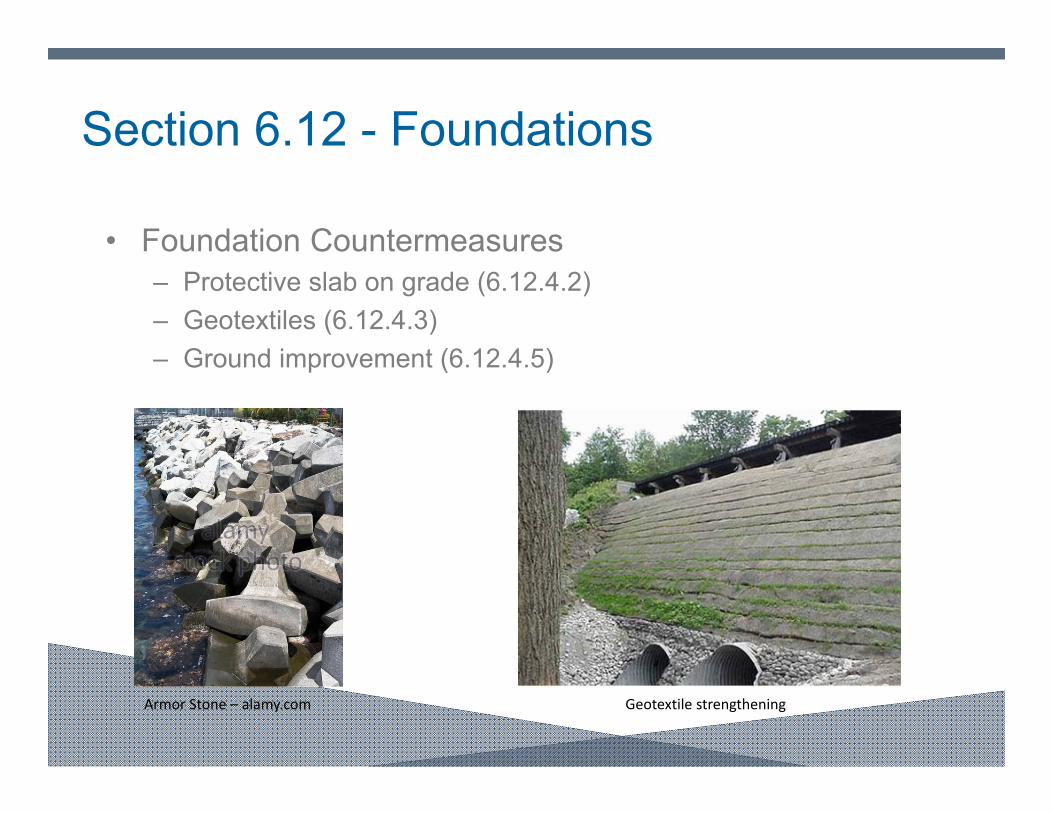
• Foundation Countermeasures – Protective slab on grade (6.12.4.2)– Geotextiles (6.12.4.3)– Ground improvement (6.12.4.5)
Armor Stone – alamy.com Geotextile strengthening

Section 6.13 – Structural Countermeasures
• Use of structural countermeasures are allowed to be used to reduce tsunami loads– Open structure design– Tsunami barriers (seawalls)– Site layout
Tsunami Seawall – 2011 Tohoku Tsunami

Section 6.14 – Tsunami Vertical Evacuation Refuge
• Vertical evacuation refuges are designed as RC IV buildings with some additional requirements
• Evacuation area elevation– Increase flow depth (1.3R + 10ft)

Section 6.14 – Tsunami Vertical Evacuation Refuge
• Additional requirements for design– Site specific analysis always required– Required live load in assembly areas– 100psf – Peer review requirements– Debris impact requirements
• Extraordinary debris impact (Large ships)• Progressive collapse

Section 6.15: Non-structural components
• Requirements for non-structural system protection – Applies to designated systems– Raise above inundation or– Protect with countermeasures (6.13)

Summary/Current Code Status

Current Code Status
• All sections of chapter have passed ASCE 7-16 main committee & public comment
• Maps in process of being digitized for publication on ASCE website (Fall 2016)
• IBC 2018 has approved ASCE 7-16 without modifications to chapter 6

Summary
• Scope– All RC III & IV buildings and ‘tall’ RC II buildings in
tsunami design zone as shown in maps
• Maps based on 2%/50yr (2,475yr) return period
• Design values determined using site specific analysis or energy grade line analysis with mapped values
Summary
• Buildings design for three load cases as defined in section 6.8
• Loads come from hydrostatic (6.9), hydrodynamic (6.10) forces, and debris (6.11) loads
• Foundation requirements in section 6.12

Summary
• Special requirements for vertical evacuation structures
• Non-structural requirements (Sec. 6.15)
