tsunami disaster mitigation research in the … fileinternational symposium on tsunami disaster...
TRANSCRIPT

International Symposium on Tsunami Disaster Mitigation in Future Jan. 17-18, 2005, Kobe, Japan
TSUNAMI DISASTER MITIGATION RESEARCH IN THE UNITED STATES
Michael J. Briggs1, Jose C. Borrero2, and Costas E. Synolakis2
1Coastal and Hydraulics Laboratory, US Army Engineer Research and Development Center
3909 Halls Ferry Rd., CEERD-HN-HH, Vicksburg, MS 39180-6199 USA [email protected]
2Department of Civil and Environmental Engineering, University of Southern California, Los Angeles, CA 90089-2531, USA [email protected], [email protected]
Abstract This paper presents an update of the Corps of Engineers tsunami disaster mitigation research in the United States. Because the U.S. has not had any major tsunami disasters in many years, the Corps does not have a formal mission or policy for incorporating tsunami runup considerations in the design wave height for coastal structures. In the 1990’s the Corps’ Coastal and Hydraulics Laboratory did participate in substantial physical modeling of tsunami runup on beaches, vertical walls, and islands, as part of the National Science Foundation’s Joint Tsunami Runup Study. These data have been extensively published and used by the international tsunami community to provide a better understanding of the physical phenomena and verify numerical models. The University of Southern California has recently been working with the Corps, and other federal and state agencies in California to develop tsunami inundation maps based on farfield and local tectonic and landslide sources. An example using the ports of Los Angeles and Long Beach in southern California is presented to illustrate the significance of these local co-seismic sources.
Keywords: Tsunami runup; Tsunami sources; Physical models; Island; Inundation zones; Southern California
Introduction Prior to 2004, Synolakis (2003) reported that there had been 12 major tsunamis around the Pacific Rim in the last ten years, causing more than 3,000 deaths and $1B in damages. As horrible as these numbers are, they pale in comparison to the mega-tsunami that occurred in the Indian Ocean on December 26, 2004. This disaster will probably go down in history as one of the worst natural disasters and tsunamis on record with over 150,000 people killed or missing, millions homeless, and billions of dollars in damages.
The United States is fortunate in that only five states have a serious risk to tsunami hazards. These are Alaska, California, Hawaii, Oregon, and Washington, all on the Pacific Ocean. Although the East coast of the U.S. could be vulnerable to tsunami attack if there was a volcanic eruption and landslide in the Canary Islands offshore northwest Africa, the probability at 1 in 10,000 years is

Report Documentation Page Form ApprovedOMB No. 0704-0188
Public reporting burden for the collection of information is estimated to average 1 hour per response, including the time for reviewing instructions, searching existing data sources, gathering andmaintaining the data needed, and completing and reviewing the collection of information. Send comments regarding this burden estimate or any other aspect of this collection of information,including suggestions for reducing this burden, to Washington Headquarters Services, Directorate for Information Operations and Reports, 1215 Jefferson Davis Highway, Suite 1204, ArlingtonVA 22202-4302. Respondents should be aware that notwithstanding any other provision of law, no person shall be subject to a penalty for failing to comply with a collection of information if itdoes not display a currently valid OMB control number.
1. REPORT DATE JAN 2005 2. REPORT TYPE
3. DATES COVERED 17-01-2005 to 18-01-2005
4. TITLE AND SUBTITLE Tsunami Disaster Mitigation Research in the Uinted States
5a. CONTRACT NUMBER
5b. GRANT NUMBER
5c. PROGRAM ELEMENT NUMBER
6. AUTHOR(S) 5d. PROJECT NUMBER
5e. TASK NUMBER
5f. WORK UNIT NUMBER
7. PERFORMING ORGANIZATION NAME(S) AND ADDRESS(ES) Army Engineer Research and Development Center,Coastal andHydraulics Laboratory,3909 Halls Ferry Road,Vicksburg,MS,39180
8. PERFORMING ORGANIZATIONREPORT NUMBER
9. SPONSORING/MONITORING AGENCY NAME(S) AND ADDRESS(ES) 10. SPONSOR/MONITOR’S ACRONYM(S)
11. SPONSOR/MONITOR’S REPORT NUMBER(S)
12. DISTRIBUTION/AVAILABILITY STATEMENT Approved for public release; distribution unlimited
13. SUPPLEMENTARY NOTES The original document contains color images.
14. ABSTRACT
15. SUBJECT TERMS
16. SECURITY CLASSIFICATION OF: 17. LIMITATION OF ABSTRACT
18. NUMBEROF PAGES
14
19a. NAME OFRESPONSIBLE PERSON
a. REPORT unclassified
b. ABSTRACT unclassified
c. THIS PAGE unclassified
Standard Form 298 (Rev. 8-98) Prescribed by ANSI Std Z39-18
International Symposium on Tsunami Disaster Mitigation in Future Jan. 17-18, 2005, Kobe, Japan
extremely unlikely. Also, the Puerto Rico trench continues to be an active seismic region that could pose a near-field hazard to Puerto Rico and the Leeward Islands. Within the last century, the Chilean Earthquake of 1960 and the Alaska Earthquake of 1964 produced tsunamis that were the most devastating to the U.S.
Historically, most civil defense planners have been worried about far-field tsunamis caused by tectonic events or earthquakes on the ocean floor. The sudden movement and shaking of the earth’s plates as they react with one another produces tsunami waves on the oceans surface that travel great distances across the ocean to distant coastlines. Although volcanic eruptions and asteroids can trigger tsunamis, these are far less likely. Recent research indicates that many tsunamis can be generated from co-seismic landslides, triggered by the violent shaking of the Earth’s crust.
In the U.S., concern has recently focused not only on the landslide-generated tsunami, but also on potential near-field or local tectonic sources. Both of these tsunami scenarios have the characteristic of far less travel time (and reduced warning time for evacuation) from the generation area of the tsunami to Pacific Ocean coastlines along the U.S. In particular, landslide and slump sources in the Santa Barbara Channel and Palos Verdes area offshore southern California, and near-field faults in the Cascadia Subduction Zone, 50 miles offshore the Pacific Northwest coast, and the San Clemente Fault, southwest of Los Angeles, have received increasing attention.
Because the United States has not had any major tsunami disasters in recent years, the Army Corps of Engineers does not currently have a formal policy for incorporating tsunami runup considerations in the design wave height for coastal structures. Coastal structures (i.e., jetties, breakwaters, and vertical walls) are designed for water levels and wave heights based on historical or numerically-hindcast storms. Wave forces and loads, although defined in the Coastal Engineering Manual (CEM), are not specifically calculated for tsunamis. Structural designs are pretty much the same as for storm surge, e.g., place buildings on piles, allow wash through of ground floors, etc. The breakwaters, flood walls, and gates, typical in Japan for tsunami protection, are not used in the U.S.
The main emphasis within the Corps is mitigation, or flood zone planning. Warning systems and tsunami arrival time and height predictions are done by the Pacific Marine Environmental Laboratory (PMEL) of the National Oceanographic and Atmospheric Administration (NOAA). The Corps cooperates with other Federal, state, and local agencies such as the Federal Emergency Management Agency (FEMA), Civil Defense, coastal zone management commissions, and Office of Emergency Services (OES) organizations. The University of Southern California (USC) has begun preparing tsunami wave inundation maps for the U.S. Pacific coastline.
The Coastal and Hydraulics Laboratory (CHL) of the U.S. Army Engineer Research and Development Center (ERDC) does not currently have a mission in tsunami research. Previous CHL research in the 1970’s and 1980’s included over 27 publications documenting physical, numerical, and analytical modeling of far-field tsunami hazards in the Pacific Ocean. Oswalt and Boyd (1966) conducted a physical model of Hilo Harbor, HI, to evaluate steady flow stability for a tsunami barrier. Senter (1971) conducted a laboratory study of the effect of tsunami waves on the proposed Crescent City, CA, Harbor design. Houston et al. (1977) calculated wave frequency of occurrence tables for the Hawaiian Islands. Houston (1978) simulated the 1960 Chilean and 1964 Alaskan tsunami interactions with the Hawaiian Islands and found remarkable agreement with all tide gages in the islands. Camfield (1980) prepared a general manual on tsunami engineering. Houston (1980, 1985) made tsunami flood level predictions for American Samoa. Farrar and Houston (1982) calculated the response of Barbers Point Harbor, HI, to tsunami waves. Finally, Crawford (1987) prepared tsunami predictions for Kodiak Island to Ketchikan in Alaska.
In the 1990’s, the CHL was one of five PI’s investigating the important physical parameters involved in 3D tsunami runup that was funded by the National Science Foundation (NSF). In 2003, the NSF funded the Network for Earthquake Engineering Simulation (NEES) for earthquake and tsunami research in the academic community. Oregon State University (OSU) is the primary engineering school in the U.S. selected for tsunami research. Details of the OSU facility will be presented by others during this symposium.
In this paper, past laboratory experiments in tsunami runup at the CHL, current tsunami research capabilities at CHL, and recent research on inundation maps for the U.S. are presented.

International Symposium on Tsunami Disaster Mitigation in Future Jan. 17-18, 2005, Kobe, Japan
Joint Tsunami Runup Study The National Science Foundation (NSF) funded a study beginning in FY92 to identify important physical parameters involved in 3D tsunami runup. This joint research study included principal investigators: Dr. Philip Liu, Cornell University, Dr. George Carrier, Harvard University, Dr. Harry Yeh, University of Washington, Dr. Costas Synolakis, USC, and Dr. Michael Briggs, CHL. An international advisory committee met with the principal investigators once a year and included Drs. Howell Peregrine, University of Bristol, Fred Raichlen, Caltech, Nobu Shuto, Tohuku University, and Robert Street, Stanford University.
Over the course of this study, several CHL flumes and basins were used to conduct four physical models of a plane beach, vertical wall, and a circular island. Three conference and six journal papers were authored or co-authored by CHL during the course of this study in national and international publications. Two benchmark problems on the circular island and vertical wall were featured in the International Workshop on Long Wave Runup Models (1996) that was attended by 55 international scientists. Fujima et al. (2000) used the circular island data to verify their analytical solutions for the propagation of tsunamis and the distribution of maximum runup heights around the island. Plane beach The first series of experiments was conducted in both a flume and a basin to study tsunami wave evolution, uniformity, runup, and wave kinematics over a plane 1 on 30 beach. These data were designed to produce high-quality laboratory data with physically relevant idealized tsunami conditions for validating numerical models. Additional details can be found in Briggs et al. (1993, 1995a and b).
The flume data provided some small-scale comparisons to the larger-scale basin results and information on velocities in the runup plume. Figure 1a is a schematic of the 42.4-m-long, glass-walled flume used in the 2D flume study. The flat area in front of the toe of the 1 vertical on 30 horizontal sloping beach was located 21 m from the wavemaker. Water depth in the constant depth region was 32 cm. Tsunami waves were simulated as solitary waves using a vertical hydraulic piston. The 10 wave conditions ranged from nondimensional wave heights H=H/d =0.01 to 0.50. Ten capacitance wave gages were used to measure surface wave elevations along the length of the flume. The first gage was located 15 m from the wavemaker to measure incident wave conditions. Gages 2 to 10 formed a cross-shore transect in the center of the flume. A two-component laser Doppler velocimeter (LDV) system was used to measure two orthogonal components of fluid velocity in the plane of the flow. The LDV system was mounted outside the flume with four laser beams focused at a point approximately 9 cm from the inside face of the glass flume wall.
A complementary experiment was conducted in a large-scale, 30-m-wide by 25-m-long wave basin. The fixed-bed model included a flat section and a 1:30 sloping beach with plane parallel contours (Figure 1b). The offshore water depth in the undisturbed, constant depth region of the model was again 32 cm. The toe of the slope was located 12.4 m in front of the wavemaker. A directional spectral wave generator (DSWG) was used to generate solitary waves. The electronically controlled DSWG was 27.4-m-long and consisted of 60 paddles, 46-cm wide and 76-cm high. Eight target wave heights from H=0.01 to 0.20 were simulated. All waves were non-breaking until final stages of transformation near the shoreline (where gentle spilling occurred), except for H=0.20 waves which broke nearshore. Thirty capacitance wave gages were used to measure surface wave elevations. The first three gages were located at X=3, 6, and 9 m along the centerline in the constant depth region to measure incident wave conditions. Twenty-seven gages were positioned in three cross-shore transects in an 8-m by 6-m measurement area between the toe of the slope and the SWL to measure wave evolution.
Changes in runup magnitude and in the shape of the runup tongue were investigated for selected cases in the basin by varying the number of paddles used in each experiment and the eccentricity of the source. The maximum vertical runup along the sloping beach was measured at each grid line above the SWL.
Breaking occurred in both the flume and the basin near the shoreline for measured H > 0.04. Normalized maximum vertical runup was plotted versus normalized wave height. Two distinct runup regimes for breaking and non-breaking waves were found in accordance with earlier work of Synolakis (1987).

International Symposium on Tsunami Disaster Mitigation in Future Jan. 17-18, 2005, Kobe, Japan
Figure 1: Physical models of tsunami runup on plane beaches (a) flume and (b) basin.

International Symposium on Tsunami Disaster Mitigation in Future Jan. 17-18, 2005, Kobe, Japan
From the flume results, normalized maximum vertical runup was plotted versus an energy-based parameter using peak runup velocity. It suggests that a linear relationship can be used to predict runup for a known horizontal runup velocity and that friction losses amount to 20 percent of the total energy during runup.
Runup heights measured in the longshore direction along the beach showed very good uniformity for different source lengths (i.e., DSWG lengths). The effect of eccentricity of the source on runup was studied by varying the offset of the source from the measurement points on the beach. Runup values were largest directly opposite the center of the source and decreased linearly with longshore distance due to diffraction. Runup showed a strong linear trend with source length, increasing as the source length increased. The final results from the plane beach experiments illustrate the evolution of maximum amplitude with cross-shore distance in the basin. Test results show that dimensionless wave height increases as source length increases and water depth decreases, in agreement with earlier findings of Synolakis (1991) relative to Green's Law. This is probably the first instance where it has been proven that this evolution law is valid for 3D waves. Vertical wall The second set of experiments included a flume study of tsunami runup on a vertical wall to study the effect of compound bathymetry on this highly nonlinear phenomenon (Briggs et al. 1996b). The compound-slope, fixed-bed bathymetry consisted of three different slopes (1:53, 1:150, and 1:13) and a flat section in the deep end. Figure 2a is a schematic of the flume setup and 2b is a photograph of Drs. Synolakis and Briggs observing the runup. The vertical wall was located at the landward end of the 1:13 slope. The water depth in the flat section of the flume measured 21.8 cm.
Ten capacitance wave gages were used to measure surface wave elevations along the centerline of the flume. Three target wave heights H=0.05, 0.30, and 0.70 were simulated for Cases A, B, and C, respectively. When the waves reached the vertical wall, a plume of water would shoot upward. Wave breaking occurred for Cases B and C only. For Case B the wave broke at or near the wall. For Case C the wave broke between gages 7 and 8 (i.e. in front of the toe between the 1:13 and 1:150 slopes) before re-forming and shoaling to the vertical wall. The largest runup at each depth was recorded for Case B, which experienced wave breaking only at or near the wall. Circular island The third series of experiments involved a physical model of a circular island (Briggs et al. 1994, 1995b, 1996a, and Liu et al. 1995). This study was motivated by the 1992 tsunami off Flores Island, Indonesia, which killed nearly 2,500 people (Yeh, et al. 1994). Reflections off Flores Island may have been partially responsible for the tsunami waves that completely destroyed two villages on the adjacent Babi Island, in sheltered areas on the lee side of the island. Because Babi Island is nearly circular in shape, a laboratory experiment was deemed necessary to better understand the complex physics involved in why the tsunami wave split in two and traveled around both sides of the island before reforming on the lee side and producing the unexpected destruction.
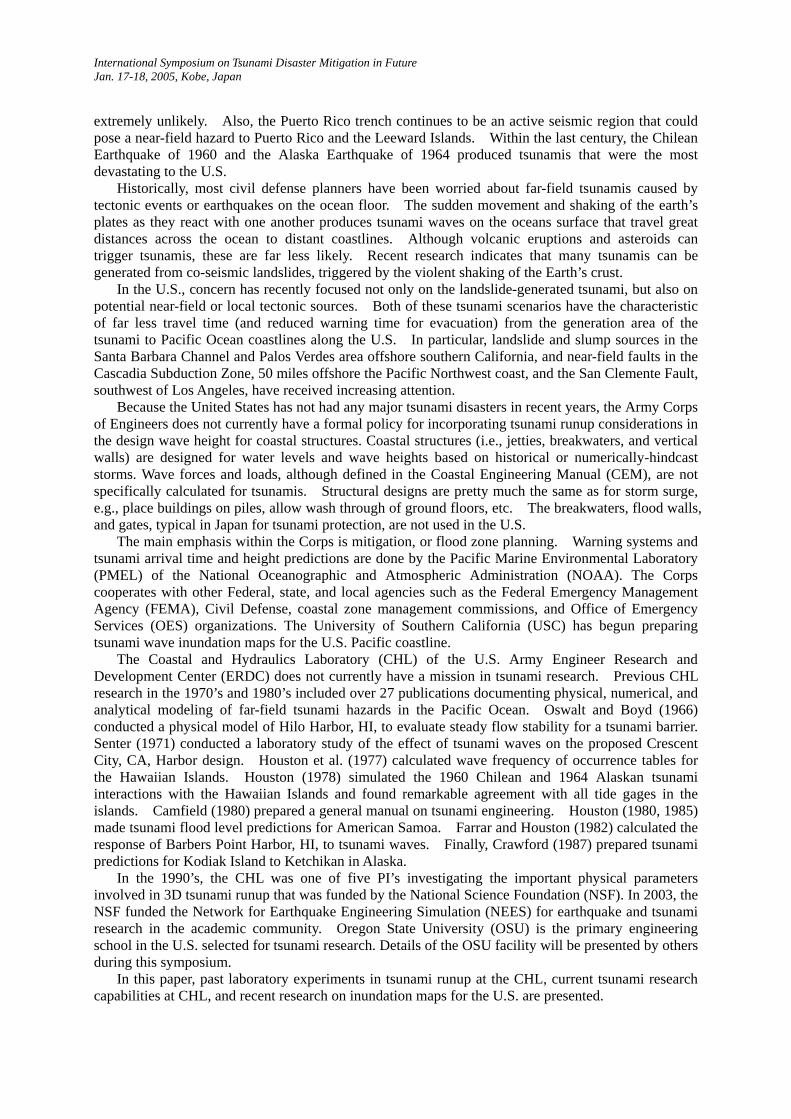
The model island was constructed in the center of a 30-m-wide by 25-m-long flat-bottom basin (Figures 3a and 3b). The island had the shape of a truncated, right circular cone with diameters of 7.2 m at the toe and 2.2 m at the crest. The vertical height of the island was approximately 62.5 cm, with 1 vertical on 4 horizontal beach face. The water depth was set at 32 cm in the basin. Twenty-seven capacitance wave gages were used to measure surface wave elevations. The first four gages were located parallel to the wavemaker to measure incident wave conditions. A measurement grid of six concentric circles covered the island to a distance 2.5 m beyond the toe. Measurement points were located at the intersection of these concentric circles and the 90-deg radial lines. The spacing between grid points was a function of the water depth.
The DSWG was used to generate solitary waves. The full length of the DSWG was used to generate three solitary wave cases. Target normalized wave heights of H=0.05, 0.10, and 0.20 were simulated for Cases A, B, and C, respectively. All waves were non-breaking until final stages of transformation near the shoreline (where gentle spilling occurred) except for the Case C wave, which broke nearshore.
Maximum vertical runup was measured at twenty locations around the perimeter of the island. Sixteen locations were evenly spaced every 22.5 deg around the perimeter. Four radial transects with

International Symposium on Tsunami Disaster Mitigation in Future Jan. 17-18, 2005, Kobe, Japan
Figure 2: Tsunami wave runup on a vertical wall (a) schematic of flume (b) measuring wave. runup
International Symposium on Tsunami Disaster Mitigation in Future Jan. 17-18, 2005, Kobe, Japan
Figure 3: Tsunami wave runup on circular island (a) basin schematic (b) wave profile on lee side ofisland.

International Symposium on Tsunami Disaster Mitigation in Future Jan. 17-18, 2005, Kobe, Japan
uneven spacing were located on the backside of the island (i.e. 90 deg) to improve the resolution in this critical area. Changes in runup shape and magnitude were investigated by varying the water depth, wave height, source length (number of modules), and eccentricity of the source. Figure 4 is a polar plot (4a) and overhead photograph (4b) of maximum vertical runup around the island for Case C. Waves approach the island from the bottom or 270 deg. The island crest, waterline, and toe are shown for reference. Two runs are overlain, demonstrating excellent repeatability.
The runup on the backside is almost as large as that on the front side of the island. Refraction and diffraction cause the wave to bend around the island as edge waves. Because the island and source were symmetric, the wave wraps evenly around the island and produces relatively large runup on the backside. This is a very interesting phenomenon since most people would feel "safe" on the backside of an island.
Corps Tsunami Disaster Mitigation and Research Facilities The ERDC’s TeleEngineering Operations Center (TEOC) has been asked to locate the extent of damage to the existing infrastructure from the 2004 Asia Tsunami in the affected countries. The initial areas of concern are the roads and bridges in Indonesia, Sri Lanka, and Thailand. This information will be used in support of the humanitarian relief efforts to deliver food and supplies to the devastated areas. Thus, predictions, satellite imagery, and measurements of tsunami wave heights are being used to estimate inundation on topographic maps so that routes can be most efficiently planned for disaster relief. The CHL has many physical modeling facilities that can be used for tsunami disaster mitigation research including 7 flumes, 2 stability basins, 5 harbor basin models, and the multidirectional DSWG. Wavemakers in the flumes and basins are either piston- or plunger-type, with a wave height capability of 7 cm to 60 cm. One of CHL’s most unique models is the three-dimensional model (Figure 5) of the ports of Los Angeles and Long Beach (LALB). It is probably the largest operating physical model in the world, covering an area of 655 sq km in the prototype, from San Pedro Bay out to the 92- m contour and shoreline from 3.2 km northwest of Point Fermin to Huntington Beach, CA. It is a distorted scale model, with a prototype scale of 1:100 in the vertical and 1:400 in the horizontal.
In FY00, the CHL replaced its existing DSWG with a new state-of-the-art multidirectional wavemaker (Briggs 2001). The new DSWG was designed and built by MTS Systems Corporation, Minneapolis, MN. It is 27.4-m long and consists of 60 paddles, each 46-cm wide and 1 m high (Figure 6). Each paddle is driven at the joints by an electrical motor in piston mode, producing very smooth and clean model waves. The stroke of �36 cm generates wave heights up to 30 cm in 60 cm water depths. Angles between paddles can be continuously varied using the "snake principle" to produce waves at angles approaching �85 deg. The DSWG is composed of 4 modules that enhance portability, and has PC-based control, calibration, data acquisition, and analysis systems. Passive wave absorber frames around the basin perimeter and active wave absorption on the DSWG reduce reflections from model structures and basin walls. Two hydraulic gates facilitate model construction and access. Tsunami Inundation Maps for California Inundation maps are depictions of coastal areas that identify regions, populations, and facilities that are at risk from tsunami attack. They are used by emergency planners for disaster response and mitigation. Inundation maps require an assessment of local and far-field geologic hazards, and the calculation of coastal flooding. The first set of maps for California posed a unique challenge since (a) it has a short historical record of tsunamis, (b) very little information on offshore faults or landslide and slump scars, (c) historical records based mostly on far-field and pre-1980’s technology, (d) near-field tsunamis have short arrival times, and (e) its high population density.
Houston and Garcia (1974, 1978) and Houston (1974,1980) used a combination of finite difference and finite element models to predict tsunami inundation on the west coast of U.S. and Hawaii. The 1960 Chilean and 1964 Alaska earthquakes were used to define the source characteristics. They calculated 100-year and 500-year tsunami runup heights. Borrero (2002) and Synolakis et al. (2002)

International Symposium on Tsunami Disaster Mitigation in Future Jan. 17-18, 2005, Kobe, Japan
Figure 4: Maximum vertical runup around island for case C (a) laboratory measurements (b) overheadview.

International Symposium on Tsunami Disaster Mitigation in Future Jan. 17-18, 2005, Kobe, Japan
Figure 5: Distorted model of Ports of Los Angeles and Long Beach, CA
Figure 6: New Directional spectral wave generator (DSWG) with passive wave absorber framesaround basin perimeter.

International Symposium on Tsunami Disaster Mitigation in Future Jan. 17-18, 2005, Kobe, Japan
determined after re-analysis that the 100-year data from far-field events is probably still adequate, but that the 500-year data is more dominated by local tectonic or offshore landslide events..
In 1996, the U.S. National Tsunami Hazard Mitigation Program (NTHMP) was established to provide resources for mitigating tsunami hazards, including inundation maps for the five states on the Pacific Ocean. In 1998, the Tsunami Research Program at USC was funded to prepare the first generation of inundation maps for California based on realistic worst-case scenarios. The mapping priority for the state was based on population densities with Santa Barbara and San Francisco in year 1, Los Angeles and San Diego in year 2, and Monterrey Bay in the final year. Offshore faults and landslide-prone areas were identified, initial tsunami waves developed, and inundation heights and penetration distances along target coastlines predicted using the propagation and runup model MOST (Method Of Splitting Tsunami) of Titov and Gonzalez (1997). These inundation maps represent maximum penetration from relocating worst-case scenario events along the coast, rather than any particular event or characteristic earthquake (Synolakis et al. 2002).
For southern California, recent work has focused on nearshore tectonic sources created by restraining bends in offshore strike slip faults (Legg et al. 2004, Borrero et al., 2004). Where strike slip faults have curved traces, stresses created during earthquakes can result in tsunamigenic vertical deformation of the sea floor. Figure 7 shows three such restraining bends offshore of southern California, The Catalina Fault (CAT), Lasuen Knoll (LAS) and The San Mateo Thrust Fault (SAM).
Modeling the tsunamis generated by these events results in tsunami runup heights between 2 and 5 m along the coast of Southern California. The modeling also shows that the shallow San Pedro Shelf offshore of the Posts of Los Angeles and Long Beach acts to amplify tsunami waves while retarding their arrival time. Scenarios modeled by Borrero et al. (2004) suggest that there may be as much as 15 minutes delay in tsunami wave arrival into the Port areas from local sources. This time lag suggests the possibility of a local warning system for the Ports that could suspend cargo handling or oil transfer activities in the event of a large local earthquake.
The ports of LALB are the busiest in the U.S. and are located on the San Pedro Bay, adjacent to the Palos Verdes (PV) Peninsula (Figure 7). In addition to the tectonic sources mentioned above, landslide scars and deposits have been observed and described in this region since the 1950’s (McCulloch et al. 1985). One feature in particular, the Palos Verdes Debris Avalanche, is believed to be the signature of a tsunamigenic submarine landslide. Although most of the extreme runup is located around the PV cliffs, there is significant impact in the LALB, with projected losses of $4.5B (Borrero et al. 2002). The broad San Pedro Shelf, although retarding tsunami arrival times, contributes to tsunami wave focusing. Disruption of operations at the LALB port facilities due to tsunami attack could severely impact the regional, national, and even global economies.
Currently the inundation mapping effort is focusing on nearshore and distant sources for the northern part of the State and revised inundation maps for that area are expected to be completed in 2005. Conclusions This paper has described the current state of the Corps of Engineers tsunami disaster mitigation and research in the United States. Because the U.S. has not had any major tsunami disasters in recent years, the Corps does not have a formal mission or policy for incorporating tsunami runup considerations in the design wave height for coastal structures. In the 1990’s the Corps’ Coastal and Hydraulics Laboratory did participate in substantial physical modeling of tsunami runup on beaches, vertical walls, and islands, as part of the National Science Foundation’s Joint Tsunami Runup Study. Flume and basin facilities, including a newer version of the DSWG used in the NSF study, are available for future tsunami research at the CHL. The University of Southern California (USC) has recently developed tsunami inundation maps for California based on far field and local tectonic and landslide sources. An example using the ports of Los Angeles and Long Beach in southern California was presented showing the potential for $4.5B in damages and disruption of port operations that could significantly impact national and global economies.

International Symposium on Tsunami Disaster Mitigation in Future Jan. 17-18, 2005, Kobe, Japan
Figure 7: Tsunami source regions and historical earthquakes offshore Southern California. TheCatalina Fault (CAT), Lasuen Knoll (LAS) and the San Mateo Thrust (SAM) are examples oftsunamigenic restraining bends while the Palos Verdes Slide (PVS) is an example of a tsunamigeniclandslide. San Pedro Bay is location of Ports of Los Angeles and Long Beach.
Acknowledgments The authors wish to acknowledge the Office, Chief of Engineers, U.S. Army Corps of Engineers, California State Office of Emergency Services, and the National Science Foundation for authorizing publication of this paper. It was prepared as part of The United States-Japan Cooperative Program on Natural Resources (UJNR), US-Side Panel On Wind And Seismic Effects, Task Committee on Storm and Tsunami Surge. Special thanks to Fred Camfield, Stan Boc, and Tom Smith. References Borrero, J. C., Dolan, J. F., and Synolakis, C. E. (2001): “Tsunamis within the eastern Santa Barbara Channel,” Geophys Res Lett, 28, 643-646. Borrero, J.C. (2002): “Tsunami hazards in Southern California,” Ph.D. Thesis, University of Southern California, Los Angeles, CA, 306 pp. Borrero, J.C., Yalciner, A.C., Kanoglu, U., Titov, V., McCarthy, D, and Synolakis, C.E. (2003): “Producing tsunami inundation maps: The California experience,” Submarine Landslide and Tsunamis, Kluwer Academic Publishers, The Netherlands, 315-326. Borrero, J.C., Legg, M.R., and Synolakis, C.E., (2004): “Nearshore tsunami sources in Southern California,” Geophys Res Lett, 31, July.

International Symposium on Tsunami Disaster Mitigation in Future Jan. 17-18, 2005, Kobe, Japan
Briggs, M. J., Synolakis, C. E. and Hughes, S. A. (1993): “Laboratory measurements of tsunami run-up,” International Tsunami '93 Symposium, Wakayama, JAPAN, Aug. Briggs, M. J., Synolakis, C. E., and Harkins, G. S. (1994): “Tsunami runup on a conical island,” IAHR International Symposium on Waves - Physical and Numerical Modeling, Vancouver, BC, Canada, 21-24 Aug. Briggs, M. J., Synolakis, C. E., Harkins, G. S. and Hughes, S. A. (1995): “Large scale laboratory measurements of tsunami inundation,” Recent Developments in Tsunami Research in the Series of Advances in Natural and Technological Hazards Research, Kluwer Academic Publishers, M. I. El-Sabh, Editor, Jul. Briggs, M. J., Synolakis, C. E., Harkins, G. S., and Green, D. R. (1995): “Laboratory experiments of tsunami runup on a circular island,” Pure and Applied Geophysics (PAGEOPH), Aug. Briggs, M. J., Synolakis, C.E., Harkins, G., and Green, D.R. (1996): “Benchmark Problem #2: Runup of solitary waves on a circular island, long-wave runup models,” International Workshop on Long Wave Modeling of Tsunami Runup, Friday Harbor, San Juan Island, WA, September 12-16,1995. Briggs, M. J., Synolakis, C.E., Kanoglu, U., and Green, D.R. (1996): “Benchmark Problem #3: Runup of solitary waves on a vertical wall, long-wave runup models,” International Workshop on Long Wave Modeling of Tsunami Runup, Friday Harbor, San Juan Island, WA, September 12-16,1995. Briggs, M. J. (1999): “Recent studies on tsunami runup at WES,” Journal of Shore and Beach, Vol. 67, No. 1, January, pp 34-40. Briggs, M.J. (2001): “A new multidirectional wavemaker for shallow water basins”, Waves ’01 Conference, San Francisco, CA. Camfield, F.E. (1980): “Tsunami engineering,” Coastal Engineering Research Center, Ft. Belvoir, VA, 220pp. Crawford, P.L. (1987): “Tsunami predictions for the coast of Alaska, Kodiak to Ketchikan,” Waterways Experiment Station, Technical Report CERC-87-7, Vicksburg, MS, 133pp. Farrar, P.D. and Houston, J.R. (1982): “Tsunami response of Barbers Point Harbor, Hawaii,” WES Miscellaneous Paper HL-82-1, October. Fujima, K., Briggs, M.J., and Yuliadi, D. (2000): “Runup of tsunamis with transient wave profiles incident on a conical island,” Coastal Engineering Journal, V 42, 2, 175-195. Houston, J.R., and Garcia, A.W. (1974): “Type-16 flood insurance study, tsunami predictions for Southern California,” Waterways Experiment Station, Technical Report H-74-3, Vicksburg, MS. Houston, J.R. (1974): “Tsunami predictions for Southern California coastal communities, USA,” Proceedings, IUGG Tsunami Symposium, Wellington, New Zealand, 1974. Houston, J.R., Carver, R.D., and Markle, D.G. (1977): “Tsunami-wave elevation frequency of occurrence for the Hawaiian Islands,” WES Technical Report No. H-77-16, August. Houston, J.R. and Garcia, A.W. (1978): “Type-16 flood insurance study: tsunami predictions for the west coast of the continental United States,” Waterways Experiment Station, Technical Report H-78-26, Vicksburg, MS.

International Symposium on Tsunami Disaster Mitigation in Future Jan. 17-18, 2005, Kobe, Japan
Houston, J. R. (1978): “Interaction of tsunamis with the Hawaiian Islands calculated by a finite element numerical model,” Journal of Physical Oceanography, 8, 1, 93-102, January. Houston, J. R. (1980): “Tsunami elevation predictions for American Samoa,” WES Technical Report No. HL-80-16, September. Houston, J. R. (1980): “Type-19 flood insurance study, tsunami predictions for Southern California,” Waterways Experiment Station, Technical Report HL-80-18, Vicksburg, MS, 172 pp. Houston, J. R. (1985): “Tsunami flood level predictions for American Samoa,” International Journal of the Tsunami Society, 3,1, pp. 53-61. Legg, M.R., Borrero, J.C., and Synolakis, C.E. (2004): “Tsunami hazards from the Catalina Fault offshore Southern California,” Earthquake Spectra, 20, 3, pp. 917-950, August. Liu, P. L.-F., Cho, Y.-S., Briggs, M. J. and Synolakis, C. E. (1995): “Runup of solitary waves on a circular island,” Journal of Fluid Mechanics, 302, Nov. 259-285 McCulloch, D. S. (1985): “Evaluating tsunami potential,” in: Evaluating Earthquake Hazards in the Los Angeles Region-An Earth Science Perspective, USGS Prof. Paper 1360, 375-413. Oswalt, N.R. and Boyd, M.B. (1966): “ Steady-flow stability tests of navigation opening structures, Hilo Harbor tsunami barrier, Hilo, Hawaii,” Waterways Experiment Station, Technical Report No. 2-742, Vicksburg, MS. Senter, P.K. (1971): “Design of proposed Crescent City Harbor, California, tsunami model: hydraulic model investigation,” Waterways Experiment Station, Technical Report H-71-2, Vicksburg, MS, 33pp. Synolakis, C.E. (1987): “Runup of solitary waves,” JFM, 185, 523-545. Synolakis, C.E. (1991): “Tsunami runup on steep slopes: How good linear theory really is,” Natural Hazards, 4, 221-234. Synolakis, C.E., Bardet, J-P., Borrero, J.C., Davies, H.L., Okal, E.A., Silver, E.A., Sweet, S., and Tappin, D.R. (2002): “The slump origin of the 1998 Papua New Guinea Tsunami,” Proc. R. Soc. London, A 458, 763-789. Synolakis, C.E. (2003): “Tsunami and Seiche,” in Earthquake Engineering Handbook, edited by Chen, W–F and Scawthorn, C., CRC Press, 9–1-9–90. Titov, V., and Gonzalez, F. (1997): “Implementation and testing of the method of splitting tsunami (MOST) model,” NOAA Technical Memorandum ERL PMEL-112. Yeh, H., Liu, P. L.-F., Briggs, M. J. and Synolakis, C. E. (1994): “Propagation and amplification of tsunamis at coastal boundaries,” Nature Magazine, Nov.