tsunami risk facing new zealand · nzier report – tsunami risk facing new zealand 1 key points...
TRANSCRIPT
Tsunami risk facing New Zealand NZIER report to the Earthquake Commission
August 2015

L13 Grant Thornton House, 215 Lambton Quay | PO Box 3479, Wellington 6140 Tel +64 4 472 1880 | [email protected]
© NZ Institute of Economic Research (Inc.) 2012. Cover image © Dreamstime.com NZIER’s standard terms of engagement for contract research can be found at www.nzier.org.nz.
While NZIER will use all reasonable endeavours in undertaking contract research and producing reports to ensure the
information is as accurate as practicable, the Institute, its contributors, employees, and Board shall not be liable (whether in
contract, tort (including negligence), equity or on any other basis) for any loss or damage sustained by any person relying on
such work whatever the cause of such loss or damage.
About NZIER
NZIER is a specialist consulting firm that uses applied economic research and analysis to provide a wide range of strategic advice to clients in the public and private sectors, throughout New Zealand and Australia, and further afield.
NZIER is also known for its long-established Quarterly Survey of Business Opinion and Quarterly Predictions.
Our aim is to be the premier centre of applied economic research in New Zealand. We pride ourselves on our reputation for independence and delivering quality analysis in the right form, and at the right time, for our clients. We ensure quality through teamwork on individual projects, critical review at internal seminars, and by peer review at various stages through a project by a senior staff member otherwise not involved in the project.
Each year NZIER devotes resources to undertake and make freely available economic research and thinking aimed at promoting a better understanding of New Zealand’s important economic challenges.
NZIER was established in 1958.
Authorship This paper was prepared at NZIER by Derek Gill, with input from Peter Clough and Terry Webb.
It was quality approved at NZIER by John Yeabsley, and an external review of the main findings was provided by Dr. Laura Kong, Director of the International Tsunami Information Centre.
We are extremely grateful for the work of the GNS Science team that modelled New Zealand’s tsunami risk and the input from workshop participants, whose expert judgement was used to assess the mitigation options in this report. Any responsibility for errors and omissions remains with NZIER.
NZIER report – Tsunami risk facing New Zealand i
Contents Key points 1
What was the task? ................................................................................................ 1
How big is the tsunami risk facing New Zealand? .................................................. 2
Is there much opportunity to reduce New Zealand’s tsunami risk? ...................... 2
How do tsunami risks compare to other domains? ............................................... 3
What are the options for mitigating those risks to tolerable levels? .................... 5
What does this study suggest for Investment in GeoNet? .................................... 6
1. Introduction ........................................................................................................... 7
2. The tsunami risk facing New Zealand .................................................................... 9
How big is the tsunami risk facing New Zealand? .................................................. 9
Is there much opportunity to reduce New Zealand’s tsunami risk? .................... 12
How do tsunami risks compare to other domains? ............................................. 14
3. Tsunami risk mitigation options ........................................................................... 16
What are the broad strategies for mitigating tsunami risk? ................................ 17
What are the options for mitigating tsunami risks to tolerable levels? .............. 21
What impact could these options have on outcomes? ....................................... 25
4. Conclusion ............................................................................................................ 27
What does this study suggest for investment in GeoNet? .................................. 28
What are the next steps? ..................................................................................... 28
Figures
Figure 1 Tsunami risk comparison ............................................................................................... 4 Figure 2 Tsunami risk comparison ............................................................................................. 14 Figure 3 Tsunami event management value chain .................................................................... 18 Figure 4 Types of strategies to mitigate tsunami risk ................................................................ 18 Figure 5 Mitigation interventions ranked by impact and cost................................................... 22 Figure 6 Mapping interventions to outcomes ........................................................................... 25
Tables
Table 1 The risk from a 1/500 year tsunami event ...................................................................... 2 Table 2 The opportunity for mitigating the risks ......................................................................... 3 Table 3 Public spending on tsunami and other risks compared .................................................. 4 Table 4 The risk from a 1/500 year tsunami event ...................................................................... 9 Table 5 Annualised Individual Fatality Risk by location ............................................................. 11 Table 6 Tolerability of risk levels ............................................................................................... 11 Table 7 The opportunity for mitigating the risks ....................................................................... 13 Table 8 Annual Individual Fatality Risk for two evacuation rate assumptions .......................... 13 Table 9 Public spending on tsunami and other risks compared ................................................ 15
NZIER report – Tsunami risk facing New Zealand 1
Key points
What was the task?
This report provides a public policy analysis of New Zealand’s tsunami risk.
In response to the 2013 GeoNet Project Panel’s review report, NZIER has undertaken a piece of scoping policy analysis which focuses on whether New Zealand has adequate capability to manage tsunami events. This was challenging as no comparable study has been undertaken of other countries’ tsunami risk. We commissioned GNS Science to update their 2005 estimates of tsunami risk to include more recent information on tsunami hazards. We have compared these tsunami risks with other geo-hazards such as earthquakes as well as recurring risks like workplace and vehicle accidents. We used the knowledge of disaster management experts to assess mitigation options for their cost and overall effectiveness in reducing tsunami risk.
The study has identified a number of promising options that appear highly cost-effective and need to be developed into detailed business cases. It also highlights specific options that the Earthquake Commission (EQC) and GNS Science need to consider as part of the development of GeoNet.
Although large tsunami happen infrequently, when they do occur they can cause substantial fatalities and property damage in the zones at risk
New Zealand has a large exposure to tsunami risks but has little direct experience so these risks and the responses required are not widely understood
New Zealanders face a comparatively high annual fatality risk from tsunami but we spend relatively little on mitigation
Particular gaps that need addressing include:
completing evacuation planning so there is national coverage
an improved early warning system for regional-source tsunami (e.g. from the Kermadec Trench) where no effective individual warning mechanism exists and no effective overall official capability is in place
information for decision-makers during any tsunami event
more resilient communications including an effective public messaging system (so people stay evacuated)
There is significant opportunity to cost-effectively reduce this risk by spending on some ‘quick wins’ and promising investment options
These options need to be developed into detailed business cases
Strong leadership will be needed to ensure a range of agencies invest in the tsunami capabilities that New Zealand requires.
NZIER report – Tsunami risk facing New Zealand 2
How big is the tsunami risk facing New Zealand?
New Zealand faces significant tsunami risk but has almost no direct experience so this risk is not widely appreciated.
The geological record suggests New Zealand has experienced multiple large devastating tsunami in the past, and since 1840 there have been about 10 recorded tsunami higher than 4 metres. However there has been only one recorded fatality from a tsunami since European settlement. As a result the size and nature of New Zealand’s tsunami risk is not widely understood and the responses required are not widely appreciated.
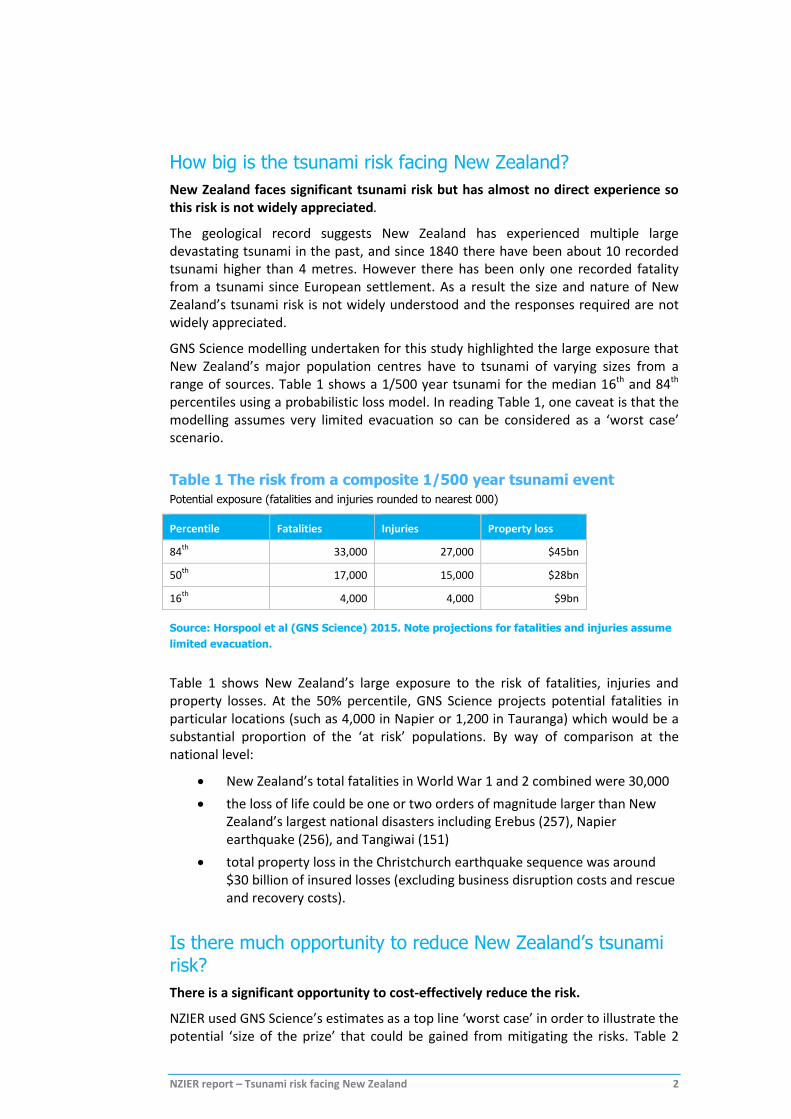
GNS Science modelling undertaken for this study highlighted the large exposure that New Zealand’s major population centres have to tsunami of varying sizes from a range of sources. Table 1 shows a 1/500 year tsunami for the median 16th and 84th percentiles using a probabilistic loss model. In reading Table 1, one caveat is that the modelling assumes very limited evacuation so can be considered as a ‘worst case’ scenario.
Table 1 The risk from a composite 1/500 year tsunami event
Potential exposure (fatalities and injuries rounded to nearest 000)
Percentile Fatalities Injuries Property loss
84th
33,000 27,000 $45bn
50th
17,000 15,000 $28bn
16th
4,000 4,000 $9bn
Source: Horspool et al (GNS Science) 2015. Note projections for fatalities and injuries assume
limited evacuation.
Table 1 shows New Zealand’s large exposure to the risk of fatalities, injuries and property losses. At the 50% percentile, GNS Science projects potential fatalities in particular locations (such as 4,000 in Napier or 1,200 in Tauranga) which would be a substantial proportion of the ‘at risk’ populations. By way of comparison at the national level:
New Zealand’s total fatalities in World War 1 and 2 combined were 30,000
the loss of life could be one or two orders of magnitude larger than New Zealand’s largest national disasters including Erebus (257), Napier earthquake (256), and Tangiwai (151)
total property loss in the Christchurch earthquake sequence was around $30 billion of insured losses (excluding business disruption costs and rescue and recovery costs).
Is there much opportunity to reduce New Zealand’s tsunami risk?
There is a significant opportunity to cost-effectively reduce the risk.
NZIER used GNS Science’s estimates as a top line ‘worst case’ in order to illustrate the potential ‘size of the prize’ that could be gained from mitigating the risks. Table 2
NZIER report – Tsunami risk facing New Zealand 3
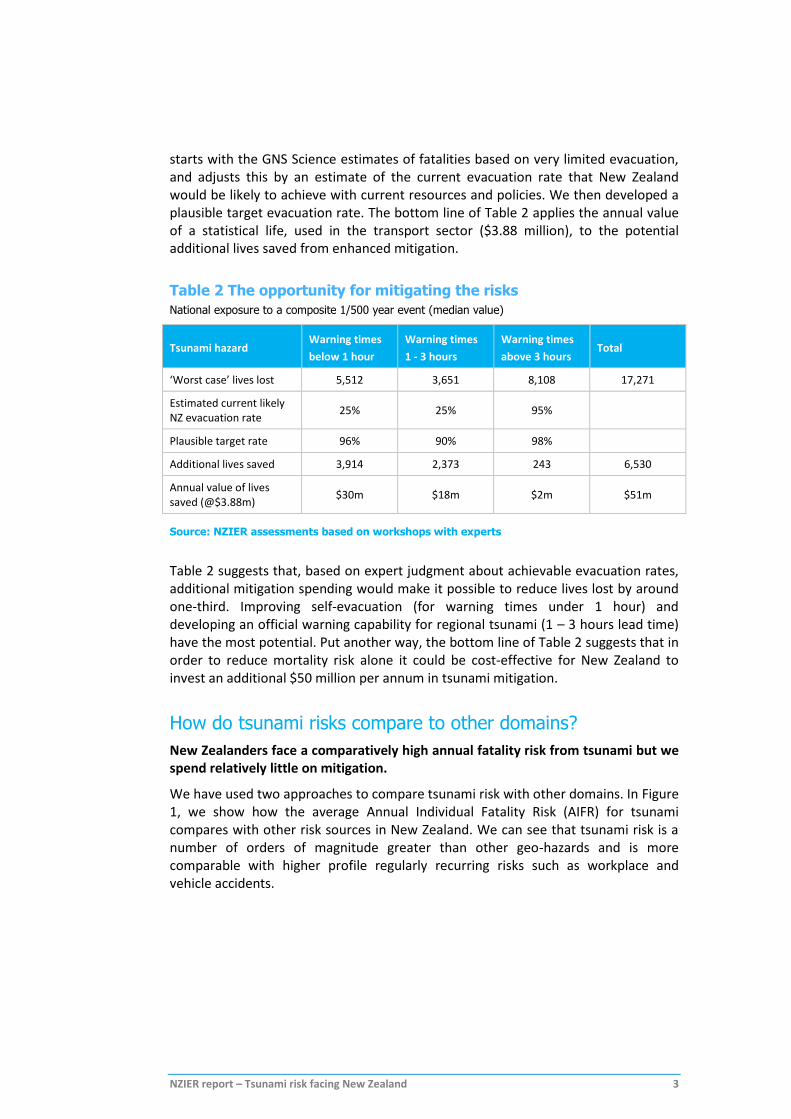
starts with the GNS Science estimates of fatalities based on very limited evacuation, and adjusts this by an estimate of the current evacuation rate that New Zealand would be likely to achieve with current resources and policies. We then developed a plausible target evacuation rate. The bottom line of Table 2 applies the annual value of a statistical life, used in the transport sector ($3.88 million), to the potential additional lives saved from enhanced mitigation.
Table 2 The opportunity for mitigating the risks
National exposure to a composite 1/500 year event (median value)
Tsunami hazard Warning times
below 1 hour
Warning times
1 - 3 hours
Warning times
above 3 hours Total
‘Worst case’ lives lost 5,512 3,651 8,108 17,271
Estimated current likely NZ evacuation rate
25% 25% 95%
Plausible target rate 96% 90% 98%
Additional lives saved 3,914 2,373 243 6,530
Annual value of lives saved (@$3.88m)
$30m $18m $2m $51m
Source: NZIER assessments based on workshops with experts
Table 2 suggests that, based on expert judgment about achievable evacuation rates, additional mitigation spending would make it possible to reduce lives lost by around one-third. Improving self-evacuation (for warning times under 1 hour) and developing an official warning capability for regional tsunami (1 – 3 hours lead time) have the most potential. Put another way, the bottom line of Table 2 suggests that in order to reduce mortality risk alone it could be cost-effective for New Zealand to invest an additional $50 million per annum in tsunami mitigation.
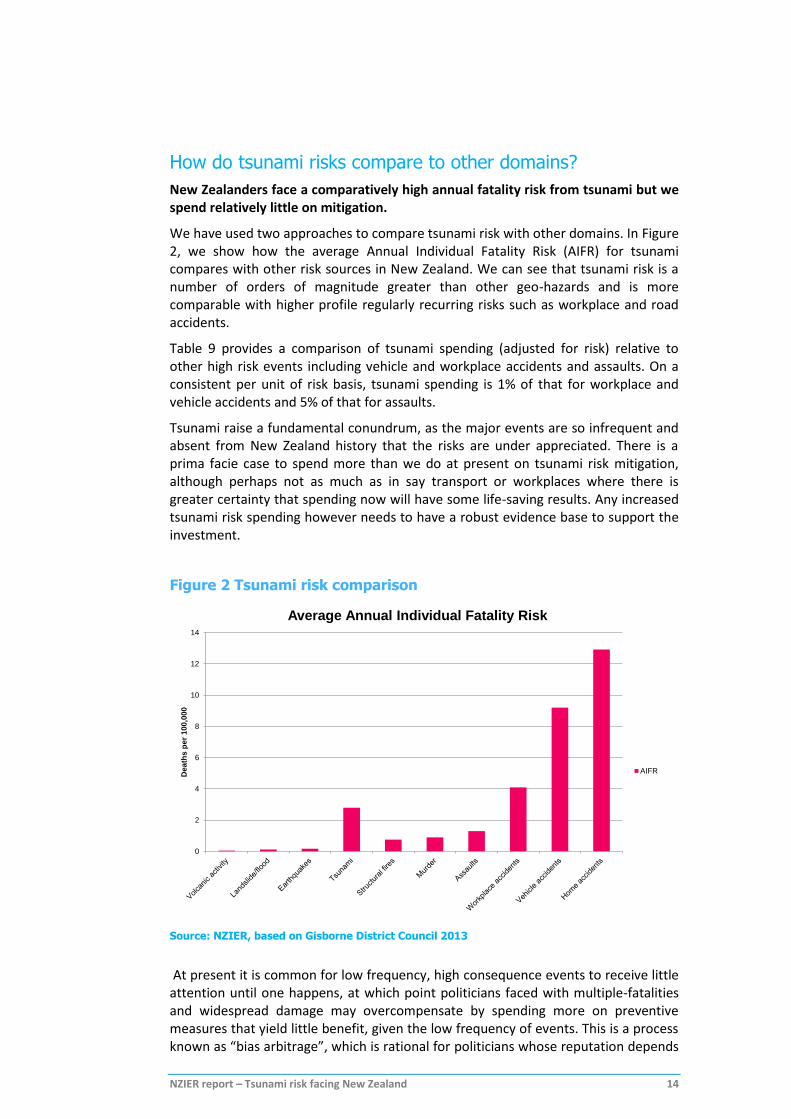
How do tsunami risks compare to other domains?
New Zealanders face a comparatively high annual fatality risk from tsunami but we spend relatively little on mitigation.
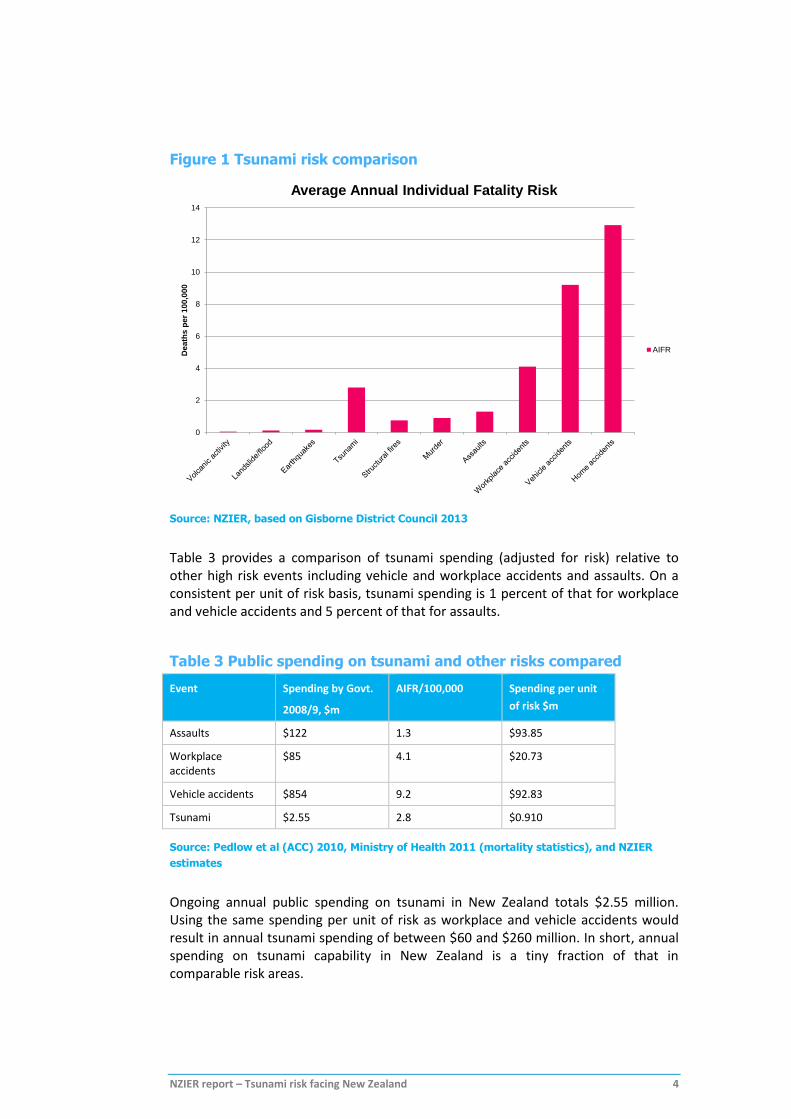
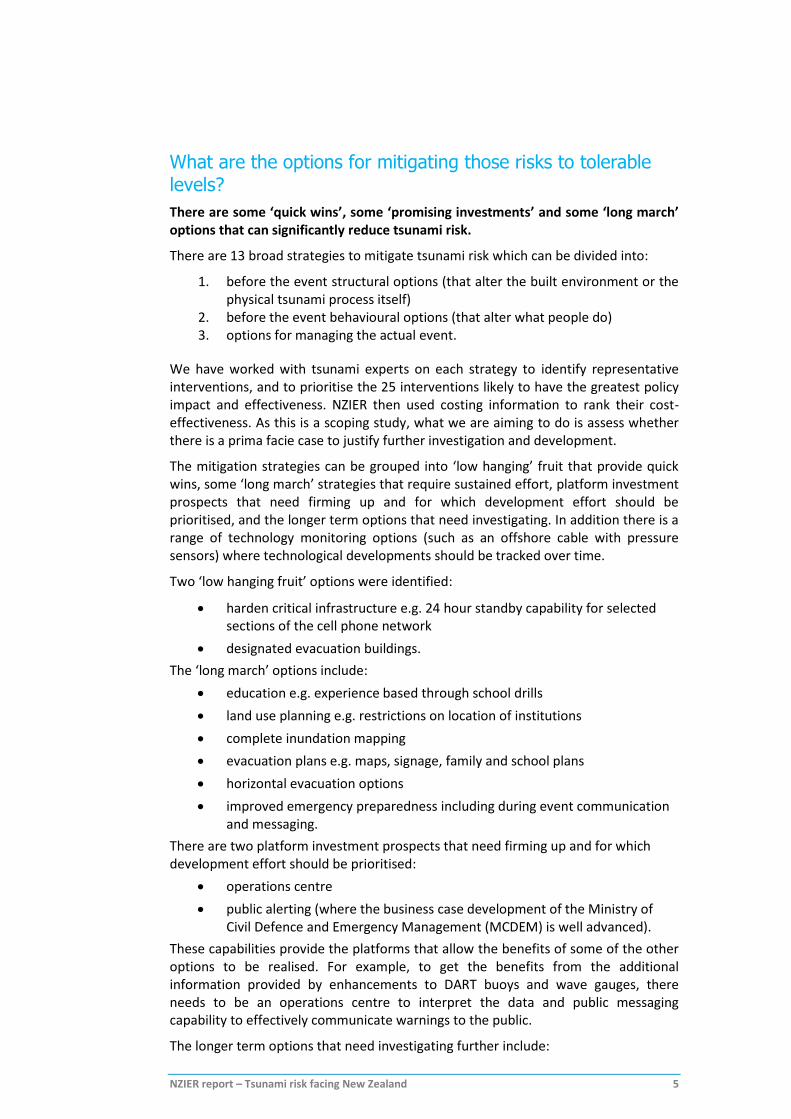
We have used two approaches to compare tsunami risk with other domains. In Figure 1, we show how the average Annual Individual Fatality Risk (AIFR) for tsunami compares with other risk sources in New Zealand. We can see that tsunami risk is a number of orders of magnitude greater than other geo-hazards and is more comparable with higher profile regularly recurring risks such as workplace and vehicle accidents.
NZIER report – Tsunami risk facing New Zealand 4
Figure 1 Tsunami risk comparison
Source: NZIER, based on Gisborne District Council 2013
Table 3 provides a comparison of tsunami spending (adjusted for risk) relative to other high risk events including vehicle and workplace accidents and assaults. On a consistent per unit of risk basis, tsunami spending is 1 percent of that for workplace and vehicle accidents and 5 percent of that for assaults.
Table 3 Public spending on tsunami and other risks compared
Event Spending by Govt.
2008/9, $m
AIFR/100,000 Spending per unit
of risk $m
Assaults $122 1.3 $93.85
Workplace accidents
$85 4.1 $20.73
Vehicle accidents $854 9.2 $92.83
Tsunami $2.55 2.8 $0.910
Source: Pedlow et al (ACC) 2010, Ministry of Health 2011 (mortality statistics), and NZIER
estimates
Ongoing annual public spending on tsunami in New Zealand totals $2.55 million. Using the same spending per unit of risk as workplace and vehicle accidents would result in annual tsunami spending of between $60 and $260 million. In short, annual spending on tsunami capability in New Zealand is a tiny fraction of that in comparable risk areas.
0
2
4
6
8
10
12
14
Death
s p
er
100,0
00
Average Annual Individual Fatality Risk
AIFR
NZIER report – Tsunami risk facing New Zealand 5
What are the options for mitigating those risks to tolerable levels?
There are some ‘quick wins’, some ‘promising investments’ and some ‘long march’ options that can significantly reduce tsunami risk.
There are 13 broad strategies to mitigate tsunami risk which can be divided into:
1. before the event structural options (that alter the built environment or the physical tsunami process itself)
2. before the event behavioural options (that alter what people do) 3. options for managing the actual event.
We have worked with tsunami experts on each strategy to identify representative interventions, and to prioritise the 25 interventions likely to have the greatest policy impact and effectiveness. NZIER then used costing information to rank their cost-effectiveness. As this is a scoping study, what we are aiming to do is assess whether there is a prima facie case to justify further investigation and development.
The mitigation strategies can be grouped into ‘low hanging’ fruit that provide quick wins, some ‘long march’ strategies that require sustained effort, platform investment prospects that need firming up and for which development effort should be prioritised, and the longer term options that need investigating. In addition there is a range of technology monitoring options (such as an offshore cable with pressure sensors) where technological developments should be tracked over time.
Two ‘low hanging fruit’ options were identified:
harden critical infrastructure e.g. 24 hour standby capability for selected sections of the cell phone network
designated evacuation buildings.
The ‘long march’ options include:
education e.g. experience based through school drills
land use planning e.g. restrictions on location of institutions
complete inundation mapping
evacuation plans e.g. maps, signage, family and school plans
horizontal evacuation options
improved emergency preparedness including during event communication and messaging.
There are two platform investment prospects that need firming up and for which development effort should be prioritised:
operations centre
public alerting (where the business case development of the Ministry of Civil Defence and Emergency Management (MCDEM) is well advanced).
These capabilities provide the platforms that allow the benefits of some of the other options to be realised. For example, to get the benefits from the additional information provided by enhancements to DART buoys and wave gauges, there needs to be an operations centre to interpret the data and public messaging capability to effectively communicate warnings to the public.
The longer term options that need investigating further include:
NZIER report – Tsunami risk facing New Zealand 6
wave gauges
better local models and maps
DART buoys
LIDAR in selected locations
integration of land sea data
evacuation towers (specific sites)
lifeline infrastructure redundancy
local seawalls e.g. oil tank farms
strengthening the Building Code for high tsunami risk zones
conditions of building consents.
What does this study suggest for Investment in GeoNet?
Significant investment will be required to upgrade New Zealand’s tsunami capability.
This study has taken a whole of government approach and was focused on the entire range of potential strategies and interventions. Developing tsunami capabilities to match the risk will require sustained effort and investment by a range of players. Strategies and intervention have been identified where GNS Science and EQC will need to be supporting players but other agencies will need to take the lead. Examples of these include evacuation buildings, hardening the cell phone network, Building Code strengthening and building consent requirements. For investment in GeoNet the following warrant further investigation:
an operations centre (including modelling tools and on-shore network improvements)
supporting research on structural matters such as revising building codes, and infrastructure provision that could reduce property damage and associated claims in the event of a tsunami.
As a scoping study we have concentrated on developing and structuring the full range of possible mitigation options. Our approach is analogous to a pre-trial hearing in which the challenge is to establish a prima facie case. Detailed business cases need to be developed before investment decisions can be made. What is clear from this study is that there is a strong a priori case to better develop the tsunami capabilities required to match the risk New Zealand faces.
NZIER report – Tsunami risk facing New Zealand 7
1. Introduction The 2013 GeoNet Panel report made a number of recommendations including:
“Investigate funding options and partners for the establishment of a local tsunami warning capability, partnering with another government agency (such as Maritime NZ Search & Rescue) for a 24/7/365 shared operations centre and enhanced capabilities in earthquake early warning, and offshore monitoring of subduction zone.”
In response to the 2013 GeoNet Project Panel’s review report, EQC commissioned NZIER to undertake a scoping policy analysis which focuses on whether New Zealand has adequate capability to manage tsunami events. This was a path-breaking task as no comparable study of tsunami risk has been undertaken for other countries.
This report defines the size of the tsunami risk that New Zealand faces, the potential capability options available to respond to the risk, and how the possible costs and benefits of the options compare with other domains. It addresses three key questions:
what might be the economic and wider social impact of the risks faced by New Zealand from tsunami?
what are the options for mitigating those risks to tolerable levels?
how do the possible costs and benefits of the options compare with mitigation in other domains?
In essence the focus of this NZIER report is to provide a public policy analysis of the tsunami risk faced by New Zealand. The analysis was primarily based on a synthesis of existing primary research and expert knowledge about the tsunami risk facing New Zealand and the options for mitigation. We adopted a mixed method approach that included:
undertaking a literature scan for New Zealand evidence and relevant studies from comparable jurisdictions
commissioning GNS Science to update their 2005 tsunami risk estimates to include more recent information on tsunami hazards (the results are included in the accompanying GNS report Horspool et al (GNS Science) 2015)
undertaking a range of semi-structured one-on-one interviews with other domain experts
performing a desktop analysis to compare tsunami risks with other geo-hazards such as earthquakes, as well as recurring risks like workplace and vehicle accidents
undertaking a desktop based analysis (augmented by expert judgment) to identify the range of possible mitigation options
using techniques drawn from Threat Barrier Analysis to workshop three scenarios (Appendix C) to assess the potential interventions to the tsunami risk in the scenarios (workshop participants and method are in Appendix B)
NZIER report – Tsunami risk facing New Zealand 8
accessing the knowledge of disaster management experts in an interactive workshop to test and validate the overall conclusions that emerged from the work including assessing the overall effectiveness of mitigation options in reducing tsunami risk.
We were supported by an external consultant (Dr. Terry Webb, formerly of GNS Science) who provided the domain knowledge required to help assess the risks and options. We produced an initial summary report with the key findings which was circulated widely to those involved in the project. Dr. Laura Kong of the International Tsunami Information Centre provided an external review of the initial summary report.
NZIER report – Tsunami risk facing New Zealand 9
2. The tsunami risk facing New Zealand
“The worst tsunami are unannounced killers that can strike suddenly, without warning. New Zealand experience during the last 150 years however is that most are small, but this has not always been the case – at times tsunamis have been large and devastating“ (McFadgen 2007 p. 137).
How big is the tsunami risk facing New Zealand?
New Zealand faces significant tsunami risk but has almost no direct experience so this risk is not widely appreciated.
New Zealand has experienced about 10 tsunami higher than 4 metres since 18401 but there is only one recorded fatality from a tsunami since European settlement.2 Paleo-tsunami studies suggest that New Zealand’s experience over the last 150 years is not typical. At times, such as the 14th century, McFadgen (op. cit.) suggests New Zealand experienced repeated large (above 10 metres) tsunami that had devastating effects on the indigenous Māori population. New Zealand faces significant tsunami risk but New Zealanders have almost no direct experience of tsunami events so the risk and the responses required are not widely appreciated.
GNS Science modelling undertaken for this study highlighted the large potential exposure that New Zealand’s major population centres have to tsunami of different sizes from a range of sources. The full details of the modelling are included in the accompanying paper Horspool et al (GNS Science) 2015.
Table 4 shows a 1/500 year tsunami (1/500 is widely used in risk mitigation such as the New Zealand Loadings Standard for the earthquake resistance of domestic dwellings) for the median 16th and 84th percentiles using a probabilistic loss model.
In reading Table 4 there are two main caveats:
the modelling assumes very limited evacuation so can be considered as a ‘worst case’ scenario
the modelling is for a night-time event when people are assumed to be at home.
Exposure risk may increase during a major daytime event, or seasonally in locations with a concentration of beach use and seaside camping in summer. However, there is no information, from the available studies, that suggests the overall national level of exposure would be dramatically different for a daytime event. GNS Science is completing development of modelling capabilities for daytime events so future studies can address this question.
1 GNS advise that there are eight tsunami where the evidence is clear that the tsunami exceeded 4 metres height and a
further three where it is quite plausible that they exceeded that height in some locations, but direct evidence is lacking.
2 One person drowned in the Chatham Islands as a result of the tsunami from the 1868 Peru earthquake. However, tsunami are reported in Māori oral history and archaeological studies have found clear evidence of tsunami in abandoned settlements. There is also evidence that ‘during the mid-15th century, many Māori moved their settlements from low-lying coastal sites to hilltops and inland sites” (De Lange and McSaveney 2012)
NZIER report – Tsunami risk facing New Zealand 10
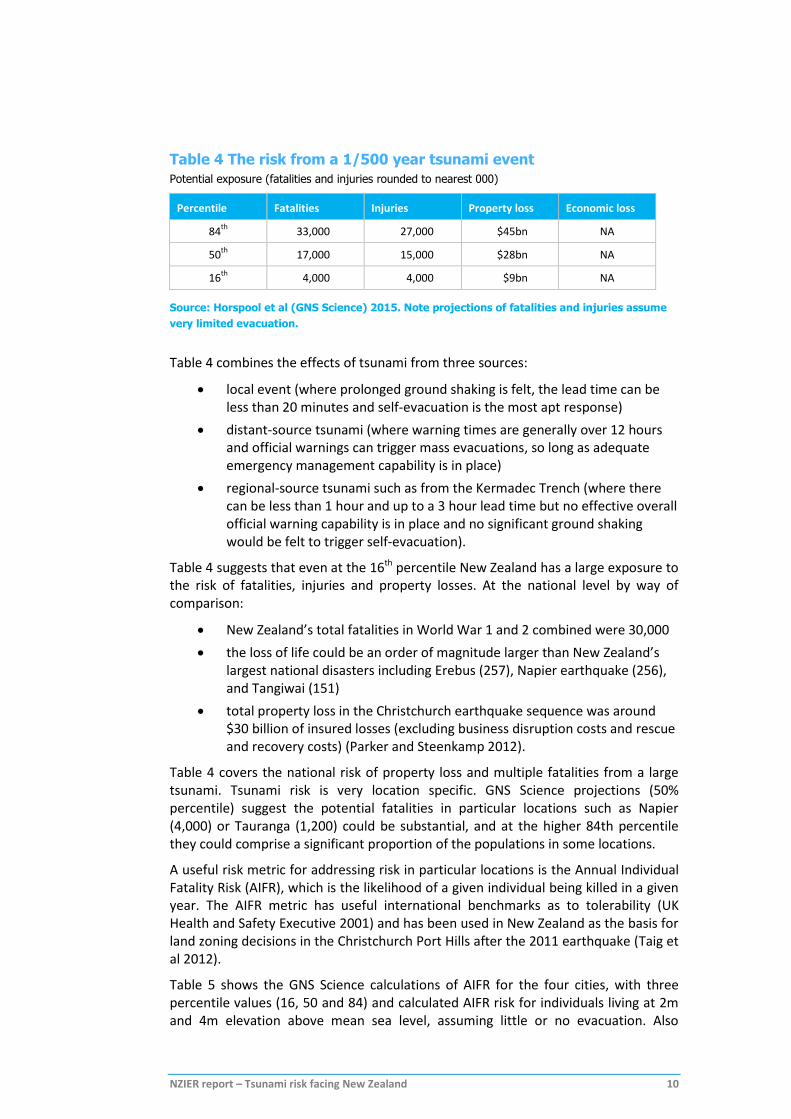
Table 4 The risk from a 1/500 year tsunami event
Potential exposure (fatalities and injuries rounded to nearest 000)
Percentile Fatalities Injuries Property loss Economic loss
84th
33,000 27,000 $45bn NA
50th
17,000 15,000 $28bn NA
16th
4,000 4,000 $9bn NA
Source: Horspool et al (GNS Science) 2015. Note projections of fatalities and injuries assume
very limited evacuation.
Table 4 combines the effects of tsunami from three sources:
local event (where prolonged ground shaking is felt, the lead time can be less than 20 minutes and self-evacuation is the most apt response)
distant-source tsunami (where warning times are generally over 12 hours and official warnings can trigger mass evacuations, so long as adequate emergency management capability is in place)
regional-source tsunami such as from the Kermadec Trench (where there can be less than 1 hour and up to a 3 hour lead time but no effective overall official warning capability is in place and no significant ground shaking would be felt to trigger self-evacuation).
Table 4 suggests that even at the 16th percentile New Zealand has a large exposure to the risk of fatalities, injuries and property losses. At the national level by way of comparison:
New Zealand’s total fatalities in World War 1 and 2 combined were 30,000
the loss of life could be an order of magnitude larger than New Zealand’s largest national disasters including Erebus (257), Napier earthquake (256), and Tangiwai (151)
total property loss in the Christchurch earthquake sequence was around $30 billion of insured losses (excluding business disruption costs and rescue and recovery costs) (Parker and Steenkamp 2012).
Table 4 covers the national risk of property loss and multiple fatalities from a large tsunami. Tsunami risk is very location specific. GNS Science projections (50% percentile) suggest the potential fatalities in particular locations such as Napier (4,000) or Tauranga (1,200) could be substantial, and at the higher 84th percentile they could comprise a significant proportion of the populations in some locations.
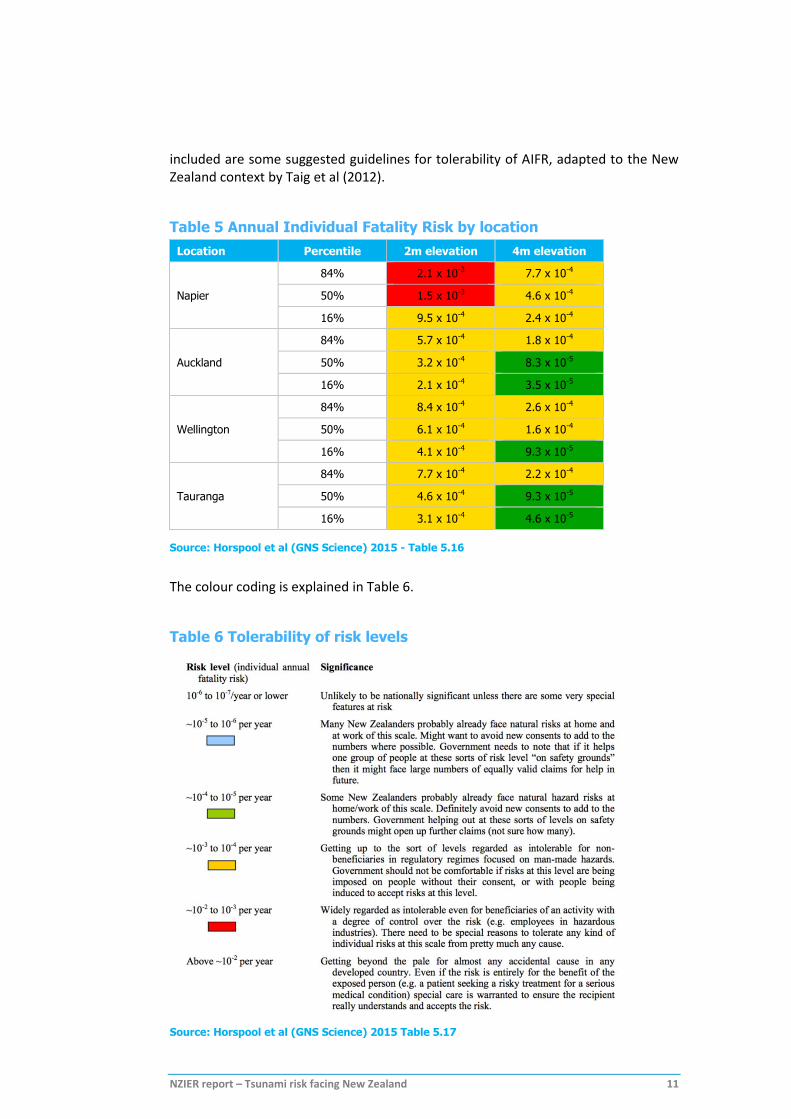
A useful risk metric for addressing risk in particular locations is the Annual Individual Fatality Risk (AIFR), which is the likelihood of a given individual being killed in a given year. The AIFR metric has useful international benchmarks as to tolerability (UK Health and Safety Executive 2001) and has been used in New Zealand as the basis for land zoning decisions in the Christchurch Port Hills after the 2011 earthquake (Taig et al 2012).
Table 5 shows the GNS Science calculations of AIFR for the four cities, with three percentile values (16, 50 and 84) and calculated AIFR risk for individuals living at 2m and 4m elevation above mean sea level, assuming little or no evacuation. Also
NZIER report – Tsunami risk facing New Zealand 11
included are some suggested guidelines for tolerability of AIFR, adapted to the New Zealand context by Taig et al (2012).
Table 5 Annual Individual Fatality Risk by location
Location Percentile 2m elevation 4m elevation
Napier
84% 2.1 x 10⁻³ 7.7 x 10⁻⁴
50% 1.5 x 10⁻³ 4.6 x 10⁻⁴
16% 9.5 x 10⁻⁴ 2.4 x 10⁻⁴
Auckland
84% 5.7 x 10⁻⁴ 1.8 x 10⁻⁴
50% 3.2 x 10⁻⁴ 8.3 x 10⁻⁵
16% 2.1 x 10⁻⁴ 3.5 x 10⁻⁵
Wellington
84% 8.4 x 10⁻⁴ 2.6 x 10⁻⁴
50% 6.1 x 10⁻⁴ 1.6 x 10⁻⁴
16% 4.1 x 10⁻⁴ 9.3 x 10⁻⁵
Tauranga
84% 7.7 x 10⁻⁴ 2.2 x 10⁻⁴
50% 4.6 x 10⁻⁴ 9.3 x 10⁻⁵
16% 3.1 x 10⁻⁴ 4.6 x 10⁻⁵
Source: Horspool et al (GNS Science) 2015 - Table 5.16
The colour coding is explained in Table 6.
Table 6 Tolerability of risk levels
Source: Horspool et al (GNS Science) 2015 Table 5.17
NZIER report – Tsunami risk facing New Zealand 12
Policy decisions will depend on society’s willingness to bear the (very low) probability of (very high) consequences and its willingness to pay (costs) to avert this, and the trade-off will determine the cut-off for precautionary activity. The analysis in this report has been developed to help make a more informed choice about the nature of the trade-off being made.
In applying AIFR as a risk metric, a widely used approach is to treat risk that is beyond an agreed tolerable threshold (e.g. 1x10⁻⁴ in the Port Hills), no matter what the cost. In the face of uncertainties about the risk estimates, the precautionary principle is applied, so the 84th percentile estimates are used. Once the risk is within the tolerable zone, the ‘As Low As Reasonably Practicable’ (ALARP) approach is used, and this is where cost benefit comparisons are a useful guide as to what is an appropriate level of effort and expenditure. The red and orange values in Table 5 are indicative of areas where the risk could be regarded as intolerable, but are based on projections that assume very limited evacuation. In the next section we look at likely evacuation rates, given current arrangements, and then at how New Zealand’s tsunami risk can be further reduced.
Is there much opportunity to reduce New Zealand’s tsunami risk?
There is a significant opportunity to cost-effectively reduce the risk.
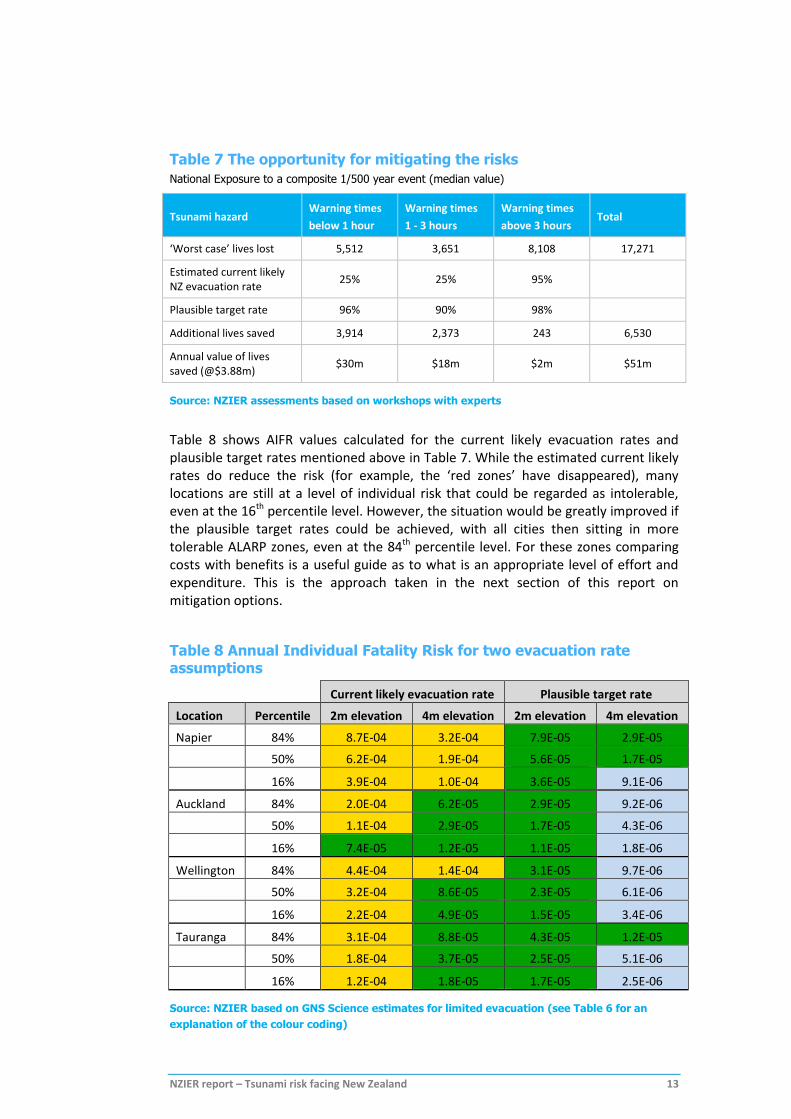
NZIER used GNS Science’s estimates as a top line ‘worst case’ in order to illustrate the potential ‘size of the prize’ that could be gained from mitigating the risks. Table 7 starts with the GNS Science estimates of fatalities based on very limited evacuation, and adjusts this by an estimate of the current evacuation rate that New Zealand would be likely to achieve with current resources and policies. As New Zealand’s tsunami preparedness has not been fully tested over the last 50 years, we then used the experts’ workshop to develop a plausible target evacuation rate.3 The bottom line of Table 7 annualises the value of a statistical life used for public policy appraisals in the transport sector ($3.88 million), and applies it to the potential additional lives saved from enhanced mitigation, to estimate an annual value of additional lives saved if target evacuation rates can be met.
Table 7 shows exposure to Tsunami from a range of sources so it is a composite event not exposure to single event. For more detail on the method used by GNS Science to calculate the ‘worst case’ - see the details in the accompanying GNS report. Table 7 suggests that, based on expert judgment about achievable evacuation rates, additional mitigation spending would make it possible to reduce lives lost by around one-third. Improving self-evacuation (for warning times under 1 hour) and developing an official warning capability for regional tsunami (1 – 3 hours lead time) have the most potential. Put another way, the bottom line of Table 7 suggests that in order to reduce mortality risk alone it could be cost-effective for New Zealand to invest an additional $50 million per annum in tsunami mitigation.
3 Workshop discussions with New Zealand tsunami experts on the evacuation rate included insights from the recent Japan experience where 96% of people who lived in inundated areas survived the Tōhoku tsunami. When New Zealand’s tsunami readiness was tested by the 1960 Chile earthquake it was found wanting (Johnston et al 2008). There has been no actual event since to test how much we have improved since 1960. One indicator of basic levels of preparedness is how much inundation mapping has been prepared. Only two-thirds of the TLAs had completed this mapping to the recommended ‘Level 2’ as at October 2014 (Pearse 2014). There have been several national exercises that focused on the time up to first wave arrival of a distant-source tsunami warning. These exercises tested the official parts of the warning process (detection, warning communication, activation etc.) pre-impact but they did not stretch to the last mile to the community level (e.g. warning communities, evacuating communities) or post first wave impact. Key gaps in knowledge include community preparedness, preparedness for local and regional-source tsunami, and post impact event management.
NZIER report – Tsunami risk facing New Zealand 13
Table 7 The opportunity for mitigating the risks
National Exposure to a composite 1/500 year event (median value)
Tsunami hazard Warning times
below 1 hour
Warning times
1 - 3 hours
Warning times
above 3 hours Total
‘Worst case’ lives lost 5,512 3,651 8,108 17,271
Estimated current likely NZ evacuation rate
25% 25% 95%
Plausible target rate 96% 90% 98%
Additional lives saved 3,914 2,373 243 6,530
Annual value of lives saved (@$3.88m)
$30m $18m $2m $51m
Source: NZIER assessments based on workshops with experts
Table 8 shows AIFR values calculated for the current likely evacuation rates and plausible target rates mentioned above in Table 7. While the estimated current likely rates do reduce the risk (for example, the ‘red zones’ have disappeared), many locations are still at a level of individual risk that could be regarded as intolerable, even at the 16th percentile level. However, the situation would be greatly improved if the plausible target rates could be achieved, with all cities then sitting in more tolerable ALARP zones, even at the 84th percentile level. For these zones comparing costs with benefits is a useful guide as to what is an appropriate level of effort and expenditure. This is the approach taken in the next section of this report on mitigation options.
Table 8 Annual Individual Fatality Risk for two evacuation rate assumptions
Current likely evacuation rate Plausible target rate
Location Percentile 2m elevation 4m elevation 2m elevation 4m elevation
Napier 84% 8.7E-04 3.2E-04 7.9E-05 2.9E-05
50% 6.2E-04 1.9E-04 5.6E-05 1.7E-05
16% 3.9E-04 1.0E-04 3.6E-05 9.1E-06
Auckland 84% 2.0E-04 6.2E-05 2.9E-05 9.2E-06
50% 1.1E-04 2.9E-05 1.7E-05 4.3E-06
16% 7.4E-05 1.2E-05 1.1E-05 1.8E-06
Wellington 84% 4.4E-04 1.4E-04 3.1E-05 9.7E-06
50% 3.2E-04 8.6E-05 2.3E-05 6.1E-06
16% 2.2E-04 4.9E-05 1.5E-05 3.4E-06
Tauranga 84% 3.1E-04 8.8E-05 4.3E-05 1.2E-05
50% 1.8E-04 3.7E-05 2.5E-05 5.1E-06
16% 1.2E-04 1.8E-05 1.7E-05 2.5E-06
Source: NZIER based on GNS Science estimates for limited evacuation (see Table 6 for an
explanation of the colour coding)
NZIER report – Tsunami risk facing New Zealand 14
How do tsunami risks compare to other domains?
New Zealanders face a comparatively high annual fatality risk from tsunami but we spend relatively little on mitigation.
We have used two approaches to compare tsunami risk with other domains. In Figure 2, we show how the average Annual Individual Fatality Risk (AIFR) for tsunami compares with other risk sources in New Zealand. We can see that tsunami risk is a number of orders of magnitude greater than other geo-hazards and is more comparable with higher profile regularly recurring risks such as workplace and road accidents.
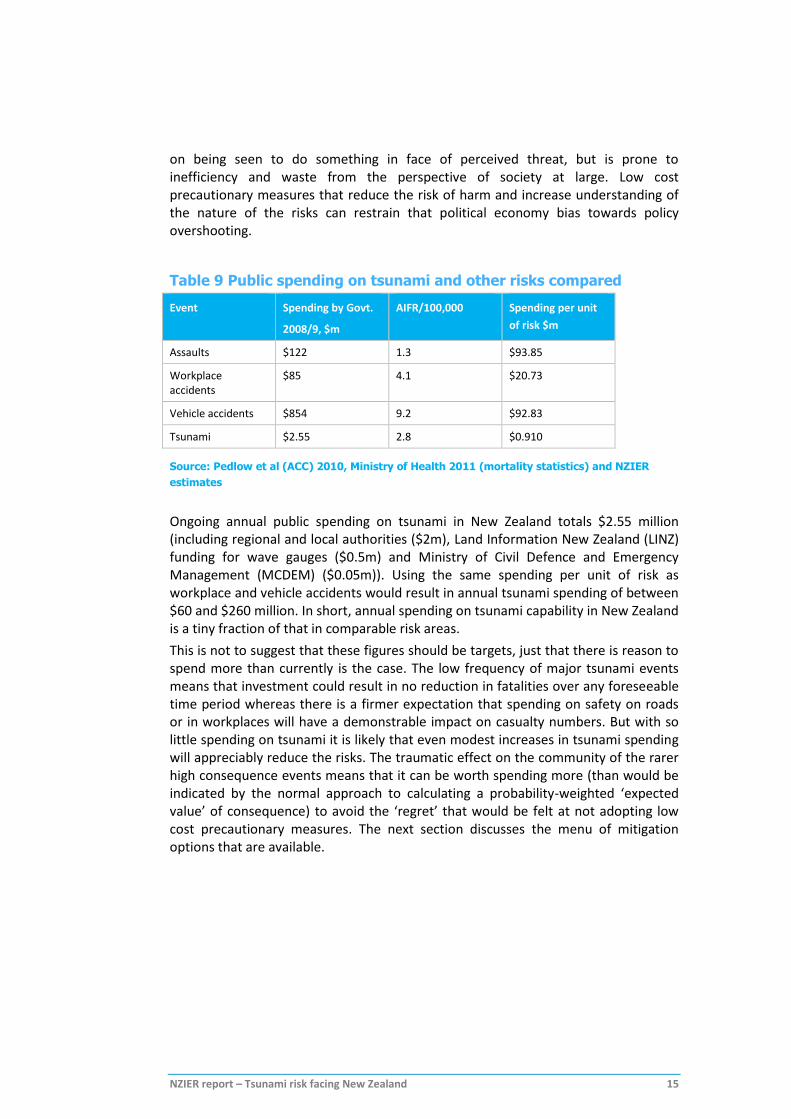
Table 9 provides a comparison of tsunami spending (adjusted for risk) relative to other high risk events including vehicle and workplace accidents and assaults. On a consistent per unit of risk basis, tsunami spending is 1% of that for workplace and vehicle accidents and 5% of that for assaults.
Tsunami raise a fundamental conundrum, as the major events are so infrequent and absent from New Zealand history that the risks are under appreciated. There is a prima facie case to spend more than we do at present on tsunami risk mitigation, although perhaps not as much as in say transport or workplaces where there is greater certainty that spending now will have some life-saving results. Any increased tsunami risk spending however needs to have a robust evidence base to support the investment.
Figure 2 Tsunami risk comparison
Source: NZIER, based on Gisborne District Council 2013
At present it is common for low frequency, high consequence events to receive little attention until one happens, at which point politicians faced with multiple-fatalities and widespread damage may overcompensate by spending more on preventive measures that yield little benefit, given the low frequency of events. This is a process known as “bias arbitrage”, which is rational for politicians whose reputation depends
0
2
4
6
8
10
12
14
De
ath
s p
er
100,0
00
Average Annual Individual Fatality Risk
AIFR
NZIER report – Tsunami risk facing New Zealand 15
on being seen to do something in face of perceived threat, but is prone to inefficiency and waste from the perspective of society at large. Low cost precautionary measures that reduce the risk of harm and increase understanding of the nature of the risks can restrain that political economy bias towards policy overshooting.
Table 9 Public spending on tsunami and other risks compared
Event Spending by Govt.
2008/9, $m
AIFR/100,000 Spending per unit
of risk $m
Assaults $122 1.3 $93.85
Workplace accidents
$85 4.1 $20.73
Vehicle accidents $854 9.2 $92.83
Tsunami $2.55 2.8 $0.910
Source: Pedlow et al (ACC) 2010, Ministry of Health 2011 (mortality statistics) and NZIER
estimates
Ongoing annual public spending on tsunami in New Zealand totals $2.55 million (including regional and local authorities ($2m), Land Information New Zealand (LINZ) funding for wave gauges ($0.5m) and Ministry of Civil Defence and Emergency Management (MCDEM) ($0.05m)). Using the same spending per unit of risk as workplace and vehicle accidents would result in annual tsunami spending of between $60 and $260 million. In short, annual spending on tsunami capability in New Zealand is a tiny fraction of that in comparable risk areas.
This is not to suggest that these figures should be targets, just that there is reason to spend more than currently is the case. The low frequency of major tsunami events means that investment could result in no reduction in fatalities over any foreseeable time period whereas there is a firmer expectation that spending on safety on roads or in workplaces will have a demonstrable impact on casualty numbers. But with so little spending on tsunami it is likely that even modest increases in tsunami spending will appreciably reduce the risks. The traumatic effect on the community of the rarer high consequence events means that it can be worth spending more (than would be indicated by the normal approach to calculating a probability-weighted ‘expected value’ of consequence) to avoid the ‘regret’ that would be felt at not adopting low cost precautionary measures. The next section discusses the menu of mitigation options that are available.
NZIER report – Tsunami risk facing New Zealand 16
3. Tsunami risk mitigation options
The previous section discussed how New Zealand faces significant tsunami risk but New Zealanders have almost no direct experience of tsunami events so the risks and the responses required are not widely appreciated. However, the 2004 Boxing Day tsunami brought into sharp relief the potential scale of loss of life and economic disruption due to tsunami. In short, tsunami is the classic low probability high impact potentially catastrophic risk event.
Tsunami, like other natural disasters, are relatively rare, occur with varying degrees of warning and are the product of relatively unpredictably distributed natural hazards and more predictable exposures and vulnerabilities. This section discusses mitigation options to reduce the hazard.
To paraphrase the World Bank, ‘nature creates hazards, humans create disasters’ (Sanghi et al 2011). The fundamental insight from ‘nature creates hazards, humans create disasters’ is to focus attention on the human actors and the human environment as well as the physical hazard. The outcome from a tsunami event will depend both on the complex interaction of the physical process, the built environment and the multitude of decisions that are taken before and as the event unfolds.4 The actions taken by human communities can change their exposure and vulnerability to natural hazards. The damage from a disaster stemming from hazard events of similar magnitude can vary widely according to the extent of precautionary mitigation actions, the warning time and the disaster management capability in place. There are numerous decision-makers including:
the community – people in households, schools and workplaces deciding to stay, to wait for an official warning or to immediately evacuate
media – both mainstream and the social media which are critical for the messaging that the community receives during the event
lifeline infrastructure providers – in particular telecommunications and also power companies
emergency management agencies – in New Zealand these include Officials Committee for Domestic and External Security Coordination (ODESC), Ministry of Civil Defence & Emergency Management (MCDEM), and regional Civil Defence Emergency Management (CDEM) Groups
emergency response agencies – including the Police, the New Zealand Fire Service, health and ambulance services
businesses – for example, making buildings available for vertical evacuation
regulators – in particular designers of the building code and those engaged in land use planning
information infrastructure providers – for example LINZ with geodetic data.
4 See the GNS Science report (Fraser et al 2012) on lessons from Japan for a discussion of the variation in patterns of response
in different Japanese coastal towns after the 11 March 2011 Tōhoku earthquake and associated tsunami.
NZIER report – Tsunami risk facing New Zealand 17
In addition, international partners, in particular the Intergovernmental Coordination Group for the Pacific Tsunami Warning System (PTWS), have an important role to play.
What are the broad strategies for mitigating tsunami risk?
We have identified thirteen strategies that can be used to mitigate tsunami risk.
There are four main approaches to managing geo-hazard risk:
avoidance
control
acceptance
transfer.
As this report addresses options for mitigation options the focus is on avoidance and control. Mitigation options have a number of dimensions that vary according to the type, timeframe, and players.
The official New Zealand approach to hazard and risk management is the ‘Four Rs’, involving two ex ante and two ex post phases:
Reduction – identifying and analysing long-term risks to human life and property from hazards, and taking steps to eliminate these risks if practicable or, if not, to reduce their likelihood and the magnitude of their consequences
Readiness – developing operational systems and capabilities before an emergency happens, including self-help and response programmes for the public as well as specific programmes for emergency services, lifeline utilities (infrastructure providers) and other agencies
Response – taking action immediately before, during or directly after an emergency to save lives and property, and to help communities recover
Recovery – using coordinated efforts and processes to bring about the immediate, medium-term, and long-term regeneration of a community following an emergency.
If portrayed as a circle this brings out a final phase: the learning from feedback and investment in research, modelling and forecasting to have the information to better inform the planning for the subsequence phases.
In the case of tsunami, where inundation and flooding can occur for several days, the ‘response phase’ spans a diverse range of activities as it includes the whole threat event management chain shown in Figure 3 below, including the crisis management of the actual event. This figure draws out the critical importance of the time taken between the precursor which triggers the event, threat detection (Stage A), decision-making on triggering the alert (Stage B), communicating the warning (Stages C & D) and the time left to take evasive action (Stages E & F) before the critical threshold (such as the arrival of the tsunami) is reached.
NZIER report – Tsunami risk facing New Zealand 18
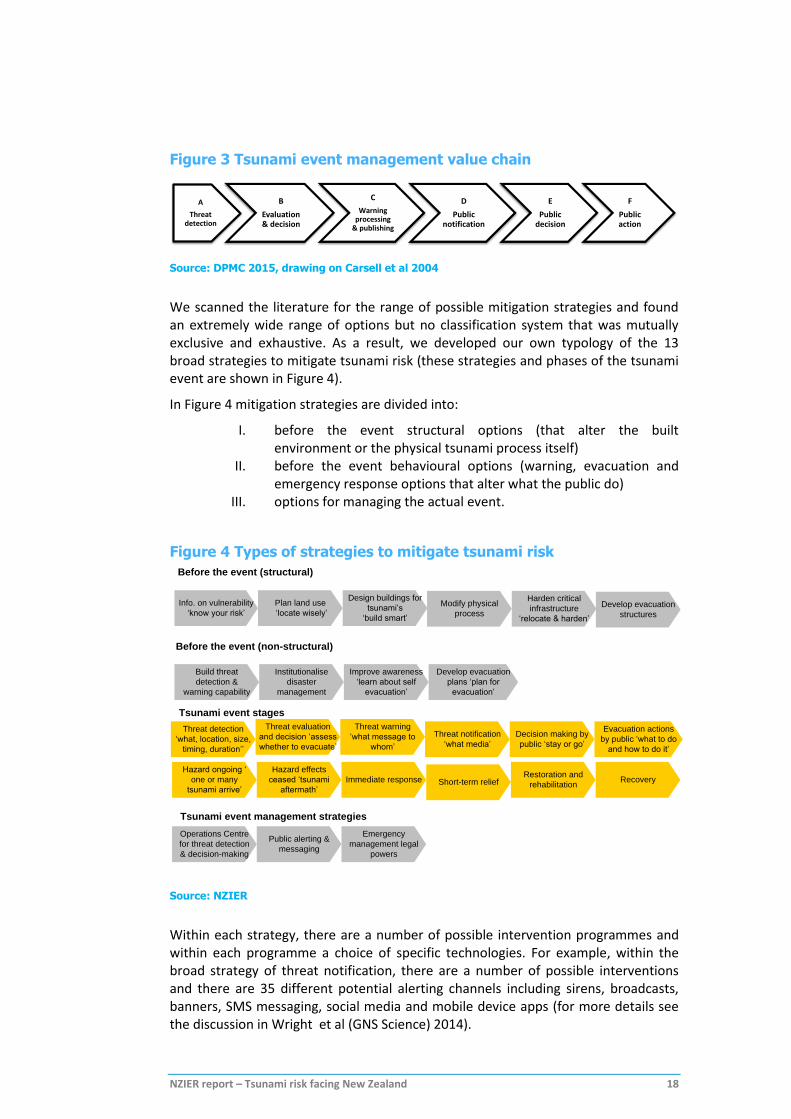
Figure 3 Tsunami event management value chain
Source: DPMC 2015, drawing on Carsell et al 2004
We scanned the literature for the range of possible mitigation strategies and found an extremely wide range of options but no classification system that was mutually exclusive and exhaustive. As a result, we developed our own typology of the 13 broad strategies to mitigate tsunami risk (these strategies and phases of the tsunami event are shown in Figure 4).
In Figure 4 mitigation strategies are divided into:
I. before the event structural options (that alter the built environment or the physical tsunami process itself)
II. before the event behavioural options (warning, evacuation and emergency response options that alter what the public do)
III. options for managing the actual event.
Figure 4 Types of strategies to mitigate tsunami risk
Info. on vulnerability
‘know your risk’
Institutionalise
disaster
management
Plan land use
‘locate wisely’
Design buildings for
tsunami’s
‘build smart’
Modify physical
process
Harden critical
infrastructure
‘relocate & harden’
Improve awareness
‘learn about self
evacuation’
Develop evacuation
plans ‘plan for
evacuation’
Build threat
detection &
warning capability
Before the event (structural)
Tsunami event stages
Before the event (non-structural)
Threat evaluation
and decision ‘assess
whether to evacuate’
Threat warning
‘what message to
whom’
Threat notification
‘what media’
Decision making by
public ‘stay or go’
Evacuation actions
by public ‘what to do
and how to do it’
Hazard effects
ceased ‘tsunami
aftermath’
Immediate response Short-term reliefRestoration and
rehabilitation
Threat detection
‘what, location, size,
timing, duration’’
Hazard ongoing ‘
one or many
tsunami arrive’
Recovery
Tsunami event management strategies
Operations Centre
for threat detection
& decision-making
Public alerting &
messaging
Emergency
management legal
powers
Develop evacuation
structures
Source: NZIER
Within each strategy, there are a number of possible intervention programmes and within each programme a choice of specific technologies. For example, within the broad strategy of threat notification, there are a number of possible interventions and there are 35 different potential alerting channels including sirens, broadcasts, banners, SMS messaging, social media and mobile device apps (for more details see the discussion in Wright et al (GNS Science) 2014).
A
Threat detection
B
Evaluation & decision
C
Warning processing
& publishing
D
Public notification
E
Public decision
F
Public action
NZIER report – Tsunami risk facing New Zealand 19
In this section of the paper we focus on the broad strategies (where applicable citing Eisner et al’s Seven Principles in brackets5) while the subsequent section discusses some of the specific interventions.
Structural options (before the event)
The first and most basic structural strategy is having information on tsunami hazards (Eisner at al’s Principle 1: Know your community’s tsunami risk: hazard, vulnerability, and exposure). This strategy includes building the capability to understand tsunami hazard, risk, vulnerability and exposure based on research, consistent data capture based on an information architecture (geodetics), modelling and forecasting. This information underpins both structural and behavioural options discussed below.
The second strategy is the use of land use planning to minimise development in inundation prone areas based on hazard identification and management (Principle 2: Avoid new development in tsunami run-up areas to minimize future tsunami losses).
The third structural option is the use of building codes and requirements to configure new developments so damage is minimised (Principle 3: Locate and configure new development that occurs in tsunami run-up areas to minimize future tsunami losses).
The fourth is the use of the national Building Code and requirements for new buildings built in inundation prone areas (Principle 4: Design and construct new buildings to minimize tsunami damage). Concrete buildings proved very resilient in the recent Japanese tsunami, relative to wooden buildings.
The fifth is the use of natural barriers to modify the physical process (restoration of sand dunes, re-vegetation (mangroves), and setback of buildings (Principle 5: Protect existing development from tsunami losses through redevelopment, retrofit, and land reuse plans and projects).
The sixth is the use of engineering to modify the physical process (sea walls, barriers).
The seventh is to protect critical infrastructures by locating, designing and retrofitting them to minimise vulnerability to damage (including contingency planning) (Principle 6: Take special precautions in locating and designing infrastructure and critical facilities to minimize tsunami damage).
The eighth is the development of evacuation structures including bespoke vertical evacuation towers, modification to existing structures to provide vertical shelters, or horizontal options (such as bridges).
Behavioural strategies
The previous section discussed structural options that alter the built environment or aim to change the physical tsunami process itself. By contrast, the before the event behavioural option aims to alter what people do.
The first and most basic behavioural strategy is having a threat detection and warning capability to increase the warning time so evasive action can be taken. New
5 Eisner et al (2001) developed seven principles: Principle 1: Know your community’s tsunami risk: hazard, vulnerability, and
exposure, Principle 2: Avoid new development in tsunami run-up areas to minimize future tsunami losses, Principle 3: Locate and configure new development that occurs in tsunami run-up areas to minimize future tsunami losses, Principle 4: Design and construct new buildings to minimize tsunami damage, Principle 5: Protect existing development from tsunami losses through redevelopment, retrofit, and land reuse plans and projects, Principle 6: Take special precautions in locating and designing infrastructure and critical facilities to minimize tsunami damage, Principle 7: Plan for evacuation. This is a good starting list but is not exhaustive as it leaves out structural options such as sea walls and tsunami event management options.
NZIER report – Tsunami risk facing New Zealand 20
Zealand has a limited standby capability – the New Zealand Fire Service call centre provides a basic watch that can trigger setting up an official warning function if required. A fully functional Operations Centre requires real time hazard information, modelling capability to hand and an ability to communicate warnings and information to decision-makers and the general public. So we turn to discussing the other strategies than can be used and capabilities that can be developed.
The second behavioural strategy is having an established disaster management capability. Footnote 4 above discusses how New Zealand’s tsunami preparedness has not been fully tested over the last 50 years but key gaps in our knowledge include community preparedness, preparedness for local and regional-source tsunami, and post arrival event management.
The third behavioural option is the provision of education programmes to increase community and business awareness of tsunami and how to respond to them (e.g. self-evacuation).
The fourth behavioural option is the development of evacuation plans including guidance, signage, evacuation routes, and designated vertical evacuation buildings (Principle 7: Plan for evacuation).
Both the behavioural and structural strategies discussed so far have been approaches before the event. This leaves strategies that are developed to help manage the actual event.
Tsunami event management strategies
Tsunami events can be sustained for 24 hours or more as the event goes through multiple sequences shown in Figure 4. For distant-source tsunami in particular there is a high risk of repeated waves where the first wave is not necessarily the highest. This raises big challenges for the emergency services that will have to standby until the official warning is lifted and it is safe to commence rescue operations from the affected zones.
The basic event management strategy is the development of systems to detect and take decisions on triggering alerts to provide early warning (Stages A & B of the ‘end-to-end’ system shown in Figure 3 above, which runs from threat detection and warning, effective alerting mechanisms through to implementing evacuation plans).
The next is the development of alerting systems which are the focus of a business case currently being developed by MCDEM.
The last is the development of post-disaster emergency legal powers (the power to spend on emergency benefits and relief, the ability to bypass the Resource Management Act in order to dump tsunami waste, etc.).
In addition to mitigation there are also the options of risk acceptance and risk transfer. Risk transfer includes the use of insurance/re-insurance and less conventional products such as insurance linked securities (Catastrophe Bonds). Society has also to make trade-offs between cost and risk which may result in some risk acceptance.
In the rest of this section of the report we explore whether there are cost-effective risk mitigation options that mean there is no need to carry unnecessary risk or pay for unnecessary risk transfer.
NZIER report – Tsunami risk facing New Zealand 21
What are the options for mitigating tsunami risks to tolerable levels?
There are some ‘quick wins’, some ‘promising investments’ and some ‘long march’ options that can significantly reduce tsunami risk.
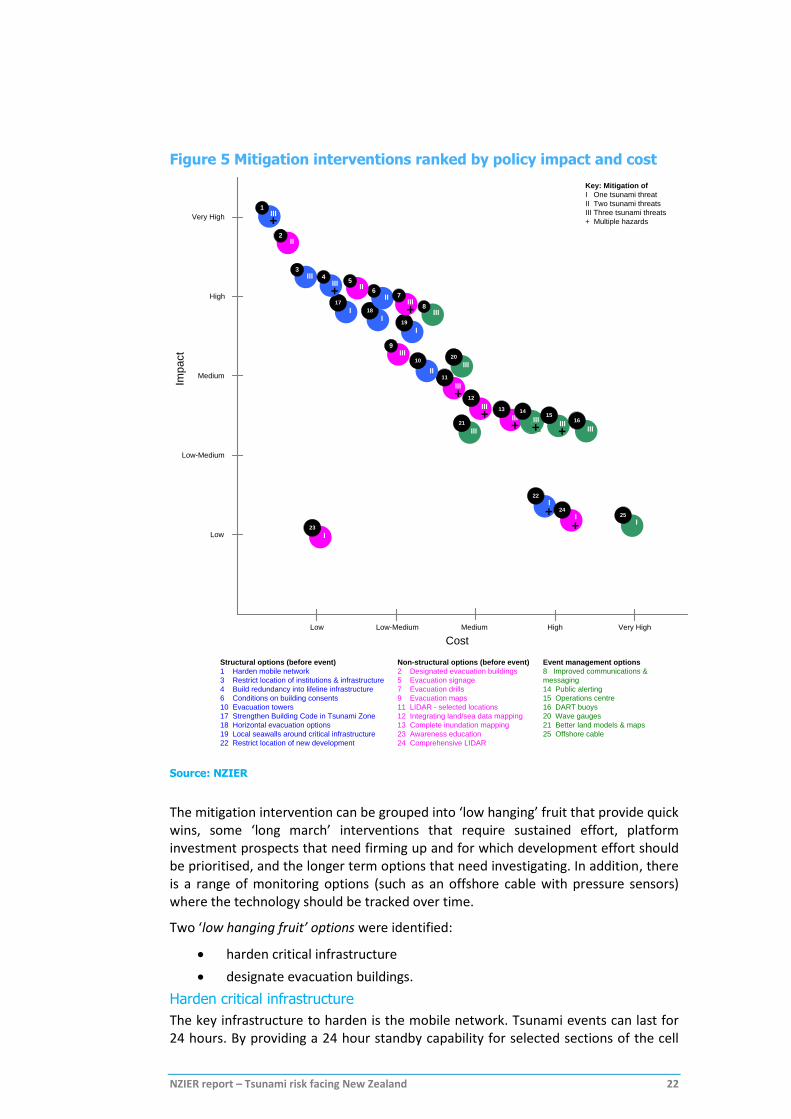
The previous section discussed how there are 13 broad strategies to mitigate tsunami risk. As there is little direct evidence on the effectiveness of individual interventions in reducing Tsunami risk, we used two workshops (discussed in Appendix B) to access the judgements of New Zealand Tsunami experts. We have worked with tsunami experts on each strategy to identify representative interventions, and then conducted two workshops with experts to prioritise the 25 interventions for greatest policy impact and cost effectiveness. Based on the workshops, NZIER assessed each intervention for its effectiveness in achieving three policy outcomes – reduced property losses, economic output loss, and deaths and injuries (shown in Figure 6) – depending upon whether the tsunami was from a local, regional or distant source. We then used whatever costing information was available to rank their cost-effectiveness. As this is a scoping study, what we are aiming to do is assess is whether there is a prima facie case to justify further investigation and development. 6
Figure 5 shows the mitigation options from ‘quick wins’ which are high policy impact and low cost through to less effective options where the impact is lower and the cost is higher. Interventions, such as hardening critical infrastructure and an improved public messaging capability, contribute to reducing risk for all tsunami sources and multiple hazards. Others, such as having designated evacuation buildings, are very effective for local and regional-source tsunami but less so for distant-source tsunami and are of little use for other hazards. (What is not shown is that some options only work well in combination so, for example, an operations centre is needed to get the most from any investment in improved information from DART buoys and wave-gauges).
In Figure 5, the utility in mitigating multiple hazards is shown using a plus sign (+) and the utility in the number of tsunami sources (in terms of warning time category) mitigated is shown using Roman numerals. The overall policy impact was assessed for effectiveness in reducing deaths and injuries (by source – local, regional and distant), reduction of property losses, and economic output loss.
There are three features that are striking about Figure 5:
the best approach will be a hybrid of before the event structural options (shown in blue in Figure 3), behavioural options (pink) and event management options (green), as no one type of strategy is clearly preferred
the options suggest there is a logical cascade from some lower cost high effectiveness options in the top left hand corner of Figure 5 to higher cost lower effectiveness option in the bottom right
the trade-off between society’s willingness to bear the risk of high consequences and its willingness to pay (cost) to avert it will determine the cut-off between the options arrayed from top left to bottom right.
6 At the completion of this study, we came across a report by the UK Royal Society (2014) Resilience to Extreme Weather
which used a similar approach based on expert judgement. We are investigating if funding would be forthcoming to fully replicate the UK study’s expert survey method for tsunami risk in New Zealand
NZIER report – Tsunami risk facing New Zealand 22
Figure 5 Mitigation interventions ranked by policy impact and cost
Cost
Imp
act
Low High
Low
Low-Medium
Medium
High
Very High
Low-Medium Medium Very High
III+
Key: Mitigation of
I One tsunami threat
II Two tsunami threats
III Three tsunami threats
+ Multiple hazards
Structural options (before event)
1 Harden mobile network
3 Restrict location of institutions & infrastructure
4 Build redundancy into lifeline infrastructure
6 Conditions on building consents
10 Evacuation towers
17 Strengthen Building Code in Tsunami Zone
18 Horizontal evacuation options
19 Local seawalls around critical infrastructure
22 Restrict location of new development
Non-structural options (before event)
2 Designated evacuation buildings
5 Evacuation signage
7 Evacuation drills
9 Evacuation maps
11 LIDAR - selected locations
12 Integrating land/sea data mapping
13 Complete inundation mapping
23 Awareness education
24 Comprehensive LIDAR
Event management options
8 Improved communications &
messaging
14 Public alerting
15 Operations centre
16 DART buoys
20 Wave gauges
21 Better land models & maps
25 Offshore cable
19
I
18
I
17
I
23
I
22
I
+ 24
I
+25
I
13
III
+
12
III
+
11
III
+
21
III
8III
3III
6II
4III
+
20
III
14
III
+15
III
+16
III
10
II
9III
7III
+
5II
2II
1III
+
Source: NZIER
The mitigation intervention can be grouped into ‘low hanging’ fruit that provide quick wins, some ‘long march’ interventions that require sustained effort, platform investment prospects that need firming up and for which development effort should be prioritised, and the longer term options that need investigating. In addition, there is a range of monitoring options (such as an offshore cable with pressure sensors) where the technology should be tracked over time.
Two ‘low hanging fruit’ options were identified:
harden critical infrastructure
designate evacuation buildings.
Harden critical infrastructure
The key infrastructure to harden is the mobile network. Tsunami events can last for 24 hours. By providing a 24 hour standby capability for selected sections of the cell
NZIER report – Tsunami risk facing New Zealand 23
phone network, messages can be sent to those who have evacuated to stay evacuated until the official warning is withdrawn. This system resilience would be particularly valuable if the mobile based public messaging system proceeds, as the functionality will assist with managing local, regional and distant-source tsunami events as well as other natural hazards.
Designate evacuation buildings
When there is a large population, warning times are short and higher land is some distance away designated evacuation buildings are particularly effective at enabling evacuation. They have proved very effective in the recent Japanese tsunami when they sheltered (and presumably saved) over 5,400 people (Fraser et al. 2012 (GNS Science Report)).
The ‘long march’ options include:
education e.g. experience based through school drills
land use planning e.g. restrictions on location of institutions
complete inundation mapping
evacuation plans e.g. maps, signage, family and school plans
horizontal evacuation options
improved emergency preparedness including during event communication and messaging.
Education
It is difficult for education awareness programmes to be effective for low probably high risk events such as tsunami as people lack any previous experience of an event of this type, so have a low perception of the risk. We focused on experience-based education such as regular school drills as the most effective approach.
Land use planning
Minimising residential development in inundation prone areas is an easy strategy to state but it is the counsel of perfection as it is very hard to achieve politically. It is difficult to envisage the political will to curtail development adjacent to the coast until New Zealand directly experiences the devastating effects of a major tsunami event. As a result we developed a more limited version which is to restrict the development in tsunami prone areas of any institutions with populations that are hard to evacuate such as prisons, old people homes, and residential health facilities and critical facilities, such as hospitals and fire stations that are needed for response.
Inundation mapping and evacuation planning
All significant sized coastal population centres need to have completed consistent and effective evacuation planning, including mapped escape routes and vertical evacuation where necessary. Currently only two-thirds of the regional councils have completed inundation mapping to a recommended level (‘Level 2’) and it is not known how many have completed evacuation planning or how effective those plans are.
Event communication and messaging
A key part of the effectiveness of tsunami event management will be the effectiveness in managing messaging. The growth of social media has meant it is impossible to manage the messaging by solely relying on official media. Social media do, however, provide an opportunity to improve the reach of public messaging. This
NZIER report – Tsunami risk facing New Zealand 24
requires increased upfront investment in emergency preparedness so that during the event, communication and messaging can be managed adequately.
There are two platform investment prospects that need firming up and for which development effort should be prioritised:
operations centre
public messaging and alerting (where MCDEM’s business case development is well advanced).
An operations centre would allow New Zealand to replace its current limited standby watch capability (the NZ Fire Service call centre) with a 24/7 professionally staffed Tsunami Warning Centre. Capabilities don’t operate in isolation – a fully functional operations centre requires real time hazard information, model runs and models readily to hand and an ability to communicate warnings and information to decision-makers and the general public. Developing a public messaging and alerting capability is being advanced through MCDEM’s business case development process.
These platform capabilities allow the benefits of some of the other options listed below to be realised. For example, to get the benefits from the additional information provided by enhancements to DART buoys and wave gauges, there needs to be an operations centre to interpret the data and public messaging capability to effectively communicate warnings to the public.
Longer term options
The longer term options that need investigating further include:
wave gauges – installing additional gauges to help manage ongoing tsunami events through the provision of more timely information
better local models and maps – to help manage ongoing tsunami events
DART buoys – to improve threat detection and provide official warning for the Kermadec Trench
LIDAR in selected locations – to provide more granular information for high risk locations for evacuation zoning
integration of land and sea data – to be able to model and help manage ongoing tsunami events
evacuation towers in specific localities that are not near high ground
lifeline infrastructure redundancy – particularly for electricity distribution to speed post event recovery
local seawalls – for critical risks such as oil tank farms
strengthening the Building Code – for new construction in high tsunami risk zones, primarily to reduce property loss and speed recovery
conditions of building consents – for example, provision for ready evacuation (perhaps ‘in place’) from institutions.
Four options were assessed as having low effectiveness:
offshore cables and pressure sensors – where the technology is very expensive, but should be tracked over time
general awareness education – where the absence of direct experience of tsunami events reduces the effectiveness of education about the responses required
NZIER report – Tsunami risk facing New Zealand 25
comprehensive national coverage of LIDAR – where a targeted approach to LIDAR was more effective, noting that comprehensive coverage would have many other uses
general restrictions on new property development on exposed coastal locations – where blanket restrictions on development in inundation prone areas is an easy strategy to state but it is the counsel of perfection as it is very hard to achieve politically7 so an intervention targeted at institutions with hard to evacuate populations is more likely to be feasible.
What impact could these options have on outcomes?
Interventions that directly reduce property damage and casualties will also indirectly contribute to reducing social distress and economic loss
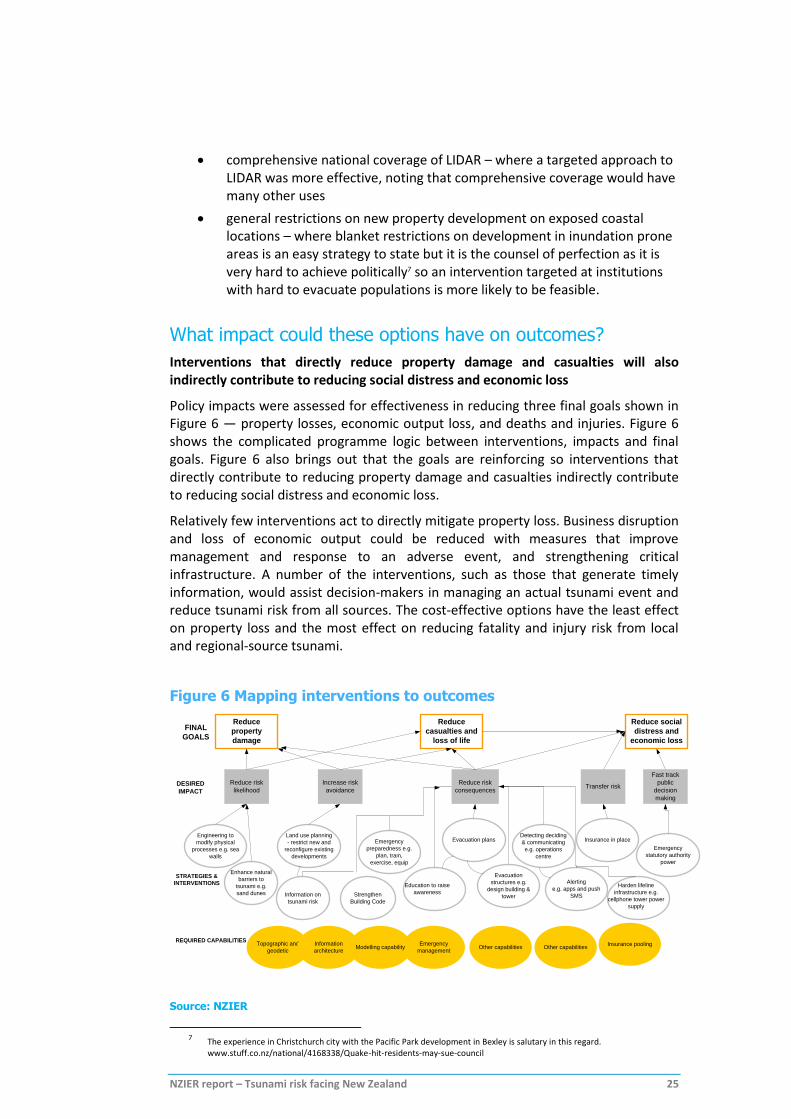
Policy impacts were assessed for effectiveness in reducing three final goals shown in Figure 6 — property losses, economic output loss, and deaths and injuries. Figure 6 shows the complicated programme logic between interventions, impacts and final goals. Figure 6 also brings out that the goals are reinforcing so interventions that directly contribute to reducing property damage and casualties indirectly contribute to reducing social distress and economic loss.
Relatively few interventions act to directly mitigate property loss. Business disruption and loss of economic output could be reduced with measures that improve management and response to an adverse event, and strengthening critical infrastructure. A number of the interventions, such as those that generate timely information, would assist decision-makers in managing an actual tsunami event and reduce tsunami risk from all sources. The cost-effective options have the least effect on property loss and the most effect on reducing fatality and injury risk from local and regional-source tsunami.
Figure 6 Mapping interventions to outcomes
Reduce
property
damage
Reduce
casualties and
loss of life
Reduce social
distress and
economic loss
Reduce risk
likelihood
Increase risk
avoidance
Reduce risk
consequencesTransfer risk
Fast track
public
decision
making
Engineering to
modify physical
processes e.g. sea
walls
Enhance natural
barriers to
tsunami e.g.
sand dunes
Land use planning
- restrict new and
reconfigure existing
developments
Emergency
preparedness e.g.
plan, train,
exercise, equip
Evacuation plans
Evacuation
structures e.g.
design building &
tower
Detecting deciding
& communicating
e.g. operations
centre
Strengthen
Building Code
Insurance in place
Emergency
statutory authority
power
Emergency
management
Topographic and
geodetic
Information
architectureModelling capability
Insurance pooling
FINAL
GOALS
DESIRED
IMPACT
STRATEGIES &
INTERVENTIONS
REQUIRED CAPABILITIES
Alerting
e.g. apps and push
SMS
Other capabilities Other capabilities
Harden lifeline
infrastructure e.g.
cellphone tower power
supply
Education to raise
awarenessInformation on
tsunami risk
Source: NZIER
7 The experience in Christchurch city with the Pacific Park development in Bexley is salutary in this regard.
www.stuff.co.nz/national/4168338/Quake-hit-residents-may-sue-council
NZIER report – Tsunami risk facing New Zealand 26
A key gap is regional-source tsunami (e.g. from the Kermadec Trench) where no effective official system or individual warning mechanism exists. Reducing regional-source tsunami risk would require the combination of a professionally staffed operations centre (supported by modelling tools and more granular information), enhanced public messaging and designation of evacuation buildings.
NZIER report – Tsunami risk facing New Zealand 27
4. Conclusion What issues does this study raise for New Zealand?
Significant investment is required to upgrade New Zealand’s tsunami capability.
Tsunami is a classic ‘ugly’ public policy problem. Damaging tsunami are rare but when they occur the consequences can be devastating. New Zealand faces significant tsunami risk but New Zealanders have almost no direct experience of tsunami events so the risk and the responses required are not widely appreciated. While there is plenty of opportunity for experts to learn from other geo-hazards and other countries’ tsunami experience, there is no opportunity for learning by doing for ordinary New Zealanders.
The outcomes from a tsunami event are hard to predict:
tsunami consequences depend upon the complex physical processes that interact in specific locations in hard to foresee ways
these complex physical processes also interact with the built environment
multiple individual decision-makers would make life and death decisions as the event unfolds, without any previous experience of an event of this type.
Timeframes complicate things further. It can take 4 hours or more from the time of tsunami arrival before it is safe to commence relief operations. The lead times before tsunami arrival vary dramatically depending upon the proximity of the tsunami source:
local event (where prolonged ground shaking is felt, the lead time can be less than 20 minutes and self-evacuation is the most apt response)
distant-source tsunami (where warning times are generally over 12 hours and official warnings can trigger mass evacuations so long as adequate emergency management capability is in place)
regional-source tsunami such as from the Kermadec Trench (where there can be less than 1 hour and up to a 3 hour lead time, but no effective overall official warning capability is in place and no significant ground shaking would be felt to trigger self-evacuation).
No one type of strategy is robust to such different imperatives and timeframes. The public policy responses required will need to be a hybrid mixture of ‘before the event’ structural and behavioural options as well as event management options. For local event tsunami where there are large populations with limited time to self-evacuate, both structural options (vertical evacuations in designated evacuation buildings and towers) and behavioural options (drills) will be required. By contrast, distant-source tsunami provide plenty of time for official warning so long as adequate disaster management capability is in place. The quality of disaster management preparedness for tsunami in New Zealand has not been fully tested and so there significant gaps in our knowledge of community preparedness, preparedness for local and regional-source tsunami, and post arrival event management.
Developing tsunami capabilities to match the risks will require sustained effort and investment by a range of players. This will require a combination of political will, bureaucratic leadership and technical resourcefulness. New Zealand has
NZIER report – Tsunami risk facing New Zealand 28
demonstrated this ability with the development of GeoNet which paid large dividends in the Christchurch Earthquake sequence. A similar commitment is required to develop the tsunami capabilities required.
What does this study suggest for investment in GeoNet?
GNS and GeoNet have an important role to play.
This study has taken a whole of government approach and was focused on the entire range of potential strategies and interventions. Significant investment will be required by a range of agencies to upgrade New Zealand’s tsunami capabilities. Strategies and interventions have been identified where GNS Science and EQC will need to be supporting players but other agencies will need to take the lead. Examples of these include evacuation buildings, hardening the cell phone network, public messaging, Building Code strengthening and building consent requirements.
For future investment in GeoNet the following warrant further investigation:
an operations centre (including modelling tools and on-shore network improvements)
supporting research into, and improving the messaging of, structural matters such as revising building codes, infrastructure provision and land use planning that could reduce property damage and associated claims in the event of a tsunami.
What are the next steps?
Strong leadership will be needed to ensure a range of agencies invest in the tsunami capabilities that New Zealand requires.
As this is a scoping study from a whole of government perspective, we have concentrated on developing and structuring the full range of possible mitigation options and the interventions likely to have the greatest impact and are the most cost effective. Our approach is analogous to a pre-trial hearing in which the challenge is to establish a prima facie case. Detailed business cases need to be developed before investment decisions can be made. The next steps include developing:
the more detailed ‘strategic case’ to demonstrate that there is a compelling case for change for the specific intervention
the ‘economic case’ that optimises the value for money
the ‘commercial case’ that what is proposed is commercially viable
the ‘financial’ case that it is affordable and financially sustainable
the ‘management’ case that it is achievable.
What is clear from this study is that there is a strong a priori case to better develop the range of tsunami capabilities required to match the risks that New Zealand faces. A whole of government approach will be required across a range of agencies to invest in the tsunami capabilities that New Zealand requires.
NZIER report – Tsunami risk facing New Zealand 29
Appendix A References
Carsell, K., N.D. Pingel, and D. Ford. 2004. ‘Quantifying the Benefit of a Flood Warning System’. Natural Hazards Review 5 (3): 131–40. doi:10.1061/(ASCE)1527-6988(2004)5:3(131).
De Lange, W., and E. McSaveney. 2012. ‘Tsunamis - New Zealand’s Tsunami History’. Te Ara - the Encyclopedia of New Zealand. Wellington, N.Z.: Ministry for Culture and Heritage. http://www.teara.govt.nz/en/tsunamis/page-2
DPMC. 2015. Public Alerting System: Indicative Business Case (unpublished Draft Report).
Eisner, R., J.L. Mintier, R. Keller, L.T. Tobin, R.A. Olson, B. Race, and J. Perkins. 2001. Designing for Tsunamis: Seven Principles for Planning and Designing for Tsunami Hazards. National Tsunami Hazard Mitigation Program (NTHMP). http://nthmp-history.pmel.noaa.gov/Designing_for_Tsunamis.pdf
Fraser, S., G.S. Leonard, I. Matsuo, and H. Murakami. 2012. Tsunami Evacuation: Lessons from the Great East Japan Earthquake and Tsunami of March 11th 2011. GNS Science Report 2012/17. Lower Hutt, N.Z.: GNS Science. http://www.massey.ac.nz/massey/fms/Colleges/College%20of%20Humanities%20and%20Social%20Sciences/Psychology/Disasters/pubs/GNS/2012/SR_2012-017.pdf?ED7DA6545D67E526CF08789016B5E9DA
GeoNet Project Panel. 2013. GeoNet Project Panel Review: Sustaining an Innovative Contribution. GeoNet Project Panel. http://info.geonet.org.nz/display/geonet/International+Strategic+Reviews
Gisborne District Council. 2013. Proposed Plan Change 56 - Firefighting Water Supplies Code of Practice. Combined Regional Land and District Plan Section 32 Report. Gisborne, N.Z.: Gisborne District Council. http://www.gdc.govt.nz/assets/CommitteeMeetings/13-042-X1-Appendix.pdf
Horspool, N., W.J. Cousins, and W.L. Power. 2015. Review of Tsunami Risk Facing New Zealand: A 2015 Update. GNS Science Consultancy Report 2015/38. Lower Hutt, N.Z.: GNS Science.
Johnston, D., R. Pettersson, G. Downes, D. Paton, G. Leonard, K. Pishief, and R. Bell. 2008. ‘Developing an Effective Tsunami Warning System: Lessons from the 1960 Chile Earthquake Tsunami for New Zealand Coastal Communities’. Kōtuitui: New Zealand Journal of Social Sciences Online 3 (2): 105–20. doi:10.1080/1177083X.2008.9522436.
McFadgen, B. G. 2007. Hostile Shores : Catastrophic Events in Prehistoric New Zealand and Their Impact on Maori Coastal Communities. Auckland, N.Z.: Auckland University Press.
Ministry of Health. 2011. Mortality and Demographic Data 2008. Wellington, N.Z.: Ministry of Health. http://www.health.govt.nz/system/files/documents/publications/mortality-and-demographic-data-2008.pdf
Parker, M., and D. Steenkamp. 2012. ‘The Economic Impact of the Canterbury Earthquakes’. Reserve Bank of New Zealand Bulletin 75 (3): 13–25.
NZIER report – Tsunami risk facing New Zealand 30
Pearse, L. 2014. Overview of Regional Evacuation Mapping and Planning: Who is Doing What and How Around the Country? Hawke’s Bay Civil Defence Emergency Management Group http://www.civildefence.govt.nz/assets/Uploads/publications/Tsunami-workshop/Lisa-Pearse-Overview-of-Regional-Evacuation-Mapping-and-Planning.pdf
Pedlow, D., C. Proffitt, J. Wren, B.R. Kumar, J. Buchannan, and M. Kelling. 2010. Estimating Government Expenditure on Injury Prevention. Wellington, N.Z.: Accident Compensation Corporation (ACC). http://www.acc.co.nz/PRD_EXT_CSMP/groups/external_ip/documents/guide/wpc133828.pdf
Sanghi, A., A. S. Ramachandran, A. De la Fuente, M. Tonizzo, S. Sahin and B. Adam. 2011. Natural Hazards, Unnatural Disasters : The Economics of Effective Prevention. 57860. Washington DC: The World Bank. http://documents.worldbank.org/curated/en/2010/11/13066374/natural-hazards-unnatural-disasters-economics-effective-prevention.
Taig, T., C. Massey, and T. Webb. 2012. Canterbury Earthquakes 2010/11 Port Hills Slope Stability: Principles and Criteria for the Assessment of Risk from Slope Instability in the Port Hills, Christchurch. GNS Science Consultancy Report 2011/319. Lower Hutt, N.Z.: GNS Science. http://resources.ccc.govt.nz/files/Homeliving/civildefence/chchearthquake/gns_ph_riskassesscriteria12684519.pdf
The Royal Society. 2014. Resilience to Extreme Weather. The Royal Society Science Policy Centre report 02/14, November. London: The Royal Society. https://royalsociety.org/policy/projects/resilience-extreme-weather/
UK Health and Safety Executive. 2001. Reducing risks, protecting people: HSE’s decision-making process. London: Health and Safety Executive. http://www.hse.gov.uk/risk/theory/r2p2.pdf
Wright, K., Leonard, G., Beatson, A. et al. 2014. Public Alerting Options Assessment: 2014 Update. GNS Science Report 2014/66. Lower Hutt, N.Z.: GNS Science
NZIER report – Tsunami risk facing New Zealand 31
Appendix B People and workshops This paper was only possible because of EQC, who commissioned the work, and the willing support and assistance of a range of people who contributed their time, expertise and knowledge. These included:
GNS Science – Ken Gledhill, David Johnson, William Power, Nick Horspool, Graeme Leonard MCDEM – David Coetzee, Sarah Jayne McCurrach, Chris Watson EQC – Richard Smith, Hugh Cowan Treasury NIU – Roger Fairclough NIWA – Rob Bell New Zealand Fire Service – Kenneth Cooper Wellington Regional Council – Bruce Pepperell Dr. Laura Kong – Director, International Tsunami Information Centre Dr. Bruce McFadgen.
In order to test our thinking and develop the options we used two workshops – one to review scenarios and develop interventions and a workshop of domain experts to evaluate the effectiveness of the interventions.
The scenario based workshop used techniques derived from Threat Barrier Analysis, a technique drawn from the engineering literature on risk and reliability. Rather than projecting current known settings and conditions forward, the approach is to work back from a set of discontinuous outcomes to assess the threats and the barriers to those threats that could avoid a loss of control. The scenarios provided a picture of the challenges to be faced and can be used as a frame for developing the specific interventions that could be applied.
We explored three scenarios: Wellington/Napier with a tsunami generated from a local Hikurangi Subduction zone where the warning time is under 30 minutes, a distant-sourced threat for Wellington/Napier/Tauranga where there was a 12 hour plus warning time, Auckland/Tauranga with a regional tsunami from the Kermadec Trench where the warning time was under 2 hours. These scenarios are included as Appendix C.
In the second workshop we used the expertise of the participants to make a judgment about:
the likely current and plausible achievable evacuation rates
the likely relative effectiveness of intervention in reducing casualties and economic loss.
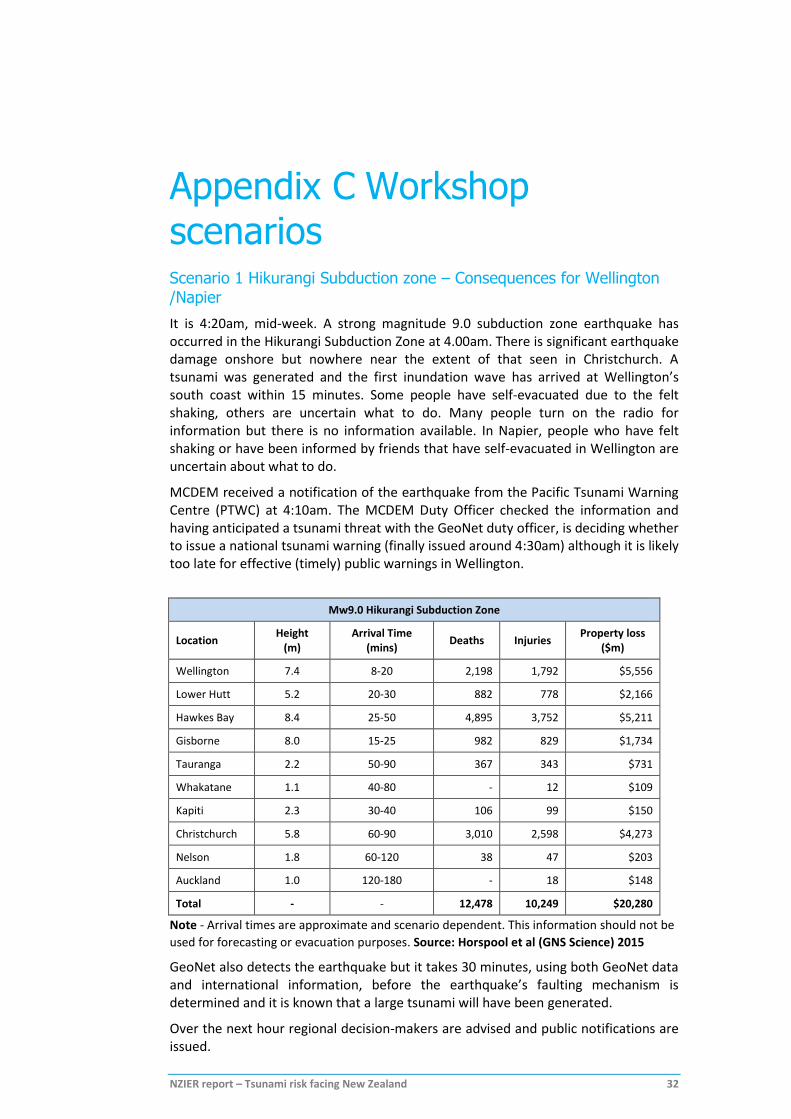
NZIER report – Tsunami risk facing New Zealand 32
Appendix C Workshop scenarios Scenario 1 Hikurangi Subduction zone – Consequences for Wellington /Napier
It is 4:20am, mid-week. A strong magnitude 9.0 subduction zone earthquake has occurred in the Hikurangi Subduction Zone at 4.00am. There is significant earthquake damage onshore but nowhere near the extent of that seen in Christchurch. A tsunami was generated and the first inundation wave has arrived at Wellington’s south coast within 15 minutes. Some people have self-evacuated due to the felt shaking, others are uncertain what to do. Many people turn on the radio for information but there is no information available. In Napier, people who have felt shaking or have been informed by friends that have self-evacuated in Wellington are uncertain about what to do.
MCDEM received a notification of the earthquake from the Pacific Tsunami Warning Centre (PTWC) at 4:10am. The MCDEM Duty Officer checked the information and having anticipated a tsunami threat with the GeoNet duty officer, is deciding whether to issue a national tsunami warning (finally issued around 4:30am) although it is likely too late for effective (timely) public warnings in Wellington.
Mw9.0 Hikurangi Subduction Zone
Location Height
(m) Arrival Time
(mins) Deaths Injuries
Property loss ($m)
Wellington 7.4 8-20 2,198 1,792 $5,556
Lower Hutt 5.2 20-30 882 778 $2,166
Hawkes Bay 8.4 25-50 4,895 3,752 $5,211
Gisborne 8.0 15-25 982 829 $1,734
Tauranga 2.2 50-90 367 343 $731
Whakatane 1.1 40-80 - 12 $109
Kapiti 2.3 30-40 106 99 $150
Christchurch 5.8 60-90 3,010 2,598 $4,273
Nelson 1.8 60-120 38 47 $203
Auckland 1.0 120-180 - 18 $148
Total - - 12,478 10,249 $20,280
Note - Arrival times are approximate and scenario dependent. This information should not be
used for forecasting or evacuation purposes. Source: Horspool et al (GNS Science) 2015
GeoNet also detects the earthquake but it takes 30 minutes, using both GeoNet data and international information, before the earthquake’s faulting mechanism is determined and it is known that a large tsunami will have been generated.
Over the next hour regional decision-makers are advised and public notifications are issued.
NZIER report – Tsunami risk facing New Zealand 33
The maximum wave height at the coast and associated deaths and injuries are shown above. They assume NO evacuation so can be considered a ‘worse case’.
Scenario 2 Distant earthquake – Consequences for Wellington/Napier/Tauranga
Like scenario 1 it is 4:20am, mid-week. A strong magnitude 9.5 earthquake has occurred off Southern Peru, a similar epicentre to the magnitude 9.1 13 August 1868 earthquake, but much larger, so a significant tsunami was generated.
MCDEM received a notification of the earthquake from the Pacific Tsunami Warning Centre (PTWC) at 4:10am. The MCDEM Duty Officer has checked the information and having anticipated tsunami threat with the GeoNet duty officer, is deciding to issue a national tsunami warning (say at 4.30am). The tsunami expert panel is convened and by 7am informs MCDEM that numerical modelling confirms that tsunami wave heights of 6-8m can be expected on Wellington’s south coast.
11 hours later the first waves of the tsunami arrive with tsunami wave heights of up to 6.5m at Wellington’s south coast. Data from Easter Island and DART buoys suggest further waves will be arriving over the next 12 hours.
Scenario 3 MCDEM’s Kermadec Regional Threat – Tauranga/Auckland
Unlike the other scenarios it is 4:00am, mid-week. A strong magnitude 8.9 subduction zone earthquake has occurred in the Kermadec Trench between New Zealand and the Kermadec Islands. A tsunami may have been generated and if so the first inundation is expected at the East Cape within half an hour, in Tauranga in less than 70 minutes, and in Auckland within two and a half hours.
Officials understand 250 people are within tsunami evacuation zones in Tolaga Bay and Gisborne. Some people may self-evacuate due to the felt shaking, while others will be uncertain what to do. Many people turn on the radio for information but there is no information available. Officials understand 107,000 people are within tsunami evacuation zones in the Auckland region. To reach Tauranga and Auckland the earthquake has to pass through the volcanic rocks under the Bay of Plenty which reduces the strength of the shaking with the result that it is generally not felt strongly enough in Tauranga to wake people up. Those that have felt shaking and those that are informed by friends in Gisborne that are self-evacuating are uncertain what to do.
MCDEM will receive a notification of the earthquake from the Pacific Tsunami Warning Centre (PTWC) around 4:10am. Thereafter the standard operating procedure is for the MCDEM Duty Officer to check the information and anticipated tsunami threat with the GeoNet duty officer, resulting in a decision to issue a national tsunami warning (say at 4.30am) although it is likely too late for effective (timely) public warnings in Gisborne or Whakatane. Over the next hour regional decision-makers would be advised and public notifications issued.
The maximum wave heights (at the coast) and associated death and injuries that occur are shown below. They assume NO evacuation, so can be considered a ‘worse case’.
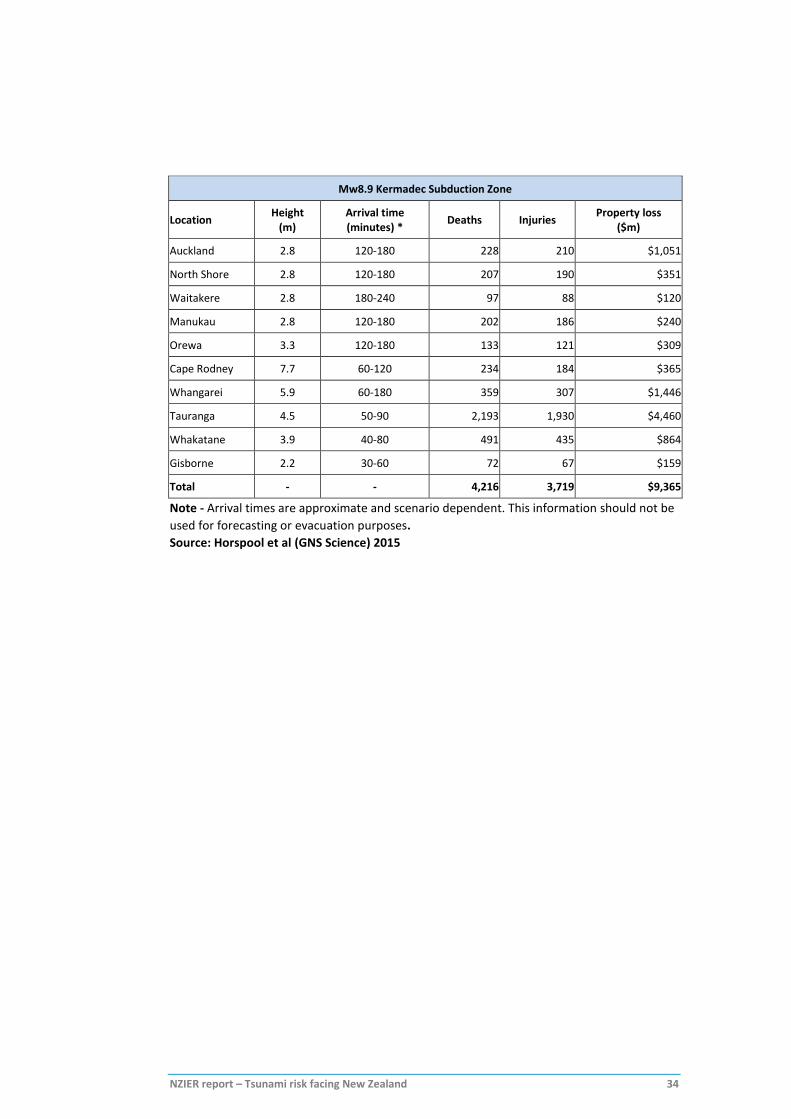
NZIER report – Tsunami risk facing New Zealand 34
Mw8.9 Kermadec Subduction Zone
Location Height (m)
Arrival time (minutes) * Deaths Injuries Property loss
($m)
Auckland 2.8 120-180 228 210 $1,051
North Shore 2.8 120-180 207 190 $351
Waitakere 2.8 180-240 97 88 $120
Manukau 2.8 120-180 202 186 $240
Orewa 3.3 120-180 133 121 $309
Cape Rodney 7.7 60-120 234 184 $365
Whangarei 5.9 60-180 359 307 $1,446
Tauranga 4.5 50-90 2,193 1,930 $4,460
Whakatane 3.9 40-80 491 435 $864
Gisborne 2.2 30-60 72 67 $159
Total - - 4,216 3,719 $9,365
Note - Arrival times are approximate and scenario dependent. This information should not be
used for forecasting or evacuation purposes.
Source: Horspool et al (GNS Science) 2015